User login
Dapagliflozin’s CKD performance sends heart failure messages
The DAPA-CKD trial results, which proved dapagliflozin’s efficacy for slowing chronic kidney disease progression in patients selected for signs of worsening renal function, also have important messages for cardiologists, especially heart failure physicians.

Those messages include findings that were “consistent” with the results of the earlier DAPA-HF trial, which tested the same sodium-glucose transporter 2 (SGLT2) inhibitor in patients selected for having heart failure with reduced ejection fraction (HFrEF). In addition, a specific action of dapagliflozin (Farxiga) on the patients in DAPA-CKD, which enrolled patients based on markers of chronic kidney disease (CKD), was prevention of first and recurrent heart failure hospitalizations, John J.V. McMurray, MD, said at the virtual annual scientific meeting of the Heart Failure Society of America, further highlighting the role that dapagliflozin has in reducing both heart failure and renal events.
What DAPA-CKD means for heart failure
The main findings from the DAPA-CKD trial, published in September in the New England Journal of Medicine, included as a secondary outcome the combined rate of death from cardiovascular causes or hospitalization for heart failure (HHF). Treatment with dapagliflozin linked with a significant 29% relative reduction in this endpoint, compared with placebo-treated patients. At the HFSA meeting, Dr. McMurray reported for the first time the specific HHF numbers, a prespecified secondary endpoint for the study.
Patients on dapagliflozin had 37 total HHF events (1.7%), including both first-time and subsequent hospitalizations, while patients in the placebo arm had a total of 71 HHF events (3.3%) during the study’s median 2.4 years of follow-up, an absolute reduction of 1.6% that translated into a relative risk reduction of 49%.
The HHF findings from DAPA-CKD importantly showed that SGLT2 inhibition in patients with signs of renal dysfunction “will not only slow progression of kidney disease but will also reduce the risk of developing heart failure, crucially in patients with or without type 2 diabetes,” explained Dr. McMurray in an interview. “Cardiologists often consult in the kidney wards and advise on management of patients with chronic kidney disease, even those without heart failure.”
The DAPA-CKD findings carry another important message for heart failure management regarding the minimum level of renal function a patient can have and still safely receive dapagliflozin or possibly another agent from the same SGLT2 inhibitor class. In DAPA-CKD, patients safely received dapagliflozin with an estimated glomerular filtration rate (eGFR) as low as 25 mL/min per 1.73 m2; 14% of enrolled patients had an eGFR of 25-29 mL/min per 1.73 m2.
“Typically, about 40%-50% of patients with heart failure have chronic kidney disease,” which makes this safety finding important to clinicians who care for heart failure patients, but it’s also important for any patient who might be a candidate for dapagliflozin or another drug from its class. “We had no strong evidence before this trial that SGLT2 inhibition could reduce hard renal endpoints,” specifically need for chronic dialysis, renal transplant, or renal death, “in patients with or without diabetes,” Dr. McMurray said.
DAPA-CKD grows the pool of eligible heart failure patients
A further consequence of the DAPA-CKD findings is that when, as expected, regulatory bodies give dapagliflozin an indication for treating the types of CKD patients enrolled in the trial, it will functionally expand this treatment to an even larger swath of heart failure patients who currently don’t qualify for this treatment, specifically patients with CKD who also have heart failure with preserved ejection fraction (HFpEF). On Oct. 2, 2020, the Food and Drug Administration fast-tracked dapagliflozin for the CKD indication by granting it Breakthrough Therapy Designation based on the DAPA-CKD results.
Results first reported in 2019 from the DAPA-HF trial led to dapagliflozin receiving a labeled indication for treating HFrEF, the types of heart failure patients enrolled in the trial. Direct evidence on the efficacy of SGLT2 inhibitors for patients with HFpEF will not be available until results from a few trials now in progress become available during the next 12 months.
In the meantime, nearly half of patients with HFpEF also have CKD, noted Dr. McMurray, and another large portion of HFpEF patients have type 2 diabetes and hence qualify for SGLT2 inhibitor treatment that way. “Obviously, we would like to know specifically about heart failure outcomes in patients with HFpEF” on SGLT2 inhibitor treatment, he acknowledged. But the recent approval of dapagliflozin for patients with HFrEF and the likely indication coming soon for treating CKD means that the number of patients with heart failure who are not eligible for SGLT2 inhibitor treatment is dwindling down to some extent.
New DAPA-HF results show no drug, device interactions
In a separate session at the HFSA virtual meeting, Dr. McMurray and several collaborators on the DAPA-HF trial presented results from some new analyses. Dr. McMurray looked at the impact of dapagliflozin treatment on the primary endpoint when patients were stratified by the diuretic dosage they received at study entry. The results showed that “the benefits from dapagliflozin were irrespective of the use of background diuretic therapy or the diuretic dose,” he reported. Study findings also showed that roughly three-quarters of patients in the study had no change in their diuretic dosage during the course of the trial, that the fraction of patients who had an increase in their dosage was about the same as those whose diuretic dosage decreased, and that this pattern was similar in both the patients on dapagliflozin and in those randomized to placebo.
Another set of new analyses from DAPA-HF looked at the impact on dapagliflozin efficacy of background medical and device therapies for heart failure, as well as background diabetes therapies. The findings showed no signal of an interaction with background therapies. “The effects of dapagliflozin are incremental and complimentary to conventional therapies for HFrEF,” concluded Lars Kober, MD, a professor and heart failure physician at Copenhagen University Hospital.
DAPA-CKD was funded by AstraZeneca, the company that markets dapagliflozin (Farxiga). Dr. McMurray’s employer, Glasgow University, has received payments from AstraZeneca and several other companies to compensate for his time overseeing various clinical trials. Dr. Kober has received honoraria for speaking on behalf of several companies including AstraZeneca.
The DAPA-CKD trial results, which proved dapagliflozin’s efficacy for slowing chronic kidney disease progression in patients selected for signs of worsening renal function, also have important messages for cardiologists, especially heart failure physicians.
Those messages include findings that were “consistent” with the results of the earlier DAPA-HF trial, which tested the same sodium-glucose transporter 2 (SGLT2) inhibitor in patients selected for having heart failure with reduced ejection fraction (HFrEF). In addition, a specific action of dapagliflozin (Farxiga) on the patients in DAPA-CKD, which enrolled patients based on markers of chronic kidney disease (CKD), was prevention of first and recurrent heart failure hospitalizations, John J.V. McMurray, MD, said at the virtual annual scientific meeting of the Heart Failure Society of America, further highlighting the role that dapagliflozin has in reducing both heart failure and renal events.
What DAPA-CKD means for heart failure
The main findings from the DAPA-CKD trial, published in September in the New England Journal of Medicine, included as a secondary outcome the combined rate of death from cardiovascular causes or hospitalization for heart failure (HHF). Treatment with dapagliflozin linked with a significant 29% relative reduction in this endpoint, compared with placebo-treated patients. At the HFSA meeting, Dr. McMurray reported for the first time the specific HHF numbers, a prespecified secondary endpoint for the study.
Patients on dapagliflozin had 37 total HHF events (1.7%), including both first-time and subsequent hospitalizations, while patients in the placebo arm had a total of 71 HHF events (3.3%) during the study’s median 2.4 years of follow-up, an absolute reduction of 1.6% that translated into a relative risk reduction of 49%.
The HHF findings from DAPA-CKD importantly showed that SGLT2 inhibition in patients with signs of renal dysfunction “will not only slow progression of kidney disease but will also reduce the risk of developing heart failure, crucially in patients with or without type 2 diabetes,” explained Dr. McMurray in an interview. “Cardiologists often consult in the kidney wards and advise on management of patients with chronic kidney disease, even those without heart failure.”
The DAPA-CKD findings carry another important message for heart failure management regarding the minimum level of renal function a patient can have and still safely receive dapagliflozin or possibly another agent from the same SGLT2 inhibitor class. In DAPA-CKD, patients safely received dapagliflozin with an estimated glomerular filtration rate (eGFR) as low as 25 mL/min per 1.73 m2; 14% of enrolled patients had an eGFR of 25-29 mL/min per 1.73 m2.
“Typically, about 40%-50% of patients with heart failure have chronic kidney disease,” which makes this safety finding important to clinicians who care for heart failure patients, but it’s also important for any patient who might be a candidate for dapagliflozin or another drug from its class. “We had no strong evidence before this trial that SGLT2 inhibition could reduce hard renal endpoints,” specifically need for chronic dialysis, renal transplant, or renal death, “in patients with or without diabetes,” Dr. McMurray said.
DAPA-CKD grows the pool of eligible heart failure patients
A further consequence of the DAPA-CKD findings is that when, as expected, regulatory bodies give dapagliflozin an indication for treating the types of CKD patients enrolled in the trial, it will functionally expand this treatment to an even larger swath of heart failure patients who currently don’t qualify for this treatment, specifically patients with CKD who also have heart failure with preserved ejection fraction (HFpEF). On Oct. 2, 2020, the Food and Drug Administration fast-tracked dapagliflozin for the CKD indication by granting it Breakthrough Therapy Designation based on the DAPA-CKD results.
Results first reported in 2019 from the DAPA-HF trial led to dapagliflozin receiving a labeled indication for treating HFrEF, the types of heart failure patients enrolled in the trial. Direct evidence on the efficacy of SGLT2 inhibitors for patients with HFpEF will not be available until results from a few trials now in progress become available during the next 12 months.
In the meantime, nearly half of patients with HFpEF also have CKD, noted Dr. McMurray, and another large portion of HFpEF patients have type 2 diabetes and hence qualify for SGLT2 inhibitor treatment that way. “Obviously, we would like to know specifically about heart failure outcomes in patients with HFpEF” on SGLT2 inhibitor treatment, he acknowledged. But the recent approval of dapagliflozin for patients with HFrEF and the likely indication coming soon for treating CKD means that the number of patients with heart failure who are not eligible for SGLT2 inhibitor treatment is dwindling down to some extent.
New DAPA-HF results show no drug, device interactions
In a separate session at the HFSA virtual meeting, Dr. McMurray and several collaborators on the DAPA-HF trial presented results from some new analyses. Dr. McMurray looked at the impact of dapagliflozin treatment on the primary endpoint when patients were stratified by the diuretic dosage they received at study entry. The results showed that “the benefits from dapagliflozin were irrespective of the use of background diuretic therapy or the diuretic dose,” he reported. Study findings also showed that roughly three-quarters of patients in the study had no change in their diuretic dosage during the course of the trial, that the fraction of patients who had an increase in their dosage was about the same as those whose diuretic dosage decreased, and that this pattern was similar in both the patients on dapagliflozin and in those randomized to placebo.
Another set of new analyses from DAPA-HF looked at the impact on dapagliflozin efficacy of background medical and device therapies for heart failure, as well as background diabetes therapies. The findings showed no signal of an interaction with background therapies. “The effects of dapagliflozin are incremental and complimentary to conventional therapies for HFrEF,” concluded Lars Kober, MD, a professor and heart failure physician at Copenhagen University Hospital.
DAPA-CKD was funded by AstraZeneca, the company that markets dapagliflozin (Farxiga). Dr. McMurray’s employer, Glasgow University, has received payments from AstraZeneca and several other companies to compensate for his time overseeing various clinical trials. Dr. Kober has received honoraria for speaking on behalf of several companies including AstraZeneca.
FROM HFSA 2020
Perceived Barriers and Facilitators of Clozapine Use: A National Survey of Veterans Affairs Prescribers (FULL)
Clozapine is an atypical antipsychotic that the US Food and Drug Administration (FDA) approved for use in schizophrenia and suicidality associated with schizophrenia or schizoaffective disorder. Clozapine has been shown to be superior to other antipsychotic treatment for treatment resistant schizophrenia (TRS), which is defined as failure of 2 adequate trials of antipsychotic therapy.1 Up to 30% of patients with schizophrenia are classified as treatment resistant.2
Clozapine is considered the drug of choice for patients with TRS in both the US Department of Veterans Affairs (VA) policies and other evidence-based guidelines and remains the only antipsychotic with FDA approval for TRS.2-5 Patients treated with clozapine have fewer psychiatric hospitalizations, fewer suicide attempts, lower rates of nonadherence, and less antipsychotic polypharmacy compared with patients who are treated with other antipsychotic therapy.6,7 A 2016 study by Gören and colleagues found that in addition to the clinical benefits, there is the potential for cost savings of $22,000 for each veteran switched to and treated with clozapine for 1 year even when accounting for the cost of monitoring and potential adverse event management.8 This translates to a total savings of > $80 million if current utilization were doubled and half of those patients continued treatment for 1 year within the Veterans Health Administration (VHA). However, despite evidence supporting use, < 10% of Medicaid-eligible patients and only 4% of patients with schizophrenia in the VHA are prescribed clozapine.8,9
Clozapine is underutilized for a variety of reasons, including intensive monitoring requirements, potential for severe adverse drug reactions, and concern for patient adherence.8 Common adverse effects (AEs) can range from mild to severe and include weight gain, constipation, sedation, orthostatic hypotension, and excessive salivation. Clozapine also carries a boxed warning for agranulocytosis, seizures, myocarditis, other cardiovascular and respiratory AEs (including orthostatic hypotension), and increased mortality in elderly patients with dementia.
Severe agranulocytosis occurs in between 0.05% and 0.86% of patients, which led the FDA to implement a Risk Evaluation and Mitigation Strategy (REMS) program for clozapine prescribing in 2015. Prior to the REMS program, each of the 6 clozapine manufacturers were required to maintain a registry to monitor for agranulocytosis. Per the REMS program requirements, health care providers (HCPs), dispensing pharmacies, and patients must be enrolled in the program and provide an updated absolute neutrophil count (ANC) prior to prescribing or dispensing clozapine. This is potentially time consuming, particularly during the first 6 months of treatment when the ANC must be monitored weekly and prescriptions are restricted to a 7-day supply. With recent changes to the REMS program, pharmacists are no longer permitted to enroll patients in the REMS system. This adds to the administrative burden on HCPs and may decrease further the likelihood of prescribing clozapine due to lack of time for these tasks. Within the VHA, a separate entity, the VA National Clozapine Coordinating Center (NCCC), reduces the administrative burden on HCPs by monitoring laboratory values, controlling dispensing, and communicating data electronically to the FDA REMS program.10
Despite the various administrative and clinical barriers and facilitators to prescribing that exist, previous studies have found that certain organizational characteristics also may influence clozapine prescribing rates. Gören and colleagues found that utilization at VHA facilities ranged from < 5% to about 20% of patients with schizophrenia. In this study, facilities with higher utilization of clozapine were more likely to have integrated nonphysician psychiatric providers in clinics and to have clear organizational structure and processes for the treatment of severe mental illness, while facilities with lower utilization rates were less likely to have a point person for clozapine management.11
Although many national efforts have been made to increase clozapine use in recent years, no study has examined HCP perception of barriers and facilitators of clozapine use in the VHA. The objective of this study is to identify barriers and facilitators of clozapine use within the VHA as perceived by HCPs so that these may be addressed to increase appropriate utilization of clozapine in veterans with TRS.
Methods
This study was conducted as a national survey of mental health providers within the VHA who had a scope of practice that allowed clozapine prescribing. Any HCP in a solely administrative role was excluded. The survey tool was reviewed by clinical pharmacy specialists at the Lexington VA Health Care System for content and ease of administration. Following appropriate institutional review board approval, the survey was submitted to the organizational assessment subcommittee and the 5 national VA unions for approval per VA policy. The survey tool was built and administered through REDCap (Nashville, Tennessee) software. An electronic link was sent out to the national VA psychiatric pharmacist and national psychiatry chief listservs for dissemination to the psychiatric providers at each facility with weekly reminders sent out during the 4-week study period to maximize participation. The 29-item survey was developed to assess demographic information, HCP characteristics, perceived barriers and facilitators of clozapine use, and general clozapine knowledge. Knowledge-based questions included appropriate indications, starting dose, baseline ANC requirement, ANC monitoring requirements, and possible AEs.
Primary outcomes assessed were perceived barriers to clozapine prescribing, opinions of potential interventions to facilitate clozapine prescribing, knowledge regarding clozapine, and the impact of medication management clinics on clozapine prescribing. For the purposes of this study, a clozapine clinic was defined as an interdisciplinary team dedicated to clozapine prescribing and monitoring.
Secondary outcomes included a comparison of clozapine prescribing rates among different subgroups of HCPs. Subgroups included HCP discipline, geographic region, presence of academic affiliation, level of comfort or familiarity with clozapine, and percentage of time spent in direct patient care. The regional Veterans Integrated Service Networks (VISN) were used to evaluate the effect of geographic region on prescribing practices.
Results of the survey were analyzed using descriptive statistics. The Mann-Whitney U test was utilized to compare ordinal data from questions that were scored on a Likert scale, and nominal data was compared utilizing the χ2 test. For all objectives, an α of < .05 was considered significant.
Results
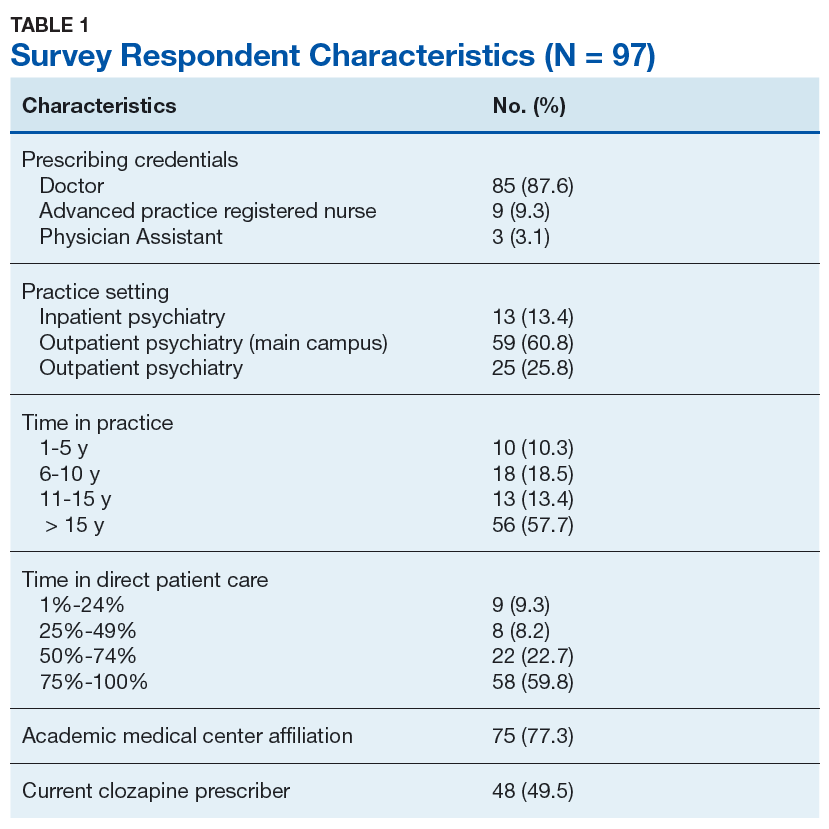
Ninety-eight HCPs from 17 VISNs responded during the 4-week survey period. One participant was excluded due to a solely administrative role. HCP characteristics and demographics are described in Table 1. The majority of respondents practice in an outpatient mental health setting either at the main VA campus or at a community-based outpatient clinic (CBOC).
Primary Outcomes
Perceived Barriers to Prescribing
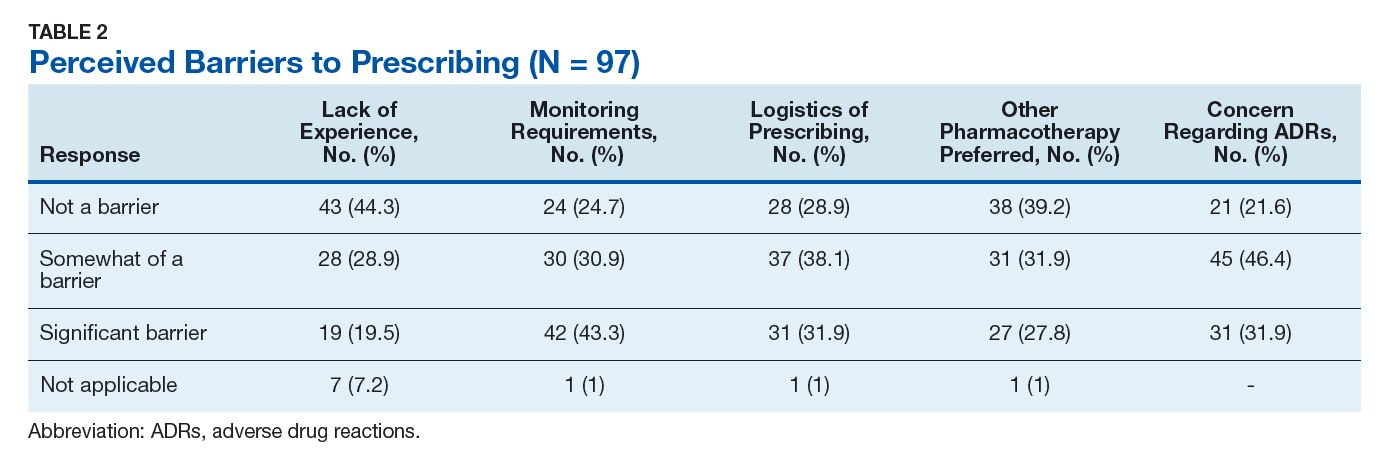
The majority of survey respondents rated all factors listed as at least somewhat of a barrier to prescribing. Table 2 describes the perception of these various factors as barriers to clozapine prescribing. Along with prespecified variables, a free text box was available to participants to identify other perceived barriers not listed. Among other concerns listed in this text box were patient buy-in (11.3%), process/coordination of prescribing (8.2%), time restrictions (7.2%), prescriber restrictions (7.2%), access (3.1%), credentialing problems (2.1%), and lack of clear education materials (1%).
Perceived Facilitators to Prescribing
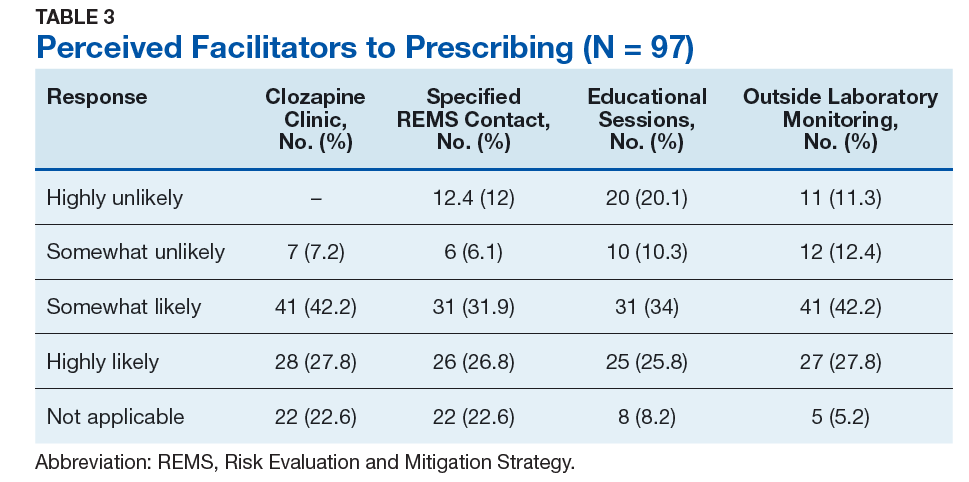
When asked to consider the potential for increased prescribing with various interventions, most participants reported that all identified facilitators would be at least somewhat likely to increase their clozapine utilization. Table 3 describes the perception of these various factors as facilitators to clozapine prescribing. Other identified facilitators included nursing or pharmacy support for follow-ups (4.1%), advanced practice registered nurse credentialing for VHA prescribing (3.1%), utilization of national REMS program without the NCCC (3.1%), outside pharmacy use during titration phase (2.1%), prespecified coverage for HCPs while on leave (1%), and increased access to specialty consults for AEs (1%).
Clozapine Knowledge Assessment
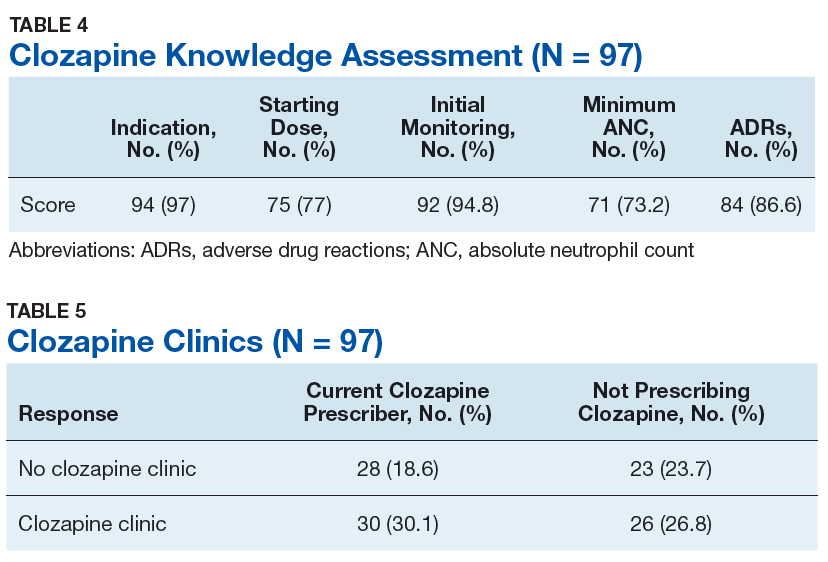
Overall, the average score on the clozapine knowledge assessment portion of the survey was 85.6%. The most commonly missed questions concerned the minimum ANC required to initiate clozapine and the appropriate starting dose for clozapine (Table 4). No significant difference was seen in clozapine utilization based on the clozapine knowledge assessment score when HCPs who scored≤ 60% were compared with those who scored ≥ 80% (P = .29).
Clozapine Clinic
No statistically significant difference was found (P = .35) when rates of prescribing between facilities with or without a dedicated clozapine clinic were compared (Table 5). Additionally, the involvement of a pharmacist in clozapine management clinics did not lead to a statistically significant difference in utilization rates (P = .45).
Secondary Outcomes
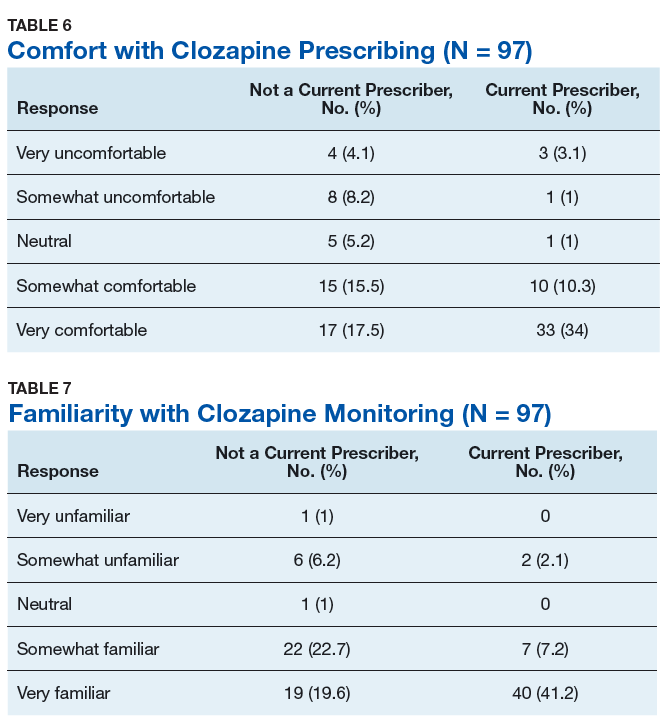
Self-rated level of comfort with clozapine prescribing was significantly associated with rates of clozapine prescribing (P < .01). HCPs who rated themselves as somewhat or very comfortable were significantly more likely to prescribe clozapine (Table 6). Providers who rated themselves as very familiar with clozapine monitoring requirements (Table 7) were significantly more likely to prescribe clozapine (P < .01). This significance remained when comparing HCPs who rated themselves as very familiar to those who ranked themselves as somewhat familiar (P = .01). There was no statistically significant difference in clozapine prescribing based on academic medical center affiliation, time spent in direct patient care, or geographic location.
Discussion
This survey targeted VHA HCPs who were licensed to prescribe clozapine to identify barriers and facilitators of use, along with HCP characteristics that may impact clozapine utilization. The findings of this study indicate that even though HCPs may perceive many legitimate barriers to clozapine prescribing, such as the frequent laboratory monitoring requirements, some factors may increase their willingness to prescribe clozapine. Many of these facilitators involve addressing logistical concerns and the administrative burden that accompanies clozapine use. These findings echo previous studies done within and outside the VHA.8,9
While some identified barriers would require national policy changes to address, others could be addressed at VHA facilities. It may be prudent for each VA facility to identify a HCP who is familiar with clozapine to serve as a subject matter expert. This would be beneficial to those HCPs who feel their patients may benefit from clozapine, but who lack experience in prescribing, or for those with concerns about appropriateness of a specific patient. Additionally, this point of contact could be a valuable resource for concerns regarding administrative issues that may arise with the laboratory reporting system. In some facilities, it may be beneficial to set aside dedicated prescriber time in a clinic designed for clozapine management. Many HCPs in this survey identified the establishment of a clozapine clinic as an intervention that would increase their likelihood of prescribing clozapine. This type of clinic may alleviate some of the concerns regarding appointment availability for weekly or bimonthly appointments early in therapy by having additional staff and time dedicated to accommodating the need for frequent visits.
The majority of respondents to this survey were concerned about the logistics of clozapine monitoring and prescribing; however, this is largely dictated by FDA and VHA policies and regulations. Per national guidance, patients within the VHA should only receive prescriptions for clozapine from their local VA facility pharmacy. It takes many veterans ≥ 1 hour to travel to the closest VA hospital or CBOC. This is especially true for facilities with largely rural catchments. These patients often lack many resources that may be present in more urban areas, such as reliable public transportation. This creates challenges for both weekly laboratory monitoring and dispensing of weekly clozapine prescriptions early in therapy. The option to get clozapine from a local non-VA pharmacy and complete laboratory monitoring at a non-VA laboratory facility could make a clozapine trial more feasible for these veterans. Another consideration is increasing the availability of VA-funded transportation for these patients to assist them in getting to their appointments. Serious mental illness case workers or mental health intensive case management services also may prove useful in arranging for transportation for laboratory monitoring.
Providers with higher self-rated comfort and familiarity with monitoring requirements had a significantly increased likelihood of clozapine utilization. Lack of experience was commonly identified as a barrier to prescribing. Subsequently, the majority of respondents felt that educational sessions would increase their likelihood to prescribe clozapine. This could be addressed at both a facility and national level. As discussed above, a subject matter expert at each facility could provide some of this education and guidance for prescribers who have little or no experience with clozapine. Additionally, national educational presentations and academic detailing campaigns may be an efficient way to provide standardized education across the VHA. Dissemination of required education via the VA Talent Management System is another potential route that would ensure all providers received adequate training regarding the specific challenges of prescribing clozapine within the VA.
Strengths and Limitations
The strengths of this study lie in directly assessing HCP perceptions of barriers and facilitators. It is ultimately up to each individual HCP to decide to use clozapine. Addressing the concerns of these HCPs will be advantageous in efforts to increase clozapine utilization. Additionally, to the authors’ knowledge this is the first study to assess provider characteristics and knowledge of clozapine in relation to utilization rates.
The method of distribution was a major limitation of this study. This survey was distributed via national e-mail listservs; however, no listserv exists within the VA that targets all psychiatric providers. This study relied on the psychiatry chiefs and psychiatric pharmacists within each facility to further disseminate the survey, which could have led to lower response rates than what may be gathered via more direct contact methods. In addition, targeting psychiatric section chiefs and pharmacists may have introduced response bias. Another limitation to this study was the small number of responses. It is possible that this study was not adequately powered to detect significant differences in clozapine prescribing based on HCP characteristics or clozapine clinic availability. Further studies investigating the impact of provider characteristics on clozapine utilization are warranted.
Conclusion
Even though clozapine is an effective medication for TRS, providers underutilize it for a variety of reasons. Commonly identified barriers to prescribing in this study included frequent monitoring requirements, logistics of prescribing (including the REMS program and transportation for laboratory monitoring), pharmacotherapy preferences, and concern about the potential AEs. Facilitators identified in this study included implementation of clozapine clinics, having a specified contact point within the facility to assist with administrative responsibility, educational sessions, and the ability to utilize outside laboratories.
While some of these barriers and facilitators cannot be fully addressed without national policy change, individual facilities should make every effort to identify institution-specific concerns and address these. Clozapine clinic implementation and educational sessions appear to be reasonable considerations. This study did not identify any HCP characteristics that significantly impacted the likelihood of prescribing clozapine aside from self-rated comfort and familiarity with clozapine. However, further studies are needed to fully assess the impact of provider characteristics on clozapine utilization.
1. Siskind D, Mccartney L, Goldschlager R, Kisely S. Clozapine v. first- and second-generation antipsychotics in treatment-refractory schizophrenia: systematic review and meta-analysis. Br J Psychiatry. 2016;209(5):385-392.
2. Lehman A, Lieberman JA, Dixon LB, et al; American Psychiatric Association; Steering Committee on Practice Guidelines. Practice guidelines for the treatment of patients with schizophrenia, second edition. Am J Psychiatry. 2004;161(2 suppl):1-56.
3. US Department of Veterans Affairs. Recommendations for antipsychotic selection in schizophrenia and schizoaffective disorders. https://www.pbm.va.gov/PBM/clinicalguidance/clinicalrecommendations/AntipsychoticSelectionAlgorithmSchizophreniaJune2012.doc. Published June 2012. Accessed September 12, 2019.
4. Dixon L, Perkins D, Calmes C. Guidelines watch (September 2009): practice guidelines for the treatment of patients with schizophrenia. https://psychiatryonline.org/pb/assets/raw/sitewide/practice_guidelines/guidelines/schizophrenia-watch.pdf. Published September 2009. Accessed September 12, 2019.
5. National Institute for Health and Care Excellence. Psychosis and schizophrenia in adults: prevention and management. https://www.nice.org.uk/guidance/cg178. Updated March 2014. Accessed September 12, 2019.
6. Meltzer HY, Alphs L, Green AI, et al; International Suicide Prevention Trial Study Group. Clozapine treatment for suicidality in schizophrenia: International Suicide Prevention Trial (InterSePT). Arch Gen Psychiatry. 2003;60(1):82-91.
7. Stroup TS, Gerhard T, Crystal S, Huang C, Olfson M. Comparative effectiveness of clozapine and standard antipsychotic treatment in adults with schizophrenia. Am J Psychiatry. 2016;173(2):166-173.
8. Gören JL, Rose AJ, Smith EG, Ney JP. The business case for expanded clozapine utilization. Psychiatr Serv. 2016;67(11):1197-1205.
9. Kelly DL, Freudenreich O, Sayer MA, Love RC. Addressing barriers to clozapine underutilization: a national effort. Psychiatr Serv. 2018;69(2):224-227.
10. US Department of Veterans Affairs. Clozapine patient management protocol (CPMP). https://www.va.gov/vhapublications/ViewPublication.asp?pub_ID=1818. Published December 23, 2008. Accessed September 12, 2019.
11. Gören JL, Rose AJ, Engle RL, et al. Organizational characteristics of Veterans Affairs clinics with high and low utilization of clozapine. Psychiatr Serv. 2016;67(11):1189-1196.
Clozapine is an atypical antipsychotic that the US Food and Drug Administration (FDA) approved for use in schizophrenia and suicidality associated with schizophrenia or schizoaffective disorder. Clozapine has been shown to be superior to other antipsychotic treatment for treatment resistant schizophrenia (TRS), which is defined as failure of 2 adequate trials of antipsychotic therapy.1 Up to 30% of patients with schizophrenia are classified as treatment resistant.2
Clozapine is considered the drug of choice for patients with TRS in both the US Department of Veterans Affairs (VA) policies and other evidence-based guidelines and remains the only antipsychotic with FDA approval for TRS.2-5 Patients treated with clozapine have fewer psychiatric hospitalizations, fewer suicide attempts, lower rates of nonadherence, and less antipsychotic polypharmacy compared with patients who are treated with other antipsychotic therapy.6,7 A 2016 study by Gören and colleagues found that in addition to the clinical benefits, there is the potential for cost savings of $22,000 for each veteran switched to and treated with clozapine for 1 year even when accounting for the cost of monitoring and potential adverse event management.8 This translates to a total savings of > $80 million if current utilization were doubled and half of those patients continued treatment for 1 year within the Veterans Health Administration (VHA). However, despite evidence supporting use, < 10% of Medicaid-eligible patients and only 4% of patients with schizophrenia in the VHA are prescribed clozapine.8,9
Clozapine is underutilized for a variety of reasons, including intensive monitoring requirements, potential for severe adverse drug reactions, and concern for patient adherence.8 Common adverse effects (AEs) can range from mild to severe and include weight gain, constipation, sedation, orthostatic hypotension, and excessive salivation. Clozapine also carries a boxed warning for agranulocytosis, seizures, myocarditis, other cardiovascular and respiratory AEs (including orthostatic hypotension), and increased mortality in elderly patients with dementia.
Severe agranulocytosis occurs in between 0.05% and 0.86% of patients, which led the FDA to implement a Risk Evaluation and Mitigation Strategy (REMS) program for clozapine prescribing in 2015. Prior to the REMS program, each of the 6 clozapine manufacturers were required to maintain a registry to monitor for agranulocytosis. Per the REMS program requirements, health care providers (HCPs), dispensing pharmacies, and patients must be enrolled in the program and provide an updated absolute neutrophil count (ANC) prior to prescribing or dispensing clozapine. This is potentially time consuming, particularly during the first 6 months of treatment when the ANC must be monitored weekly and prescriptions are restricted to a 7-day supply. With recent changes to the REMS program, pharmacists are no longer permitted to enroll patients in the REMS system. This adds to the administrative burden on HCPs and may decrease further the likelihood of prescribing clozapine due to lack of time for these tasks. Within the VHA, a separate entity, the VA National Clozapine Coordinating Center (NCCC), reduces the administrative burden on HCPs by monitoring laboratory values, controlling dispensing, and communicating data electronically to the FDA REMS program.10
Despite the various administrative and clinical barriers and facilitators to prescribing that exist, previous studies have found that certain organizational characteristics also may influence clozapine prescribing rates. Gören and colleagues found that utilization at VHA facilities ranged from < 5% to about 20% of patients with schizophrenia. In this study, facilities with higher utilization of clozapine were more likely to have integrated nonphysician psychiatric providers in clinics and to have clear organizational structure and processes for the treatment of severe mental illness, while facilities with lower utilization rates were less likely to have a point person for clozapine management.11
Although many national efforts have been made to increase clozapine use in recent years, no study has examined HCP perception of barriers and facilitators of clozapine use in the VHA. The objective of this study is to identify barriers and facilitators of clozapine use within the VHA as perceived by HCPs so that these may be addressed to increase appropriate utilization of clozapine in veterans with TRS.
Methods
This study was conducted as a national survey of mental health providers within the VHA who had a scope of practice that allowed clozapine prescribing. Any HCP in a solely administrative role was excluded. The survey tool was reviewed by clinical pharmacy specialists at the Lexington VA Health Care System for content and ease of administration. Following appropriate institutional review board approval, the survey was submitted to the organizational assessment subcommittee and the 5 national VA unions for approval per VA policy. The survey tool was built and administered through REDCap (Nashville, Tennessee) software. An electronic link was sent out to the national VA psychiatric pharmacist and national psychiatry chief listservs for dissemination to the psychiatric providers at each facility with weekly reminders sent out during the 4-week study period to maximize participation. The 29-item survey was developed to assess demographic information, HCP characteristics, perceived barriers and facilitators of clozapine use, and general clozapine knowledge. Knowledge-based questions included appropriate indications, starting dose, baseline ANC requirement, ANC monitoring requirements, and possible AEs.
Primary outcomes assessed were perceived barriers to clozapine prescribing, opinions of potential interventions to facilitate clozapine prescribing, knowledge regarding clozapine, and the impact of medication management clinics on clozapine prescribing. For the purposes of this study, a clozapine clinic was defined as an interdisciplinary team dedicated to clozapine prescribing and monitoring.
Secondary outcomes included a comparison of clozapine prescribing rates among different subgroups of HCPs. Subgroups included HCP discipline, geographic region, presence of academic affiliation, level of comfort or familiarity with clozapine, and percentage of time spent in direct patient care. The regional Veterans Integrated Service Networks (VISN) were used to evaluate the effect of geographic region on prescribing practices.
Results of the survey were analyzed using descriptive statistics. The Mann-Whitney U test was utilized to compare ordinal data from questions that were scored on a Likert scale, and nominal data was compared utilizing the χ2 test. For all objectives, an α of < .05 was considered significant.
Results
Ninety-eight HCPs from 17 VISNs responded during the 4-week survey period. One participant was excluded due to a solely administrative role. HCP characteristics and demographics are described in Table 1. The majority of respondents practice in an outpatient mental health setting either at the main VA campus or at a community-based outpatient clinic (CBOC).
Primary Outcomes
Perceived Barriers to Prescribing
The majority of survey respondents rated all factors listed as at least somewhat of a barrier to prescribing. Table 2 describes the perception of these various factors as barriers to clozapine prescribing. Along with prespecified variables, a free text box was available to participants to identify other perceived barriers not listed. Among other concerns listed in this text box were patient buy-in (11.3%), process/coordination of prescribing (8.2%), time restrictions (7.2%), prescriber restrictions (7.2%), access (3.1%), credentialing problems (2.1%), and lack of clear education materials (1%).
Perceived Facilitators to Prescribing
When asked to consider the potential for increased prescribing with various interventions, most participants reported that all identified facilitators would be at least somewhat likely to increase their clozapine utilization. Table 3 describes the perception of these various factors as facilitators to clozapine prescribing. Other identified facilitators included nursing or pharmacy support for follow-ups (4.1%), advanced practice registered nurse credentialing for VHA prescribing (3.1%), utilization of national REMS program without the NCCC (3.1%), outside pharmacy use during titration phase (2.1%), prespecified coverage for HCPs while on leave (1%), and increased access to specialty consults for AEs (1%).
Clozapine Knowledge Assessment
Overall, the average score on the clozapine knowledge assessment portion of the survey was 85.6%. The most commonly missed questions concerned the minimum ANC required to initiate clozapine and the appropriate starting dose for clozapine (Table 4). No significant difference was seen in clozapine utilization based on the clozapine knowledge assessment score when HCPs who scored≤ 60% were compared with those who scored ≥ 80% (P = .29).
Clozapine Clinic
No statistically significant difference was found (P = .35) when rates of prescribing between facilities with or without a dedicated clozapine clinic were compared (Table 5). Additionally, the involvement of a pharmacist in clozapine management clinics did not lead to a statistically significant difference in utilization rates (P = .45).
Secondary Outcomes
Self-rated level of comfort with clozapine prescribing was significantly associated with rates of clozapine prescribing (P < .01). HCPs who rated themselves as somewhat or very comfortable were significantly more likely to prescribe clozapine (Table 6). Providers who rated themselves as very familiar with clozapine monitoring requirements (Table 7) were significantly more likely to prescribe clozapine (P < .01). This significance remained when comparing HCPs who rated themselves as very familiar to those who ranked themselves as somewhat familiar (P = .01). There was no statistically significant difference in clozapine prescribing based on academic medical center affiliation, time spent in direct patient care, or geographic location.
Discussion
This survey targeted VHA HCPs who were licensed to prescribe clozapine to identify barriers and facilitators of use, along with HCP characteristics that may impact clozapine utilization. The findings of this study indicate that even though HCPs may perceive many legitimate barriers to clozapine prescribing, such as the frequent laboratory monitoring requirements, some factors may increase their willingness to prescribe clozapine. Many of these facilitators involve addressing logistical concerns and the administrative burden that accompanies clozapine use. These findings echo previous studies done within and outside the VHA.8,9
While some identified barriers would require national policy changes to address, others could be addressed at VHA facilities. It may be prudent for each VA facility to identify a HCP who is familiar with clozapine to serve as a subject matter expert. This would be beneficial to those HCPs who feel their patients may benefit from clozapine, but who lack experience in prescribing, or for those with concerns about appropriateness of a specific patient. Additionally, this point of contact could be a valuable resource for concerns regarding administrative issues that may arise with the laboratory reporting system. In some facilities, it may be beneficial to set aside dedicated prescriber time in a clinic designed for clozapine management. Many HCPs in this survey identified the establishment of a clozapine clinic as an intervention that would increase their likelihood of prescribing clozapine. This type of clinic may alleviate some of the concerns regarding appointment availability for weekly or bimonthly appointments early in therapy by having additional staff and time dedicated to accommodating the need for frequent visits.
The majority of respondents to this survey were concerned about the logistics of clozapine monitoring and prescribing; however, this is largely dictated by FDA and VHA policies and regulations. Per national guidance, patients within the VHA should only receive prescriptions for clozapine from their local VA facility pharmacy. It takes many veterans ≥ 1 hour to travel to the closest VA hospital or CBOC. This is especially true for facilities with largely rural catchments. These patients often lack many resources that may be present in more urban areas, such as reliable public transportation. This creates challenges for both weekly laboratory monitoring and dispensing of weekly clozapine prescriptions early in therapy. The option to get clozapine from a local non-VA pharmacy and complete laboratory monitoring at a non-VA laboratory facility could make a clozapine trial more feasible for these veterans. Another consideration is increasing the availability of VA-funded transportation for these patients to assist them in getting to their appointments. Serious mental illness case workers or mental health intensive case management services also may prove useful in arranging for transportation for laboratory monitoring.
Providers with higher self-rated comfort and familiarity with monitoring requirements had a significantly increased likelihood of clozapine utilization. Lack of experience was commonly identified as a barrier to prescribing. Subsequently, the majority of respondents felt that educational sessions would increase their likelihood to prescribe clozapine. This could be addressed at both a facility and national level. As discussed above, a subject matter expert at each facility could provide some of this education and guidance for prescribers who have little or no experience with clozapine. Additionally, national educational presentations and academic detailing campaigns may be an efficient way to provide standardized education across the VHA. Dissemination of required education via the VA Talent Management System is another potential route that would ensure all providers received adequate training regarding the specific challenges of prescribing clozapine within the VA.
Strengths and Limitations
The strengths of this study lie in directly assessing HCP perceptions of barriers and facilitators. It is ultimately up to each individual HCP to decide to use clozapine. Addressing the concerns of these HCPs will be advantageous in efforts to increase clozapine utilization. Additionally, to the authors’ knowledge this is the first study to assess provider characteristics and knowledge of clozapine in relation to utilization rates.
The method of distribution was a major limitation of this study. This survey was distributed via national e-mail listservs; however, no listserv exists within the VA that targets all psychiatric providers. This study relied on the psychiatry chiefs and psychiatric pharmacists within each facility to further disseminate the survey, which could have led to lower response rates than what may be gathered via more direct contact methods. In addition, targeting psychiatric section chiefs and pharmacists may have introduced response bias. Another limitation to this study was the small number of responses. It is possible that this study was not adequately powered to detect significant differences in clozapine prescribing based on HCP characteristics or clozapine clinic availability. Further studies investigating the impact of provider characteristics on clozapine utilization are warranted.
Conclusion
Even though clozapine is an effective medication for TRS, providers underutilize it for a variety of reasons. Commonly identified barriers to prescribing in this study included frequent monitoring requirements, logistics of prescribing (including the REMS program and transportation for laboratory monitoring), pharmacotherapy preferences, and concern about the potential AEs. Facilitators identified in this study included implementation of clozapine clinics, having a specified contact point within the facility to assist with administrative responsibility, educational sessions, and the ability to utilize outside laboratories.
While some of these barriers and facilitators cannot be fully addressed without national policy change, individual facilities should make every effort to identify institution-specific concerns and address these. Clozapine clinic implementation and educational sessions appear to be reasonable considerations. This study did not identify any HCP characteristics that significantly impacted the likelihood of prescribing clozapine aside from self-rated comfort and familiarity with clozapine. However, further studies are needed to fully assess the impact of provider characteristics on clozapine utilization.
1. Siskind D, Mccartney L, Goldschlager R, Kisely S. Clozapine v. first- and second-generation antipsychotics in treatment-refractory schizophrenia: systematic review and meta-analysis. Br J Psychiatry. 2016;209(5):385-392.
2. Lehman A, Lieberman JA, Dixon LB, et al; American Psychiatric Association; Steering Committee on Practice Guidelines. Practice guidelines for the treatment of patients with schizophrenia, second edition. Am J Psychiatry. 2004;161(2 suppl):1-56.
3. US Department of Veterans Affairs. Recommendations for antipsychotic selection in schizophrenia and schizoaffective disorders. https://www.pbm.va.gov/PBM/clinicalguidance/clinicalrecommendations/AntipsychoticSelectionAlgorithmSchizophreniaJune2012.doc. Published June 2012. Accessed September 12, 2019.
4. Dixon L, Perkins D, Calmes C. Guidelines watch (September 2009): practice guidelines for the treatment of patients with schizophrenia. https://psychiatryonline.org/pb/assets/raw/sitewide/practice_guidelines/guidelines/schizophrenia-watch.pdf. Published September 2009. Accessed September 12, 2019.
5. National Institute for Health and Care Excellence. Psychosis and schizophrenia in adults: prevention and management. https://www.nice.org.uk/guidance/cg178. Updated March 2014. Accessed September 12, 2019.
6. Meltzer HY, Alphs L, Green AI, et al; International Suicide Prevention Trial Study Group. Clozapine treatment for suicidality in schizophrenia: International Suicide Prevention Trial (InterSePT). Arch Gen Psychiatry. 2003;60(1):82-91.
7. Stroup TS, Gerhard T, Crystal S, Huang C, Olfson M. Comparative effectiveness of clozapine and standard antipsychotic treatment in adults with schizophrenia. Am J Psychiatry. 2016;173(2):166-173.
8. Gören JL, Rose AJ, Smith EG, Ney JP. The business case for expanded clozapine utilization. Psychiatr Serv. 2016;67(11):1197-1205.
9. Kelly DL, Freudenreich O, Sayer MA, Love RC. Addressing barriers to clozapine underutilization: a national effort. Psychiatr Serv. 2018;69(2):224-227.
10. US Department of Veterans Affairs. Clozapine patient management protocol (CPMP). https://www.va.gov/vhapublications/ViewPublication.asp?pub_ID=1818. Published December 23, 2008. Accessed September 12, 2019.
11. Gören JL, Rose AJ, Engle RL, et al. Organizational characteristics of Veterans Affairs clinics with high and low utilization of clozapine. Psychiatr Serv. 2016;67(11):1189-1196.
Assessing Refill Data Among Different Classes of Antidepressants (FULL)
Depression affects about 4.4% of the global population.1 Major depressive disorder (MDD) is currently the fourth highest cause of disability in the world and by 2030 MDD is expected to be third.2 Research has determined that 1 in 3 veterans seen in primary care shows depressive symptoms. Of these, 1 in 5 have symptoms severe enough to warrant further evaluation for MDD, and 1 in 10 require treatment.3 With this high rate of depression, optimized treatment strategies are needed, including antidepressants and psychotherapy. Antidepressants have grown in popularity since market entry in the 1950s; currently 1 in 10 US citizens aged ≥ 12 years are prescribed an antidepressant.4
Antidepressant Adherence
Antidepressant adherence is crucial for response and remission. Sansone and Sansone reported that, on average, < 50% of patients are adherent to their antidepressant treatment regimen 6 months after initiation (range, 5.4% - 87.6%).5 Fortney and colleagues found that, based on patient report, < 20% of veterans maintained at least 80% adherence at 6 months.6 Patients who are nonadherent are at an increased risk for relapse and recurrence and are more likely to seek care at an emergency department or to become hospitalized.2 In addition to the negative impact on patient outcomes, antidepressant nonadherence may also result in increased economic burden. In the US alone, the annual cost of treating MDD exceeds $210 billion, which will continue to increase if nonadherence is not mitigated.1
Patient-specific characteristics such as lack of knowledge about proper administration techniques, misguided beliefs, and negative attitudes towards treatment may affect adherence.5 In the veteran population, reasons for discontinuation also include lack of perceived benefit and adverse effects, specifically sexual difficulties.6 Sociodemographic and other patient characteristics also may be risk factors for nonadherence, including multiple medical comorbidities; substance use disorder (SUD) diagnosis; male gender; younger age; lack of health insurance or a higher medical cost burden; lack of or low involvement in psychotherapy; infrequent follow up visits; and high illness severity.1,7,8
Appreciating the adherence rates among the different antidepressant classes may help in antidepressant selection. To our knowledge, there have been no prior studies conducted in the veteran population that compared adherence rates among antidepressant classes. Studies in the nonveteran population report differing adherence rates among the antidepressant classes with generally higher adherence in patients prescribed serotonin norepinephrine reuptake inhibitors (SNRIs) and selective serotonin reuptake inhibitors (SSRIs). A retrospective review of commercial, Medicare, and Medicaid claims in > 5000 patients found that SNRIs had a significantly higher 3-month adherence rate based on the portion of days covered model (47%; P < .001) than other antidepressant classes (SSRIs, 42%; other antidepressants, 37%; tricyclic antidepressants [TCAs], 24%).7 Monoamine oxidase inhibitors (MAOIs) prescribed to 1% of the study population had the highest adherence rate at 48%.7 A study reviewing > 25 000 patient claims sourced from the IBM MarketScan research database (Armonk, NY) found that SSRIs (Odds ratio [OR], 1.26; P < .001) and norepinephrine dopamine reuptake inhibitors (NDRIs) (OR, 1.23; P = .007) had the highest ORs for adherence according to the portion of days covered model, while other serotonin modulators (OR, 0.65; P = .001) and tri/tetracyclic antidepressants (OR, 0.49; P < . 001) had the lowest ORs and were associated with lower adherence.1
VA Approaches to Adherence
To address antidepressant adherence, the US Department of Veteran Affairs (VA) adopted 2 measures from the Healthcare Effectiveness Data and Information Set: MDD43h and MDD47h. Measure MDD43h is defined as the proportion of patients with a depression diagnosis newly treated with an antidepressant medication who remained on the antidepressant medication for at least 84 out of 114 days (3 months). MDD47h is similar, but assesses patients remaining on an antidepressant medication for at least 180 out of 230 days (6 months).9 These constitute a SAIL (Strategic Analytics for Improvement and Learning) measure by which VA hospitals are compared. High performance on these measures aids in improving the comparative status of a VA facility.
To help improve performance on these measures, the VA Psychotropic Drug Safety Initiative developed the Antidepressant Nonadherence Report, which serves as a case finder for clinicians to identify veterans with low adherence and/or those overdue for a refill. The dashboard uses the medication possession ratio (MPR) to calculate adherence. While the optimal value is still widely debated, an MPR of ≥ 80% is generally accepted for many disease states.10 The dashboard defines low adherence as ≤ 60%.
As of September 2018, the Antidepressant Nonadherence Report for the Michael E. DeBakey VA Medical Center (MEDVAMC) in Houston, Texas, included > 5000 patients in both MEDVAMC and associated community-based outpatient clinics. About 30% of patients were categorized as overdue for a refill.
Study Objectives
To better understand the problem of antidepressant adherence within this population, we decided to study the relationship between antidepressant class and adherence rates, as well as how adherence relates to patient-specific characteristics. By highlighting predisposing risk factors to low adherence, we hope to provide better interventions.
The primary objective of this study was to determine whether 3-month adherence rates, measured by the MPR, differ between antidepressant classes in veterans newly initiated on antidepressant therapy. A secondary objective was to identify whether there are differences in patient characteristics between those with high MPR (≥ 80%) and low MPR (≤ 60%).
Methods
This study used a retrospective, cross-sectional chart review of MEDVAMC patients from the Antidepressant Nonadherence Report. Patients were: aged ≥ 18 years; newly initiated on an antidepressant with no previous use of the same medication; outpatient for the entire study period; and seen by a physician, physician assistant, nurse practitioner, or pharmacist mental health provider (MHP) within the 3-month study period. All patients’ charts showed a depression diagnosis—an inclusion criterion for the MDD43h and MDD47h measures. However, for this study, the indication(s) for the chosen antidepressant were determined by the MHP note in the patient electronic health record on the date that the medication was prescribed. Study patients may not have had a current depression diagnosis based upon the MHP assessment on the index date. We chose to determine the antidepressant indication(s) in this way because the MHP note would have the most detailed patient assessment.
Patients with previous use of the prescribed antidepressant were excluded because previous exposure may bias the patient and affect current adherence. Patients who were hospitalized at the VA for any reason during the 3-month study period were excluded because of a known risk during transitions of care for medications to be held or discontinued, which could impact refills and MPR. Some patients were excluded if they were taking the antidepressant for a nonmood-related indication (insomnia, neuropathy, migraine prophylaxis, etc). Patients also were excluded if the antidepressant was prescribed to take as-needed; if trazodone was the only antidepressant prescribed; if they were diagnosed with cognitive impairment including dementia or history of stroke; or if they were diagnosed with schizophrenia, schizoaffective disorder, or borderline personality disorder. Use of trazodone as the only antidepressant was excluded because of the relatively common practice to use it in the treatment of insomnia rather than depression.
Primary and Secondary Outcomes
Information collected for the primary outcome, including antidepressant class and MPR, was obtained from the Antidepressant Nonadherence Report. For the secondary outcome, the following data was collected for each patient: age, gender, race, housing status, Medication Regimen Complexity Index (MRCI), number and type of psychiatric diagnoses, number of previous antidepressants, psychotherapy involvement, and number of mental health visits during the 3-month study period. The MRCI is an objective, validated tool that determines relative medication regimen complexity by taking into consideration the number of medications, route and frequency of administration, splitting/multiple dosage units, and presence of any special instructions.11
The primary outcome was tested using a one-way analysis of variance (ANOVA). Nominal secondary outcomes were analyzed using the Fisher’s Exact. Continuous secondary outcomes were examined using an unpaired t-test.
Results
Of 320 charts, 212 patients were excluded and 108 were included (Figure). The most common reason for exclusion was a previously prescribed antidepressant. Of the included patients 49 had an MPR ≥ 80% and 24 had an MPR ≤ 60%. The characteristics of the study population are found in Table 1 and the antidepressant frequencies and MPRs are included in Table 2.
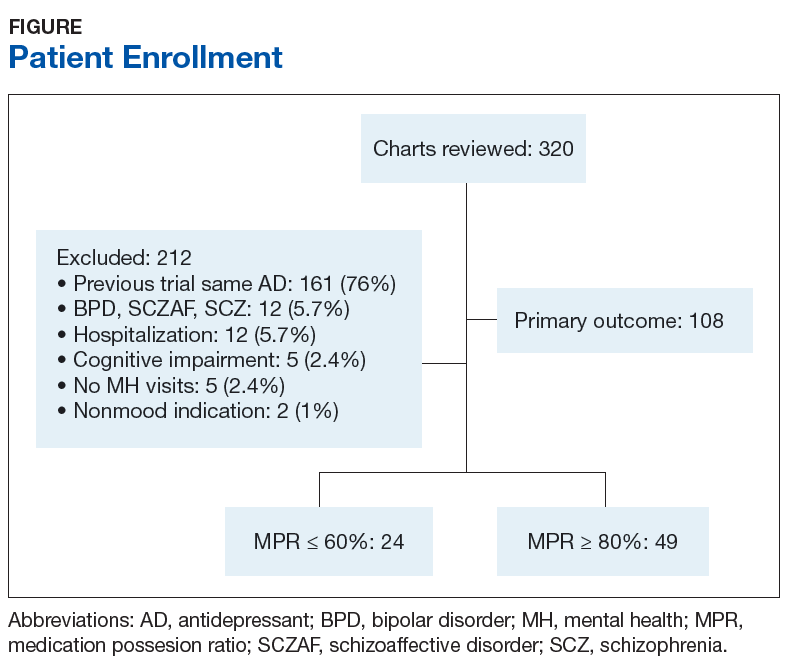
About 87% of study patients had a diagnosis of depression. Other concomitant psychiatric diagnoses include posttraumatic stress disorder (PTSD), anxiety, insomnia, and 2 cases of intermittent explosive disorder. There were no significant differences in mean MPR between the antidepressant classes (P = .31). Within each drug class, we identified the proportion of patients with high adherence (MPR ≥ 80%). Bupropion had the greatest percentage of highly adherent patients (50%) compared with SSRIs (42.5%), SNRIs (38.5%), and mirtazapine (31.3%).
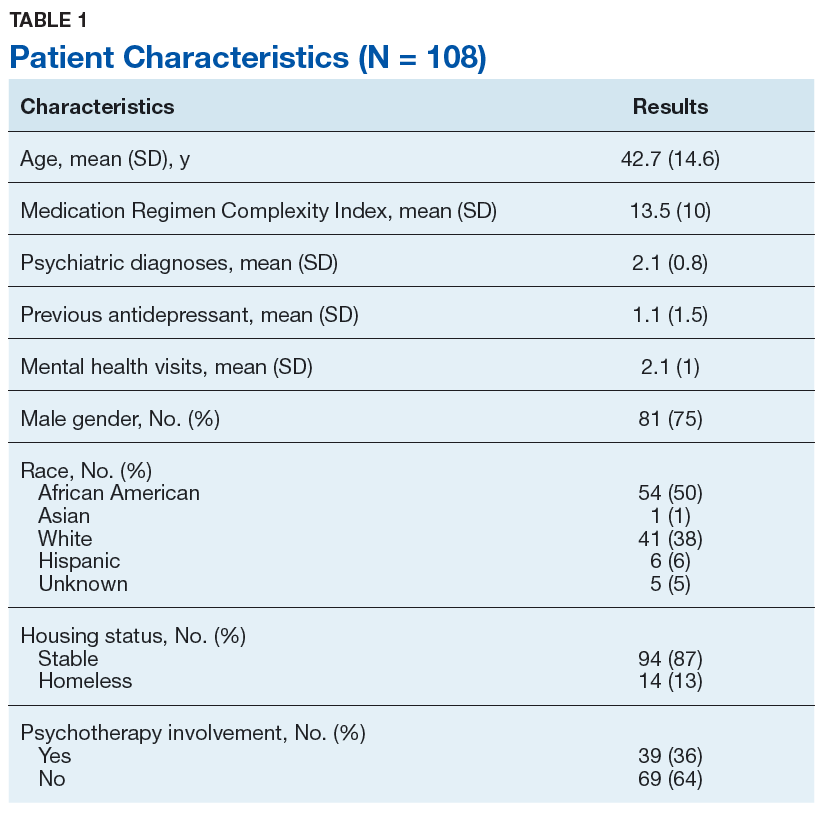
Table 3 compares the characteristics between high MPR and low MPR patients. The low MPR group showed a significantly greater proportion of patients with an SUD than the high adherence group (41.7% vs 10.2%, respectively; P = .04). The most common type of SUD was alcohol use disorder followed by cannabis use disorder. There were no other statistically significant differences identified between high and low MPR groups. There was a trend towards significance when comparing MRCI between the 2 groups (high MPR, 15.2; low MPR, 10.8; P = .06).
Discussion
In our study, there was no significant difference in 3-month adherence rates between veterans on SSRIs, SNRIs, bupropion, and mirtazapine. This result differs from a study by Keyloun and colleagues that found that SNRIs had a significantly higher adherence rate when compared with other antidepressants.7
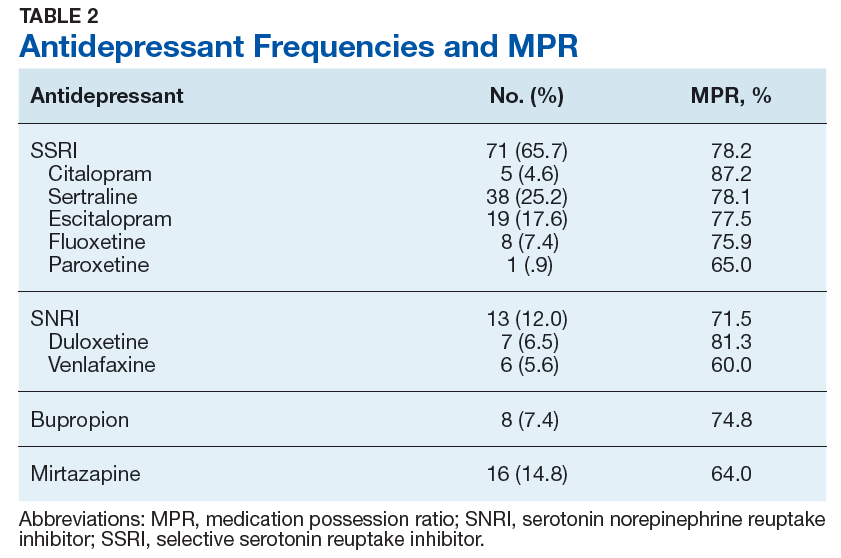
SSRIs were the most commonly prescribed antidepressant in our study, and also had the greatest mean 3-month MPR. The high use of SSRIs may be due to the greater number of SSRI choices to select from compared with other classes. SSRIs may also have been selected more frequently because nearly half (45.4%) of the patients had comorbid PTSD, for which 3 of the 4 first-line treatment options are SSRIs (sertraline, paroxetine, fluoxetine).
As previously stated, Keyloun and colleagues previously found that SNRIs had the highest 3-month adherence rate in a study of > 5000 patients.7 In our study, SNRIs had the second highest mean 3-month MPR at about 75%, but the difference was not considered significant when compared with other antidepressant classes.
Bupropion was prescribed least frequently, but had the largest proportion of adherent patients. Gaspar and colleagues demonstrated similar outcomes, reporting that patients prescribed bupropion had a high OR for adherence.1 Bupropion may have had relatively low prescribing rates in our study because 64% of patients were diagnosed with a comorbid anxiety disorder and/or PTSD. For these patients, bupropion avoidance may have been intentional so as to not exacerbate anxiety.
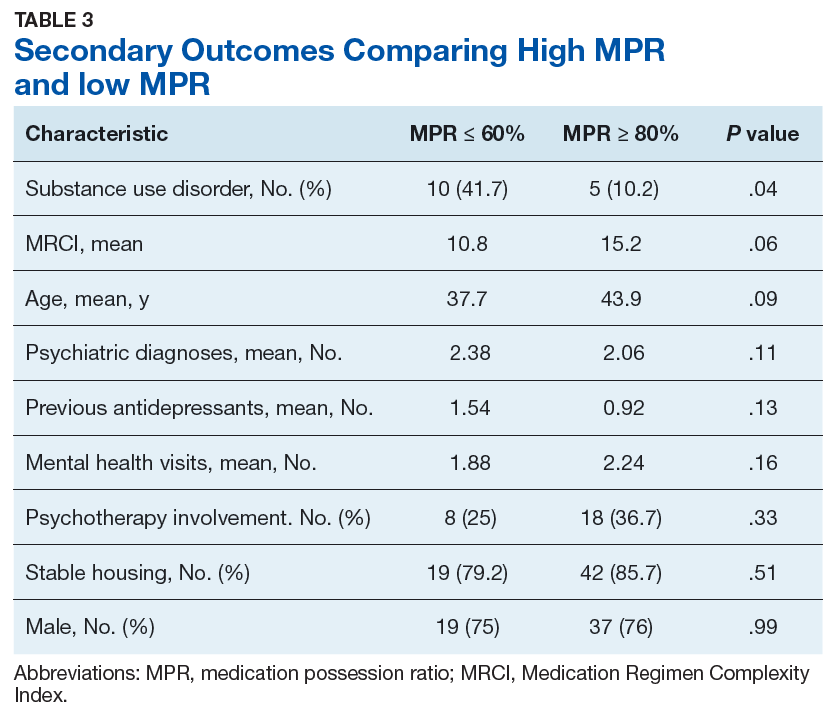
Mirtazapine had both the lowest mean MPR and the lowest proportion of adherent patients. While no significant difference between antidepressant 3-month adherence rates were found, this study’s findings were similar to previous studies that found lower adherence to mirtazapine.1,5 Adverse effects such as sedation, increased appetite, and weight gain may have contributed to low adherence with mirtazapine.4 Patients may also have been using the agent on an as needed basis to treat insomnia despite the order being written for daily use.
Substance Use Disorder Influence
A significantly greater proportion of patients had an SUD in the low MPR group, suggesting that an SUD diagnosis may be a risk factor for low adherence. This finding is consistent with previous studies that also found that an SUD was associated with poor medication adherence.1 Patients with depression and an SUD have been shown to have suboptimal outcomes compared to those without an SUD, including a lower response to antidepressant therapy and increased illness severity.11,12
In a study of 131 outpatients with dual diagnosis (26% with depression) predictors for low self-reported adherence were a medication-related variable (increased adverse effects), a cognitive variable (low self-efficacy for drug avoidance), and a social factor (low social support for recovery). This variety of predictors seems to indicate that simple memory aids may not improve adherence. “Dual focus” mutual aid groups that provide social support for patients with dual diagnosis have been shown to improve adherence.13
The MEDVAMC Substance Dependence Treatment Program (SDTP) is an outpatient program that uses group education to aid veterans, often those with comorbid psychiatric disorders, to build relapse prevention skills and provide social support. Further exploration into the relationship between involvement in SDTP groups and antidepressant adherence in patients with dual diagnosis may be warranted.
Secondary Outcomes
Trends identified in the secondary outcome were similar to outcomes of previous studies: younger age, lower therapy involvement, and more comorbid psychiatric diagnoses were associated with lower adherence.1,7,8 The presence of increased previous use of antidepressants in the low adherence group may suggest that these patients have an increased illness severity, although objective scales, such as the Patient Health Questionnaire 9 (PHQ9), were not consistently conducted and therefore not included in this analysis. It is unknown whether the previous antidepressant prescriptions were of adequate duration. These patients may have also had intolerances that led to multiple different antidepressant prescriptions and self-discontinuation.
The average MRCI of study patients was 13.5 (range 2 - 53), which was significantly lower than a previous study of geriatric patients with depression reporting an average MRCI of 25.4 (range 6 - 64).14 The positive trend between MRCI and adherence seen in this study was puzzling and counterintuitive. A more complex regimen is generally thought to be associated with poor adherence. Patients with a greater number of comorbid conditions may inherently be on more medications and thus have a more complex medication regimen. Manzano-Garcia and colleagues identified a negative relationship between adherence and the number of comorbidities (OR, 1.04-1.57; P = .021) and the MRCI (OR, 1.14-1.26; P < .001) in patients with HIV.15 Further studies are needed to clarify the relationship between medication adherence and medication regimen complexity in patients with mental health disorders. A better understanding of this relationship could possibly facilitate improved individualized prescribing practices and follow-up.
Limitations
Findings from our study should be interpreted within several limitations. Generalizability and statistical power were limited due to the small sample size, a practice site limited to 1 facility, and population type. The retrospective design of the study introduces inherent bias that would be minimized had a prospective study been conducted. The primary outcome was based upon MPR, which only accounts for refills within a specified time period and does not assess for actual or accurate use of the medication. Data collection was limited to VA and US Department of Defense records.
Geographically diverse studies with larger sample sizes need to be conducted to better understand antidepressant adherence and its barriers and facilitators in the veteran population. The exclusion of patients with previous trials of the prescribed antidepressant may have led to a possible selection bias favoring inclusion of younger patients. These patients may have a more limited period for assessment and treatment when compared with older patients, and thus may have had a smaller chance of previous exposure to the prescribed antidepressant. Neither MAOIs or TCAs were included in this study. No patients taking MAOIs were identified from the Antidepressant Nonadherence Report during the study period. Three patients on TCAs were chart reviewed, but excluded from the study because of prior use of the antidepressant or a non-mental health indication. Additionally, no newer antidepressants, including vortioxetine and vilazodone, were included, likely secondary to their nonformulary status at the VA.
Conclusion
As this study’s purpose was to improve the quality of care at our facility, we will discuss our findings with local MHPs to develop strategies to improve antidepressant adherence. While larger studies need to be conducted to confirm our findings, it is worthwhile to consider risk factors for low adherence such as SUD when prescribing antidepressant medications. Patients with SUD could be encouraged to enroll in our facility’s telephone nursing depression care management program for more frequent follow up and medication adherence counseling.
This study did not find a significant difference in 3-month adherence rates between SSRIs, SNRIs, bupropion, and mirtazapine. SUD was significantly more common in patients with low adherence than those categorized as adherent and may be a risk factor for low adherence based upon our findings and those of previous studies.
1. Gaspar FW, Zaidel CS, Dewa CS. Rates and determinants of use of pharmacotherapy and psychotherapy by patients with major depressive disorder. Psychiatr Serv. 2019;70(4):262-270.
2. Ho SC, Jacob SA, Tangiisuran B. Barriers and facilitators of adherence to antidepressants among outpatients with major depressive disorder: a qualitative study. PLoS One. 2017;12(6):e0179290.
3. US Department of Veterans Affairs, Office of Research and Development. VA research on: depression. https://www.research.va.gov/topics/depression.cfm#research1. Accessed May 30, 2019.
4. Santarsieri D, Schwartz TL. Antidepressant efficacy and side-effect burden: a quick guide for clinicians. Drugs Context. 2015;4:212290.
5. Sansone RA, Sansone LA. Antidepressant adherence: are patients taking their medications? Innov Clin Neurosci. 2012;9(5-6):41-46.
6. Fortney JC, Pyne JM, Edlund MJ, et al. Reasons for antidepressant nonadherence among veterans treated in primary care clinics. J Clin Psychiatry. 2011;72(6):827-834.
7. Keyloun KR, Hansen RN, Hepp Z, Gillard P, Thase ME, Devine EB. Adherence and persistence across antidepressant therapeutic classes: a retrospective claims analysis among insured US patients with major depressive disorder (MDD). [erratum: CNS Drugs. 2017;31(6):511.] CNS Drugs. 2017;31(5):421-432.
8. Mcinnis MG. Adherence to treatment regimens in major depression: perspectives, problems, and progress. https://www.psychiatrictimes.com/depression/adherence-treatment-regimens-major-depression-perspectives-problems-and-progress. Published September 15, 2007. Accessed September 10, 2019.
9. US Department of Veterans Affairs, Office of Mental Health Operations. Clinical support portal. User Guide – antidepressant non-adherence report (MDD43h MDD47h). https://spsites.cdw.va.gov/sites/OMHO_PsychPharm/_layouts/15/WopiFrame.aspx?sourcedoc=/sites/OMHO_PsychPharm/AnalyticsReports/UserGuideMDD43H47H.pdf. Accessed July 29, 2018. [Nonpublic site]
10. Crowe M. Do you know the difference between these adherence measures? https://www.pharmacytimes.com/contributor/michael-crowe-pharmd-mba-csp-fmpa/2015/07/do-you-know-the-difference-between-these-adherence-measures. Published July 5, 2015. Accessed September 13, 2019.
11. Watkins KE, Paddock SM, Zhang L, Wells KB. Improving care for depression in patients with comorbid substance misuse. Am J Psychiatry. 2006;163(1):125-132.
12. Magura S, Rosenblum A, Fong C. Factors associated with medication adherence among psychiatric outpatients at substance abuse risk. Open Addict J. 2011;4:58-64.
13. Magura S, Rosenblum A, Villano CL, Vogel HS, Fong C, Betzler T. Dual-focus mutual aid for co-occurring disorders: a quasi-experimental outcome evaluation study. Am J Drug Alcohol Abuse. 2008;34(1):61-74.
14. Libby AM, Fish DN, Hosokawa PW, et al. Patient-level medication regimen complexity across populations with chronic disease. Clin Ther. 2013;35(4):385-398.e1.
15. Manzano-García M, Pérez-Guerrero C, Álvarez de Sotomayor Paz M, Robustillo-Cortés MLA, Almeida-González CV, Morillo-Verdugo R. Identification of the medication regimen complexity index as an associated factor of nonadherence to antiretroviral treatment in HIV positive patients. Ann Pharmacother. 2018;52(9):862-867.
Depression affects about 4.4% of the global population.1 Major depressive disorder (MDD) is currently the fourth highest cause of disability in the world and by 2030 MDD is expected to be third.2 Research has determined that 1 in 3 veterans seen in primary care shows depressive symptoms. Of these, 1 in 5 have symptoms severe enough to warrant further evaluation for MDD, and 1 in 10 require treatment.3 With this high rate of depression, optimized treatment strategies are needed, including antidepressants and psychotherapy. Antidepressants have grown in popularity since market entry in the 1950s; currently 1 in 10 US citizens aged ≥ 12 years are prescribed an antidepressant.4
Antidepressant Adherence
Antidepressant adherence is crucial for response and remission. Sansone and Sansone reported that, on average, < 50% of patients are adherent to their antidepressant treatment regimen 6 months after initiation (range, 5.4% - 87.6%).5 Fortney and colleagues found that, based on patient report, < 20% of veterans maintained at least 80% adherence at 6 months.6 Patients who are nonadherent are at an increased risk for relapse and recurrence and are more likely to seek care at an emergency department or to become hospitalized.2 In addition to the negative impact on patient outcomes, antidepressant nonadherence may also result in increased economic burden. In the US alone, the annual cost of treating MDD exceeds $210 billion, which will continue to increase if nonadherence is not mitigated.1
Patient-specific characteristics such as lack of knowledge about proper administration techniques, misguided beliefs, and negative attitudes towards treatment may affect adherence.5 In the veteran population, reasons for discontinuation also include lack of perceived benefit and adverse effects, specifically sexual difficulties.6 Sociodemographic and other patient characteristics also may be risk factors for nonadherence, including multiple medical comorbidities; substance use disorder (SUD) diagnosis; male gender; younger age; lack of health insurance or a higher medical cost burden; lack of or low involvement in psychotherapy; infrequent follow up visits; and high illness severity.1,7,8
Appreciating the adherence rates among the different antidepressant classes may help in antidepressant selection. To our knowledge, there have been no prior studies conducted in the veteran population that compared adherence rates among antidepressant classes. Studies in the nonveteran population report differing adherence rates among the antidepressant classes with generally higher adherence in patients prescribed serotonin norepinephrine reuptake inhibitors (SNRIs) and selective serotonin reuptake inhibitors (SSRIs). A retrospective review of commercial, Medicare, and Medicaid claims in > 5000 patients found that SNRIs had a significantly higher 3-month adherence rate based on the portion of days covered model (47%; P < .001) than other antidepressant classes (SSRIs, 42%; other antidepressants, 37%; tricyclic antidepressants [TCAs], 24%).7 Monoamine oxidase inhibitors (MAOIs) prescribed to 1% of the study population had the highest adherence rate at 48%.7 A study reviewing > 25 000 patient claims sourced from the IBM MarketScan research database (Armonk, NY) found that SSRIs (Odds ratio [OR], 1.26; P < .001) and norepinephrine dopamine reuptake inhibitors (NDRIs) (OR, 1.23; P = .007) had the highest ORs for adherence according to the portion of days covered model, while other serotonin modulators (OR, 0.65; P = .001) and tri/tetracyclic antidepressants (OR, 0.49; P < . 001) had the lowest ORs and were associated with lower adherence.1
VA Approaches to Adherence
To address antidepressant adherence, the US Department of Veteran Affairs (VA) adopted 2 measures from the Healthcare Effectiveness Data and Information Set: MDD43h and MDD47h. Measure MDD43h is defined as the proportion of patients with a depression diagnosis newly treated with an antidepressant medication who remained on the antidepressant medication for at least 84 out of 114 days (3 months). MDD47h is similar, but assesses patients remaining on an antidepressant medication for at least 180 out of 230 days (6 months).9 These constitute a SAIL (Strategic Analytics for Improvement and Learning) measure by which VA hospitals are compared. High performance on these measures aids in improving the comparative status of a VA facility.
To help improve performance on these measures, the VA Psychotropic Drug Safety Initiative developed the Antidepressant Nonadherence Report, which serves as a case finder for clinicians to identify veterans with low adherence and/or those overdue for a refill. The dashboard uses the medication possession ratio (MPR) to calculate adherence. While the optimal value is still widely debated, an MPR of ≥ 80% is generally accepted for many disease states.10 The dashboard defines low adherence as ≤ 60%.
As of September 2018, the Antidepressant Nonadherence Report for the Michael E. DeBakey VA Medical Center (MEDVAMC) in Houston, Texas, included > 5000 patients in both MEDVAMC and associated community-based outpatient clinics. About 30% of patients were categorized as overdue for a refill.
Study Objectives
To better understand the problem of antidepressant adherence within this population, we decided to study the relationship between antidepressant class and adherence rates, as well as how adherence relates to patient-specific characteristics. By highlighting predisposing risk factors to low adherence, we hope to provide better interventions.
The primary objective of this study was to determine whether 3-month adherence rates, measured by the MPR, differ between antidepressant classes in veterans newly initiated on antidepressant therapy. A secondary objective was to identify whether there are differences in patient characteristics between those with high MPR (≥ 80%) and low MPR (≤ 60%).
Methods
This study used a retrospective, cross-sectional chart review of MEDVAMC patients from the Antidepressant Nonadherence Report. Patients were: aged ≥ 18 years; newly initiated on an antidepressant with no previous use of the same medication; outpatient for the entire study period; and seen by a physician, physician assistant, nurse practitioner, or pharmacist mental health provider (MHP) within the 3-month study period. All patients’ charts showed a depression diagnosis—an inclusion criterion for the MDD43h and MDD47h measures. However, for this study, the indication(s) for the chosen antidepressant were determined by the MHP note in the patient electronic health record on the date that the medication was prescribed. Study patients may not have had a current depression diagnosis based upon the MHP assessment on the index date. We chose to determine the antidepressant indication(s) in this way because the MHP note would have the most detailed patient assessment.
Patients with previous use of the prescribed antidepressant were excluded because previous exposure may bias the patient and affect current adherence. Patients who were hospitalized at the VA for any reason during the 3-month study period were excluded because of a known risk during transitions of care for medications to be held or discontinued, which could impact refills and MPR. Some patients were excluded if they were taking the antidepressant for a nonmood-related indication (insomnia, neuropathy, migraine prophylaxis, etc). Patients also were excluded if the antidepressant was prescribed to take as-needed; if trazodone was the only antidepressant prescribed; if they were diagnosed with cognitive impairment including dementia or history of stroke; or if they were diagnosed with schizophrenia, schizoaffective disorder, or borderline personality disorder. Use of trazodone as the only antidepressant was excluded because of the relatively common practice to use it in the treatment of insomnia rather than depression.
Primary and Secondary Outcomes
Information collected for the primary outcome, including antidepressant class and MPR, was obtained from the Antidepressant Nonadherence Report. For the secondary outcome, the following data was collected for each patient: age, gender, race, housing status, Medication Regimen Complexity Index (MRCI), number and type of psychiatric diagnoses, number of previous antidepressants, psychotherapy involvement, and number of mental health visits during the 3-month study period. The MRCI is an objective, validated tool that determines relative medication regimen complexity by taking into consideration the number of medications, route and frequency of administration, splitting/multiple dosage units, and presence of any special instructions.11
The primary outcome was tested using a one-way analysis of variance (ANOVA). Nominal secondary outcomes were analyzed using the Fisher’s Exact. Continuous secondary outcomes were examined using an unpaired t-test.
Results
Of 320 charts, 212 patients were excluded and 108 were included (Figure). The most common reason for exclusion was a previously prescribed antidepressant. Of the included patients 49 had an MPR ≥ 80% and 24 had an MPR ≤ 60%. The characteristics of the study population are found in Table 1 and the antidepressant frequencies and MPRs are included in Table 2.
About 87% of study patients had a diagnosis of depression. Other concomitant psychiatric diagnoses include posttraumatic stress disorder (PTSD), anxiety, insomnia, and 2 cases of intermittent explosive disorder. There were no significant differences in mean MPR between the antidepressant classes (P = .31). Within each drug class, we identified the proportion of patients with high adherence (MPR ≥ 80%). Bupropion had the greatest percentage of highly adherent patients (50%) compared with SSRIs (42.5%), SNRIs (38.5%), and mirtazapine (31.3%).
Table 3 compares the characteristics between high MPR and low MPR patients. The low MPR group showed a significantly greater proportion of patients with an SUD than the high adherence group (41.7% vs 10.2%, respectively; P = .04). The most common type of SUD was alcohol use disorder followed by cannabis use disorder. There were no other statistically significant differences identified between high and low MPR groups. There was a trend towards significance when comparing MRCI between the 2 groups (high MPR, 15.2; low MPR, 10.8; P = .06).
Discussion
In our study, there was no significant difference in 3-month adherence rates between veterans on SSRIs, SNRIs, bupropion, and mirtazapine. This result differs from a study by Keyloun and colleagues that found that SNRIs had a significantly higher adherence rate when compared with other antidepressants.7
SSRIs were the most commonly prescribed antidepressant in our study, and also had the greatest mean 3-month MPR. The high use of SSRIs may be due to the greater number of SSRI choices to select from compared with other classes. SSRIs may also have been selected more frequently because nearly half (45.4%) of the patients had comorbid PTSD, for which 3 of the 4 first-line treatment options are SSRIs (sertraline, paroxetine, fluoxetine).
As previously stated, Keyloun and colleagues previously found that SNRIs had the highest 3-month adherence rate in a study of > 5000 patients.7 In our study, SNRIs had the second highest mean 3-month MPR at about 75%, but the difference was not considered significant when compared with other antidepressant classes.
Bupropion was prescribed least frequently, but had the largest proportion of adherent patients. Gaspar and colleagues demonstrated similar outcomes, reporting that patients prescribed bupropion had a high OR for adherence.1 Bupropion may have had relatively low prescribing rates in our study because 64% of patients were diagnosed with a comorbid anxiety disorder and/or PTSD. For these patients, bupropion avoidance may have been intentional so as to not exacerbate anxiety.
Mirtazapine had both the lowest mean MPR and the lowest proportion of adherent patients. While no significant difference between antidepressant 3-month adherence rates were found, this study’s findings were similar to previous studies that found lower adherence to mirtazapine.1,5 Adverse effects such as sedation, increased appetite, and weight gain may have contributed to low adherence with mirtazapine.4 Patients may also have been using the agent on an as needed basis to treat insomnia despite the order being written for daily use.
Substance Use Disorder Influence
A significantly greater proportion of patients had an SUD in the low MPR group, suggesting that an SUD diagnosis may be a risk factor for low adherence. This finding is consistent with previous studies that also found that an SUD was associated with poor medication adherence.1 Patients with depression and an SUD have been shown to have suboptimal outcomes compared to those without an SUD, including a lower response to antidepressant therapy and increased illness severity.11,12
In a study of 131 outpatients with dual diagnosis (26% with depression) predictors for low self-reported adherence were a medication-related variable (increased adverse effects), a cognitive variable (low self-efficacy for drug avoidance), and a social factor (low social support for recovery). This variety of predictors seems to indicate that simple memory aids may not improve adherence. “Dual focus” mutual aid groups that provide social support for patients with dual diagnosis have been shown to improve adherence.13
The MEDVAMC Substance Dependence Treatment Program (SDTP) is an outpatient program that uses group education to aid veterans, often those with comorbid psychiatric disorders, to build relapse prevention skills and provide social support. Further exploration into the relationship between involvement in SDTP groups and antidepressant adherence in patients with dual diagnosis may be warranted.
Secondary Outcomes
Trends identified in the secondary outcome were similar to outcomes of previous studies: younger age, lower therapy involvement, and more comorbid psychiatric diagnoses were associated with lower adherence.1,7,8 The presence of increased previous use of antidepressants in the low adherence group may suggest that these patients have an increased illness severity, although objective scales, such as the Patient Health Questionnaire 9 (PHQ9), were not consistently conducted and therefore not included in this analysis. It is unknown whether the previous antidepressant prescriptions were of adequate duration. These patients may have also had intolerances that led to multiple different antidepressant prescriptions and self-discontinuation.
The average MRCI of study patients was 13.5 (range 2 - 53), which was significantly lower than a previous study of geriatric patients with depression reporting an average MRCI of 25.4 (range 6 - 64).14 The positive trend between MRCI and adherence seen in this study was puzzling and counterintuitive. A more complex regimen is generally thought to be associated with poor adherence. Patients with a greater number of comorbid conditions may inherently be on more medications and thus have a more complex medication regimen. Manzano-Garcia and colleagues identified a negative relationship between adherence and the number of comorbidities (OR, 1.04-1.57; P = .021) and the MRCI (OR, 1.14-1.26; P < .001) in patients with HIV.15 Further studies are needed to clarify the relationship between medication adherence and medication regimen complexity in patients with mental health disorders. A better understanding of this relationship could possibly facilitate improved individualized prescribing practices and follow-up.
Limitations
Findings from our study should be interpreted within several limitations. Generalizability and statistical power were limited due to the small sample size, a practice site limited to 1 facility, and population type. The retrospective design of the study introduces inherent bias that would be minimized had a prospective study been conducted. The primary outcome was based upon MPR, which only accounts for refills within a specified time period and does not assess for actual or accurate use of the medication. Data collection was limited to VA and US Department of Defense records.
Geographically diverse studies with larger sample sizes need to be conducted to better understand antidepressant adherence and its barriers and facilitators in the veteran population. The exclusion of patients with previous trials of the prescribed antidepressant may have led to a possible selection bias favoring inclusion of younger patients. These patients may have a more limited period for assessment and treatment when compared with older patients, and thus may have had a smaller chance of previous exposure to the prescribed antidepressant. Neither MAOIs or TCAs were included in this study. No patients taking MAOIs were identified from the Antidepressant Nonadherence Report during the study period. Three patients on TCAs were chart reviewed, but excluded from the study because of prior use of the antidepressant or a non-mental health indication. Additionally, no newer antidepressants, including vortioxetine and vilazodone, were included, likely secondary to their nonformulary status at the VA.
Conclusion
As this study’s purpose was to improve the quality of care at our facility, we will discuss our findings with local MHPs to develop strategies to improve antidepressant adherence. While larger studies need to be conducted to confirm our findings, it is worthwhile to consider risk factors for low adherence such as SUD when prescribing antidepressant medications. Patients with SUD could be encouraged to enroll in our facility’s telephone nursing depression care management program for more frequent follow up and medication adherence counseling.
This study did not find a significant difference in 3-month adherence rates between SSRIs, SNRIs, bupropion, and mirtazapine. SUD was significantly more common in patients with low adherence than those categorized as adherent and may be a risk factor for low adherence based upon our findings and those of previous studies.
1. Gaspar FW, Zaidel CS, Dewa CS. Rates and determinants of use of pharmacotherapy and psychotherapy by patients with major depressive disorder. Psychiatr Serv. 2019;70(4):262-270.
2. Ho SC, Jacob SA, Tangiisuran B. Barriers and facilitators of adherence to antidepressants among outpatients with major depressive disorder: a qualitative study. PLoS One. 2017;12(6):e0179290.
3. US Department of Veterans Affairs, Office of Research and Development. VA research on: depression. https://www.research.va.gov/topics/depression.cfm#research1. Accessed May 30, 2019.
4. Santarsieri D, Schwartz TL. Antidepressant efficacy and side-effect burden: a quick guide for clinicians. Drugs Context. 2015;4:212290.
5. Sansone RA, Sansone LA. Antidepressant adherence: are patients taking their medications? Innov Clin Neurosci. 2012;9(5-6):41-46.
6. Fortney JC, Pyne JM, Edlund MJ, et al. Reasons for antidepressant nonadherence among veterans treated in primary care clinics. J Clin Psychiatry. 2011;72(6):827-834.
7. Keyloun KR, Hansen RN, Hepp Z, Gillard P, Thase ME, Devine EB. Adherence and persistence across antidepressant therapeutic classes: a retrospective claims analysis among insured US patients with major depressive disorder (MDD). [erratum: CNS Drugs. 2017;31(6):511.] CNS Drugs. 2017;31(5):421-432.
8. Mcinnis MG. Adherence to treatment regimens in major depression: perspectives, problems, and progress. https://www.psychiatrictimes.com/depression/adherence-treatment-regimens-major-depression-perspectives-problems-and-progress. Published September 15, 2007. Accessed September 10, 2019.
9. US Department of Veterans Affairs, Office of Mental Health Operations. Clinical support portal. User Guide – antidepressant non-adherence report (MDD43h MDD47h). https://spsites.cdw.va.gov/sites/OMHO_PsychPharm/_layouts/15/WopiFrame.aspx?sourcedoc=/sites/OMHO_PsychPharm/AnalyticsReports/UserGuideMDD43H47H.pdf. Accessed July 29, 2018. [Nonpublic site]
10. Crowe M. Do you know the difference between these adherence measures? https://www.pharmacytimes.com/contributor/michael-crowe-pharmd-mba-csp-fmpa/2015/07/do-you-know-the-difference-between-these-adherence-measures. Published July 5, 2015. Accessed September 13, 2019.
11. Watkins KE, Paddock SM, Zhang L, Wells KB. Improving care for depression in patients with comorbid substance misuse. Am J Psychiatry. 2006;163(1):125-132.
12. Magura S, Rosenblum A, Fong C. Factors associated with medication adherence among psychiatric outpatients at substance abuse risk. Open Addict J. 2011;4:58-64.
13. Magura S, Rosenblum A, Villano CL, Vogel HS, Fong C, Betzler T. Dual-focus mutual aid for co-occurring disorders: a quasi-experimental outcome evaluation study. Am J Drug Alcohol Abuse. 2008;34(1):61-74.
14. Libby AM, Fish DN, Hosokawa PW, et al. Patient-level medication regimen complexity across populations with chronic disease. Clin Ther. 2013;35(4):385-398.e1.
15. Manzano-García M, Pérez-Guerrero C, Álvarez de Sotomayor Paz M, Robustillo-Cortés MLA, Almeida-González CV, Morillo-Verdugo R. Identification of the medication regimen complexity index as an associated factor of nonadherence to antiretroviral treatment in HIV positive patients. Ann Pharmacother. 2018;52(9):862-867.
Genetics and epigenetics could predict response to RA therapies
Machine-based learning of genetic and epigenetic characteristics of patients with rheumatoid arthritis could help to predict who is likely to benefit from the biologic drugs adalimumab and etanercept, according to results from a longitudinal, observational cohort study.
In the study, machine learning models created by researchers from Utrecht University in the Netherlands using different parameters predicted true-positive rates for response to adalimumab ranging from 76% to 90% and true-negative rates ranging from 70% to 89%, while for etanercept true-positive rates ranged from about 60% to 80% and true-negative rates ranged from about 82% to 98%.
“These results suggest that we can accurately predict the clinical response before adalimumab and etanercept treatment using molecular signatures-based machine learning models, although the prediction accuracy of these molecular signatures differs between cell types and treatments, underlining the need to study more than one drug, cell type, or epigenetic layers,” first author Weiyang Tao and colleagues wrote in Arthritis & Rheumatology. The ability to predict which tumor necrosis factor inhibitor (TNFi) is the first choice for treatment would be highly beneficial in reducing the time to effective treatment, which has been extensively proven to be a paramount factor for achieving long-sustained disease remission, they noted.
The researchers analyzed gene expression and epigenetic signatures in 80 patients with rheumatoid arthritis prior to treatment with adalimumab or etanercept and then examined patients’ response to treatment at 6 months. They then used that information to build a machine learning model to try to predict treatment response.
Overall, 47.5% of patients were treated with adalimumab, and 52.5% were treated with etanercept. Among the adalimumab group, 53% had a good or moderate response to treatment at 6 months, and among those treated with etanercept, 45% had a good or moderate response.
While there were no differences in baseline clinical parameters between responders and nonresponders, the study found significant genetic and epigenetic differences between patients.
They identified 549 genes that showed significantly different levels of expression between responders and nonresponders treated with adalimumab – in particular, genes involved in DNA and nucleotide binding – and 460 genes that were differentially expressed between etanercept responders and nonresponders, including genes involved in TNF-receptor signaling. However, only 2% of these differentially expressed genes were common in both the adalimumab and etanercept groups, suggesting treatment responses for these two medications have distinct gene signatures.
Looking at DNA methylation, researchers found 16,141 CpG positions – sites of DNA methylation – that were differentially methylated between adalimumab responders and nonresponders, 46% of which were hypermethylated among responders but not nonresponders. In the etanercept group, there were 17,026 differentially methylated sites in responders and nonresponders, 76.3% of which were hypermethylated among responders.
The researchers also noted that among the adalimumab responders, the hypermethylated sites were more likely to be found in the upstream and promoter regions of genes, and on CpG islands.
“Thus, on epigenetic level, we observed a distinct hypermethylation pattern between adalimumab and etanercept responders, suggesting the role of epigenetics in defining response towards adalimumab and to etanercept in PBMCs [peripheral blood mononuclear cells],” the authors wrote.
Given the differences in gene signatures seen in the adalimumab responders and etanercept responders, researchers speculated that different cell types might be involved in the responses to these two treatments. They undertook RNA sequencing on the variety of immune cell types known to be involved in rheumatoid arthritis, which revealed gene-expression differences between adalimumab responders and nonresponders in their CD4+ T cells but not in monocytes. However, the gene-expression differences between etanercept responders and nonresponders were seen in both CD4+ T cells and monocytes.
The study was supported by AbbVie, which manufactures adalimumab, and two authors were supported by the China Scholarship Council and the Netherlands Organization for Scientific Research. No conflicts of interest were declared.
SOURCE: Tao W et al. Arthritis Rheumatol. 2020 Sep 10. doi: 10.1002/art.41516.
FROM ARTHRITIS & RHEUMATOLOGY
Pandemic drives demand for self-managed abortions
Requests for self-managed abortion via a telemedicine service increased by 27% from March 20, 2020, to April 11, 2020, in the United States in the wake of widespread lockdowns and shelter-in-place directives because of the COVID-19 pandemic, based on data from a provider of such services.

Access to abortion care is challenging in many areas under ordinary circumstances, but the disruption of the COVID-19 pandemic led to many states suspending or limiting in-clinic services, wrote Abigail R.A. Aiken, MD, PhD, of the University of Texas at Austin and colleagues.
“As a result, people may increasingly be seeking self-managed abortion outside the formal health care system,” they said.
In a research letter published in Obstetrics & Gynecology, the investigators reviewed request data from Aid Access, a telemedicine service that provides medication for abortion at up to 10 weeks’ gestation for users who complete an online consultation form. They also collected data on the implementation and scope of COVID-19–related abortion restrictions by state.
The analysis included all 49,935 requests made between January 1, 2019, and April 11, 2020.
Overall, the rate of requests for self-managed medical abortions increased significantly, by 27%, during the period from March 20, 2020, to April 11, 2020, which reflected the average period after clinic restrictions or closures at the state level. A total of 11 states showed individually significant increases in requests for self-managed medical abortions, with the highest of 94% in Texas and the lowest of 22% in Ohio. In these 11 states, the median time spent at home was 5% higher than in states without significant increases in requests for self-managed medical abortions during the same period. These states also had “particularly high COVID-19 rates or more severe COVID-19–related restrictions on in-clinic abortion access,” the researchers noted.
Patients want alternatives to in-person care
“Our results may reflect two distinct phenomena,” Dr. Aiken and associates wrote. “First, more people may be seeking abortion through all channels, whether due to COVID-19 risks during pregnancy, reduced access to prenatal care, or the pandemic-related economic downturn. Second, there may be shift in demand from in-clinic to self-managed abortion during the pandemic, possibly owing to fear of infection during in-person care or inability to get to a clinic because of childcare and transit disruptions,” they explained.
The study findings were limited by the inability to measure all options for women to achieve self-managed abortions and a lack of power to detect changes in states with low request numbers or where restrictions were implemented at later dates, the researchers noted. However, the results suggest that telemedicine services for medication abortion should be a policy priority because patients may continue to seek alternatives while in-clinic services remain restricted, they said.
In fact, “the World Health Organization recommends telemedicine and self-management abortion-care models during the pandemic, and the United Kingdom has temporarily implemented fully remote provision of abortion medications,” the researchers wrote. However, similar strategies in the United States “would depend on sustained changes to the U.S. Food and Drug Administration’s Risk Evaluation and Mitigation Strategy, which requires patients to collect mifepristone at a hospital or medical facility, as well as changes to state-specific laws that prohibit remote provider consultation,” Dr. Aiken and associates concluded.
Lift barriers to protect patients
Eve Espey, MD, of the University of New Mexico, Albuquerque, said in an interview.
“As background, state abortion restrictions have increased exponentially over the last decade, while research over the same time period has demonstrated the safety of telemedicine abortion – a form of self-managed abortion – with no in-person visit for appropriate candidates,” she said.
“Enter the coronavirus pandemic with safety concerns related to in-person medical visits and certain states leveraging the opportunity to enact even more stringent abortion restrictions. Unsurprisingly, the result, as documented in this excellent research report, is a significant increase in requests for telemedicine abortion in many states, particularly the most restrictive, from the single online service in the United States, Aid Access,” said Dr. Espey.
“Barriers to self-managed abortion include the [FDA] Risk Evaluation and Mitigation Strategy for mifepristone, a set of unnecessary restrictions requiring that providers meet certain qualifications and dispense the medication only in a clinic, office, or hospital,” she said. “The REMS precludes the use of telemedicine abortion; Aid Access and the FDA are in legal proceedings,” she noted.
“Most recently, the [American Civil Liberties Union] sued the FDA on behalf of a coalition of medical experts led by [American College of Obstetricians and Gynecologists] to suspend the REMS for mifepristone during the COVID public health emergency, to allow patients to receive the medications for early abortion without a visit to a health care provider,” Dr. Espey said. “Fortunately, a federal district court required the temporary suspension of the in-person dispensing restriction. Although this is a great step to improve abortion access during the pandemic, a permanent removal of the REMS would pave the way for ongoing safe, effective, and patient-centered early abortion care,” noted Dr. Espey, who was asked to comment on the research letter.
Dr. Aiken disclosed serving as a consultant for Agile Therapeutics, and a coauthor is the founder and director of Aid Access. Dr. Espey had no financial conflicts to disclose. She is a member of the Ob.Gyn. News Editorial Advisory Board.
SOURCE: Aiken ARA et al. Obstet Gynecol. 2020 Jul 21. doi: 10.1097/AOG.0000000000004081.
Requests for self-managed abortion via a telemedicine service increased by 27% from March 20, 2020, to April 11, 2020, in the United States in the wake of widespread lockdowns and shelter-in-place directives because of the COVID-19 pandemic, based on data from a provider of such services.
Access to abortion care is challenging in many areas under ordinary circumstances, but the disruption of the COVID-19 pandemic led to many states suspending or limiting in-clinic services, wrote Abigail R.A. Aiken, MD, PhD, of the University of Texas at Austin and colleagues.
“As a result, people may increasingly be seeking self-managed abortion outside the formal health care system,” they said.
In a research letter published in Obstetrics & Gynecology, the investigators reviewed request data from Aid Access, a telemedicine service that provides medication for abortion at up to 10 weeks’ gestation for users who complete an online consultation form. They also collected data on the implementation and scope of COVID-19–related abortion restrictions by state.
The analysis included all 49,935 requests made between January 1, 2019, and April 11, 2020.
Overall, the rate of requests for self-managed medical abortions increased significantly, by 27%, during the period from March 20, 2020, to April 11, 2020, which reflected the average period after clinic restrictions or closures at the state level. A total of 11 states showed individually significant increases in requests for self-managed medical abortions, with the highest of 94% in Texas and the lowest of 22% in Ohio. In these 11 states, the median time spent at home was 5% higher than in states without significant increases in requests for self-managed medical abortions during the same period. These states also had “particularly high COVID-19 rates or more severe COVID-19–related restrictions on in-clinic abortion access,” the researchers noted.
Patients want alternatives to in-person care
“Our results may reflect two distinct phenomena,” Dr. Aiken and associates wrote. “First, more people may be seeking abortion through all channels, whether due to COVID-19 risks during pregnancy, reduced access to prenatal care, or the pandemic-related economic downturn. Second, there may be shift in demand from in-clinic to self-managed abortion during the pandemic, possibly owing to fear of infection during in-person care or inability to get to a clinic because of childcare and transit disruptions,” they explained.
The study findings were limited by the inability to measure all options for women to achieve self-managed abortions and a lack of power to detect changes in states with low request numbers or where restrictions were implemented at later dates, the researchers noted. However, the results suggest that telemedicine services for medication abortion should be a policy priority because patients may continue to seek alternatives while in-clinic services remain restricted, they said.
In fact, “the World Health Organization recommends telemedicine and self-management abortion-care models during the pandemic, and the United Kingdom has temporarily implemented fully remote provision of abortion medications,” the researchers wrote. However, similar strategies in the United States “would depend on sustained changes to the U.S. Food and Drug Administration’s Risk Evaluation and Mitigation Strategy, which requires patients to collect mifepristone at a hospital or medical facility, as well as changes to state-specific laws that prohibit remote provider consultation,” Dr. Aiken and associates concluded.
Lift barriers to protect patients
Eve Espey, MD, of the University of New Mexico, Albuquerque, said in an interview.
“As background, state abortion restrictions have increased exponentially over the last decade, while research over the same time period has demonstrated the safety of telemedicine abortion – a form of self-managed abortion – with no in-person visit for appropriate candidates,” she said.
“Enter the coronavirus pandemic with safety concerns related to in-person medical visits and certain states leveraging the opportunity to enact even more stringent abortion restrictions. Unsurprisingly, the result, as documented in this excellent research report, is a significant increase in requests for telemedicine abortion in many states, particularly the most restrictive, from the single online service in the United States, Aid Access,” said Dr. Espey.
“Barriers to self-managed abortion include the [FDA] Risk Evaluation and Mitigation Strategy for mifepristone, a set of unnecessary restrictions requiring that providers meet certain qualifications and dispense the medication only in a clinic, office, or hospital,” she said. “The REMS precludes the use of telemedicine abortion; Aid Access and the FDA are in legal proceedings,” she noted.
“Most recently, the [American Civil Liberties Union] sued the FDA on behalf of a coalition of medical experts led by [American College of Obstetricians and Gynecologists] to suspend the REMS for mifepristone during the COVID public health emergency, to allow patients to receive the medications for early abortion without a visit to a health care provider,” Dr. Espey said. “Fortunately, a federal district court required the temporary suspension of the in-person dispensing restriction. Although this is a great step to improve abortion access during the pandemic, a permanent removal of the REMS would pave the way for ongoing safe, effective, and patient-centered early abortion care,” noted Dr. Espey, who was asked to comment on the research letter.
Dr. Aiken disclosed serving as a consultant for Agile Therapeutics, and a coauthor is the founder and director of Aid Access. Dr. Espey had no financial conflicts to disclose. She is a member of the Ob.Gyn. News Editorial Advisory Board.
SOURCE: Aiken ARA et al. Obstet Gynecol. 2020 Jul 21. doi: 10.1097/AOG.0000000000004081.
FROM OBSTETRICS & GYNECOLOGY

Higher glycemic time in range may benefit T2D patients
Patients with type 2 or type 1 diabetes who stay in a blood glucose range of 70-180 mg/dL at least 70% of the time have the lowest rates of major adverse coronary events, severe hypoglycemic episodes, and microvascular events, according to a post hoc analysis of data collected from 5,774 patients with type 2 diabetes.

Data collected by the DEVOTE trial showed that every additional 10% of the time that a patient with type 2 diabetes (T2D) spent in their target range for blood glucose linked with a significant 6% reduced rate for developing a major adverse cardiovascular event (MACE), Richard M. Bergenstal, MD, said at the virtual annual meeting of the European Association for the Study of Diabetes.
For every 10% increase in time in range (TIR), patients showed an average 10% drop in their incidence of severe hypoglycemic episodes.
Increasing evidence from post hoc analyses
These findings confirmed a prior post hoc analysis of data collected in the DCCT trial (NCT00360815), which were published in the New England Journal of Medicine, although those results showed significant relationships between increased TIR and decreased rates of retinopathy and microalbuminuria. For every 10% drop in TIR, retinopathy rose by 64% and microalbuminuria increased by 40%, according to a post hoc analysis of the DCCT data that Dr. Bergenstal helped run and was published in Diabetes Care.
“It’s becoming clear that time in range is an important metric for diabetes management, and our new findings and those previously reported with the DCCT data make it look like time in range is becoming a good marker for clinical outcomes as well,” said Dr. Bergenstal, an endocrinologist at the Park Nicollet Clinic in Minneapolis.
“It’s a new concept, getting time-in-range data,” said Dr. Bergenstal, who was a coauthor of recommendations from Diabetes Care that were made in 2019 by an expert panel organized by the Advanced Technologies & Treatments for Diabetes Congress. “We think this will be a good marker to keep glycemia in a safe range, and the results look positive.” Patients who stay in the blood glucose range of 70-180 mg/dL (3.9-10.0 mmol/L) at least 70% of the time generally have an hemoglobin A1c of about 7%, which is what makes it a good target for patients and clinicians to focus on. Patients with a 50% TIR rate generally have an HbA1c of about 8%.
But a TIR assessment can be more informative than HbA1c, said the 2019 recommendations document. It called TIR assessments “appropriate and useful as clinical targets and outcome measurements that complement A1c for a wide range of people with diabetes.”
Data mining from DEVOTE
The analysis run by Dr. Bergenstal and his associates used data from 5,774 of the 7,637 patients enrolled in the DEVOTE trial, for whom adequate longitudinal blood glucose data were available to derive and track TIR. DEVOTE had the primary aim of comparing two different types of insulin in patients with T2D, according to its explanation in the New England Journal of Medicine. The DEVOTE patients did not undergo routine continuous blood glucose monitoring, so derivation of TIR was the only option with the dataset, Dr. Bergenstal said. “We’re trying to get continuous blood monitoring into T2D trials,” he said.
The post hoc analysis showed that, during the study’s follow-up of just under 2 years, patients who maintained a derived TIR of 70%-100% had about a 6% MACE rate, which peaked at nearly twice that in patients whose TIR was 30% or less. The analysis showed a roughly positive linear relationship between TIR and MACE rates across the range of TIR values. In an adjusted analysis, patients with at least a 70% TIR had a significant 31% lower rate of MACE events, compared with patients whose TIR was 50% or less.
A second analysis that looked for the association between TIR and incidence of hypoglycemic episodes showed a somewhat similar positive relationship, with incidence rates of severe hypoglycemia episodes of about 4%-5% among patients with a TIR of 70% or greater, and a rate of about 7% in patients with a TIR of 30% or less, spiking to 14% among patients with a TIR of 10% or less. In an adjusted analysis, patients with a TIR of at least 70% had a significant 46% lower rate of severe hypoglycemic events, compared with patients whose TIR was 50% or less. This finding belies a common misconception that the tighter glycemic control that produces a higher TIR will lead to increased episodes of severe hypoglycemia, Dr. Bergenstal noted.
He also reported less extensive data on microvascular events. In an adjusted analysis, patients with a TIR of at least 70% had a significant 40% cut in these events compared with patients with 50% or less TIR.
DEVOTE was funded by Novo Nordisk. Dr. Bergenstal has had financial relationships with Novo Nordisk and several other companies.
SOURCE: Bergenstal R et al. EASD 2020, abstract 159.
Patients with type 2 or type 1 diabetes who stay in a blood glucose range of 70-180 mg/dL at least 70% of the time have the lowest rates of major adverse coronary events, severe hypoglycemic episodes, and microvascular events, according to a post hoc analysis of data collected from 5,774 patients with type 2 diabetes.
Data collected by the DEVOTE trial showed that every additional 10% of the time that a patient with type 2 diabetes (T2D) spent in their target range for blood glucose linked with a significant 6% reduced rate for developing a major adverse cardiovascular event (MACE), Richard M. Bergenstal, MD, said at the virtual annual meeting of the European Association for the Study of Diabetes.
For every 10% increase in time in range (TIR), patients showed an average 10% drop in their incidence of severe hypoglycemic episodes.
Increasing evidence from post hoc analyses
These findings confirmed a prior post hoc analysis of data collected in the DCCT trial (NCT00360815), which were published in the New England Journal of Medicine, although those results showed significant relationships between increased TIR and decreased rates of retinopathy and microalbuminuria. For every 10% drop in TIR, retinopathy rose by 64% and microalbuminuria increased by 40%, according to a post hoc analysis of the DCCT data that Dr. Bergenstal helped run and was published in Diabetes Care.
“It’s becoming clear that time in range is an important metric for diabetes management, and our new findings and those previously reported with the DCCT data make it look like time in range is becoming a good marker for clinical outcomes as well,” said Dr. Bergenstal, an endocrinologist at the Park Nicollet Clinic in Minneapolis.
“It’s a new concept, getting time-in-range data,” said Dr. Bergenstal, who was a coauthor of recommendations from Diabetes Care that were made in 2019 by an expert panel organized by the Advanced Technologies & Treatments for Diabetes Congress. “We think this will be a good marker to keep glycemia in a safe range, and the results look positive.” Patients who stay in the blood glucose range of 70-180 mg/dL (3.9-10.0 mmol/L) at least 70% of the time generally have an hemoglobin A1c of about 7%, which is what makes it a good target for patients and clinicians to focus on. Patients with a 50% TIR rate generally have an HbA1c of about 8%.
But a TIR assessment can be more informative than HbA1c, said the 2019 recommendations document. It called TIR assessments “appropriate and useful as clinical targets and outcome measurements that complement A1c for a wide range of people with diabetes.”
Data mining from DEVOTE
The analysis run by Dr. Bergenstal and his associates used data from 5,774 of the 7,637 patients enrolled in the DEVOTE trial, for whom adequate longitudinal blood glucose data were available to derive and track TIR. DEVOTE had the primary aim of comparing two different types of insulin in patients with T2D, according to its explanation in the New England Journal of Medicine. The DEVOTE patients did not undergo routine continuous blood glucose monitoring, so derivation of TIR was the only option with the dataset, Dr. Bergenstal said. “We’re trying to get continuous blood monitoring into T2D trials,” he said.
The post hoc analysis showed that, during the study’s follow-up of just under 2 years, patients who maintained a derived TIR of 70%-100% had about a 6% MACE rate, which peaked at nearly twice that in patients whose TIR was 30% or less. The analysis showed a roughly positive linear relationship between TIR and MACE rates across the range of TIR values. In an adjusted analysis, patients with at least a 70% TIR had a significant 31% lower rate of MACE events, compared with patients whose TIR was 50% or less.
A second analysis that looked for the association between TIR and incidence of hypoglycemic episodes showed a somewhat similar positive relationship, with incidence rates of severe hypoglycemia episodes of about 4%-5% among patients with a TIR of 70% or greater, and a rate of about 7% in patients with a TIR of 30% or less, spiking to 14% among patients with a TIR of 10% or less. In an adjusted analysis, patients with a TIR of at least 70% had a significant 46% lower rate of severe hypoglycemic events, compared with patients whose TIR was 50% or less. This finding belies a common misconception that the tighter glycemic control that produces a higher TIR will lead to increased episodes of severe hypoglycemia, Dr. Bergenstal noted.
He also reported less extensive data on microvascular events. In an adjusted analysis, patients with a TIR of at least 70% had a significant 40% cut in these events compared with patients with 50% or less TIR.
DEVOTE was funded by Novo Nordisk. Dr. Bergenstal has had financial relationships with Novo Nordisk and several other companies.
SOURCE: Bergenstal R et al. EASD 2020, abstract 159.
FROM EASD 2020
FDA orders stronger warnings on benzodiazepines
The Food and Drug Administration wants updated boxed warnings on benzodiazepines to reflect the “serious” risks of abuse, misuse, addiction, physical dependence, and withdrawal reactions associated with these medications.
![]()
“The current prescribing information for benzodiazepines does not provide adequate warnings about these serious risks and harms associated with these medicines so they may be prescribed and used inappropriately,” the FDA said in a safety communication.
The FDA also wants revisions to the patient medication guides for benzodiazepines to help educate patients and caregivers about these risks.
“While benzodiazepines are important therapies for many Americans, they are also commonly abused and misused, often together with opioid pain relievers and other medicines, alcohol, and illicit drugs,” FDA Commissioner Stephen M. Hahn, MD, said in a statement.
“We are taking measures and requiring new labeling information to help health care professionals and patients better understand that, while benzodiazepines have many treatment benefits, they also carry with them an increased risk of abuse, misuse, addiction, and dependence,” said Dr. Hahn.
Ninety-two million prescriptions in 2019
Benzodiazepines are widely used to treat anxiety, insomnia, seizures, and other conditions, often for extended periods of time.
According to the FDA, in 2019, an estimated 92 million benzodiazepine prescriptions were dispensed from U.S. outpatient pharmacies, most commonly alprazolam, clonazepam, and lorazepam.
Data from 2018 show that roughly 5.4 million people in the United States 12 years and older abused or misused benzodiazepines in the previous year.
Although the precise risk of benzodiazepine addiction remains unclear, population data “clearly indicate that both primary benzodiazepine use disorders and polysubstance addiction involving benzodiazepines do occur,” the FDA said.
Data from the National Survey on Drug Use and Health from 2015-2016 suggest that half million community-dwelling U.S. adults were estimated to have a benzodiazepine use disorder.
Jump in overdose deaths

Overdose deaths involving benzodiazepines jumped from 1,298 in 2010 to 11,537 in 2017 – an increase of more 780%. Most of these deaths involved benzodiazepines taken with prescription opioids.
the FDA said.
The agency urged particular caution when prescribing benzodiazepines with opioids and other central nervous system depressants, which has resulted in serious adverse events including severe respiratory depression and death.
The FDA also says patients and caregivers should be warned about the risks of abuse, misuse, addiction, dependence, and withdrawal with benzodiazepines and the associated signs and symptoms.
Physicians are encouraged to report adverse events involving benzodiazepines or other medicines to the FDA’s MedWatch program.
A version of this article originally appeared on Medscape.com.
The Food and Drug Administration wants updated boxed warnings on benzodiazepines to reflect the “serious” risks of abuse, misuse, addiction, physical dependence, and withdrawal reactions associated with these medications.
![]()
“The current prescribing information for benzodiazepines does not provide adequate warnings about these serious risks and harms associated with these medicines so they may be prescribed and used inappropriately,” the FDA said in a safety communication.
The FDA also wants revisions to the patient medication guides for benzodiazepines to help educate patients and caregivers about these risks.
“While benzodiazepines are important therapies for many Americans, they are also commonly abused and misused, often together with opioid pain relievers and other medicines, alcohol, and illicit drugs,” FDA Commissioner Stephen M. Hahn, MD, said in a statement.
“We are taking measures and requiring new labeling information to help health care professionals and patients better understand that, while benzodiazepines have many treatment benefits, they also carry with them an increased risk of abuse, misuse, addiction, and dependence,” said Dr. Hahn.
Ninety-two million prescriptions in 2019
Benzodiazepines are widely used to treat anxiety, insomnia, seizures, and other conditions, often for extended periods of time.
According to the FDA, in 2019, an estimated 92 million benzodiazepine prescriptions were dispensed from U.S. outpatient pharmacies, most commonly alprazolam, clonazepam, and lorazepam.
Data from 2018 show that roughly 5.4 million people in the United States 12 years and older abused or misused benzodiazepines in the previous year.
Although the precise risk of benzodiazepine addiction remains unclear, population data “clearly indicate that both primary benzodiazepine use disorders and polysubstance addiction involving benzodiazepines do occur,” the FDA said.
Data from the National Survey on Drug Use and Health from 2015-2016 suggest that half million community-dwelling U.S. adults were estimated to have a benzodiazepine use disorder.
Jump in overdose deaths
Overdose deaths involving benzodiazepines jumped from 1,298 in 2010 to 11,537 in 2017 – an increase of more 780%. Most of these deaths involved benzodiazepines taken with prescription opioids.
the FDA said.
The agency urged particular caution when prescribing benzodiazepines with opioids and other central nervous system depressants, which has resulted in serious adverse events including severe respiratory depression and death.
The FDA also says patients and caregivers should be warned about the risks of abuse, misuse, addiction, dependence, and withdrawal with benzodiazepines and the associated signs and symptoms.
Physicians are encouraged to report adverse events involving benzodiazepines or other medicines to the FDA’s MedWatch program.
A version of this article originally appeared on Medscape.com.
Lower rituximab doses may be as effective, safer in MS
Further data suggesting that (MS), according to a new observational study. “We showed similar numbers of relapses, MRI new/active lesions, and effects on disability with a higher and lower dose of rituximab over a median follow of 16 months,” said lead author, Luciana Midaglia, MD, Multiple Sclerosis Centre of Catalonia (Cemcat) at Vall d’Hebron University Hospital, Barcelona. “But adverse effects – particularly frequency of infection – were increased in the high-dose group.”
Dr. Midaglia presented the findings at the recent Joint European Committee for Treatment and Research in Multiple Sclerosis–Americas Committee for Treatment and Research in Multiple Sclerosis (ECTRIMS-ACTRIMS) 2020, this year known as MSVirtual2020.
“There haven’t been large studies of rituximab in MS as the company [Genentech/Roche] prioritized development of ocrelizumab over rituximab,” she explained. Rituximab has, therefore, never been approved for this indication. But it is available for several other conditions, and it is often used off label for MS.
“Although we now have a lot of experience with rituximab in MS, a dosage regimen has not been standardized,” Dr. Midaglia noted.
The current study was conducted to compare the efficacy and safety of two different dosage regimens of rituximab used at two different Catalan MS centers.
In the Barcelona center, 249 patients received a regimen of 2 g IV for the first three 6-month cycles followed by 1 g every 6 months thereafter (higher-dose group). In the Girona center, 54 patients received just one loading dose of 2 g followed by 500 mg every 6 months thereafter (lower-dose group).
Patients were followed up clinically every 6 months, and MRI brain scans were performed at baseline and yearly thereafter. Blood samples for safety and B cell/immunoglobulin monitoring were drawn at 3 months after rituximab infusions.
Results showed that the annualized relapse rate reduced by 87% (from 0.4 to 0.05; P < .001) in the higher-dose cohort, and by 90% (from 0.31 to 0.03; P = .018) in the lower-dose cohort.
The Expanded Disability Status Scale score remained stable or improved in 83% of the higher-dose group versus 72% of the lower-dose group (P = .09).
Contrast-enhancing lesions were reduced by 92% by 12 months and by 100% by 36 months in the higher-dose group and by 81% and 100%, respectively, in the lower-dose group.
New T2 lesions were present in 19% of patients at 12 months and in 12% at 36 months in the higher-dose group and in 16% and 0%, respectively, in the lower-dose group.
Reductions in B cell levels were similar with both doses. However, a reduced rate of adverse effects, mainly infections, was seen in the lower-dose group.
Infections were reported in 7.2% of the higher-dose group and 3.7% of the lower-dose group at 1 year, in 9.7% versus 0% in the second year, and in 9.7% versus 0% in the third year. Urinary tract infections, followed by respiratory infections, were the most prevalent.
A randomized phase 3 study is now underway testing an even lower dose of rituximab. The trial, known as RIDOSE-MS, is comparing maintenance doses of 500 mg every 6 months and 500 mg every 12 months.
Dr. Midaglia said that most centers are using higher doses of rituximab – similar to the Barcelona cohort in this study.
“After this study, we will we now start a new protocol and use the lower dose for all MS patients,” she said.
She reported that her hospital has been using rituximab extensively in MS.
“There were delays to ocrelizumab being introduced in Spain, and while we were waiting, we started using rituximab,” she said. “We believe it is similarly effective to ocrelizumab. It has exactly the same mechanism of action. The only difference is that rituximab is a chimeric antibody while ocrelizumab is fully humanized.”
While rituximab has not had the validation of a full phase 3 trial, she added, “there are data available from several smaller studies and we feel we have learned how to use it in the real world, but we don’t have an approved dosage schedule. We started off using the dose approved for use in rheumatological and hematological conditions.”
Now that ocrelizumab is approved, Dr. Midaglia said they are using that drug for the patients who meet the approved criteria, but there are many patients who don’t qualify.
“For example, in progressive MS, ocrelizumab has quite a narrow indication – it is not reimbursed for patients without any inflammatory activity. So for these patients, we tend to use rituximab,” she noted.
“While there is no good data on its efficacy in these patients, we believe it has some effect and there is no other option at present. Rituximab is an inexpensive drug and has a long safety record in other conditions, so we feel it’s worth a try,” Dr. Midaglia concluded. “And now we have better data on the optimal dosage.”
Commenting on the study, Daniel Ontaneda, MD, comoderator of the session at which the study was presented, said: “Rituximab is not an [Food and Drug Administration]–approved medication for MS, but it has been used in clinical practice quite extensively in the U.S. and also in Europe. The study is of interest as it showed that the lower dose of rituximab achieved good control of disease activity.”
Dr. Ontaneda, a neurologist at the Mellen Center for MS at the Cleveland Clinic, Ohio, added: “Many centers have been using lower doses or less frequent infusions and this study supports this practice. Some degree of residual confounding in the study in the differences in side effects may be related to the two different sites, but overall I think these results add to the real-world observational data now available for anti-CD20 therapies.”
Dr. Midaglia reported receiving travel funding from Genzyme, Roche, Biogen Idec, and Novartis, and personal fees for lectures from Roche.
A version of this article originally appeared on Medscape.com.
FROM MSVIRTUAL2020
Nationwide study questions routine long-term beta-blocker post MI
Current American and European guidelines recommending long-term beta-blocker therapy following an acute MI appear to be obsolete in the modern reperfusion era, suggests an analysis of Danish registry data.
Those guidelines are based on old randomized trials of beta-blocker therapy conducted prior to introduction of routine percutaneous coronary intervention and modern multidrug optimal medical therapy for acute MI. There have been no prospective controlled studies in the reperfusion era. And a new Danish national observational study strongly suggests it’s time to reexamine the beta-blocker recommendation, Anders Holt, MD, said at the virtual annual congress of the European Society of Cardiology.
“Stable, optimally treated MI patients do not seem to benefit from beta-blocker treatment exceeding 3 months post hospitalization – bearing in mind this doesn’t apply to patients with other indications for beta-blockers, like heart failure or atrial fibrillation,” said Dr. Holt of Copenhagen University Hospital.
His analysis of Danish national registry data on more than 30,000 patients hospitalized for acute MI during 2003-2018 earned him the annual ESC Young Investigator Award in Population Science.

“This was a crisp and clear presentation of a very creative use of observational epidemiology to try to understand the length of therapy that may or may not be appropriate,” commented award session cochair Paul M. Ridker, MD, director of the Center for Cardiovascular Disease Prevention at Brigham and Women’s Hospital and professor of medicine at Harvard Medical School, both in Boston.
Dr. Holt reported on 30,177 patients optimally treated for a first MI in Danish hospitals during 2003-2018, none of whom had a prior indication or contraindication for beta-blocker therapy. “Optimally treated” meant they underwent percutaneous coronary revascularization and were discharged on a statin and aspirin. As a study requirement, all had to be stable 90 days post hospitalization, at which point 24,770 of the patients were on long-term beta-blocker therapy, and 5,407 (18%) were not. The two groups were comparable in terms of age, sex, comorbidities, and baseline medications. All patients were followed through the registries for a maximum of 3 years, the duration of beta-blocker therapy post MI recommended in American Heart Association/American College of Cardiology guidelines. (The Danish Society of Cardiology recommends 2 years.)
At 3 years post MI, there was no between-group difference in a composite outcome comprising cardiovascular death, recurrent MI, heart failure, stroke, angina, or a cardiac procedure, with a rate of 22.9% in the beta-blocker group and 21.6% in patients not on long-term beta-blocker therapy. The rate of recurrent MI was identical at 6.7% in both groups. Cardiovascular death occurred during 3 years of follow-up in 1.4% of patients on beta-blocker therapy and 1.7% who weren’t, a nonsignificant difference.
“We saw no evidence of any cardioprotective effect, but no increased risk of adverse events resulting in hospitalization, either,” Dr. Holt observed. “I would like to acknowledge that no evidence of effect does not necessarily equal evidence of no effect, but even if there was an effect we can with fair certainty say that it’s probably quite minimal.”
He noted that the Danish registry data indicates that each year since 2012 has shown a growing trend for Danish patients to dispense with long-term beta-blocker therapy after an acute MI.
“This might indicate we are nudging toward a change in practice, where more physicians are thinking that long-term beta-blocker therapy might not be indicated for all MI patients in the reperfusion era,” according to Dr. Holt.
Asked by the four-judge award panel about the possibility of unmeasured confounding in this observational study, Dr Holt responded: “I would be very cautious about asking patients to stop beta-blocker therapy after 3 months just based on this observational data. We can’t speak to causality in an observational study.” But he added that “well-designed observational studies provide valuable data regarding this topic and should not be ignored. They should possibly influence the guidelines and the designs for upcoming randomized trials.”
He conducted several supplementary analyses designed to address the possibility of unevenly distributed unmeasured confounding in the registry study. These analyses proved reassuring. A positive exposure control analysis compared 3-year outcomes in patients who remained on long-term statin therapy and those who didn’t. As expected, outcomes were significantly better in those who did: a 3-year composite outcome rate of 22.1%, compared with 32.1% in patients not on a statin; a cardiovascular death rate of 1.3% with and 2.1% without statin therapy; a recurrent MI rate of 6.6%, compared with 10.1% without a statin; and a 2.8% all-cause mortality with and 5.4% without statin therapy.
In contrast, all-cause mortality was unaffected by whether or not patients were on long-term beta-blocker therapy. And in a negative exposure outcome analysis, no association was found between beta-blocker therapy and the risk of hospitalization for pneumonia, as to be expected if the beta-blocker and no-beta-blocker groups were comparable in key respects.
Dr. Holt reported having no financial conflicts regarding his study.
Current American and European guidelines recommending long-term beta-blocker therapy following an acute MI appear to be obsolete in the modern reperfusion era, suggests an analysis of Danish registry data.
Those guidelines are based on old randomized trials of beta-blocker therapy conducted prior to introduction of routine percutaneous coronary intervention and modern multidrug optimal medical therapy for acute MI. There have been no prospective controlled studies in the reperfusion era. And a new Danish national observational study strongly suggests it’s time to reexamine the beta-blocker recommendation, Anders Holt, MD, said at the virtual annual congress of the European Society of Cardiology.
“Stable, optimally treated MI patients do not seem to benefit from beta-blocker treatment exceeding 3 months post hospitalization – bearing in mind this doesn’t apply to patients with other indications for beta-blockers, like heart failure or atrial fibrillation,” said Dr. Holt of Copenhagen University Hospital.
His analysis of Danish national registry data on more than 30,000 patients hospitalized for acute MI during 2003-2018 earned him the annual ESC Young Investigator Award in Population Science.
“This was a crisp and clear presentation of a very creative use of observational epidemiology to try to understand the length of therapy that may or may not be appropriate,” commented award session cochair Paul M. Ridker, MD, director of the Center for Cardiovascular Disease Prevention at Brigham and Women’s Hospital and professor of medicine at Harvard Medical School, both in Boston.
Dr. Holt reported on 30,177 patients optimally treated for a first MI in Danish hospitals during 2003-2018, none of whom had a prior indication or contraindication for beta-blocker therapy. “Optimally treated” meant they underwent percutaneous coronary revascularization and were discharged on a statin and aspirin. As a study requirement, all had to be stable 90 days post hospitalization, at which point 24,770 of the patients were on long-term beta-blocker therapy, and 5,407 (18%) were not. The two groups were comparable in terms of age, sex, comorbidities, and baseline medications. All patients were followed through the registries for a maximum of 3 years, the duration of beta-blocker therapy post MI recommended in American Heart Association/American College of Cardiology guidelines. (The Danish Society of Cardiology recommends 2 years.)
At 3 years post MI, there was no between-group difference in a composite outcome comprising cardiovascular death, recurrent MI, heart failure, stroke, angina, or a cardiac procedure, with a rate of 22.9% in the beta-blocker group and 21.6% in patients not on long-term beta-blocker therapy. The rate of recurrent MI was identical at 6.7% in both groups. Cardiovascular death occurred during 3 years of follow-up in 1.4% of patients on beta-blocker therapy and 1.7% who weren’t, a nonsignificant difference.
“We saw no evidence of any cardioprotective effect, but no increased risk of adverse events resulting in hospitalization, either,” Dr. Holt observed. “I would like to acknowledge that no evidence of effect does not necessarily equal evidence of no effect, but even if there was an effect we can with fair certainty say that it’s probably quite minimal.”
He noted that the Danish registry data indicates that each year since 2012 has shown a growing trend for Danish patients to dispense with long-term beta-blocker therapy after an acute MI.
“This might indicate we are nudging toward a change in practice, where more physicians are thinking that long-term beta-blocker therapy might not be indicated for all MI patients in the reperfusion era,” according to Dr. Holt.
Asked by the four-judge award panel about the possibility of unmeasured confounding in this observational study, Dr Holt responded: “I would be very cautious about asking patients to stop beta-blocker therapy after 3 months just based on this observational data. We can’t speak to causality in an observational study.” But he added that “well-designed observational studies provide valuable data regarding this topic and should not be ignored. They should possibly influence the guidelines and the designs for upcoming randomized trials.”
He conducted several supplementary analyses designed to address the possibility of unevenly distributed unmeasured confounding in the registry study. These analyses proved reassuring. A positive exposure control analysis compared 3-year outcomes in patients who remained on long-term statin therapy and those who didn’t. As expected, outcomes were significantly better in those who did: a 3-year composite outcome rate of 22.1%, compared with 32.1% in patients not on a statin; a cardiovascular death rate of 1.3% with and 2.1% without statin therapy; a recurrent MI rate of 6.6%, compared with 10.1% without a statin; and a 2.8% all-cause mortality with and 5.4% without statin therapy.
In contrast, all-cause mortality was unaffected by whether or not patients were on long-term beta-blocker therapy. And in a negative exposure outcome analysis, no association was found between beta-blocker therapy and the risk of hospitalization for pneumonia, as to be expected if the beta-blocker and no-beta-blocker groups were comparable in key respects.
Dr. Holt reported having no financial conflicts regarding his study.
FROM ESC CONGRESS 2020
Keep desiccated thyroid as a treatment option for hypothyroidism
new research shows.
The findings are “unanticipated ... given concerns for variability between batches of desiccated thyroid cited by national guidelines,” wrote the authors of the study, which was published this month in the Annals of Family Medicine.
In the trial, patients who had been treated for hypothyroidism at Kaiser Permanente Colorado were matched retrospectively into groups of 450 patients each according to whether they were treated with desiccated thyroid or synthetic levothyroxine.
After a follow-up of 3 years, TSH values within normal ranges (0.320-5.500 uIU/mL) were seen at approximately the same rate among those treated with desiccated thyroid and those who received levothyroxine (79.1% vs. 79.3%; P = .905).
“This study showed that after 3 years TSH values in both groups remained within reference ranges approximately 80% of the time,” said Rolake Kuye, PharmD, and colleagues with Kaiser Permanente, in Denver, Colorado.
In an accompanying editorial, Jill Schneiderhan, MD, and Suzanna Zick, ND, MPH, of the University of Michigan, Ann Arbor, say the overall results indicate that the continued use of desiccated thyroid is warranted in some cases.
“Keeping desiccated thyroid medications as an option in our tool kit will allow for improved shared decision-making, while allowing for patient preference, and offer an option for those patients who remain symptomatic on levothyroxine monotherapy,” they advised.
Some variability still seen with desiccated thyroid
Desiccated thyroid (dehydrated porcine thyroid), which was long the standard of care, is still commonly used in the treatment of hypothyroidism, despite having been replaced beginning in the 1970s by synthetic levothyroxine in light of evidence that the former was associated with more variability in thyroid hormone levels.
Desiccated thyroid is still sold legally by prescription in the United States under the names Nature Thyroid, Thyroid USP, and Armour Thyroid and is currently used by up to 30% of patients with hypothyroidism, according to recent estimates.
Consistent with concerns about variability in thyroid hormone levels, the new study did show greater variability in TSH levels with desiccated thyroid when assessed on a visit-to-visit basis.
Dr. Kuye and coauthors therefore recommended that, “[f]or providers targeting a tighter TSH goal in certain patients, the decreased TSH variability with levothyroxine could be clinically meaningful.”
This long-term investigation is “much needed”
This new study adds important new insight to the ongoing debate over hypothyroidism treatment, said Dr. Schneiderhan and Dr. Zick in their editorial.
“[The study authors] begin a much-needed investigation into whether patients prescribed synthetic levothyroxine compared with desiccated thyroid had differences in TSH stability over the course of 3 years.
“Further prospective studies are needed to confirm these results and to explore differences in more diverse patient populations, such as Hashimoto’s thyroiditis, as well as on quality of life and other important patient-reported outcomes such as fatigue and weight gain,” the editorialists added.
“This study does, however, provide helpful information that desiccated thyroid products are a reasonable choice for treating some hypothyroid patients.”
For 60% of patients in both groups, TSH levels were within reference range for whole study
In the study, Dr. Kuye and colleagues matched patients (average age, 63 years; 90% women) in terms of characteristics such as race, comorbidities, and cholesterol levels.
Patients were excluded if they had been prescribed more than one agent for the treatment of hypothyroidism or if they had comorbid conditions, including a history of thyroid cancer or other related comorbidities, as well as pregnancy.
With respect to visit-to-visit TSH level variability, the lower rate among patients prescribed levothyroxine in comparison with patients prescribed desiccated thyroid was statistically significant (1.25 vs. 1.44; P = .015). Among 60% of patients in both groups, all TSH values measured during the study period were within reference ranges, however (P = .951).
The median number of TSH laboratory studies obtained during the study was four in the synthetic levothyroxine group and three for patients prescribed desiccated thyroid (P = .578).
There were some notable differences between the groups. Patients in the desiccated thyroid group had lower body mass index (P = .032), hemoglobin A1c levels (P = .041), and lower baseline TSH values (2.4 vs. 3.4 uIU/mL; P = .001). compared with those prescribed levothyroxine.
Limitations include the fact that the authors could not account for potentially important variables such as rates of adherence, differences in prescriber practice between agents, or the concurrent use of other medications.
Subjective outcomes not assessed: “One-size-fits-all approach doesn’t work”
The authors note they were not able to assess subjective outcomes, which, as noted by the editorialists, are particularly important in hypothyroidism.
“Emerging evidence shows that for many patients, symptoms persist despite normal TSH values,” Dr. Schneiderhan and Dr. Zick write.
They cite as an example a large study that found significant impairment in psychological well-being among patients treated with thyroxine replacement, despite their achieving normal TSH levels.
In addition, synthetic levothyroxine is associated with other uncertainties, such as complexities in the conversion of T4 to triiodothyronine (T3) that may disrupt thyroid metabolism in some patients.
In addition, there are differences in the amounts of thyroid replacement needed by certain groups, such as patients who have undergone thyroidectomies.
“The one-size-fits-all approach for treating hypothyroidism does not work ... for all patients,” they concluded.
The study authors and editorialists have disclosed no relevant financial relationships.
A version of this article originally appeared on Medscape.com.