User login
Which agent is best for neuromyelitis optica?
The Alexion-sponsored study was presented at the annual meeting of the European Committee for Treatment and Research in Multiple Sclerosis (ECTRIMS) by Dean Wingerchuk, MD, of the Mayo Clinic in Scottsdale, Ariz.
Other experts in the field have highlighted limitations to the analysis and pointed out that all three agents are very effective in treating AQP4+ NMOSD, and many other considerations need to be taken into account as well as time to first relapse when selecting a therapy, leaving the door open for all three agents.
Dr. Wingerchuk explained that NMOSD is a rare severely disabling complement-mediated autoimmune neuroinflammatory disease of the central nervous system, characterized by devastating and unpredictable attacks (relapses) that can cause immediate and irreversible damage.
There are three recently approved monoclonal antibody treatment options in the United States for adults with AQP4+ NMOSD: eculizumab (Soliris, Alexion), inebilizumab (Uplizna, Horizon), and satralizumab (Enspryng, Genentech). A comparison of the relative treatment effects of these drugs would facilitate the treatment selection process, Dr. Wingerchuk said.
The objective of this study was to perform an indirect treatment comparison on the efficacy of these three FDA-approved treatment options for adults with AQP4+ NMOSD, in the absence of any head-to-head studies.
Using published data from randomized controlled trials, which were identified by a systematic literature review in September 2020, the researchers performed a Bayesian network meta-analysis to estimate the relative effects between eculizumab, inebilizumab, and satralizumab.
Network meta-analyses were performed for clinically relevant subpopulations based on three treatment networks: (1) patients who received monotherapy with one of the monoclonal antibodies or in combination with an immunosuppressant therapy; (2) patients who received monotherapy with the monoclonal antibody alone; and (3) patients who received a combination of both the monoclonal antibody and immunosuppressant therapy.
Time to first relapse was the primary efficacy outcome assessed. Relative treatment effects were expressed as hazard ratios and the probability that a treatment was the best at delaying time to first relapse was also evaluated.
In the systematic literature review, 29 publications from four unique clinical trials were identified and include in the network meta-analysis. These included publications from congress proceedings and peer-reviewed journals.
The four clinical trials were the N-MOmentum trial of inebilizumab versus placebo; the PREVENT trial of eculizumab with or without immunosuppressant therapy versus placebo with or without immunosuppressant therapy; the SAkuraSky trial of satralizumab plus immunosuppressant therapy versus placebo plus immunosuppressant therapy; and the SAkuraStar trial of satralizumab versus placebo.
Results showed that for the first analysis of mono or combination therapy, patients treated with eculizumab with or without immunosuppressant therapy were 76% less likely to experience a first relapse when compared with patients treated with satralizumab with or without immunosuppressant therapy.
In the monotherapy network, patients on eculizumab were 90% less likely to experience a first relapse when compared with patients treated with satralizumab, and patients on eculizumab were 89% less likely to experience a first relapse when compared with patients treated with inebilizumab.
In the third network analysis – a comparison of eculizumab plus immunosuppressant therapy with inebilizumab plus immunosuppressant therapy (Table 1) – the point estimate appeared to favor eculizumab but the confidence intervals were wide and not significant.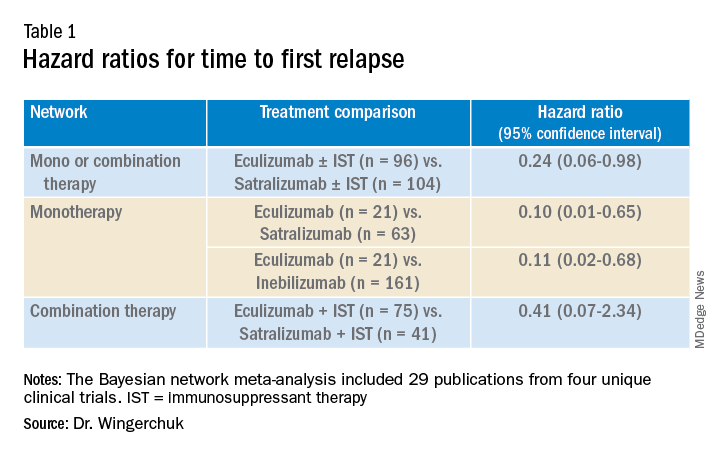
A subsequent analysis looked at the rank order of the best treatment option, with eculizumab coming out first in all three networks (Table 2).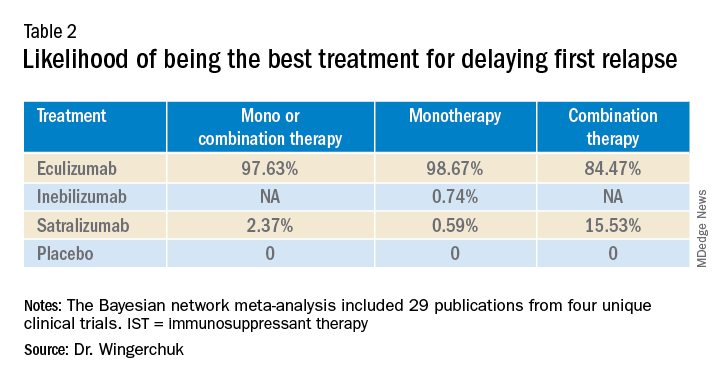
Dr. Wingerchuk acknowledged that there were many limitations to this study, including that analyses for annualized relapse rate, disability, and quality of life were not included because of a lack of consistent outcome reporting by AQP4+ status in the randomized trials.
Safety outcomes were excluded because of a lack of standardized baseline risks and inconsistent reporting by AQP4+ status across trials.
Because this study focused on drugs approved in the United States in a rare disease area, there were a limited number of studies with intervention effects.
There were differences in follow-up durations across the different trials, with N-MOmentum having a follow-up of 197 days compared with 144 weeks for other trials.
“In the absence of head-to-head trials, this network meta-analysis provides important evidence on the relative efficacy of eculizumab versus satralizumab or inebilizumab for the treatment of patients with AQP4+ NMOSD, with significant differences in two out of the three treatment comparison scenarios observed,” Dr. Wingerchuk concluded.
“Based on current evidence, monotherapy and mono-combination therapy with eculizumab appear to more efficacious at preventing relapses than satralizumab or inebilizumab for the treatment of adults with AQP4+ NMOSD. These findings appear to suggest that C5 complement inhibition with treatments such as eculizumab appear to prevent relapses more effectively than other mechanisms involving IL-6 receptor or CD19 inhibition among adults with AQP4+ NMOSD,” he added.
Experts respond
Commenting on the study, several experts in the field provided some balancing views.
Bruce Cree, MD, University of California San Francisco, who was the chief investigator of the N-MOmentum study with inebilizumab, said he was skeptical about this new indirect comparison. “The results of this study seem too good to be true; a 90% difference between agents has to be an overestimate,” he said.
“We know from independent studies that all three drugs are very effective. If we take each trial separately, eculizumab reduced attack risk by 90% versus placebo; and the other two drugs by 77% to 78% versus placebo. For eculizumab to be 90% better than inebilizumab or satralizumab its basically like saying these drugs perform like placebo, but we know that is not the case,” Dr. Cree argued.
He pointed out that when comparing results across studies there are many factors that have to be considered, including the different patient populations included in the different studies, with the characteristic of each population in each trial being unique to that dataset.
In addition, Dr. Cree suggested that all the studies included in the comparison were relatively small for this type of analysis. “Normally this type of analysis is done with much larger studies, so the resulting database is closer to a representation of the disease state itself,” he said.
Dr. Cree also questioned the role of the sponsor in this meta-analysis. “The analysis was sponsored by Alexion and several coauthors were employees of Alexion. There was not much description available of how the statistics were done. I am concerned that the company was involved in the analysis, which could introduce bias. I look forward to seeing details of the statistical methodology,” he said.
“This is definitely a provocative study. They have thrown down the gauntlet. If they are so confident in the results they should now do a head-to-head study to back this result up. If they don’t do that, then I think physicians should ignore it as there are just too many problems with this analysis,” Dr. Cree stated.
Dr. Cree acknowledged that when looking at the four trials separately, eculizumab does look a little better than the other two agents in delaying time to first relapse. “But there are some caveats. Despite a larger reduction in relapse rate there was no reduction in disability in the eculizumab trial. Whereas the inebilizumab trial did show a reduction in disability. And while the PREVENT trial with eculizumab was a good study, during the course of the trial the definition of clinical relapse was changed, and as a consequence that increased the product’s performance – that’s a little bit curious,” he added.
How to choose?
On how to choose between the three agents, Dr. Cree said they are all “extraordinarily effective” at reducing relapse activity. “They are all ‘home run’ products, but they have differences in safety,” he said.
“Inebilizumab is linked to hypogammaglobulinemia over time – we haven’t seen an increase in infection risk linked to this, but with enough time, I would expect that there probably will be. But inebilizumab is a B-cell-depleting agent like the agents used in MS, and we now have a lot of experiences with this type of product, which gives us more confidence on the safety profile,” Dr. Cree noted.
“Eculizumab was linked to a risk of meningococcal meningitis and other bacterial infections, and satralizumab seems to [be] overall well tolerated with no obvious safety concerns to date, but the studies have been quite small,” he added.
On routes of administration and frequency of dosing, Dr. Cree pointed out that while all three drugs have an intensive loading schedule, for maintenance, eculizumab needs to be given as an IV infusion every 2 weeks. Inebilizumab needs just two infusions per year for maintenance, while satralizumab is given by subcutaneous injection once per month.
“It may be that eculizumab could be used at the time of an acute attack but then treatment could be switched to one of the other two for long-term maintenance,” he suggested.
But Dr. Cree pointed out that the biggest challenge for all three agents is access. “The costs are astronomically high ($200,000-$770,000). They are prohibitively expensive and very few insurance companies are covering them.”
Also commenting, Brian Weinshenker, MD, from the Mayo Clinic in Rochester, Minn., who was a member of the attack adjudication committee for both PREVENT and N-MOmentum studies, pointed out that as well as differences in the populations enrolled, and study designs, the studies with the three different drugs also had differences in attack adjudication criteria.
“These factors make it very difficult to compare across studies, which is what was done in this analysis, so I would be reluctant to reach many conclusions about differences.”
Dr. Weinshenker added: “All three treatments provided strong benefit. We are still learning about long-term benefits, but emerging data have suggested that all three seem to provide persistent benefits for the length of the open-label extension study. We don’t have much evidence about the severity of the attacks that did occur, although some limited data suggest that both eculizumab and inebilizumab reduce attack severity.”
Dennis Bourdette, MD, professor emeritus, department of neurology, Oregon Health & Science University, Portland, who was not involved in any of the studies, said he thought the new analysis was “a worthwhile effort to determine the relative effectiveness of the three different drugs in treating AQP4+ NMOSD.
“Given the rarity of APQ4+ NMOSD, it will be difficult to perform randomized head-to-head clinical trials of the agents, so this type of comparison is the best we can do at this time,” he said.
While Dr. Bourdette feels this study supports the notion that eculizumab is more effective at delaying time to first relapse than inebilizumab and satralizumab, he does not believe the results should have a major impact on decisions about which agent to use in clinical practice.
“A difference in delaying time to first relapse tells us little about the relative effectiveness of the long-term benefit of these [agents], particularly with regards to permanent disability or frequency of relapses. However, it is possible that the difference reflects the efficacy kinetics of the agents with eculizumab working faster than the other two agents, which would be useful in making a decision about a patient with very active NMOSD where one wants to get the disease under control as quickly as possible,” Dr. Bourdette noted.
But he added that neurologists should also consider safety profile, convenience, and contraindications. “Eculizumab is clearly less convenient in terms of dosing schedule than the other two agents, and patient convenience is important for long-term compliance.”
Dr. Bourdette pointed out that another consideration is prior treatment. “Many patients with NMOSD will receive the anti-CD20 monoclonal antibody, rituximab – which depletes B cells – off label. Inebilizumab also depletes B cells, so a patient who has had continued NMOSD disease activity on rituximab probably should not be treated with inebilizumab, making eculizumab or satralizumab preferable,” he suggested.
Finally, Dr. Bourdette highlighted the sponsorship of the current study by the manufacturer of eculizumab, Alexion, and that all of the authors have some financial relationship with Alexion as described in their disclosures. “Whether this resulted in any biases about the design, conduct, or interpretation of the study is uncertain but is always a concern,” he said.
Company statements
The companies selling inebilizumab and satralizumab sent statements on the new analysis and repeated many of the above points.
Genentech noted that new longer-term data presented at ECTRIMS show that satralizumab is effective in significantly reducing relapses over 4 years of treatment in people with AQP4+ NMOSD, with a favorable safety profile both as a monotherapy and in conjunction with immunosuppressive therapy. More than 70% of people treated with satralizumab remained relapse free after 4 years in the SAkuraStar (73%) and SAkuraSky (71%) open-label extension studies, and 90% and 91%, respectively, were free from severe relapse, the company reported.
Horizon said: “We are confident in the efficacy and safety of Uplizna (inebilizumab) – a convenient, twice-annual monotherapy – that was studied in the largest randomized, placebo-controlled, global trial of a monotherapy in NMOSD. The endpoints in this trial were prospectively defined and assessed by an adjudication committee as published in The Lancet, with long-term follow-up data now published in the Multiple Sclerosis Journal that further support the efficacy and safety.”
The current study was funded by Alexion–AstraZeneca Rare Disease. Dr. Wingerchuk has participated on data safety monitoring or advisory boards for Roche, Viela Bio, Genentech, Biogen, Reistone, TG Therapeutics, Celgene, Novartis, and Alexion–AstraZeneca Rare Disease. He has received grants for clinical trials through Alexion–AstraZeneca Rare Disease and Terumo BCT, and has been paid consulting fees by Mitsubishi Tanabe. Several coauthors of this study are employees of Alexion Pharmaceutics. Dr. Cree was principal investigator on the N-MOmentum study with inebilizumab. He has a grant from Genentech for MS research, and has consulted for Alexion in the past. Dr. Weinshenker has served as a member of the attack adjudication committee for both PREVENT and N-MOmentum studies and has financial relationships with the manufacturers of all three drugs. Dr. Bourdette has disclosed no relevant financial relationships.
A version of this article first appeared on Medscape.com.
FROM ECTRIMS 2021
Clinicians underprescribe behavior therapy for preschool ADHD
The majority of families of preschool children with a diagnosis of attention-deficit/hyperactivity disorder were not offered behavior therapy as a first-line treatment, according to data from nearly 200 children.
The American Academy of Pediatrics’ current clinical practice guidelines recommend parent training in behavior management (PTBM) as a first-line treatment for children aged 4-5 years diagnosed with attention-deficit/hyperactivity disorder (ADHD) or symptoms of ADHD such as hyperactivity or impulsivity, but data on how well primary care providers follow this recommendation in practice are lacking, wrote Yair Bannett, MD, of Stanford (Calif.) University, and colleagues.
To investigate the rates of PTBM recommendations, the researchers reviewed electronic health records for 22,714 children aged 48-71 months who had at least two visits to any 1 of 10 primary care practices in a California pediatric health network between Oct. 1, 2015, and Dec. 31, 2019. Children with an autism diagnosis were excluded; ADHD-related visits were identified via ADHD diagnosis codes or symptom-level diagnosis codes.
In the study, published in JAMA Pediatrics, 192 children (1%) had either an ADHD diagnosis or ADHD symptoms; of these, 21 (11%) received referrals for PTBM during ADHD-related primary care visits. Records showed an additional 55 patients (29%) had a mention of counseling on PTBM by a primary care provider, including handouts.
PCPs prescribed ADHD medications for 32 children; 9 of these had documented PTBM recommendations, and in 4 cases, the PCPs recommended PTBM before prescribing a first medication.
A majority (73%) of the children were male, 64% were privately insured, 56% had subspecialists involved in their care, and 17% were prescribed ADHD medications (88% of which were stimulants).
In a multivariate analysis, children with public insurance were significantly less likely to receive a PTBM recommendation than were those with private insurance (adjusted relative risk 0.87).
The most common recommendation overall was routine/habit modifications (for 79 children), such as reducing sugar or adding supplements to the diet; improving sleep hygiene; and limiting screen time.
The low rates of PTBM among publicly insured patients in particular highlight the need to identify factors behind disparities in recommended treatments, the researchers noted.
The study findings were limited by several factors including the reliance on primary care provider documentation during the study period and the inclusion only of medical record reviews with diagnostic codes for ADHD, the researchers noted. Further studies beyond a single health care system are needed to assess generalizability, they added.
However, the results present an opportunity for primary care providers to improve adherence to clinical practice guidelines and establish behavioral treatment at an early age to mitigate long-term morbidity, they concluded.
Low rates highlight barriers and opportunities
“We were surprised to find very low rates of documented recommendations for behavioral treatment mentioned by PCPs,” Dr. Bannett said in an interview. The researchers were surprised that recommendations for changes in daily routines and habits, such as reduced sugar intake, regular exercise, better sleep, and reduced screen time, were the most common recommendations for families of children presenting with symptoms of ADHD. “Though these are good recommendations that can support the general health of any young child, there is no evidence to support their benefit in alleviating symptoms of ADHD,” he said.
Dr. Bannett acknowledged the challenge for pediatricians to stay current on where and how families can access this type of behavioral treatment, but the evidence supports behavior therapy over medication in preschool children, he said.
“I think that it is important for primary care clinicians to know that there are options for parent training in behavioral management for both privately and publicly insured patients,” said Dr. Bannett. “In California, for example, parent training programs are offered through county mental health services. In some counties, there are other organizations that offer parent training for underserved populations and those with public insurance,” he said.
Dr. Bannett noted that online treatments, including behavioral treatments, may be possible for some families.
He cited Triple P, an evidence-based curriculum for parent training in behavior management, which offers an online course for parents at triplep-parenting.com, and an online parent training course offered through the CHADD website (chadd.org/parent-to-parent/).
Dr. Bannett noted that the researchers are planning a follow-up study to investigate the reasons behind the low referral rates for PTBM. “A known barrier is the limited availability of therapists who can provide this type of therapy,” Dr. Bannett said. “Research is needed on the effectiveness of online versions of parent training, which can overcome some of the access barriers many families experience,” he added.
“Additionally, since behavioral treatment requires a significant effort on the part of the parents and caregivers, who often are not able to complete the therapy, there is a need for research on ways to enhance parent and family engagement and participation in these important evidence-based treatments,” as well as a need to research ways to increase adherence to evidence-based practices, said Dr. Bannett. “We are currently planning intervention studies that will enhance primary care clinicians’ knowledge and clinical practice; for example, decision support tools in the electronic health record, and up-to-date information about available resources and behavioral therapists in their community that they can share with families,” he said.
Barriers make it difficult to adhere to guidelines
The study authors missed a significant element of the AAP guidelines by failing to acknowledge the extensive accompanying section on barriers to adoption, which details why most pediatricians in clinical practice do not prescribe PTBM, Herschel Lessin, MD, of Children’s Medical Group, Poughkeepsie, N.Y., said in an interview.
“Academically, it is a wonderful article,” said Dr. Lessin, who was a member of the authoring committee of the AAP guidelines and a major contributor to the section on barriers. The AAP guidelines recommend PTBM because it is evidence based, but the barrier section is essential to understanding that this evidence-based recommendation is nearly impossible to follow in real-world clinical practice, he emphasized.
The American Academy of Pediatrics’ “Clinical practice guideline for the diagnosis, evaluation, and treatment of attention-deficit/hyperactivity disorder in children and adolescents,” published in October of 2019 in Pediatrics, included a full subsection on barriers as to why the guidelines might not be followed in many cases in a real-world setting, and the study authors failed to acknowledge this section and its implications, said Dr. Lessin. Notably, the barriers section was originally published in Pediatrics under a Supplemental Data tab that might easily be overlooked by someone reviewing the main practice guideline recommendations, he said.
In most areas of the country, PTBM is simply unavailable, Dr. Lessin said.
There is a dearth of mental health providers in the United States in general, and “a monstrous shortage of mental health practitioners for young children,” he said. Children in underserved areas barely have access to a medical home, let alone mental health subspecialists, he added.
Even in areas where specialized behavior therapy may be available, it can be prohibitively expensive for all but the wealthiest patients, Dr. Lessin noted. Insurance does not cover this type of behavior therapy, and most mental health professionals don’t accept Medicaid, nor commercial insurance, he said.
“I don’t even bother with those referrals, because they are not available,” said Dr. Lessin. The take-home message is that most community-based pediatricians are not following the guidelines because the barriers are so enormous, he said.
The study was supported by a research grant from the Society of Developmental and Behavioral Pediatrics and salary support through the Instructor Support Program at the department of pediatrics, Lucile Packard Children’s Hospital Stanford, to Dr. Bannett. The researchers had no other financial conflicts to disclose. Dr. Lessin had no financial conflicts to disclose, but serves on the editorial advisory board of Pediatric News.
FROM JAMA PEDIATRICS
Novel blood-based panel highly effective for early-stage HCC
A blood-based biomarker panel that includes DNA and protein markers featured a 71% sensitivity at 90% specificity for the detection of early-stage hepatocellular carcinoma (HCC) compared with the GALAD (gender, age, a-fetoprotein [AFP], Lens culinaris agglutinin-reactive AFP [AFP-L3], and des-gamma-carboxy-prothrombin [DCP]) score or AFP alone, according to research findings. The panel reportedly performed well in certain subgroups based on sex, presence of cirrhosis, and liver disease etiology.

The study, which included inpatients with HCC and controls without HCC but underlying liver disease, suggests the panel could be utilized in the detection of early stage disease in patients with well-established risk factors for HCC. Ultimately, this may lead to earlier treatment initiation and potentially improved clinical outcomes.
“A blood-based marker panel that detects early-stage HCC with higher sensitivity than current biomarker-based approaches could substantially benefit patients undergoing HCC surveillance,” wrote study authors Naga Chalasani, MD, of Indiana University, Indianapolis, and colleagues. Their report is in Clinical Gastroenterology and Hepatology.
HCC, which accounts for most primary liver cancers, generally occurs in patients with several established risk factors, including alcoholic liver disease or nonalcoholic fatty liver disease as well as chronic hepatitis B virus or hepatitis C virus infection. Current guidelines, such as those from the European Association for the Study of the Liver and those from the American Association for the Study of Liver Diseases, recommend surveillance of at-risk patients every 6 months by ultrasound with or without AFP measurement. When caught early, HCC is typically treatable and is associated with a higher rate of survival compared with late-stage disease. According to Dr. Chalasani and colleagues, however, the effectiveness of current recommended surveillance for very early stage or early stage HCC is poor, characterized by a 45% sensitivity for ultrasound and a 63% sensitivity for ultrasound coupled with AFP measurement.
The investigators of the multicenter, case-control study collected blood specimens from 135 patients with HCC as well as 302 age-matched controls with underlying liver disease but no HCC. Very early or early stage disease was seen in approximately 56.3% of patients with HCC, and intermediate, advanced, or terminal stage disease was seen in 43.7% of patients.
To predict cases of HCC, the researchers used a logistic regression algorithm to analyze 10 methylated DNA markers (MDMs) associated with HCC, methylated B3GALT6 (reference DNA marker), and 3 candidate proteins. Finally, the researchers compared the accuracy of the developed blood-based biomarker panel with other blood-based biomarkers – including the GALAD, AFP, AFP-L3, DCP – for the detection of HCC.
The multitarget HCC panel included 3 MDMs – HOXA1, EMX1, and TSPYL5. In addition, the panel included methylation reference marker B3GALT6 and the protein markers AFP and AFP-L3. The biomarker panel featured a higher sensitivity (71%; 95% confidence interval, 60-81) at 90% specificity for the detection of early stage HCC compared with the GALAD score (41%; 95% CI, 30-53) or AFP ≥ 7.32 ng/mL (45%; 95% CI, 33-57). The area under the curve for the novel HCC panel for the detection of any stage HCC was 0.92 vs. 0.87 for the GALAD and 0.81 for the AFP measurement alone. The researchers found that the performance of the test was similar between men and women in terms of sensitivity (79% and 84%, respectively). Moreover, the panel performed similarly well among subgroups based on presence of cirrhosis and liver disease etiology.
A potential limitation of this study was the inclusion of controls who were largely confirmed HCC negative by ultrasound, a technique that lacks sensitivity for detecting early stage HCC, the researchers noted. Given this limitation, the researchers suggest that some of the control participants may have had underlying HCC that was missed by ultrasound. Furthermore, the findings indicate that the cross-sectional nature of the study may also mean some of the control participants had HCCs that were undetectable at initial screening.
Despite the limitations of the study, the researchers reported that the novel, blood-based marker panel’s sensitivity for detecting early stage HCC likely supports its use “among at-risk patients to enhance HCC surveillance and improve early cancer detection.”
The study was funded by the Exact Sciences Corporation. The researchers reported conflicts of interest with several pharmaceutical companies.
A blood-based biomarker panel that includes DNA and protein markers featured a 71% sensitivity at 90% specificity for the detection of early-stage hepatocellular carcinoma (HCC) compared with the GALAD (gender, age, a-fetoprotein [AFP], Lens culinaris agglutinin-reactive AFP [AFP-L3], and des-gamma-carboxy-prothrombin [DCP]) score or AFP alone, according to research findings. The panel reportedly performed well in certain subgroups based on sex, presence of cirrhosis, and liver disease etiology.
The study, which included inpatients with HCC and controls without HCC but underlying liver disease, suggests the panel could be utilized in the detection of early stage disease in patients with well-established risk factors for HCC. Ultimately, this may lead to earlier treatment initiation and potentially improved clinical outcomes.
“A blood-based marker panel that detects early-stage HCC with higher sensitivity than current biomarker-based approaches could substantially benefit patients undergoing HCC surveillance,” wrote study authors Naga Chalasani, MD, of Indiana University, Indianapolis, and colleagues. Their report is in Clinical Gastroenterology and Hepatology.
HCC, which accounts for most primary liver cancers, generally occurs in patients with several established risk factors, including alcoholic liver disease or nonalcoholic fatty liver disease as well as chronic hepatitis B virus or hepatitis C virus infection. Current guidelines, such as those from the European Association for the Study of the Liver and those from the American Association for the Study of Liver Diseases, recommend surveillance of at-risk patients every 6 months by ultrasound with or without AFP measurement. When caught early, HCC is typically treatable and is associated with a higher rate of survival compared with late-stage disease. According to Dr. Chalasani and colleagues, however, the effectiveness of current recommended surveillance for very early stage or early stage HCC is poor, characterized by a 45% sensitivity for ultrasound and a 63% sensitivity for ultrasound coupled with AFP measurement.
The investigators of the multicenter, case-control study collected blood specimens from 135 patients with HCC as well as 302 age-matched controls with underlying liver disease but no HCC. Very early or early stage disease was seen in approximately 56.3% of patients with HCC, and intermediate, advanced, or terminal stage disease was seen in 43.7% of patients.
To predict cases of HCC, the researchers used a logistic regression algorithm to analyze 10 methylated DNA markers (MDMs) associated with HCC, methylated B3GALT6 (reference DNA marker), and 3 candidate proteins. Finally, the researchers compared the accuracy of the developed blood-based biomarker panel with other blood-based biomarkers – including the GALAD, AFP, AFP-L3, DCP – for the detection of HCC.
The multitarget HCC panel included 3 MDMs – HOXA1, EMX1, and TSPYL5. In addition, the panel included methylation reference marker B3GALT6 and the protein markers AFP and AFP-L3. The biomarker panel featured a higher sensitivity (71%; 95% confidence interval, 60-81) at 90% specificity for the detection of early stage HCC compared with the GALAD score (41%; 95% CI, 30-53) or AFP ≥ 7.32 ng/mL (45%; 95% CI, 33-57). The area under the curve for the novel HCC panel for the detection of any stage HCC was 0.92 vs. 0.87 for the GALAD and 0.81 for the AFP measurement alone. The researchers found that the performance of the test was similar between men and women in terms of sensitivity (79% and 84%, respectively). Moreover, the panel performed similarly well among subgroups based on presence of cirrhosis and liver disease etiology.
A potential limitation of this study was the inclusion of controls who were largely confirmed HCC negative by ultrasound, a technique that lacks sensitivity for detecting early stage HCC, the researchers noted. Given this limitation, the researchers suggest that some of the control participants may have had underlying HCC that was missed by ultrasound. Furthermore, the findings indicate that the cross-sectional nature of the study may also mean some of the control participants had HCCs that were undetectable at initial screening.
Despite the limitations of the study, the researchers reported that the novel, blood-based marker panel’s sensitivity for detecting early stage HCC likely supports its use “among at-risk patients to enhance HCC surveillance and improve early cancer detection.”
The study was funded by the Exact Sciences Corporation. The researchers reported conflicts of interest with several pharmaceutical companies.
FROM CLINICAL GASTROENTEROLOGY AND HEPATOLOGY
Evaluations of novel approaches to treating NF-1 tumors are underway
In the clinical experience of R. Rox Anderson, MD, currently available treatment options for benign tumors caused by neurofibromatosis type 1 (NF-1) are not acceptable.
“Simply removing the tumors with surgery is not the answer,” Dr. Anderson, a dermatologist who is the director of the Wellman Center for Photomedicine at Massachusetts General Hospital, Boston, said during a virtual course on laser and aesthetic skin therapy. “We need a way to inhibit the cutaneous neurofibromatosis early in life and prevent disfigurement that occurs when kids become adults.
“Kids with NF-1 are born looking normal,” he said. “They have café au lait macules and Lisch nodules in their eye, but they’re normal-looking kids. By early adulthood, many will grow hundreds of tumors that are disfiguring.”
In patients with NF-1, surgical excision works for cutaneous tumors but is expensive and not widely available, and is usually not covered by health insurance. “Plus, you have these adults who have already been through a lot of trauma, with the disfigurement in their lives, who have to be put under general anesthesia to remove a large number of tumors,” Dr. Anderson said at the meeting, which was named What’s the Truth and was sponsored by Harvard Medical School, Massachusetts General Hospital, and the Wellman Center for Photomedicine. Cryotherapy is a minimally invasive way to treat cutaneous neurofibroma tumors, “but this destroys the overlying skin, so you get unwanted destruction,” he said. “I like the idea of selecting heating, but we don’t know yet by what method.”
Dr. Anderson and his colleagues just launched a comparative clinical They plan to perform one or more treatment methods per patient in a single treatment session, then follow up at least 6 months later. Baseline and untreated cutaneous NF lesions will serve as controls. The researchers plan to conduct three-dimensional imaging, clinical assessments, and evaluate pain and other subjective measures.
Use of deoxycholate in a pilot trial was well tolerated and induced tumor regression in adults with cutaneous NF, he said.
Dr. Anderson noted that other researchers are studying the potential role of topical or local mitogen-activated protein kinase (MEK) inhibitors for these tumors. “Systemic MEK inhibitors are effective for plexiform neuromas, but cause significant cutaneous side effects,” he said. A “soft” MEK inhibitor, NFX-179 is rapidly metabolized such that high drug levels are achieved in skin without systemic drug levels. However, Dr. Anderson said that it remains unclear if this approach will prevent cutaneous NF tumors from forming, arrest their growth, or induce their regression.
Dr. Anderson reported having received research funding and/or consulting fees from numerous device and pharmaceutical companies.
Commentary by Lawrence F. Eichenfield, MD
Neurofibromatosis type 1 (NF1) is a common genodermatosis, associated with the development of neurofibromas derived from nerves, soft tissue, and skin. Cutaneous NFs often develop in later childhood onward and may be deforming, associated with pruritus, pain, and significant effect on quality of life. Dr. Anderson is a world leader in laser treatment, having developed the theories behind laser development for medical usage, as well as the laser technology used for vascular birthmarks and hair removal, laser and cooling techniques targeting fat, and “fractionating” laser energy, which has revolutionized scar management. We look forward to his group’s insights into better management of NF1 lesions!
Dr. Eichenfield is chief of pediatric and adolescent dermatology at Rady Children's Hospital-San Diego. He is vice chair of the department of dermatology and professor of dermatology and pediatrics at the University of California, San Diego. He disclosed that he has served as an investigator and/or consultant to AbbVie, Lilly, Pfizer, Regeneron, Sanofi-Genzyme, and Verrica.
A version of this article first appeared on Medscape.com.
This article was updated 6/18/22.
FROM A LASER & AESTHETIC SKIN THERAPY COURSE
Managing simple febrile seizures without lumbar puncture safe: 15-year study
Most children with simple febrile seizures (SFSs) can be safely managed without lumbar puncture or other diagnostic tests without risking delayed diagnosis of bacterial meningitis, new data gathered from a 15-year span suggest.
Vidya R. Raghavan, MD, with the division of emergency medicine at Boston Children’s Hospital and Harvard Medical School, also in Boston, published their findings in Pediatrics.
In 2011, researchers published the American Academy of Pediatrics simple febrile seizure guideline, which recommends limiting lumbar puncture to non–low-risk patients. The guidelines also specified that neuroimaging and hematologic testing are not routinely recommended.
Dr. Raghavan and coauthors studied evaluation and management trends of the patients before and after the guidelines. They identified 142,121 children diagnosed with SFS who presented to 1 of 49 pediatric tertiary EDs and met other study criteria. Changes in management of SFS had started years before the guideline and positive effects continued after the guideline publication.
Researchers found a significant 95% decline in rates of lumbar puncture between 2005 and 2019 from 11.6% (95% confidence interval, 10.8%-12.4%) of children in 2005 to 0.6% (95% CI, 0.5%-0.8%; P < .001) in 2019. The most significant declines were among infants 6 months to 1 year.
“We found similar declines in rates of diagnostic laboratory and radiologic testing, intravenous antibiotic administration, hospitalization, and costs,” the authors wrote.
“Importantly,” they wrote, “the decrease in testing was not associated with a concurrent increase in delayed diagnoses of bacterial meningitis.”
The number of hospital admissions and total costs also dropped significantly over the 15-year span of the study. After adjusting for inflation, the authors wrote, costs dropped from an average $1,523 in 2005 to $605 (P < .001) in 2019.
Among first-time presentations for SFSs, 19.2% (95% CI, 18.3%-20.2%) resulted in admission in 2005. That rate dropped to 5.2% (95% CI, 4.8%-5.6%) in 2019 (P < .001), although the authors noted that trend largely plateaued after the guideline was published.
“Our findings are consistent with smaller studies published before 2011 in which researchers found declining rates of LP [lumbar puncture] in children presenting to the ED with their first SFS,” the authors wrote.

Mercedes Blackstone, MD, an emergency physician at the Children’s Hospital of Philadelphia, said in an interview that the paper offers reassurance for changed practice over the last decade.
She said there was substantial relief in pediatrics when the 2011 guidelines recognized formally that protocols were outdated, especially as bacterial meningitis had become increasingly rare with widespread use of pneumococcal and Haemophilus influenzae vaccines. Practitioners had already started to limit the spinal taps on their own.
“We were not really complying with the prior recommendation to do a spinal tap in all those children because it often felt like doing a pretty invasive procedure with a very low yield in what was often a very well child in front of you,” she said.
In 2007, the authors noted, a few years before the guidelines, rates of bacterial meningitis had decreased to 7 per 100,000 in children aged between 2 and 23 months and 0.56 per 100,000 in children aged between 2 and 10 years.
However, Dr. Blackstone said, there was still a worry among some practitioners that there could be missed cases of bacterial meningitis.
“It’s very helpful to see that in all those years, the guidelines have been very validated and there were really no missed cases,” said Dr. Blackstone, author of CHOP’s febrile seizures clinical pathway.
It was good to see the number of CT scans drop as well, she said. Dr. Raghavan’s team found they decreased from 10.6% to 1.6%; P < .001, over the study period.
“Earlier work had shown that there was still a fair amount of head CTs happening and that’s radiation to the young brain,” Dr. Blackstone noted. “This is great news.”
Dr. Blackstone said it was great to see so many children from so many children’s hospitals included in the study.
The paper confirmed that “we’ve reduced a lot of unnecessary testing, saved a lot of cost, and had no increased risk to the patients,” she said.
Dr. Blackstone pointed out that the authors include a limitation that many children are seen in nonpediatric centers in community adult ED and she said those settings tend to have more testing.
“Hopefully, these guidelines have penetrated into the whole community,” she said. “With this paper they should feel reassured that they can spare children some of these tests and procedures.”
Dr. Raghavan and Dr. Blackstone declared no relevant financial relationships.
Most children with simple febrile seizures (SFSs) can be safely managed without lumbar puncture or other diagnostic tests without risking delayed diagnosis of bacterial meningitis, new data gathered from a 15-year span suggest.
Vidya R. Raghavan, MD, with the division of emergency medicine at Boston Children’s Hospital and Harvard Medical School, also in Boston, published their findings in Pediatrics.
In 2011, researchers published the American Academy of Pediatrics simple febrile seizure guideline, which recommends limiting lumbar puncture to non–low-risk patients. The guidelines also specified that neuroimaging and hematologic testing are not routinely recommended.
Dr. Raghavan and coauthors studied evaluation and management trends of the patients before and after the guidelines. They identified 142,121 children diagnosed with SFS who presented to 1 of 49 pediatric tertiary EDs and met other study criteria. Changes in management of SFS had started years before the guideline and positive effects continued after the guideline publication.
Researchers found a significant 95% decline in rates of lumbar puncture between 2005 and 2019 from 11.6% (95% confidence interval, 10.8%-12.4%) of children in 2005 to 0.6% (95% CI, 0.5%-0.8%; P < .001) in 2019. The most significant declines were among infants 6 months to 1 year.
“We found similar declines in rates of diagnostic laboratory and radiologic testing, intravenous antibiotic administration, hospitalization, and costs,” the authors wrote.
“Importantly,” they wrote, “the decrease in testing was not associated with a concurrent increase in delayed diagnoses of bacterial meningitis.”
The number of hospital admissions and total costs also dropped significantly over the 15-year span of the study. After adjusting for inflation, the authors wrote, costs dropped from an average $1,523 in 2005 to $605 (P < .001) in 2019.
Among first-time presentations for SFSs, 19.2% (95% CI, 18.3%-20.2%) resulted in admission in 2005. That rate dropped to 5.2% (95% CI, 4.8%-5.6%) in 2019 (P < .001), although the authors noted that trend largely plateaued after the guideline was published.
“Our findings are consistent with smaller studies published before 2011 in which researchers found declining rates of LP [lumbar puncture] in children presenting to the ED with their first SFS,” the authors wrote.
Mercedes Blackstone, MD, an emergency physician at the Children’s Hospital of Philadelphia, said in an interview that the paper offers reassurance for changed practice over the last decade.
She said there was substantial relief in pediatrics when the 2011 guidelines recognized formally that protocols were outdated, especially as bacterial meningitis had become increasingly rare with widespread use of pneumococcal and Haemophilus influenzae vaccines. Practitioners had already started to limit the spinal taps on their own.
“We were not really complying with the prior recommendation to do a spinal tap in all those children because it often felt like doing a pretty invasive procedure with a very low yield in what was often a very well child in front of you,” she said.
In 2007, the authors noted, a few years before the guidelines, rates of bacterial meningitis had decreased to 7 per 100,000 in children aged between 2 and 23 months and 0.56 per 100,000 in children aged between 2 and 10 years.
However, Dr. Blackstone said, there was still a worry among some practitioners that there could be missed cases of bacterial meningitis.
“It’s very helpful to see that in all those years, the guidelines have been very validated and there were really no missed cases,” said Dr. Blackstone, author of CHOP’s febrile seizures clinical pathway.
It was good to see the number of CT scans drop as well, she said. Dr. Raghavan’s team found they decreased from 10.6% to 1.6%; P < .001, over the study period.
“Earlier work had shown that there was still a fair amount of head CTs happening and that’s radiation to the young brain,” Dr. Blackstone noted. “This is great news.”
Dr. Blackstone said it was great to see so many children from so many children’s hospitals included in the study.
The paper confirmed that “we’ve reduced a lot of unnecessary testing, saved a lot of cost, and had no increased risk to the patients,” she said.
Dr. Blackstone pointed out that the authors include a limitation that many children are seen in nonpediatric centers in community adult ED and she said those settings tend to have more testing.
“Hopefully, these guidelines have penetrated into the whole community,” she said. “With this paper they should feel reassured that they can spare children some of these tests and procedures.”
Dr. Raghavan and Dr. Blackstone declared no relevant financial relationships.
FROM PEDIATRICS
Sunscreen, other sun-protective habits not linked with poorer bone health, fractures
Using , according to a new study that included more than 3,000 men and women.

“We have objective data for the first time, and in a large-scale representative population of the U.S. adults, to indicate sun protection is not associated with negative bone-related outcomes,” said study lead author Mohsen Afarideh, MD, MPH, a postdoctoral research fellow at the autoimmune skin diseases unit at the University of Pennsylvania, Philadelphia.
The study, published online in JAMA Dermatology, goes a step further than previous research by others that has found sunscreen use does not compromise vitamin D synthesis and has little effect on circulating 25-hydroxyvitamin D levels.
In the new study, researchers looked at three sun-protective behaviors – sunscreen use, staying in the shade, wearing long sleeves – and their effects on bone mineral density and the risk of fractures.
While the effects of sun-protective habits on blood levels of vitamin D and BMD scores are important, ‘’what we are more interested to know is if the sun-protective behaviors actually cause or increase the risk of fracture,” Dr. Afarideh said in an interview. “The answer to that is a firm ‘No.’ These data are very reassuring and will help clinicians to keep recommending sun protection to the public.”
Study details
Dr. Afarideh and his colleagues from the Mayo Clinic in Rochester, Minn., looked at data from the National Health and Nutrition Examination Survey (NHANES) from 2017 to 2018, obtaining final information on 3,403 men and women, ages 20-59, who completed a dermatology questionnaire The men and women reported on the three sun-protective habits, and noted whether they followed these practices always or most of the time, sometimes, or never or rarely.
The frequency of the three behaviors was not widespread. Frequent staying in the shade was reported by 31.6% of the sample, wearing long sleeves by 11.8%, and sunscreen use by 26.1%.
The researchers also had data on the participants’ bone mineral density (BMD) scores along with dietary information such as milk consumption, vitamin D supplement use, taking steroid drugs, and exercise activity.
“Moderate sunscreen use was linked with a slightly lower lumbar BMD score,” Dr. Afarideh said, which was “the only significant association that could be interpreted as concerning.” And this was more likely to be seen in older respondents, he said.
However, otherwise they found the practice of the three behaviors was not associated with lower total or site-specific BMD z scores, nor was it linked with an increased risk of osteoporotic fractures. (The BMD z score compares an individual’s bone density to the average bone density of someone their same age and gender.)
The focus on fracture risk is the more important outcome, Dr. Afarideh said. And they found no increased risk overall of osteoporotic fractures in those who practiced sun-protective behaviors.
Moderate to frequent staying in the shade was actually linked with a reduced prevalence of spine fractures in the multivariate model (odds ratio, 0.19; 95% confidence interval, 0.04-0.86, P = .02). The researchers say that may be attributable to these respondents also being careful in other areas of life, such as avoiding falls and not participating in high-risk activities that would increase the chance of fractures. “However, this is just an assumption,” Dr. Afarideh said.
Expert perspectives
Other dermatologists not involved in the new research said the study results provide some “real-world” information that’s valuable for clinicians to share with patients.
“I think this is an important study on multiple levels,” said Henry W. Lim, MD, a former president of the American Academy of Dermatology who is a member of the department of dermatology and senior vice president of academic affairs at Henry Ford Health System, Detroit. “It is a well-done study, involving a large number. It is a real-life situation, asking people their photo protective behaviors and then looking at their bone mineral density.” The bottom line, he said: “Bone health is not affected by photo protection habits in real life.”
The findings are important but not surprising, said Antony R. Young, PhD, emeritus professor of experimental photobiology at St. John’s Institute of Dermatology, King’s College, London, who has researched sunscreens and vitamin D status. “My study showed that correct sunscreen use, albeit with a relatively low SPF of 15, did prevent sunburn in a high UVR [ultraviolet radiation] environment but did allow very good vitamin D synthesis. I think this is because the necessary dose of UVB is very low.”
Michele Green, MD, a New York dermatologist and clinical staff member at Lenox Hill Hospital there, said she often hears concerns about bone health from patients. “Every week, patients ask, ‘Why would I wear sunblock? Don’t I need sun for bone health? Don’t I need it for vitamin D?’’’
Now, she said, ‘’Dermatologists can point to the study and say ‘Don’t worry.’ It clarifies that using sunscreen won’t cause you to have osteoporosis.’’
Dr. Afarideh, who was a postdoctoral research fellow at the Mayo Clinic, and his coauthors, Megha M. Tollefson, MD, and Julio C. Sartori-Valinotti, of the Mayo Clinic, and Dr. Green had no disclosures. Dr. Lim and Dr. Young consult for the sunscreen industry.
Using , according to a new study that included more than 3,000 men and women.
“We have objective data for the first time, and in a large-scale representative population of the U.S. adults, to indicate sun protection is not associated with negative bone-related outcomes,” said study lead author Mohsen Afarideh, MD, MPH, a postdoctoral research fellow at the autoimmune skin diseases unit at the University of Pennsylvania, Philadelphia.
The study, published online in JAMA Dermatology, goes a step further than previous research by others that has found sunscreen use does not compromise vitamin D synthesis and has little effect on circulating 25-hydroxyvitamin D levels.
In the new study, researchers looked at three sun-protective behaviors – sunscreen use, staying in the shade, wearing long sleeves – and their effects on bone mineral density and the risk of fractures.
While the effects of sun-protective habits on blood levels of vitamin D and BMD scores are important, ‘’what we are more interested to know is if the sun-protective behaviors actually cause or increase the risk of fracture,” Dr. Afarideh said in an interview. “The answer to that is a firm ‘No.’ These data are very reassuring and will help clinicians to keep recommending sun protection to the public.”
Study details
Dr. Afarideh and his colleagues from the Mayo Clinic in Rochester, Minn., looked at data from the National Health and Nutrition Examination Survey (NHANES) from 2017 to 2018, obtaining final information on 3,403 men and women, ages 20-59, who completed a dermatology questionnaire The men and women reported on the three sun-protective habits, and noted whether they followed these practices always or most of the time, sometimes, or never or rarely.
The frequency of the three behaviors was not widespread. Frequent staying in the shade was reported by 31.6% of the sample, wearing long sleeves by 11.8%, and sunscreen use by 26.1%.
The researchers also had data on the participants’ bone mineral density (BMD) scores along with dietary information such as milk consumption, vitamin D supplement use, taking steroid drugs, and exercise activity.
“Moderate sunscreen use was linked with a slightly lower lumbar BMD score,” Dr. Afarideh said, which was “the only significant association that could be interpreted as concerning.” And this was more likely to be seen in older respondents, he said.
However, otherwise they found the practice of the three behaviors was not associated with lower total or site-specific BMD z scores, nor was it linked with an increased risk of osteoporotic fractures. (The BMD z score compares an individual’s bone density to the average bone density of someone their same age and gender.)
The focus on fracture risk is the more important outcome, Dr. Afarideh said. And they found no increased risk overall of osteoporotic fractures in those who practiced sun-protective behaviors.
Moderate to frequent staying in the shade was actually linked with a reduced prevalence of spine fractures in the multivariate model (odds ratio, 0.19; 95% confidence interval, 0.04-0.86, P = .02). The researchers say that may be attributable to these respondents also being careful in other areas of life, such as avoiding falls and not participating in high-risk activities that would increase the chance of fractures. “However, this is just an assumption,” Dr. Afarideh said.
Expert perspectives
Other dermatologists not involved in the new research said the study results provide some “real-world” information that’s valuable for clinicians to share with patients.
“I think this is an important study on multiple levels,” said Henry W. Lim, MD, a former president of the American Academy of Dermatology who is a member of the department of dermatology and senior vice president of academic affairs at Henry Ford Health System, Detroit. “It is a well-done study, involving a large number. It is a real-life situation, asking people their photo protective behaviors and then looking at their bone mineral density.” The bottom line, he said: “Bone health is not affected by photo protection habits in real life.”
The findings are important but not surprising, said Antony R. Young, PhD, emeritus professor of experimental photobiology at St. John’s Institute of Dermatology, King’s College, London, who has researched sunscreens and vitamin D status. “My study showed that correct sunscreen use, albeit with a relatively low SPF of 15, did prevent sunburn in a high UVR [ultraviolet radiation] environment but did allow very good vitamin D synthesis. I think this is because the necessary dose of UVB is very low.”
Michele Green, MD, a New York dermatologist and clinical staff member at Lenox Hill Hospital there, said she often hears concerns about bone health from patients. “Every week, patients ask, ‘Why would I wear sunblock? Don’t I need sun for bone health? Don’t I need it for vitamin D?’’’
Now, she said, ‘’Dermatologists can point to the study and say ‘Don’t worry.’ It clarifies that using sunscreen won’t cause you to have osteoporosis.’’
Dr. Afarideh, who was a postdoctoral research fellow at the Mayo Clinic, and his coauthors, Megha M. Tollefson, MD, and Julio C. Sartori-Valinotti, of the Mayo Clinic, and Dr. Green had no disclosures. Dr. Lim and Dr. Young consult for the sunscreen industry.
FROM JAMA DERMATOLOGY

FDA issues stronger safety requirements for breast implants
The Food and Drug Administration on Oct. 27 announced stronger safety requirements for breast implants, restricting sales of implants only to providers and health facilities that review potential risks of the devices with patients before surgery, via a “Patient Decision Checklist.” The agency also placed a boxed warning – the strongest warning that the FDA requires – on all legally marketed breast implants.
“Protecting patients’ health when they are treated with a medical device is our most important priority,” Binita Ashar, MD, director of the Office of Surgical and Infection Control Devices in the FDA’s Center for Devices and Radiological Health, said in a press release. “In recent years, the FDA has sought more ways to increase patients’ access to clear and understandable information about the benefits and risks of breast implants. By strengthening the safety requirements for manufacturers, the FDA is working to close information gaps for anyone who may be considering breast implant surgery.”
This announcement comes 10 years after the FDA issued a comprehensive safety update on silicone gel–filled implants, which reported a possible association between these devices and anaplastic large cell lymphoma (ALCL). The studies reviewed in the 2011 document also noted that a “significant percentage of women who receive silicone gel–filled breast implants experience complications and adverse outcomes,” the most common being repeat operation, implant removal, rupture, or capsular contracture (scar tissue tightening around the implant).
Breast augmentation has been one of the top five cosmetic procedures in the United States since 2006, according to the American Society for Plastic Surgery, with more than 400,000 people getting breast implants in 2019. Nearly 300,000 were for cosmetic reasons, and more than 100,000 were for breast reconstruction after mastectomies.
In 2019, the FDA proposed adding a boxed warning for breast implants, stating that the devices do not last an entire lifetime; that over time the risk for complications increases; and that breast implants have been associated with ALCL, and also may be associated with systemic symptoms such as fatigue, joint pain, and brain fog. The Oct. 27 FDA action now requires that manufacturers update breast implant packaging to include that information in a boxed warning, as well as the following:
- A patient-decision checklist
- Updated silicone gel–filled breast implant rupture screening recommendations
- A device description including materials used in the device
- Patient device ID cards
The updated label changes must be present on manufacturers’ websites in 30 days, the FDA said.
The new requirements have received largely positive reactions from both physicians and patient organizations. In an emailed statement to this news organization, Lynn Jeffers, MD, MBA, the immediate past president of the American Society of Plastic Surgeons, said that “ASPS has always supported patients being fully informed about their choices and the risks, benefits, and alternatives of the options available. “We look forward to our continued collaboration with the FDA on the safety of implants and other devices.”
Maria Gmitro, president and cofounder of the Breast Implant Safety Alliance, an all-volunteer nonprofit based in Charleston, S.C., said that some of the language in the patient checklist could be stronger, especially when referring to breast implant–associated ALCL.
To inform patients of risks more clearly, “it’s the words like ‘associated with’ that we feel need to be stronger” she said in an interview. She also noted that women who already have breast implants may not be aware of these potential complications, which these new FDA requirements do not address.
But overall, the nonprofit was “thrilled” with the announcement, Ms. Gmitro said. “Placing restrictions on breast implants is a really big step, and we applaud the FDA’s efforts. This is information that every patient considering breast implants should know, and we’ve been advocating for better informed consent.”
A version of this article first appeared on Medscape.com.
Two diets linked to improved cognition, fatigue in MS
A Paleolithic elimination diet (Wahls diet) or a low-saturated fat diet (Swank diet) are associated with improved cognition, among other clinical outcomes, in relapsing-remitting multiple sclerosis (RRMS), new research suggests.
In a randomized study of patients with RRMS, the group that followed a Wahls diet and the group that followed a Swank diet both showed significant, unique improvement in measures of cognitive dysfunction, fatigue, and quality of life.
“Several dietary intervention studies have demonstrated favorable results on MS-related fatigue and quality of life. However, these results are among the first to show favorable reductions in cognitive dysfunction,” said co-investigator Tyler Titcomb, PhD, department of internal medicine, University of Iowa, Iowa City.
The results were presented at the 2021 Annual Meeting of the Consortium of Multiple Sclerosis Centers (CMSC).
Similar diets
The CMSC findings came from a secondary analysis of a randomized trial published online in July in the Multiple Sclerosis Journal Experimental, Translational, and Clinical (MSJ-ETC).
The primary analysis of the single-blind, parallel group, randomized trial showed the Wahls and Swank diets were linked to significant improvement in outcomes on the Fatigue Severity Scale (FSS), the Modified Fatigue Impact Scale (MFIS), and other measures among participants with RRMS. There were no significant differences between the two dietary regimens.
The Swank diet restricts saturated fat to a maximum of 15 g per day while providing 20 g to 50 g (4 to 10 teaspoons) of unsaturated fat per day, with four servings each of whole grains, fruits, and vegetables.
The Wahls diet recommends six to nine servings of fruits and vegetables per day, in addition to 6 to 12 ounces of meat per day, according to gender. Grains, legumes, eggs, and dairy, with the exception of clarified butter or ghee, are not permitted on this diet. Both diets eschew processed foods.
To further evaluate the diets’ effects on perceived fatigue and cognitive dysfunction, the researchers returned to the trial, which enrolled 95 adults with stable RRMS at the University of Iowa Prevention Intervention Center between August 2016 and May 2019.
After a 12-week run-in period with support and education from registered dietitians, participants were randomly assigned to either the Swank or Wahls diets in a 24-week intervention that did not include dietitian support.
Inclusion criteria included having moderate to severe fatigue, as shown by an FSS score of at least 4.0, while not having severe mental impairment, an eating disorder, or liver or kidney disease. There were no significant differences in baseline demographic or clinical characteristics between the groups.
Of the patients, 77 completed the 12-week run-in (38 in the Swank diet group and 39 in the Wahls group). A total of 72 participants completed the 24-week follow-up (37 and 35, respectively).
Reduction in fatigue, cognitive dysfunction
After the researchers controlled for smoking, alcohol consumption, age, sex, baseline distance 6-minute walk test, body mass index, serum vitamin D, and years with MS, results at 12 and 24 weeks showed significant improvements from baseline in the key outcomes of fatigue and cognitive function, as measured by the Fatigue Scale for Motor and Cognitive Function (FSMC).
Scores were −5.7 and −9.0, respectively, for the Swank diet group and −9.3 and −14.9 for the Wahls group (P ≤ .001 for all comparisons).
In addition, there was a significant reduction in both groups on the total Perceived Deficits Questionnaire (PDQ) at 12 and 24 weeks (Swank, −7.4 and −6.3, respectively; Wahls, −6.8 and −10.8; P ≤ .001 for all).
There were similar improvements for both diets in an analysis of the mental and physical scores on FSMC and on the subscales on PDQ of attention, retrospective memory, prospective memory, and planning.
As observed in the primary analysis, there were no significant differences between the two groups in absolute mean scores on FSMC, PDQ, or their subscales at any timepoint.
“Both diets led to significant reductions in fatigue and cognitive dysfunction,” Dr. Titcomb said.
Of note, the primary analysis further showed statistically and clinically significant increases in the 6-minute walk test at 24-weeks of 6% in the Wahls group (P = .007). After removal of nonadherent participants, the improvement was still significant at 24 weeks in the Wahls group (P = .02), as well as in the Swank group (P = .001).
Dr. Titcomb noted that the majority of study participants were taking disease-modifying therapies (DMTs). However, there were no interactions between any specific DMTs and dietary benefits.
Potential mechanisms
Although the similar outcomes between the diets point to a common mechanism, there are also various other possibilities, said Dr. Titcomb. These include modulation of the microbiome, inflammation, immune system, or micronutrient optimization, he said.
Previous research has shown reduced mass and diversity in the gut microbiota among patients with MS compared with those without MS, potentially promoting inflammation. Other research has shown improvements in those factors with dietary modification.
While there is no evidence of gut microbiota changes with the Wahls and Swank diets, each is rich in fiber and plant-derived phytochemicals, which are known to be associated with improvements in gut microbiota and neuroinflammation, the investigators noted.
Dr. Titcomb reported that research into the diets is continuing as they evaluate longer-term and other effects. “This trial was a short-term parallel arm trial that did not include MRI or a control group,” he said, adding that the investigators will soon start recruiting for a follow-up study that will include a control group, long-term follow-up, and MRIs.
That upcoming study “has the potential to answer several of the unknown questions regarding the effect of diet on MS,” Dr. Titcomb said.
Notable research with limitations
Commenting on the study, Rebecca Spain, MD, MSPH, associate professor of neurology at the Oregon Health & Science University, and associate director of clinical care at VA MS Center of Excellence West in Portland, said there were several notable findings.
This includes that most people with MS “were able to adhere to the protocols for significant lengths of time, even without the support of dietitians for the final 12 weeks of the study,” said Spain, who was not involved with the research.
A significant limitation was the lack of a control group. Without that, “it’s hard to know for sure if the improvements in fatigue and cognition were from the diets or were simply from the social support of participating in a research study,” she said
Nevertheless, trials reporting on dietary effects in MS such as the current study are important, Dr. Spain noted. They demonstrate “that it is feasible and safe to conduct dietary studies and suggest which key MS symptoms may benefit and should be evaluated in future studies.”
“Critically, diet studies address one of the most frequent concerns of people with MS, promoting self-management and empowerment,” Dr. Spain concluded.
General guidelines for common dietary elements with evidence of improving fatigue, cognition, and mood are available on the National MS Society’s website.
The study received no outside funding. Dr. Titcomb and Dr. Spain have disclosed no relevant financial relationships. Terry L. Wahls, MD, who developed the Wahls diet, was a senior author of the study.
A version of this article first appeared on Medscape.com.
FROM CMSC 2021
Clinical Edge Journal Scan Commentary: Prostate Cancer November 2021

In the study by Aggarwal et al., the investigators evaluated whether molecular subtypes as identified from biopsies of metastatic tumors in patients with metastatic castrate resistant prostate cancer (mCRPC) could result in improved prediction of response to therapies. In this retrospective study of 4 distinct cohorts, 45% of tumors were classified as luminal and 55% were classified as basal. Luminal tumors exhibited increased expression of androgen receptor pathway genes, and patients with luminal tumors had better survival after treatment with ASI compared with those with basal tumors. Genomic analyses of mCRPC metastases are challenging due to processing issues that can arise if bone decalcification needs to be done; therefore, this study provides an important next step to aid in the design appropriate clinical trials to investigate whether such genomic subtyping results in improved patient outcomes.
In the study by Saad et al, the investigators evaluated whether the addition of the androgen receptor inhibitor apalutamide added to abiraterone would result in a higher radiographic progression free survival (rPFS) compared with abiraterone alone in patients with mCRPC. The combination resulted in an improvement in rPFS (24 versus 16.6 months); however, there was no improvement in overall survival. These results are similar to the Alliance A0321201 study, where enzalutamide was added to abiraterone, and no overall survival was observed. Further study is needed to determine if this combination strategy can work.
Supportive care aside from ASIs or chemotherapy directed against prostate cancer is also of critical importance to patients with metastatic prostate cancer. Previous studies have demonstrated that BMAs, such as denosumab or zoledronic acid, result in the prevention of skeletal-related events (SREs) in patients with mCRPC. However, this same benefit has not been demonstrated in metastatic castrate sensitive prostate cancer (mCSPC); therefore, BMAs are not recommended in this population unless they are at high risk for osteoporotic fracture. Mitchell et al. evaluated a retrospective cohort identified from Surveillance, Epidemiology, and End Results (SEER)-Medicare data to determine the number of patients with likely mCSPC treated with a BMA (defined as prescribed a BMA within 180 or 90 days after initial diagnosis of metastatic disease). A significant number of patients with likely mCSPC were prescribed BMAs within 180 days of diagnosis (23.6% of the cohort) and within 90 days (18.4% of the cohort). It is likely that most of these patients inappropriately received BMAs and were potentially subject to unnecessary costs and toxicity. Further study of strategies to reduce inappropriate BMA use could lead to less toxicity and lower costs.
MS and COVID: Docs switched DMTs but maybe didn’t need to
These are the messages of a pair of new studies that examine the impact of the pandemic on the treatment of MS.
One report finds that 80% of specialists surveyed in the summer of 2020 said the pandemic may have changed how they prescribe disease-modifying therapies (DMTs). However, the other report finds no evidence that choice of DMT affects risk of COVID-19 infection. Both studies were presented at the 2021 Annual Meeting of the Consortium of Multiple Sclerosis Centers (CMSC).
For the survey, researchers led by neurologist Elizabeth H. Morrison-Banks, MD, of the University of California, Riverside, sent questions to 188 clinicians who serve on regional National Multiple Sclerosis Society Healthcare Provider Councils. A total of 86 people responded: 45 physicians, 18 rehabilitation therapists, 7 psychologists, 8 advanced practice clinicians, 4 social workers, 2 nurses, a pharmacist, and a researcher.
The results, which were published earlier in 2021 in Multiple Sclerosis and Related Disorders, revealed that the survey participants were prescribing certain DMTs more often: beta-interferons (prescribed more by 28.6% of prescribers), natalizumab (23.8%), and glatiramer acetate (21.4%). Those prescribed less included alemtuzumab (64.2% prescribed it less), cladribine (52.4%), and B cell–depleting agents including ocrelizumab and rituximab (50%). Some specialists suspended drugs entirely (21.4% for alemtuzumab, 16.7% for B cell–depleting agents) or extending dosing intervals (38.1% for natalizumab, 11.9% for fingolimod and siponimod).
“We suspect that some of the lower-efficacy therapies were prescribed more often because these therapies were much less immunosuppressive, and because they did not require in-person visits that would increase risk of viral exposure from infusion center staff, or from other infusion patients,” Dr. Morrison-Banks said in an interview. “We also suspect that some of our survey respondents may have increased the dosing intervals for higher-efficacy therapies such as B cell–modulating agents – or even avoided these therapies altogether – because they were concerned that immunosuppressive agents might trigger severe complications from COVID-19.”
As she noted, “in retrospect, at least some of the concerns expressed in our survey may not have been entirely warranted, but then again, we all knew even less then about COVID-19.”
Indeed, researchers led by neurologist Tyler E. Smith, MD, of New York University Langone Multiple Sclerosis Care Center are reporting that they couldn’t find any link between the following DMTs and higher rates of COVID-19 at the New York City center: rituximab, ocrelizumab, fumerate (dimethyl fumarate, monomethyl fumarate, diroximel fumarate), sphingosine-1-phosphate modulators (fingolimod, siponimod), and natalizumab.
The researchers tracked 1,439 patients with MS who were taking the DMTs from March 2020 to March 2021. Of those, 16.0% were infected with COVID-19 (75% lab confirmed), 6.5% were hospitalized, and 0.9% died.
“We did not find an association between the choice of disease-modifying therapy and developing COVID-19 infection, nor having increased disease severity,” Dr. Smith said in an interview. “We are still analyzing data and hope to publish an updated analysis, but at this point, we don’t have conclusive evidence that DMTs, including anti-CD20 agents, need to be changed to lower the risk of COVID-19.”
Instead, he said, “at this point, we feel our energies should be spent on educating our patients on importance of vaccines and boosters. I don’t think it is necessary to switch DMTs because of COVID-19 concerns. However, this should be reviewed on a case-by-case basis.”
No funding is reported for the survey study, and the authors reported various disclosures. The DMT study was funded by an investigator-initiated grant from the Consortium of Multiple Sclerosis Centers, and the authors reported various disclosures.
FROM CMSC 2021