User login
Should you adopt the practice of vaginal cleansing with povidone-iodine prior to cesarean delivery?
There are approximately 4,000,000 births annually in the United States, and about 32% of them occur by cesarean delivery. Compared with vaginal birth, cesarean delivery is associated with an increased risk of endometritis (defined as fever plus uterine or abdominal tenderness). Although surgical complications cannot be eliminated entirely, surgeons are deeply dedicated to the continuous improvement of surgical practice in order to reduce the risk of complications.
With cesarean delivery, many surgical practices have been adopted universally to reduce postoperative complications, including administration of intravenous (IV) antibiotics before skin incision to minimize postoperative infection and the use of postoperative mechanical or pharmacologic interventions to help prevent venous thromboembolism and pulmonary embolism. Preoperative vaginal cleansing with povidone-iodine may reduce the risk of postoperative endometritis, but the practice is not currently common in the United States.
Should you adopt a policy of preoperative vaginal cleansing prior to cesarean delivery? The data suggest perhaps you should.
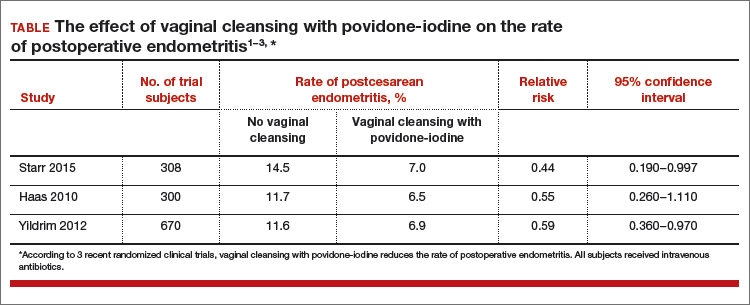
Data-driven support for povidone-iodine precesareanThree large randomized trials published within the past 10 years concluded that preoperative vaginal cleansing with povidone-iodine reduced the risk of postcesarean endometritis in women who also received prophylactic IV antibiotics (TABLE).1−3 Vaginal cleansing did not reduce the rate of postpartum fever or wound infection in these studies.
Clinical factors that increased the risk of postpartum endometritis independent of vaginal cleansing included:
- extended duration of cesarean surgery
- being in labor prior to cesarean delivery
- ruptured membranes
- advanced cervical examination
- maternal anemia
- use of intrapartum internal monitors
- prior history of genitourinary infection.
Authors of two recent, large nonrandomized studies also have reported that vaginal cleansing reduced the risk of postcesarean endometritis.4,5 By contrast, investigators from one large trial from 2001 did not observe a decrease in endometritis with vaginal cleansing.6
To test the impact of metronidazole vaginal gel on post‑cesarean endometritis, 224 women undergoing cesarean delivery for various indications were randomly assigned to placebo vaginal gel or metronidazole vaginal gel 5 g prior to surgery initiation.1 Most women also received intravenous antibiotics. The rates of endometritis were 17% and 7% in the placebo and metronidazole groups, respectively (relative risk, 0.42; 95% confidence interval, 0.19−0.92).
Vaginal antibiotic administration shows promise as an alternative to povidone-iodine cleansing in the prevention of postcesarean endometritis. Additional randomized clinical trials are necessary to fully evaluate the benefits and risks of this practice.
Reference
1. Pitt C, Sanchez-Ramos L, Kaunitz AM. Adjunctive intravaginal metronidazole for the prevention of postcesarean endometritis: a randomized controlled trial. Obstet Gynecol. 2001;98(5 pt 1):745−750.
Cochrane review of precesarean vaginal cleansingAuthors of a Cochrane review, in which they synthesized 7 studies involving 2,635 women, reported that vaginal cleansing with povidone-iodine immediately before cesarean delivery was associated with a reduced risk of postcesarean endometritis: 8.3% vs 4.3% in the control and vaginal cleansing groups, respectively, (risk ratio [RR], 0.45; 95% confidence interval [CI], 0.25−0.81).7
The positive effect of vaginal cleansing was particularly noteworthy in the subgroup of women with ruptured membranes (3 trials involving 272 women). The rates of endometritis in the control versus vaginal cleansing groups were 17.9% and 4.3%, respectively (RR, 0.24; 95% CI, 0.10−0.55).
Women who went into labor prior to cesarean delivery (523 women from 3 trials) also benefitted from vaginal cleansing, with endometritis rates of 13.0% and 7.4% in the control and vaginal cleansing groups, respectively (RR, 0.56; 95% CI, 0.34−0.95).
In this review, again, vaginal cleansing did not significantly reduce the rate of postoperative fever or wound infection.
The American College of Obstetricians and Gynecologists has noted that chlorohexidine gluconate solutions with high concentrations of alcohol are contraindicated for vaginal cleansing.1 However, although not approved for vaginal cleansing, solutions of chlorohexidine gluconate with low alcohol content (4% alcohol concentration) are safe and may be effective for off-label use as vaginal cleansings.
Reference
1. American College of Obstetricians and Gynecologists Women’s Health Care Physicians; Committee on Gynecologic Practice. Committee Opinion No. 571: solutions for surgical cleansing of the vagina. Obstet Gynecol. 2013;122(3):718−720.
Is vaginal cleansing prior to cesarean delivery best practice?In the United States, precesarean vaginal cleansing is not a common practice. To close the gap between current practice and what is potentially a best practice, two approaches to using vaginal cleansing could be instituted in delivery units.
Approach #1: A liberal clinical protocol. In this scenario, all women (who are not allergic to iodine or povidone-iodine) undergoing cesarean delivery should undergo vaginal cleansing. The World Health Organization conditionally recommends vaginal cleansing for all women undergoing a cesarean delivery.8
Approach #2: A focused clinical protocol. For this protocol, only women (again, who are not allergic to iodine or povidone-iodine) who have ruptured membranes or are in labor upon advanced cervical examination should receive vaginal cleansing.
The advantage of a liberal protocol is that vaginal preparation becomes embedded within the standard practice of cesarean delivery and, hence, is seldom overlooked. The upside of the focused protocol is that only those women most likely to benefit receive the intervention.
Tell me what you thinkWill you consider using vaginal cleansing in your practice? Please let me know your views on vaginal cleansing for cesarean delivery, as well as your clinical pearls on cesarean delivery surgery, at obgmanagement.com. In addition, weigh in on the Quick Poll posted to OBG Management’s homepage. Send your letter to the editor to [email protected].
- Starr RV, Zurawski J, Ismail M. Preoperative vaginal preparation with povidone-iodine and the risk of postcesarean endometritis. Obstet Gynecol. 2015;105(5 pt 1):1024–1029.
- Haas DM, Pazouki F, Smith RR, et al. Vaginal cleansing before cesarean delivery to reduce postoperative infectious morbidity: a randomized, controlled trial. Am J Obstet Gynecol. 2010;202(3):310.e1–e6.
- Yildrim G, Gungorduk K, Asicioglu O, et al. Does vaginal preparation with povidone-iodine prior to cesarean delivery reduce the risk of endometritis?A randomized controlled trial. J Matern Fetal Neonatal Med. 2012;25(11):2316–2321.
- Asghania M, Mirblouk F, Shakiba M, Faraji R. Preoperative vaginal preparation with povidone-iodine on post-cesarean infectious morbidity. J Obstet Gynaecol. 2011;31(5):400–403.
- Memon S, Qazi RA, Bibi S, Parveen N. Effect of preoperative vaginal cleansing with an antiseptic solution to reduce post caesarean infectious morbidity. J Pak Med Assoc. 2011;61(12):1179–1183.
- Reid VC, Hartmann KE, McMahon M, Fry EP. Vaginal preparation with povidone-iodine and postcesarean infectious morbidity: a randomized controlled trial. Obstet Gynecol. 2001;97(1):147–152.
- Haas DM, Morgan S, Contreras K. Vaginal preparation with antiseptic solution before cesarean section for preventing postoperative infections. Cochrane Database Syst Rev. 2014;12:CD007892.
- Yildrim G, Gungorduk K, Asicioglu O, et al. Does vaginal preparation with povidone-iodine prior to

Dr. Barbieri is Editor in Chief, OBG Management; Chair, Obstetrics and Gynecology, Brigham and Women’s Hospital; and Kate Macy Ladd Professor of Obstetrics, Gynecology, and Reproductive Biology, Harvard Medical School, Boston, Massachusetts.
Dr. Barbieri reports no financial relationships relevant to this article.
There are approximately 4,000,000 births annually in the United States, and about 32% of them occur by cesarean delivery. Compared with vaginal birth, cesarean delivery is associated with an increased risk of endometritis (defined as fever plus uterine or abdominal tenderness). Although surgical complications cannot be eliminated entirely, surgeons are deeply dedicated to the continuous improvement of surgical practice in order to reduce the risk of complications.
With cesarean delivery, many surgical practices have been adopted universally to reduce postoperative complications, including administration of intravenous (IV) antibiotics before skin incision to minimize postoperative infection and the use of postoperative mechanical or pharmacologic interventions to help prevent venous thromboembolism and pulmonary embolism. Preoperative vaginal cleansing with povidone-iodine may reduce the risk of postoperative endometritis, but the practice is not currently common in the United States.
Should you adopt a policy of preoperative vaginal cleansing prior to cesarean delivery? The data suggest perhaps you should.
Data-driven support for povidone-iodine precesareanThree large randomized trials published within the past 10 years concluded that preoperative vaginal cleansing with povidone-iodine reduced the risk of postcesarean endometritis in women who also received prophylactic IV antibiotics (TABLE).1−3 Vaginal cleansing did not reduce the rate of postpartum fever or wound infection in these studies.
Clinical factors that increased the risk of postpartum endometritis independent of vaginal cleansing included:
- extended duration of cesarean surgery
- being in labor prior to cesarean delivery
- ruptured membranes
- advanced cervical examination
- maternal anemia
- use of intrapartum internal monitors
- prior history of genitourinary infection.
Authors of two recent, large nonrandomized studies also have reported that vaginal cleansing reduced the risk of postcesarean endometritis.4,5 By contrast, investigators from one large trial from 2001 did not observe a decrease in endometritis with vaginal cleansing.6
To test the impact of metronidazole vaginal gel on post‑cesarean endometritis, 224 women undergoing cesarean delivery for various indications were randomly assigned to placebo vaginal gel or metronidazole vaginal gel 5 g prior to surgery initiation.1 Most women also received intravenous antibiotics. The rates of endometritis were 17% and 7% in the placebo and metronidazole groups, respectively (relative risk, 0.42; 95% confidence interval, 0.19−0.92).
Vaginal antibiotic administration shows promise as an alternative to povidone-iodine cleansing in the prevention of postcesarean endometritis. Additional randomized clinical trials are necessary to fully evaluate the benefits and risks of this practice.
Reference
1. Pitt C, Sanchez-Ramos L, Kaunitz AM. Adjunctive intravaginal metronidazole for the prevention of postcesarean endometritis: a randomized controlled trial. Obstet Gynecol. 2001;98(5 pt 1):745−750.
Cochrane review of precesarean vaginal cleansingAuthors of a Cochrane review, in which they synthesized 7 studies involving 2,635 women, reported that vaginal cleansing with povidone-iodine immediately before cesarean delivery was associated with a reduced risk of postcesarean endometritis: 8.3% vs 4.3% in the control and vaginal cleansing groups, respectively, (risk ratio [RR], 0.45; 95% confidence interval [CI], 0.25−0.81).7
The positive effect of vaginal cleansing was particularly noteworthy in the subgroup of women with ruptured membranes (3 trials involving 272 women). The rates of endometritis in the control versus vaginal cleansing groups were 17.9% and 4.3%, respectively (RR, 0.24; 95% CI, 0.10−0.55).
Women who went into labor prior to cesarean delivery (523 women from 3 trials) also benefitted from vaginal cleansing, with endometritis rates of 13.0% and 7.4% in the control and vaginal cleansing groups, respectively (RR, 0.56; 95% CI, 0.34−0.95).
In this review, again, vaginal cleansing did not significantly reduce the rate of postoperative fever or wound infection.
The American College of Obstetricians and Gynecologists has noted that chlorohexidine gluconate solutions with high concentrations of alcohol are contraindicated for vaginal cleansing.1 However, although not approved for vaginal cleansing, solutions of chlorohexidine gluconate with low alcohol content (4% alcohol concentration) are safe and may be effective for off-label use as vaginal cleansings.
Reference
1. American College of Obstetricians and Gynecologists Women’s Health Care Physicians; Committee on Gynecologic Practice. Committee Opinion No. 571: solutions for surgical cleansing of the vagina. Obstet Gynecol. 2013;122(3):718−720.
Is vaginal cleansing prior to cesarean delivery best practice?In the United States, precesarean vaginal cleansing is not a common practice. To close the gap between current practice and what is potentially a best practice, two approaches to using vaginal cleansing could be instituted in delivery units.
Approach #1: A liberal clinical protocol. In this scenario, all women (who are not allergic to iodine or povidone-iodine) undergoing cesarean delivery should undergo vaginal cleansing. The World Health Organization conditionally recommends vaginal cleansing for all women undergoing a cesarean delivery.8
Approach #2: A focused clinical protocol. For this protocol, only women (again, who are not allergic to iodine or povidone-iodine) who have ruptured membranes or are in labor upon advanced cervical examination should receive vaginal cleansing.
The advantage of a liberal protocol is that vaginal preparation becomes embedded within the standard practice of cesarean delivery and, hence, is seldom overlooked. The upside of the focused protocol is that only those women most likely to benefit receive the intervention.
Tell me what you thinkWill you consider using vaginal cleansing in your practice? Please let me know your views on vaginal cleansing for cesarean delivery, as well as your clinical pearls on cesarean delivery surgery, at obgmanagement.com. In addition, weigh in on the Quick Poll posted to OBG Management’s homepage. Send your letter to the editor to [email protected].
- Starr RV, Zurawski J, Ismail M. Preoperative vaginal preparation with povidone-iodine and the risk of postcesarean endometritis. Obstet Gynecol. 2015;105(5 pt 1):1024–1029.
- Haas DM, Pazouki F, Smith RR, et al. Vaginal cleansing before cesarean delivery to reduce postoperative infectious morbidity: a randomized, controlled trial. Am J Obstet Gynecol. 2010;202(3):310.e1–e6.
- Yildrim G, Gungorduk K, Asicioglu O, et al. Does vaginal preparation with povidone-iodine prior to cesarean delivery reduce the risk of endometritis?A randomized controlled trial. J Matern Fetal Neonatal Med. 2012;25(11):2316–2321.
- Asghania M, Mirblouk F, Shakiba M, Faraji R. Preoperative vaginal preparation with povidone-iodine on post-cesarean infectious morbidity. J Obstet Gynaecol. 2011;31(5):400–403.
- Memon S, Qazi RA, Bibi S, Parveen N. Effect of preoperative vaginal cleansing with an antiseptic solution to reduce post caesarean infectious morbidity. J Pak Med Assoc. 2011;61(12):1179–1183.
- Reid VC, Hartmann KE, McMahon M, Fry EP. Vaginal preparation with povidone-iodine and postcesarean infectious morbidity: a randomized controlled trial. Obstet Gynecol. 2001;97(1):147–152.
- Haas DM, Morgan S, Contreras K. Vaginal preparation with antiseptic solution before cesarean section for preventing postoperative infections. Cochrane Database Syst Rev. 2014;12:CD007892.
- Yildrim G, Gungorduk K, Asicioglu O, et al. Does vaginal preparation with povidone-iodine prior to
Can transabdominal ultrasound exclude short cervix?
Preterm birth (PTB) remains a major cause of perinatal morbidity and mortality, and so its prediction and prevention are 2 of the most important issues in obstetrics. Cervical length (CL) measured by ultrasound has been shown to be the best predictor; several interventions (vaginal progesterone and cerclage) have been shown to be effective at reducing PTB if a short CL is identified. In fact, both the American College of Obstetricians and Gynecologists (ACOG) and the Society for Maternal-Fetal Medicine (SMFM) recommend CL being measured every 2 weeks from 16 to 23 weeks in singletons with prior spontaneous PTB (sPTB), with cerclage placed for CL less than 25 mm. Moreover, both ACOG and SMFM recommend that “universal CL screening” (CL measured in singletons without a prior sPTB) be considered as a single measurement at about 18 to 23 weeks.
Details of the study
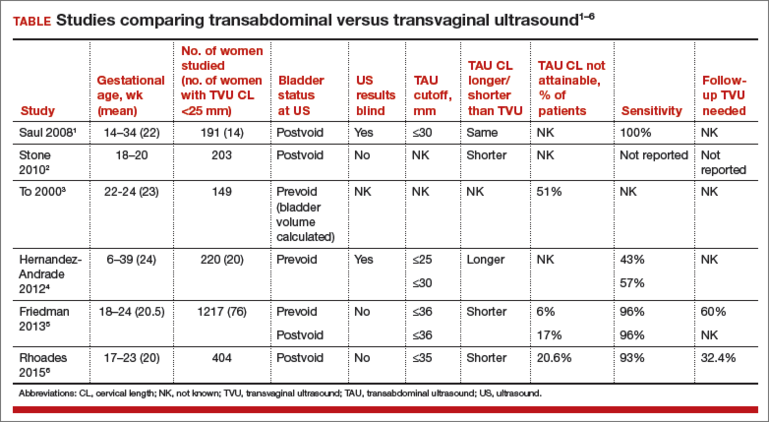
Rhoades and colleagues present data on CL screening done by transabdominal ultrasound (TAU), as an alternative to transvaginal ultrasound (TVU). This study confirms early data:
- TAU cannot visualize CL in several women (20.6%).
- To make sure a high sensitivity (92.9% in this study) is achieved to detect a TVU CL less than 30 mm, a high cutoff (in this case 35 mm) needs to be used with TAU. Nonetheless, 7% of women with a short TVU CL would not be detected, raising clinical and legal issues.
- A high percentage (in this case 32.4%; 103/318) of women screened by TAU would screen positive (TAU CL less than 35 mm) and therefore need to have a TVU anyway.
- Overall, more than 50% (in this study 53%–20.6% because TAU could not visualize CL, and 32.4% because TAU was less than 35 mm) of women having TAU CL screening would need to have TVU anyway! In the largest study comparing TAU to TVU CL screening (TABLE1–6), 66% of women screened by TAU would have to be screened also by TVU.5
There are several other reasons why TVU is considered the gold standard for CL screening, and instead TAU CL should be avoided as possible. All randomized controlled trials that showed benefit from interventions (vaginal progesterone, cerclage, pessary) aimed at decreasing PTB in women with short CL used TVU CL screening and never TAU CL screening. In addition, TAU CL is less accurate than TVU CL screening. On TAU, fetal parts can obscure the cervix, obesity makes it hard to visualize CL, the distance between probe and cervix is longer, manual pressure can mask CL shortening, and bladder filling can elongate CL.7 Cost-effectiveness studies show that TVU CL screening is more effective, and less costly, compared with TAU CL screening, even in singletons without a prior sPTB.8
Societies such as ACOG and SMFM all have recommended TVU CL for prediction and prevention of PTB, over TAU CL.9,10 Importantly, a TVU CL should be done by sonographers educated and trained formally, through such programs as those made available by SMFM.11
What this evidence means for practice
If CL assessment is done, TVU should be preferred, as it is the gold standard, and not TAU.
>>Vincenzo Berghella, MD
Share your thoughts on this article! Send your Letter to the Editor to [email protected]. Please include your name and the city and state in which you practice.
- Saul LL, Kurtzman JT, Hagemann C, Ghamsary M, Wing DA. Is transabdominal sonography of the cervix after voiding a reliable method of cervical length assessment? J Ultrasound Med. 2008;27(9):1305−1311.
- Stone PR, Chan EH, McCowan LM, Taylor RS, Mitchell JM; SCOPE Consortium. Aust N Z J Obstet Gynaecol. 2010;50(6):523−527.
- To MS, Skentou C, Cicero S, Nicolaides KH. Cervical assessment at the routine 23-weeks’ scan: problems with transabdominal sonography. Ultrasound Obstet Gynecol 2000;15(4):292−296.
- Hernandez-Andrade E, Romero R, Ahn H, et al. Transabdominal evaluation of uterine cervical length during pregnancy fails to identify a substantial number of women with a short cervix. 2012;25(9):1682−1689.
- Friedman AM, Srinivas SK, Parry S, et al. Can transabdominal ultrasound be used as a screening test for short cervical length? Am J Obstet Gynecol. 2013;208(3):190.e1−e7.
- Rhoades JS, Park JM, Stout MJ, Macones GA, Cahill AG, Tuuli MG. Can transabdominal cervical length measurement exclude short cervix? 2015 Nov 2. [Epub ahead of print]
- Berghella V, Bega G, Tolosa JE, Berghella M. Ultrasound assessment of the cervix. Clin Obstet Gynecol. 2003; 46(4):947–623.
- Miller ES, Grobman WA. Cost-effectiveness of transabdominal ultrasound for cervical length screening for preterm birth prevention. Am J Obstet Gynecol. 2013;209(6): 546.e1–e6.
- American College of Obstetricians and Gynecologists. Practice bulletin No. 130: prediction and prevention of preterm birth. Obstet Gynecol. 2012;120(4):964–973.
- Society for Maternal-Fetal Medicine Publications Committee; Berghella V. Progesterone and preterm birth prevention: translating clinical trial data into clinical practice. Am J Obstet Gynecol. 2012;206(5):376–386.
- Cervical Length Education and Review (CLEAR) guidelines. https://clear.perinatalquality.org. Published 2015. Accessed December 15, 2015.
Preterm birth (PTB) remains a major cause of perinatal morbidity and mortality, and so its prediction and prevention are 2 of the most important issues in obstetrics. Cervical length (CL) measured by ultrasound has been shown to be the best predictor; several interventions (vaginal progesterone and cerclage) have been shown to be effective at reducing PTB if a short CL is identified. In fact, both the American College of Obstetricians and Gynecologists (ACOG) and the Society for Maternal-Fetal Medicine (SMFM) recommend CL being measured every 2 weeks from 16 to 23 weeks in singletons with prior spontaneous PTB (sPTB), with cerclage placed for CL less than 25 mm. Moreover, both ACOG and SMFM recommend that “universal CL screening” (CL measured in singletons without a prior sPTB) be considered as a single measurement at about 18 to 23 weeks.
Details of the study
Rhoades and colleagues present data on CL screening done by transabdominal ultrasound (TAU), as an alternative to transvaginal ultrasound (TVU). This study confirms early data:
- TAU cannot visualize CL in several women (20.6%).
- To make sure a high sensitivity (92.9% in this study) is achieved to detect a TVU CL less than 30 mm, a high cutoff (in this case 35 mm) needs to be used with TAU. Nonetheless, 7% of women with a short TVU CL would not be detected, raising clinical and legal issues.
- A high percentage (in this case 32.4%; 103/318) of women screened by TAU would screen positive (TAU CL less than 35 mm) and therefore need to have a TVU anyway.
- Overall, more than 50% (in this study 53%–20.6% because TAU could not visualize CL, and 32.4% because TAU was less than 35 mm) of women having TAU CL screening would need to have TVU anyway! In the largest study comparing TAU to TVU CL screening (TABLE1–6), 66% of women screened by TAU would have to be screened also by TVU.5
There are several other reasons why TVU is considered the gold standard for CL screening, and instead TAU CL should be avoided as possible. All randomized controlled trials that showed benefit from interventions (vaginal progesterone, cerclage, pessary) aimed at decreasing PTB in women with short CL used TVU CL screening and never TAU CL screening. In addition, TAU CL is less accurate than TVU CL screening. On TAU, fetal parts can obscure the cervix, obesity makes it hard to visualize CL, the distance between probe and cervix is longer, manual pressure can mask CL shortening, and bladder filling can elongate CL.7 Cost-effectiveness studies show that TVU CL screening is more effective, and less costly, compared with TAU CL screening, even in singletons without a prior sPTB.8
Societies such as ACOG and SMFM all have recommended TVU CL for prediction and prevention of PTB, over TAU CL.9,10 Importantly, a TVU CL should be done by sonographers educated and trained formally, through such programs as those made available by SMFM.11
What this evidence means for practice
If CL assessment is done, TVU should be preferred, as it is the gold standard, and not TAU.
>>Vincenzo Berghella, MD
Share your thoughts on this article! Send your Letter to the Editor to [email protected]. Please include your name and the city and state in which you practice.
- Saul LL, Kurtzman JT, Hagemann C, Ghamsary M, Wing DA. Is transabdominal sonography of the cervix after voiding a reliable method of cervical length assessment? J Ultrasound Med. 2008;27(9):1305−1311.
- Stone PR, Chan EH, McCowan LM, Taylor RS, Mitchell JM; SCOPE Consortium. Aust N Z J Obstet Gynaecol. 2010;50(6):523−527.
- To MS, Skentou C, Cicero S, Nicolaides KH. Cervical assessment at the routine 23-weeks’ scan: problems with transabdominal sonography. Ultrasound Obstet Gynecol 2000;15(4):292−296.
- Hernandez-Andrade E, Romero R, Ahn H, et al. Transabdominal evaluation of uterine cervical length during pregnancy fails to identify a substantial number of women with a short cervix. 2012;25(9):1682−1689.
- Friedman AM, Srinivas SK, Parry S, et al. Can transabdominal ultrasound be used as a screening test for short cervical length? Am J Obstet Gynecol. 2013;208(3):190.e1−e7.
- Rhoades JS, Park JM, Stout MJ, Macones GA, Cahill AG, Tuuli MG. Can transabdominal cervical length measurement exclude short cervix? 2015 Nov 2. [Epub ahead of print]
- Berghella V, Bega G, Tolosa JE, Berghella M. Ultrasound assessment of the cervix. Clin Obstet Gynecol. 2003; 46(4):947–623.
- Miller ES, Grobman WA. Cost-effectiveness of transabdominal ultrasound for cervical length screening for preterm birth prevention. Am J Obstet Gynecol. 2013;209(6): 546.e1–e6.
- American College of Obstetricians and Gynecologists. Practice bulletin No. 130: prediction and prevention of preterm birth. Obstet Gynecol. 2012;120(4):964–973.
- Society for Maternal-Fetal Medicine Publications Committee; Berghella V. Progesterone and preterm birth prevention: translating clinical trial data into clinical practice. Am J Obstet Gynecol. 2012;206(5):376–386.
- Cervical Length Education and Review (CLEAR) guidelines. https://clear.perinatalquality.org. Published 2015. Accessed December 15, 2015.
Insulin resistance in 22% of men with acne
Young adult men with acne were more likely to have insulin resistance and to have higher fasting plasma glucose levels than were men of the same age who did not have acne, in a cross-sectional study of 20 to 32 year old men in India.
In a study published online in JAMA Dermatology, on Dec. 23 (doi: 10.1001/jamadermatol.2015.4499), Dr. Mohit Nagpal, of the Postgraduate Institute of Medical Education and Research, Chandigarh, India, and associates, wrote that “Insulin resistance may be a stage of prediabetes, and the patients may develop hyperinsulinemia or type 2 diabetes in the future. These patients should be followed up to determine whether they develop conditions associated with insulin resistance.”

The researchers compared 100 men with acne, aged 20 to 32 years, with 100 age-matched men who did not have acne and were being treated for non-acne dermatoses; all were being treated at the Institute’s dermatology outpatient department. Insulin resistance, as defined by a Homeostasis Model Assessment–Insulin Resistance (HOMA-IR) value greater than 2.5, was present in 22% of those with acne, vs. 11% of those without acne, a significant difference (P = .036). Metabolic syndrome, based on criteria of the modified National Cholesterol Education Program’s Adult Treatment Panel III (NCEP-ATP III), was more common among those with acne (17% vs. 9%), but the difference was not significant (P = .09).
The mean diastolic and systolic blood pressure values were also significantly higher among those with acne, compared with controls, as were mean fasting plasma glucose levels.
When evaluated by acne severity (mild, moderate, severe, or very severe), there were no significant differences in the prevalence of insulin resistance or metabolic syndrome between the four groups. However, the mean body mass index and the mean weights among those with very severe acne were significantly higher than among those with mild acne (P = .04).
The cross-sectional design of the study was a limitation, the authors noted, and future studies will “follow up patients with acne to assess the development of clinical conditions associated with insulin resistance,” such as acanthosis nigricans and metabolic syndrome.
In an accompanying editorial, Dr. Rachel V. Reynolds of Beth Israel Deaconess Medical Center, Boston, wrote that this study, and another study published in the same issue regarding insulin resistance and polycystic ovary syndrome, “highlight the important role that the dermatologist plays in identifying and characterizing patients with common skin disorders who may be at risk for metabolic and androgen-mediated disease.” The study, “to our knowledge, [is] the largest cohort to date examining the prevalence of insulin resistance and metabolic syndrome in postadolescent males with acne of varying severity,” she added (doi: 10.1001/jamadermatol.2015.4500).
The authors of the study had no disclosures.
Young adult men with acne were more likely to have insulin resistance and to have higher fasting plasma glucose levels than were men of the same age who did not have acne, in a cross-sectional study of 20 to 32 year old men in India.
In a study published online in JAMA Dermatology, on Dec. 23 (doi: 10.1001/jamadermatol.2015.4499), Dr. Mohit Nagpal, of the Postgraduate Institute of Medical Education and Research, Chandigarh, India, and associates, wrote that “Insulin resistance may be a stage of prediabetes, and the patients may develop hyperinsulinemia or type 2 diabetes in the future. These patients should be followed up to determine whether they develop conditions associated with insulin resistance.”
The researchers compared 100 men with acne, aged 20 to 32 years, with 100 age-matched men who did not have acne and were being treated for non-acne dermatoses; all were being treated at the Institute’s dermatology outpatient department. Insulin resistance, as defined by a Homeostasis Model Assessment–Insulin Resistance (HOMA-IR) value greater than 2.5, was present in 22% of those with acne, vs. 11% of those without acne, a significant difference (P = .036). Metabolic syndrome, based on criteria of the modified National Cholesterol Education Program’s Adult Treatment Panel III (NCEP-ATP III), was more common among those with acne (17% vs. 9%), but the difference was not significant (P = .09).
The mean diastolic and systolic blood pressure values were also significantly higher among those with acne, compared with controls, as were mean fasting plasma glucose levels.
When evaluated by acne severity (mild, moderate, severe, or very severe), there were no significant differences in the prevalence of insulin resistance or metabolic syndrome between the four groups. However, the mean body mass index and the mean weights among those with very severe acne were significantly higher than among those with mild acne (P = .04).
The cross-sectional design of the study was a limitation, the authors noted, and future studies will “follow up patients with acne to assess the development of clinical conditions associated with insulin resistance,” such as acanthosis nigricans and metabolic syndrome.
In an accompanying editorial, Dr. Rachel V. Reynolds of Beth Israel Deaconess Medical Center, Boston, wrote that this study, and another study published in the same issue regarding insulin resistance and polycystic ovary syndrome, “highlight the important role that the dermatologist plays in identifying and characterizing patients with common skin disorders who may be at risk for metabolic and androgen-mediated disease.” The study, “to our knowledge, [is] the largest cohort to date examining the prevalence of insulin resistance and metabolic syndrome in postadolescent males with acne of varying severity,” she added (doi: 10.1001/jamadermatol.2015.4500).
The authors of the study had no disclosures.
FROM JAMA DERMATOLOGY
Key clinical point: Acne in young men may be a sign of insulin resistance.
Major finding: 22% of the young men with acne had insulin resistance, compared with 11% of the age-matched controls, a significant difference (P = .036).
Data source: The cross-sectional study compared the prevalence of insulin resistance and metabolic syndrome in 100 men aged 20-32 years with acne and 100 age-matched controls without acne.
Disclosures: The authors had no disclosures.

Study: One-third of patients with bipolar disorders abnormally metabolized glucose
One-third of patients with bipolar disorders abnormally metabolized glucose, in a study of outpatients from two university hospitals in Germany.
The study included 85 euthymic patients with bipolar disorders, who underwent an oral glucose tolerance test, laboratory screening, and clinical measurements.

Seven percent of the patients tested positive for diabetes mellitus, while 27% of the patients showed prediabetic abnormalities, including abnormalities in glucose metabolism. Patients in both of these groups had significantly lower quality of life and global functioning.
Additional study findings were that higher body mass index, leptin, triglycerides, and C-reactive protein levels significantly increased the likelihood of an individual having pre-diabetes abnormalities or diabetes.
Low sample size was a weakness of the study, according to Karolina Leopold and her colleagues.
Read the full study in the Journal of Affective Disorders (doi: 10.1016/j.jad.2015.09.041).
One-third of patients with bipolar disorders abnormally metabolized glucose, in a study of outpatients from two university hospitals in Germany.
The study included 85 euthymic patients with bipolar disorders, who underwent an oral glucose tolerance test, laboratory screening, and clinical measurements.
Seven percent of the patients tested positive for diabetes mellitus, while 27% of the patients showed prediabetic abnormalities, including abnormalities in glucose metabolism. Patients in both of these groups had significantly lower quality of life and global functioning.
Additional study findings were that higher body mass index, leptin, triglycerides, and C-reactive protein levels significantly increased the likelihood of an individual having pre-diabetes abnormalities or diabetes.
Low sample size was a weakness of the study, according to Karolina Leopold and her colleagues.
Read the full study in the Journal of Affective Disorders (doi: 10.1016/j.jad.2015.09.041).
FROM THE JOURNAL OF AFFECTIVE DISORDERS

Long spine fusions can give patients improved quality of life
SAN DIEGO – When necessary, long fusions that extend from the C-spine to the pelvis can result in health-related quality of life improvements, results from a multicenter study suggest.
“Patients with spinal deformities will sometimes require long fusion constructs that extend into the cervical spine,” lead study author Dr. Han-Jo Kim said at the annual meeting of the Cervical Spine Research Society. “The prevalence of these cases is increasing, especially as revision surgery for conditions such as proximal junctional kyphosis increase. They are also indicated for other diagnoses, such a progressive cervical deformity, cervical myelopathy as well as neuromuscular disorders.”

Prior investigations that have examined outcomes for these long constructs usually focus on patients who have had fusions from the upper thoracic spine to the pelvis, added Dr. Kim, an orthopedic spine surgeon at the Hospital for Special Surgery, New York. “To my knowledge, there are no studies in the literature that report on the subset of patients who have had fusions from the cervical spine to the pelvis,” he said. “The question is, even though these revisions may be necessary, does surgical intervention result in improved outcomes for these patients despite the extent of these long fusions?”
In an effort to determine the outcomes and rates of complications in patients who had fusions from the cervical spine to the pelvis, Dr. Kim and his associates conducted a retrospective review of patients who underwent fusions from the cervical spine to the pelvis at four institutions during 2003-2014. The researchers administered outcome scores utilizing the Scoliosis Research Society 22 (SRS-22r) questionnaire; the Oswestry Disability Index (ODI); and the Neck Disability Index (NDI); and collected demographic data including age, body mass index, and follow-up time; medical history including comorbidity data, operative details, radiographic and articular outcomes data; and postoperative complications.
Of 55 patients initially included in the study, complete data were available for 46 (84%). Their average age was 42 years, nearly one-third (30%) were classified as ASA III, 4.2% were smokers, and the average follow-up time was 2.7 years. “The majority of these cases were revision operations, and osteotomies were performed in close to 60% of these patients,” Dr. Kim said. “The average operating time was over 300 minutes, and there was an average of over 2 L of blood loss for these cases.”
The researchers observed improvements in the activity, pain, and mental health domains of the SRS, as well as an improvement in the SRS total score, which improved from an average of 3.0 preoperatively to 3.5 postoperatively (P less than .01). This was greater than the minimally clinically important difference for the SRS-22r. “At least one [minimally clinically important difference] was met in all of the SRS domains, as well as in the NDI,” Dr. Kim said. “There was no change in the ODI, as we would expect for this patient subset.”
Radiographic outcomes improved significantly, he continued, with an average 31-degree correction in maximum kyphosis and a 3.3-cm improvement in sagittal vertical axis. The overall rate of complications was 71%, with major complications comprising about 39% of these cases. Medical complications were high as well (a rate of 61%), as was the rate of surgical complications (43%). More than half of the patients (54%) required reoperation during the follow-up period, and the rate of pseudarthrosis was 29%.
“These results demonstrate improved outcomes following cervical to pelvic fusions, despite the magnitude of their operations and extent of fusion,” Dr. Kim concluded. “In addition, despite the high rate of complications and reoperations, we noted a significant improvement in radiographic and clinical outcomes.”
Dr. Kim disclosed that he is a consultant for Zimmer Biomet and K2M.
SAN DIEGO – When necessary, long fusions that extend from the C-spine to the pelvis can result in health-related quality of life improvements, results from a multicenter study suggest.
“Patients with spinal deformities will sometimes require long fusion constructs that extend into the cervical spine,” lead study author Dr. Han-Jo Kim said at the annual meeting of the Cervical Spine Research Society. “The prevalence of these cases is increasing, especially as revision surgery for conditions such as proximal junctional kyphosis increase. They are also indicated for other diagnoses, such a progressive cervical deformity, cervical myelopathy as well as neuromuscular disorders.”
Prior investigations that have examined outcomes for these long constructs usually focus on patients who have had fusions from the upper thoracic spine to the pelvis, added Dr. Kim, an orthopedic spine surgeon at the Hospital for Special Surgery, New York. “To my knowledge, there are no studies in the literature that report on the subset of patients who have had fusions from the cervical spine to the pelvis,” he said. “The question is, even though these revisions may be necessary, does surgical intervention result in improved outcomes for these patients despite the extent of these long fusions?”
In an effort to determine the outcomes and rates of complications in patients who had fusions from the cervical spine to the pelvis, Dr. Kim and his associates conducted a retrospective review of patients who underwent fusions from the cervical spine to the pelvis at four institutions during 2003-2014. The researchers administered outcome scores utilizing the Scoliosis Research Society 22 (SRS-22r) questionnaire; the Oswestry Disability Index (ODI); and the Neck Disability Index (NDI); and collected demographic data including age, body mass index, and follow-up time; medical history including comorbidity data, operative details, radiographic and articular outcomes data; and postoperative complications.
Of 55 patients initially included in the study, complete data were available for 46 (84%). Their average age was 42 years, nearly one-third (30%) were classified as ASA III, 4.2% were smokers, and the average follow-up time was 2.7 years. “The majority of these cases were revision operations, and osteotomies were performed in close to 60% of these patients,” Dr. Kim said. “The average operating time was over 300 minutes, and there was an average of over 2 L of blood loss for these cases.”
The researchers observed improvements in the activity, pain, and mental health domains of the SRS, as well as an improvement in the SRS total score, which improved from an average of 3.0 preoperatively to 3.5 postoperatively (P less than .01). This was greater than the minimally clinically important difference for the SRS-22r. “At least one [minimally clinically important difference] was met in all of the SRS domains, as well as in the NDI,” Dr. Kim said. “There was no change in the ODI, as we would expect for this patient subset.”
Radiographic outcomes improved significantly, he continued, with an average 31-degree correction in maximum kyphosis and a 3.3-cm improvement in sagittal vertical axis. The overall rate of complications was 71%, with major complications comprising about 39% of these cases. Medical complications were high as well (a rate of 61%), as was the rate of surgical complications (43%). More than half of the patients (54%) required reoperation during the follow-up period, and the rate of pseudarthrosis was 29%.
“These results demonstrate improved outcomes following cervical to pelvic fusions, despite the magnitude of their operations and extent of fusion,” Dr. Kim concluded. “In addition, despite the high rate of complications and reoperations, we noted a significant improvement in radiographic and clinical outcomes.”
Dr. Kim disclosed that he is a consultant for Zimmer Biomet and K2M.
AT CSRS 2015
Key clinical point: Following cervical to pelvic fusions, patients can achieve improved clinical and quality of life outcomes.
Major finding: The Scoliosis Research Society total score improved from an average of 3.0 preoperatively to 3.5 postoperatively (P less than .01).
Data source: A retrospective review of 55 patients who underwent fusions from the cervical spine to the pelvis at four institutions during 2003-2014.
Disclosures: Dr. Kim disclosed that he is a consultant for Zimmer Biomet and K2M.

Resident Guide to Advocacy in Dermatology
It is never too early (or too late!) to get involved in dermatology advocacy. Residency is an ideal time to start learning about advocating on behalf of the specialty of dermatology as well as on behalf of our patients. Many opportunities are available for residents to gain experience and become advocates on national and grassroots levels. As residents, participating in these efforts can help set a solid foundation for future involvement in advocacy, regardless of our ultimate career goals.
American Medical Association
The mission of the American Medical Association (AMA) is “to promote the art and science of medicine and the betterment of public health.”1 Joining the AMA costs $45 for 1 year of resident membership (with a discounted rate for multiyear memberships). As a member, you are given the opportunity to cast a ballot for the national medical specialty society that best represents you in the House of Delegates, the AMA’s principle policy-making body.2 The more votes a particular society receives, the more delegates from that society are added to the House of Delegates, meaning more representation for that specialty organization. It is advised that members choose the society that best represents them: for dermatologists, this most likely would be the American Academy of Dermatology (AAD), among other dermatology organizations that are candidates (ie, the American College of Mohs Surgery, the American Society for Dermatologic Surgery, and the Society for Investigative Dermatology). This representation is key for a specialty like dermatology, which has a relatively smaller number of physicians compared to other larger specialties and therefore has less representation in the House of Delegates.
Additionally, AMA membership grants you access to the entire Journal of the American Medical Association network including a subscription to the specialty journal of your choice.
Patient Advocacy
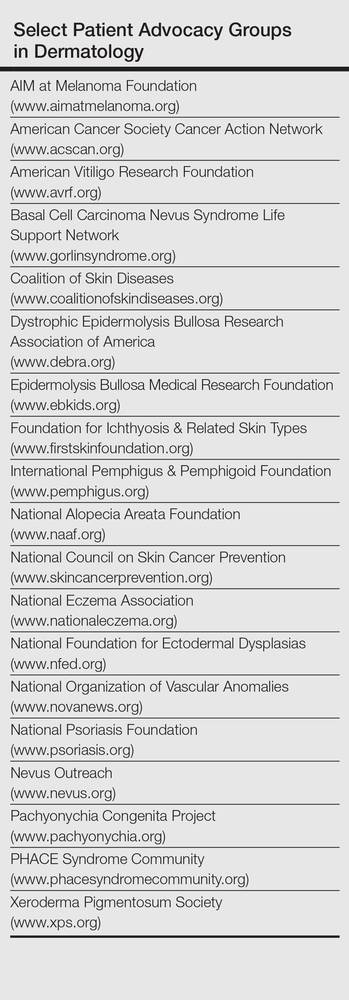
Patient advocacy groups generally have 3 main goals: education (for patients, patient support networks, and the layperson), research, and lobbying for issues that are in the interest of patients and treatment of dermatologic conditions (eg, funding support, regulation of medical devices, etc).3 In dermatology, the number of patient advocacy groups is growing to represent a myriad of dermatologic conditions, from common conditions like psoriasis to rare genodermatoses (Table). As dermatologists in training, it is key for residents to be involved in patient advocacy and to be aware of the resources that exist for patients to access educational information and support for their respective conditions. These educational materials can help provide more comprehensive care for patients and give patients more autonomy in choosing a physician or hospital to manage their care, help patients become more knowledgeable about available treatment options, and arm patients with more information to address questions that may arise from laypeople regarding their condition.
In terms of patient education, the resources available to patients include informational websites, access to educational materials like pamphlets and multimedia (eg, videos), and special events; for example, the National Psoriasis Foundation hosts walks for patients and their friends and family to raise money for the organization as well as to promote psoriasis awareness and give patients an opportunity to build a support network. Patient advocacy groups also help raise funding for research and have shown to be influential in research initiatives that are granted funding.3 Often, these groups also play a political role and take part in lobbying efforts by patients and support groups by working with politicians to raise awareness or request financial support for particular skin diseases.
The Society for Investigative Dermatology sponsors an application for mobile devices that can assist residents in referring patients to support and advocacy groups (http://www.skinadvocateapp.com).
Grassroots Advocacy
Grassroots advocacy in dermatology means that an individual or group of individuals (in this case, a resident or group of residents) is motivated to take action by contacting legislators and other government officials about gaps in funding and regulation for particular dermatology issues. These efforts often are noticed and taken into consideration by politicians because it is in their best interest to listen to their constituents rather than risk losing support.
The American Academy of Dermatology Association, the advocacy entity of the AAD, hosts the Dermatology Advocacy Network (www.aad-dan.com/default.aspx), which is dedicated to helping dermatologists become advocates. The DAN website helps residents easily identify and contact their local, state, and national legislators to discuss issues or concerns related to the dermatology specialty and medicine as a whole. For example, tanning bed regulation currently is a priority among dermatologists, and the DAN website provides customizable form letters that can be sent electronically to legislators for review.
Furthermore, the AAD offers helpful resources and suggestions for dermatologists and dermatology residents who want to get involved with grassroots advocacy efforts. The website (www.aad.org/advocacy) details current AAD advocacy priorities as well as specific topics such as Medicare physician payment, skin cancer and indoor tanning, drug pricing and availability, state policy, and network adequacy, as these are high-priority issues identified by the AAD that would benefit from action by its members.
Final Thoughts
Many opportunities exist for dermatology residents to get involved in advocacy, from opportunities on the national level with the AMA to patient advocacy and grassroots efforts. It is important for dermatology residents to get involved in advocacy efforts during their training so they may continue to be involved in these efforts as their careers develop. Advocacy helps keep the dermatology specialty relevant and maintain its voice in the national medical arena. It also enhances the dermatology resident’s ability to provide comprehensive quality care for patients by addressing some of their educational and supportive needs that perhaps cannot be addressed in a clinic visit alone. Advocacy also gives residents the opportunity to network and meet colleagues and other individuals with similar goals and interests, which may be beneficial for their future careers. Thus, early involvement in advocacy may be a productive and interesting part of dermatology residency for trainees to be further involved in the specialty.
- AMA mission & guiding principles. American Medical Association Web site. http://www.ama-assn.org/ama/pub/about-ama.page?. Accessed December 22, 2015.
- Specialty Society Representation Ballot. American Medical Association Web site. http://www.ama-assn.org/ama/pub/about-ama/our-people/the-federation-medicine/specialty-society-ballot.page. Accessed December 22, 2015.
- Nijsten T, Bergstresser PR. Patient advocacy groups: let’s stick together. J Invest Dermatol. 2010;130:1757-1759.
It is never too early (or too late!) to get involved in dermatology advocacy. Residency is an ideal time to start learning about advocating on behalf of the specialty of dermatology as well as on behalf of our patients. Many opportunities are available for residents to gain experience and become advocates on national and grassroots levels. As residents, participating in these efforts can help set a solid foundation for future involvement in advocacy, regardless of our ultimate career goals.
American Medical Association
The mission of the American Medical Association (AMA) is “to promote the art and science of medicine and the betterment of public health.”1 Joining the AMA costs $45 for 1 year of resident membership (with a discounted rate for multiyear memberships). As a member, you are given the opportunity to cast a ballot for the national medical specialty society that best represents you in the House of Delegates, the AMA’s principle policy-making body.2 The more votes a particular society receives, the more delegates from that society are added to the House of Delegates, meaning more representation for that specialty organization. It is advised that members choose the society that best represents them: for dermatologists, this most likely would be the American Academy of Dermatology (AAD), among other dermatology organizations that are candidates (ie, the American College of Mohs Surgery, the American Society for Dermatologic Surgery, and the Society for Investigative Dermatology). This representation is key for a specialty like dermatology, which has a relatively smaller number of physicians compared to other larger specialties and therefore has less representation in the House of Delegates.
Additionally, AMA membership grants you access to the entire Journal of the American Medical Association network including a subscription to the specialty journal of your choice.
Patient Advocacy
Patient advocacy groups generally have 3 main goals: education (for patients, patient support networks, and the layperson), research, and lobbying for issues that are in the interest of patients and treatment of dermatologic conditions (eg, funding support, regulation of medical devices, etc).3 In dermatology, the number of patient advocacy groups is growing to represent a myriad of dermatologic conditions, from common conditions like psoriasis to rare genodermatoses (Table). As dermatologists in training, it is key for residents to be involved in patient advocacy and to be aware of the resources that exist for patients to access educational information and support for their respective conditions. These educational materials can help provide more comprehensive care for patients and give patients more autonomy in choosing a physician or hospital to manage their care, help patients become more knowledgeable about available treatment options, and arm patients with more information to address questions that may arise from laypeople regarding their condition.
In terms of patient education, the resources available to patients include informational websites, access to educational materials like pamphlets and multimedia (eg, videos), and special events; for example, the National Psoriasis Foundation hosts walks for patients and their friends and family to raise money for the organization as well as to promote psoriasis awareness and give patients an opportunity to build a support network. Patient advocacy groups also help raise funding for research and have shown to be influential in research initiatives that are granted funding.3 Often, these groups also play a political role and take part in lobbying efforts by patients and support groups by working with politicians to raise awareness or request financial support for particular skin diseases.
The Society for Investigative Dermatology sponsors an application for mobile devices that can assist residents in referring patients to support and advocacy groups (http://www.skinadvocateapp.com).
Grassroots Advocacy
Grassroots advocacy in dermatology means that an individual or group of individuals (in this case, a resident or group of residents) is motivated to take action by contacting legislators and other government officials about gaps in funding and regulation for particular dermatology issues. These efforts often are noticed and taken into consideration by politicians because it is in their best interest to listen to their constituents rather than risk losing support.
The American Academy of Dermatology Association, the advocacy entity of the AAD, hosts the Dermatology Advocacy Network (www.aad-dan.com/default.aspx), which is dedicated to helping dermatologists become advocates. The DAN website helps residents easily identify and contact their local, state, and national legislators to discuss issues or concerns related to the dermatology specialty and medicine as a whole. For example, tanning bed regulation currently is a priority among dermatologists, and the DAN website provides customizable form letters that can be sent electronically to legislators for review.
Furthermore, the AAD offers helpful resources and suggestions for dermatologists and dermatology residents who want to get involved with grassroots advocacy efforts. The website (www.aad.org/advocacy) details current AAD advocacy priorities as well as specific topics such as Medicare physician payment, skin cancer and indoor tanning, drug pricing and availability, state policy, and network adequacy, as these are high-priority issues identified by the AAD that would benefit from action by its members.
Final Thoughts
Many opportunities exist for dermatology residents to get involved in advocacy, from opportunities on the national level with the AMA to patient advocacy and grassroots efforts. It is important for dermatology residents to get involved in advocacy efforts during their training so they may continue to be involved in these efforts as their careers develop. Advocacy helps keep the dermatology specialty relevant and maintain its voice in the national medical arena. It also enhances the dermatology resident’s ability to provide comprehensive quality care for patients by addressing some of their educational and supportive needs that perhaps cannot be addressed in a clinic visit alone. Advocacy also gives residents the opportunity to network and meet colleagues and other individuals with similar goals and interests, which may be beneficial for their future careers. Thus, early involvement in advocacy may be a productive and interesting part of dermatology residency for trainees to be further involved in the specialty.
- AMA mission & guiding principles. American Medical Association Web site. http://www.ama-assn.org/ama/pub/about-ama.page?. Accessed December 22, 2015.
- Specialty Society Representation Ballot. American Medical Association Web site. http://www.ama-assn.org/ama/pub/about-ama/our-people/the-federation-medicine/specialty-society-ballot.page. Accessed December 22, 2015.
- Nijsten T, Bergstresser PR. Patient advocacy groups: let’s stick together. J Invest Dermatol. 2010;130:1757-1759.

Move to Allow Patients to Request 'Refund' Appealing and Risky
We’ve all seen hundreds of commercials from companies advertising products and services with a money-back guarantee. The Men’s Warehouse, for example, has been promising men across the globe for over a decade, “You’re going to like the way you look. I guarantee it!” But to date, no one has made such a “guarantee” in the healthcare industry. Buying a suit is not exactly like getting your gallbladder removed.

We know that medical diagnoses and treatments are filled with uncertainty in expected processes and outcomes, because the factors that are dependent on these processes and outcomes are endless. These include patient factors (overall health, functional status, comorbid conditions), procedural factors (emergency versus elective, time of day or night), and facility factors (having the optimal team with skills that match the patient need, having all the right products and equipment). Although we know that many medical procedures have a relatively predictable risk of complications, unpredictable complications still occur, so how can we ever offer a guarantee for the interventions we perform on patients?
First of Its Kind
David Feinberg, MD, MBA, president and CEO of Geisinger Health System, is doing just that. This healthcare system has developed an application, called the Geisinger ProvenExperience, which can be downloaded onto a smartphone. After a procedure, each patient is given a code for the condition that was treated. With that code, the patient can enter feedback on the services provided and can then request a refund if they are not fully satisfied.
Most remarkably, the request for a refund is based on the judgment of the recipient, not on that of the provider(s). At a recent public meeting, Dr. Feinberg said of the new program: “We’re going to do everything right. That’s our job, that’s our promise to you … and you’re the judge. If you don’t think so, we’re going to apologize, we’re going to try to fix it for the next guy, and, as a small token of appreciation, we’re going to give you some money back.”1
Although many are skeptical about whether or not the program will be successful, much less viable, Dr. Feinberg contends that early feedback on the program has shown that most patients don’t actually want their money back. Instead, if their needs have not been met, most have just wanted a sincere apology and a commitment to make things better for others. Dr. Feinberg also contests that even if this is not the best or only approach to improving healthcare (quickly), we should all feel compelled to do something about our repeated failures in meeting patient expectations in the quality and/or experience of their care; and because no other industry works this way, other than healthcare. Typically, when consumers get fed up with poor service in other industries, disruptive innovations (Uber, for example) are created to satisfy customers’ desires.
A New Paradigm?
In healthcare, patients certainly should be dissatisfied if they experience a preventable harm event. Some types of harm are considered “always preventable,” such as wrong-site surgery. These events are extremely rare and, thus, do not constitute most cases of harm in hospitals these days. Such “never events” are relatively well defined and have been adopted for nonpayment by Medicare and other insurers, which can serve to buffer a patient’s financial liability in the small number of these cases. For other, more common, types of preventable harm, some hospitals have instituted apology and disclosure policies, and some will also relieve the patient of the portion of the bill attributable to the preventable harm. But not all hospitals have adopted such policies, despite the fact that they are widely endorsed by influential agencies, including The Joint Commission, the American Medical Association, Leapfrog Group, the National Quality Forum, and the Agency for Healthcare Research and Quality.
And, even for hospitals that have adopted such “best practice” policies, there is not always clear consensus on what constitutes preventable harm. Generally, the “judgment call” about what constitutes preventable harm is made by healthcare systems and providers—not patients. In addition, many cases of harm that are not necessarily preventable can often result in great dissatisfaction for the patient. There are countless stories of patients who are unfortunately harmed in the course of medical procedures, but who were informed of the possible risks of the procedure and consented to have the procedure performed despite the risks. These situations, which are agonizingly difficult for the system, the providers, and the patients, have no good solutions. Systems cannot “own” all harm, such as those resulting from the disease process itself or from risky and invasive procedures intended to benefit the patient. And there is ongoing inconsistency in healthcare systems when it comes to their willingness and ability to consistently define preventable harm or to disclose, apologize, and forgive payments in such cases.
So, while this move to allow patients to ask for a “refund” seems both extremely appealing and extremely risky, it certainly seems as though it will greatly enhance the trust of patients and their families in the Geisinger Health System.
I, among others, will eagerly follow the results of this program; while getting a cholecystectomy is not the same as buying a men’s suit, I do hope that someday, I will be able to say to every patient entering my healthcare system that before they leave, “You’re going to like the way you feel. I guarantee it!” TH

References
1. Guydish M. Geisinger CEO: money-back guarantee for health care coming. November 6, 2015. Times Leader website. Available at: http://timesleader.com/news/492790/geisinger-ceo-money-back-guarantee-for-health-car-coming. Accessed December 5, 2015.
2. Luthra S. When something goes wrong at the hospital, who pays? November 11, 2015. Kaiser Health News. Available at: http://khn.org/news/when-something-goes-wrong-at-the-hospital-who-pays/?utm_source=Managed&utm_campaign=9e17712a95-Quality+%26+Patient+Safety+Update&utm_medium=email&utm_term=0_ebe1fa6178-9e17712a95-319388717. Accessed December 5, 2015.
We’ve all seen hundreds of commercials from companies advertising products and services with a money-back guarantee. The Men’s Warehouse, for example, has been promising men across the globe for over a decade, “You’re going to like the way you look. I guarantee it!” But to date, no one has made such a “guarantee” in the healthcare industry. Buying a suit is not exactly like getting your gallbladder removed.
We know that medical diagnoses and treatments are filled with uncertainty in expected processes and outcomes, because the factors that are dependent on these processes and outcomes are endless. These include patient factors (overall health, functional status, comorbid conditions), procedural factors (emergency versus elective, time of day or night), and facility factors (having the optimal team with skills that match the patient need, having all the right products and equipment). Although we know that many medical procedures have a relatively predictable risk of complications, unpredictable complications still occur, so how can we ever offer a guarantee for the interventions we perform on patients?
First of Its Kind
David Feinberg, MD, MBA, president and CEO of Geisinger Health System, is doing just that. This healthcare system has developed an application, called the Geisinger ProvenExperience, which can be downloaded onto a smartphone. After a procedure, each patient is given a code for the condition that was treated. With that code, the patient can enter feedback on the services provided and can then request a refund if they are not fully satisfied.
Most remarkably, the request for a refund is based on the judgment of the recipient, not on that of the provider(s). At a recent public meeting, Dr. Feinberg said of the new program: “We’re going to do everything right. That’s our job, that’s our promise to you … and you’re the judge. If you don’t think so, we’re going to apologize, we’re going to try to fix it for the next guy, and, as a small token of appreciation, we’re going to give you some money back.”1
Although many are skeptical about whether or not the program will be successful, much less viable, Dr. Feinberg contends that early feedback on the program has shown that most patients don’t actually want their money back. Instead, if their needs have not been met, most have just wanted a sincere apology and a commitment to make things better for others. Dr. Feinberg also contests that even if this is not the best or only approach to improving healthcare (quickly), we should all feel compelled to do something about our repeated failures in meeting patient expectations in the quality and/or experience of their care; and because no other industry works this way, other than healthcare. Typically, when consumers get fed up with poor service in other industries, disruptive innovations (Uber, for example) are created to satisfy customers’ desires.
A New Paradigm?
In healthcare, patients certainly should be dissatisfied if they experience a preventable harm event. Some types of harm are considered “always preventable,” such as wrong-site surgery. These events are extremely rare and, thus, do not constitute most cases of harm in hospitals these days. Such “never events” are relatively well defined and have been adopted for nonpayment by Medicare and other insurers, which can serve to buffer a patient’s financial liability in the small number of these cases. For other, more common, types of preventable harm, some hospitals have instituted apology and disclosure policies, and some will also relieve the patient of the portion of the bill attributable to the preventable harm. But not all hospitals have adopted such policies, despite the fact that they are widely endorsed by influential agencies, including The Joint Commission, the American Medical Association, Leapfrog Group, the National Quality Forum, and the Agency for Healthcare Research and Quality.
And, even for hospitals that have adopted such “best practice” policies, there is not always clear consensus on what constitutes preventable harm. Generally, the “judgment call” about what constitutes preventable harm is made by healthcare systems and providers—not patients. In addition, many cases of harm that are not necessarily preventable can often result in great dissatisfaction for the patient. There are countless stories of patients who are unfortunately harmed in the course of medical procedures, but who were informed of the possible risks of the procedure and consented to have the procedure performed despite the risks. These situations, which are agonizingly difficult for the system, the providers, and the patients, have no good solutions. Systems cannot “own” all harm, such as those resulting from the disease process itself or from risky and invasive procedures intended to benefit the patient. And there is ongoing inconsistency in healthcare systems when it comes to their willingness and ability to consistently define preventable harm or to disclose, apologize, and forgive payments in such cases.
So, while this move to allow patients to ask for a “refund” seems both extremely appealing and extremely risky, it certainly seems as though it will greatly enhance the trust of patients and their families in the Geisinger Health System.
I, among others, will eagerly follow the results of this program; while getting a cholecystectomy is not the same as buying a men’s suit, I do hope that someday, I will be able to say to every patient entering my healthcare system that before they leave, “You’re going to like the way you feel. I guarantee it!” TH
References
1. Guydish M. Geisinger CEO: money-back guarantee for health care coming. November 6, 2015. Times Leader website. Available at: http://timesleader.com/news/492790/geisinger-ceo-money-back-guarantee-for-health-car-coming. Accessed December 5, 2015.
2. Luthra S. When something goes wrong at the hospital, who pays? November 11, 2015. Kaiser Health News. Available at: http://khn.org/news/when-something-goes-wrong-at-the-hospital-who-pays/?utm_source=Managed&utm_campaign=9e17712a95-Quality+%26+Patient+Safety+Update&utm_medium=email&utm_term=0_ebe1fa6178-9e17712a95-319388717. Accessed December 5, 2015.
Hospitalist Jaime Upegui, MD, Links Passion for Work to Love of Motorcycle Travel, Sports, Dance
Hospitalist Jaime Upegui, MD, division president at Apogee Physicians in Coeur d’Alene, Idaho, knows exactly what he wants to do when he retires years from now: sell everything he owns and ride his motorcycle around the world.

Dr. Upegui is a modern-day explorer who enjoys making the journey as much as getting to the destination. Riding is his personal form of yoga, a meditative experience that demands he stay in the moment and allows him to escape life’s daily frustrations. Ever since he started riding motorcycles at age five, he’s been hooked and has no plans of shifting into neutral.
Driven by Change
Every day at work, Dr. Upegui, an internal medicine specialist, helps hospitalists thrive in a changing medical world where they’re constantly being pushed and pulled in multiple directions. “It’s an exciting career that’s full of unexpected changes,” he says. “I work hard every day on building great teams that produce stellar results.”
He brings that same level of enthusiasm to his after-work activities, which include skydiving, tango dancing, scuba diving, snowboarding, and rock climbing. His passion for change and adventure stems from his childhood.
Listen to more of our interview with Dr. Upegui.
Dr. Upegui was born in Colombia and raised predominantly in the cities of Cali and Medellín. His mother, Rocio, was a painter and ballet dancer; his father, Jaime Sr., was a poet and musician. He spent most of his childhood with his mother, who moved frequently in search of new inspirations. During his childhood, he attended 13 different schools and lived in more than 30 different homes in the U.S., Colombia, and Spain. In 2003, he finished medical school, graduating from Universidad Pontificia Bolivariana in Medellín. He worked as an attending physician in the emergency department there for three years before moving to New York City to complete his residency in internal medicine at St. Luke’s–Roosevelt Hospital Center.
Throughout medical school and his residency, Dr. Upegui’s personal interests extended beyond motorcycling to skydiving and tango dancing, a skill he initially learned to love from his father. Dr. Upegui says he enjoys nothing more than learning, so he’s attracted to activities that require a high degree of training or technical expertise.

“I like to do things that make me feel like I’m proficient at something that’s difficult,” he says.
He vividly remembers the first time he jumped out of a plane, in 2002.
“It was thrilling, it was exciting, it was ego-boosting, it was self-gratifying, it was an adrenaline rush,” Dr. Upegui explains, adding that he taught English to the owner of the skydiving center in Colombia in exchange for free jumps. “The most exciting part is the decision to take the leap. That critical moment still gives me butterflies.”
Over the next six years, he jumped approximately 150 times, then stopped for roughly seven years to handle the demands of school and work, and to avoid the actual cost of skydiving, which is pricey at roughly a few hundred dollars per jump. But, over the years, he missed it, so he resumed skydiving earlier this year.
In between, he learned to tango through private and group lessons. Last year, he traveled to Buenos Aires, Argentina, for an intensive weeklong course and an international tango gathering. He also travels to “milongas,” get-togethers for professional and student tango dancers that are held in various cities worldwide.
“Tango has two core elements: showing your intention to move forward and allowing your partner to accept the invitation to follow your lead,” he says. “It’s a beautiful combination of assertiveness, determination, and then negotiation, followed by permission to proceed, depending upon how the conversation is going during the dance.”
No Regrets
Procrastination is not a familiar word to Dr. Upegui.
“The time frame between something that I want to do and [actually] doing it is very short,” he says. “If I want to do something, I just look at how I can get to it as soon as it’s available.”
Motorcycling ranks as his number one passion. Last year, he completed a 7,000-mile trip without taking any time off from his current job, which requires him to lead, manage, and often meet with hospitalist teams nationwide. He traveled via back roads on weekends to a major city, left his bike at the airport, and then hopped on a plane to wherever he needed to be for work. Instead of flying home for the weekend, he’d return to the airport to pick up his bike and travel to the next city he wanted to visit, which could be 1,000 miles away.
“The cool thing about the road is that random people help you,” he says. “The hotels would keep my clothes and luggage, and airport parking employees would help me park my motorcycle in a safe place and keep my helmet in their office.”
Dr. Upegui says childhood experiences that focused on momentum and movement laid the foundation for his mobile and adventuresome lifestyle. Movement, variability, and change have become the guiding factors in his life. Perhaps that’s why he chose to be a hospitalist. Among the youngest fields in medicine, the specialty is always growing, changing, and evolving.
“If you take any change in life as just a new stage of a new moment and you just perform your best in this current situation, then that will allow you to always be flexible to what’s happening in front of you,” Dr. Upegui says. “I love my work, family, Apogee, and the opportunities I have had. I could die completely satisfied today, knowing that I’ve done the best I could and searched for happiness every day.”
Hospitalist Jaime Upegui, MD, division president at Apogee Physicians in Coeur d’Alene, Idaho, knows exactly what he wants to do when he retires years from now: sell everything he owns and ride his motorcycle around the world.
Dr. Upegui is a modern-day explorer who enjoys making the journey as much as getting to the destination. Riding is his personal form of yoga, a meditative experience that demands he stay in the moment and allows him to escape life’s daily frustrations. Ever since he started riding motorcycles at age five, he’s been hooked and has no plans of shifting into neutral.
Driven by Change
Every day at work, Dr. Upegui, an internal medicine specialist, helps hospitalists thrive in a changing medical world where they’re constantly being pushed and pulled in multiple directions. “It’s an exciting career that’s full of unexpected changes,” he says. “I work hard every day on building great teams that produce stellar results.”
He brings that same level of enthusiasm to his after-work activities, which include skydiving, tango dancing, scuba diving, snowboarding, and rock climbing. His passion for change and adventure stems from his childhood.
Listen to more of our interview with Dr. Upegui.
Dr. Upegui was born in Colombia and raised predominantly in the cities of Cali and Medellín. His mother, Rocio, was a painter and ballet dancer; his father, Jaime Sr., was a poet and musician. He spent most of his childhood with his mother, who moved frequently in search of new inspirations. During his childhood, he attended 13 different schools and lived in more than 30 different homes in the U.S., Colombia, and Spain. In 2003, he finished medical school, graduating from Universidad Pontificia Bolivariana in Medellín. He worked as an attending physician in the emergency department there for three years before moving to New York City to complete his residency in internal medicine at St. Luke’s–Roosevelt Hospital Center.
Throughout medical school and his residency, Dr. Upegui’s personal interests extended beyond motorcycling to skydiving and tango dancing, a skill he initially learned to love from his father. Dr. Upegui says he enjoys nothing more than learning, so he’s attracted to activities that require a high degree of training or technical expertise.
“I like to do things that make me feel like I’m proficient at something that’s difficult,” he says.
He vividly remembers the first time he jumped out of a plane, in 2002.
“It was thrilling, it was exciting, it was ego-boosting, it was self-gratifying, it was an adrenaline rush,” Dr. Upegui explains, adding that he taught English to the owner of the skydiving center in Colombia in exchange for free jumps. “The most exciting part is the decision to take the leap. That critical moment still gives me butterflies.”
Over the next six years, he jumped approximately 150 times, then stopped for roughly seven years to handle the demands of school and work, and to avoid the actual cost of skydiving, which is pricey at roughly a few hundred dollars per jump. But, over the years, he missed it, so he resumed skydiving earlier this year.
In between, he learned to tango through private and group lessons. Last year, he traveled to Buenos Aires, Argentina, for an intensive weeklong course and an international tango gathering. He also travels to “milongas,” get-togethers for professional and student tango dancers that are held in various cities worldwide.
“Tango has two core elements: showing your intention to move forward and allowing your partner to accept the invitation to follow your lead,” he says. “It’s a beautiful combination of assertiveness, determination, and then negotiation, followed by permission to proceed, depending upon how the conversation is going during the dance.”
No Regrets
Procrastination is not a familiar word to Dr. Upegui.
“The time frame between something that I want to do and [actually] doing it is very short,” he says. “If I want to do something, I just look at how I can get to it as soon as it’s available.”
Motorcycling ranks as his number one passion. Last year, he completed a 7,000-mile trip without taking any time off from his current job, which requires him to lead, manage, and often meet with hospitalist teams nationwide. He traveled via back roads on weekends to a major city, left his bike at the airport, and then hopped on a plane to wherever he needed to be for work. Instead of flying home for the weekend, he’d return to the airport to pick up his bike and travel to the next city he wanted to visit, which could be 1,000 miles away.
“The cool thing about the road is that random people help you,” he says. “The hotels would keep my clothes and luggage, and airport parking employees would help me park my motorcycle in a safe place and keep my helmet in their office.”
Dr. Upegui says childhood experiences that focused on momentum and movement laid the foundation for his mobile and adventuresome lifestyle. Movement, variability, and change have become the guiding factors in his life. Perhaps that’s why he chose to be a hospitalist. Among the youngest fields in medicine, the specialty is always growing, changing, and evolving.
“If you take any change in life as just a new stage of a new moment and you just perform your best in this current situation, then that will allow you to always be flexible to what’s happening in front of you,” Dr. Upegui says. “I love my work, family, Apogee, and the opportunities I have had. I could die completely satisfied today, knowing that I’ve done the best I could and searched for happiness every day.”

Frailty in HSCT population not dependent on age

Photo by Peter Griffin
ORLANDO, FL—Frailty after hematopoietic stem cell transplant (HSCT), while associated with higher mortality, is not necessarily a function of age, according to investigators studying the impact of frailty on transplant outcomes.
Instead, other factors, such as increasing time from transplant, employment status, medical leave or disability, and limitations of social activities, were significantly associated with higher odds of frailty.
The investigators prospectively studied 96 HSCT recipients, age 40 and older, to determine the prevalence of frailty in HSCT populations and its impact on outcomes, including early post-transplant non-relapse mortality (NRM).
Mukta Arora, MD, of the University of Minnesota in Minneapolis, reported the findings at the 2015 ASH Annual Meeting (abstract 388*).
The investigators defined frailty as the presence of 3 or more of the following criteria: low grip strength, exhaustion, slowed walking speed, low physical activity, and unintentional weight loss. They defined pre-frailty as having 1 or 2 of these characteristics.
The investigators conducted multi-domain geriatric assessments of patients prior to HSCT and after transplant at 100 days, 6 months, and 1 year. The assessment included function, comorbidity, cognition, psychological state, social activity/support, nutritional status, and demographic, transplant, and disease-related information.
Forty-eight patients were in the younger age group (40–59), and 48 were in the older age group (60–74). All had undergone HSCT between February 2014 and April 2015.
Patient demographics
Patients in the younger group were a median age of 54 (range, 40–59) at transplant. Sixty-five percent were male, 58% had an autologous transplant, and 79% received myeloablative conditioning.
Patients in the older group were a median age of 65 (range, 60–73) at transplant. Fifty-four percent were male, 46% had an autologous transplant, and 46% had myeloablative conditioning.
The difference between the older and younger groups in their conditioning regimen was significant (P<0.01).
The groups were comparable in terms of the HSCT comorbidity index but were significantly different in employment status (P<0.01).
“As expected,” Dr Arora said, “there were more patients who were retired in the older group.”
In the younger group, 31% were employed, 3% retired, 56% on medical leave or disabled, and 10% unemployed.
In the older group, 6% were employed, 62% retired, 28% on medical leave or disabled, and 4% unemployed.
“There was no difference in the social activity and social support scores between the 2 groups,” Dr Arora observed.
Frailty assessments
In the younger group, at baseline, the prevalence of pre-frailty was 47%, and the prevalence of frailty was 11%. At 6 months after HSCT, the prevalence of pre-frailty was 45%, and the prevalence of frailty was 41% (P<0.01).
In the older group, at baseline, the prevalence of pre-frailty was 42%, and the prevalence of frailty was 6%. At 6 months, the prevalence of pre-frailty was 44%, and the prevalence of frailty was 38% (P<0.01).
The investigators then estimated the predictors of frailty.
Significant predictors of frailty included time since HSCT (odds ratio [OR]=3.7, 95% CI: 1.9-7.2, P<0.01), employment status (retired: OR=7.3, 95% CI 1.2 – 46.2, P=0.03), on medical leave or disabled (OR=11.2, 95% CI: 1.8 – 67.7, P=0.01), limitations in social activities (OR=1.04, 95% CI: 1.01 – 1.08, P=0.01), and baseline pre-frailty (OR=3.1, 95% CI: 2.3 – 45.5, P<0.01).
Allogeneic transplant was associated with higher odds of frailty than autologous (OR=3.1, 95% CI: 0.9 – 10.2), although it did not reach significance (P=0.06).
Investigators next estimated the impact of frailty or pre-frailty on NRM and identified a trend toward increased NRM in frail patients.
The 46 patients classified as not frail at baseline had a 7% cumulative incidence of NRM (P=0.07). The 42 patients classified as pre-frail had a 23% cumulative incidence of NRM, while the 8 patients classified as frail at baseline had a 28% cumulative incidence of NRM.
“So, to conclude, in this early study, frailty was noted in 8% and pre-frailty in 44% of the transplant population prior to transplant, and was not dependent on age,” Dr Arora said. “Frailty is a transitional state and appears to reflect a dynamic progression from robustness to functional decline with time since [HSCT].”
Because frailty is associated with higher mortality, the investigators believe vulnerable populations should be identified and their need for specific interventions defined.
This research was funded by the Leukemia & Lymphoma Society. ![]()
*Data in the abstract differ from the presentation.
Combo deepens responses and improves PFS in MM

Photo courtesy of the
University of Navarra
ORLANDO, FL—The addition of panobinostat to bortezomib-dexamethasone therapy in relapsed or refractory multiple myeloma (MM) patients can double the rate of deep responses and prolong progression-free survival (PFS), according to an updated analysis of data from the PANORMA 1 trial.
Panobinostat, a pan-deacetylase inhibitor, was the first agent of its class to produce a statistically significant and clinically meaningful increase in the median PFS of patients with relapsed/refractory MM in a phase 3 trial, noted Jesús F. San-Miguel, MD, PhD, of the University of Navarra in Pamplona, Spain.
Dr San-Miguel presented results of the updated analysis at the 2015 ASH Annual Meeting (abstract 4230).
In the PANORAMA 1 trial, patients receiving panobinostat plus bortezomib and dexamethasone had a significantly prolonged median PFS of 12 months versus 8.1 months in patients treated with placebo-bortezomib-dexamethasone.
A subgroup analysis showed that the PFS benefit was improved in patients with previous exposure to bortezomib and immunomodulatory drugs (IMiDs). The addition of panobinostat to bortezomib-dexamethasone also led to a significant increase in high-quality responses.
With their analysis, Dr San-Miguel and his colleagues set out to determine the effect of responses on clinical outcomes of patients treated in PANORAMA 1, including those with prior exposure to bortezomib and IMiDs.
The researchers conducted a landmark analysis at 12, 18, and 24 weeks to assess the median PFS in patients who achieved a complete response (CR)/near complete response (nCR) or partial response (PR).
“For the total study population, the rates of high-quality responses [CR/nCR rate] were significantly higher in the panobinostat-bortezomib-dexamethasone arm [28%] than in the control arm [16%],” Dr San-Miguel said.
Among the subgroup with prior exposure to bortezomib and IMiDs, the CR/nCR rate was also higher in the triple-drug arm (22.3%) than in the 2-drug arm (9.9%).
Among patients who took panobinostat-bortezomib-dexamethasone, the duration of response was twice as long in those who achieved CR/nCR (18.4 months) as in those who achieved a PR (9 months).
The median PFS at 12 weeks for patients who received panobinostat-bortezomib-dexamethasone was increased in patients achieving high-quality responses: 16.5 months for nCR as compared to 10.3 months for PR.
The subgroup of patients with prior exposure to bortezomib and IMiDs who achieved deeper responses also demonstrated longer PFS at 12 weeks: a median of 13.7 months for nCR and 8.1 months for PR.
“In both the overall study population and the subgroup of patients with prior exposure to bortezomib and IMiDs, a 2-fold increase in deep responses was achieved with panobinostat-bortezomib-dexamethasone compared with placebo-bortezomib-dexamethasone,” Dr San-Miguel said. “In both groups, deep responses were associated with a prolonged PFS and a longer duration of response.”
He noted that the magnitude of benefit at each time point appeared greater among patients who received the triple-drug combination.
“These data further support achievement of deeper responses as a treatment goal and a robust and consistent benefit of panobinostat in the phase 3 study in patients with relapsed/refractory multiple myeloma, including those with prior exposure to bortezomib and IMiDs,” Dr San-Miguel said.
The PANORAMA 1 trial was sponsored by Novartis, the company developing panobinostat. Three researchers involved in the current analysis are employees of Novartis, and other researchers reported having relationships (receiving research funding, consulting, etc.) with a range of other pharmaceutical companies. ![]()