User login
Amount of blood transfused doesn’t affect long-term mortality
![]()
Credit: UAB Hospital
Long-term mortality is not affected by the amount of blood a patient receives following surgery, according to research published in The Lancet.
Investigators compared a liberal transfusion strategy, in which patients received blood to maintain a hemoglobin level at 100 g/L or higher, and a restrictive strategy, in which patients received blood when hemoglobin levels were lower than 80 g/L or if they had symptoms of anemia.
And, at about 3 years of follow-up, there was no difference in mortality between the two groups.
Jeffrey L. Carson, MD, of Robert Wood Johnson Medical School in New Jersey, and his colleagues conducted this research, analyzing data from the FOCUS trial, which included patients from 47 hospitals in the US and Canada.
The trial enrolled 2016 adults age 50 and older, with a history of or risk factors for cardiovascular disease, who had postoperative hemoglobin concentrations lower than 100 g/L within 3 days of surgery to repair a hip fracture.
Patients were randomized by a central telephone system to the liberal (n=1007) or restrictive (n=1009) transfusion groups. The investigators analyzed the long-term mortality of these patients, which was established by linking participants to national death registries in the US and Canada.
The results revealed no difference in mortality from cardiovascular disease, cancer, or severe infection due to the amount of the blood given after surgery.
This supports the initial results of the FOCUS trial, which Dr Carson and his colleagues published in NEJM in 2011 and which demonstrated the safety of fewer transfusions in the short-term.
For the current analysis, the median duration of follow-up was 3.1 years. Eight hundred and forty-one patients (42%) died during that time—432 in the liberal transfusion group and 409 in the restrictive transfusion group. This difference was not statistically significant, with a hazard ratio of 1.09 and a P value of 0.21.
“There has been a steady decline in the amount of blood in transfusions given to patients in the past 3 to 5 years,” Dr Carson noted. “I think it is very reassuring that we have found that using less blood is okay, not just from a short-term perspective, but also a long-term perspective.”
Medical experts had worried that larger amounts of transfused blood might suppress immune function—which could lead to death from infection or cancer—or that smaller transfusions might worsen a patient’s chronic heart disease by depriving the heart of oxygen and other nutrients that it might have absorbed by pumping more blood.
But in both instances, Dr Carson and his colleagues found no difference in long-term death rates, regardless of the number of transfusions.
Dr Carson noted that there are health conditions, such as heart attacks, where the effects of the two transfusion strategies are less certain. Preliminary evidence suggests heart attack patients need more blood, not less. But additional studies are needed to confirm that. ![]()
Team identifies prognostic markers for CN-AML

Researchers say they’ve identified novel prognostic markers for older patients with cytogenetically normal acute myeloid leukemia (CN-AML).
The team examined the expression of long noncoding RNAs (lncRNAs) in patients with CN-AML who were at least 60 years of age.
This revealed a pattern of 48 lncRNAs that predicted both response to standard chemotherapy and overall survival.
The researchers described this discovery in PNAS.
“[Our findings] strongly suggest that lncRNA expression profiles can predict which patients will respond to standard therapy,” said principal investigator Clara D. Bloomfield, MD, of The Ohio State University Comprehensive Cancer Center in Columbus.
“That’s important because it would spare these patients from the toxic side effects of experimental therapies. Patients who are classified in the unfavorable group would receive different therapy: stem cell transplant or a clinical trial using new therapeutic approaches. Thus, this research will help to tailor leukemia therapy to each individual.”
In addition, she said, the study revealed novel targets for the development of new therapies.
Dr Bloomfield and her colleagues began this research by analyzing bone marrow samples from 148 older patients with CN-AML who were treated on Cancer and Leukemia Group B clinical trials. All had received similar chemotherapy regimens.
The researchers first identified the 48 lncRNAs that were most associated with survival. Using these 48 lncRNAs, the team divided patients into two groups: those with a favorable prognostic score and those with an unfavorable score.
The researchers then validated the scores in an independent matched set of 71 similarly treated CN-AML patients and compared patients with an unfavorable score to those with a favorable score.
Results showed that patients with an unfavorable score had a lower complete response (CR) rate—54%, compared to 89% for patients with a favorable score.
Three years after CR, only 7% of patients with an unfavorable score were disease-free, compared with 39% of patients with a favorable score.
Overall survival at 3 years for those with an unfavorable score was 10%, compared to 43% for patients with a favorable score.
Distinct lncRNA profiles were associated with mutations in 6 genes—FLT3, NPM1, CEBPA, IDH2, ASXL1, and RUNX1.
The researchers concluded that lncRNA expression profiles are associated with recurrent mutations, clinical features, and outcome in AML. A fraction of these lncRNAs may have a functional role in leukemogenesis. Furthermore, lncRNAs could be used as biomarkers for outcome in AML. ![]()
Barriers to Establishing a PCS
Palliative care (PC) focuses on relieving distressing symptoms such as pain, dyspnea, fatigue, and depression; providing psychological, social, emotional, and spiritual support; and helping patients choose treatments consistent with their values.[1] Palliative care consultation services (PCSs) increase patient and family satisfaction,[2, 3] improve quality of life,[4] reduce resource utilization,[5] and decrease hospital expenditure.[2, 6] Hospitals that fund a PCS typically realize a sizable return on investment and good value, as these services provide better care at lower cost.[7] These benefits provide a strong rationale for all hospitals to establish a PCS. However, only 53% of acute care hospitals in California offer PC services, and only 37% have a hospital‐based PCS.[7] To increase access for patients with serious illness, it is necessary to understand the barriers that hinder the development of PCS. In this study, we asked leaders from hospitals without a PCS to describe these barriers and identify strategies that could overcome them and promote PCSs.
METHODS
In 2011, we surveyed all acute care hospitals in California to assess the prevalence of PCSs in the state. We defined a PCS as an interdisciplinary team that sees patients, identifies needs, makes treatment recommendations, facilitates patient and/or family decision making, and/or directly provides palliative care for patients with life‐threatening illness and their families. Hospitals that did not have a PCS were asked questions regarding plans to establish one (Is there an effort underway to establish a palliative care program in your hospital?), perceived barriers to starting one (What are 3 significant barriers or circumstances that have prevented your hospital from creating a palliative care program?), and ideas for overcoming barriers (What resources, training, policy changes would be most helpful in overcoming those barriers?). Questions that allowed for open‐ended responses were analyzed using a thematic approach.[8] Themes were initially reviewed by 1 researcher (C.J.B.), then refined and confirmed at each stage using an iterative process with other research team members (D.L.O., S.Z.P.) to reduce potential biases. Questions assessing hospital characteristics and status toward establishing a PCS provided a list of possible answers. Frequencies to these responses are reported accordingly.
RESULTS
Surveys were distributed to 376 acute care hospitals in California, of which 360 responded to the survey, resulting in a 96% response rate. Of the 360 hospitals surveyed, 46% (n=166) reported not offering any PCS. Out of the 166 that did not have PCS, 7 stated they had a PCS at some point in the last 5 years, but the program was discontinued. Hospitals without a PCS were largely for profit (75%, n=125), small with 150 beds (72%, n=120), and not affiliated with a system (63%, n=105). Overall, 34% (43/128) of hospitals reported that they had efforts underway to establish one, with 21% (9/43) expecting to start seeing patients within a year. Seventy‐two hospitals (56%, 72/128) reported that providers from local hospices aided them in providing their patients with PC, and that this approach met the needs of their patients. A total of 93 hospitals identified multiple barriers (n=186) to establishing a PCS, of which 162 responses could be categorized into 5 meaningful themes. Regarding strategies to overcome these barriers, 65 hospitals provided 72 responses that could be categorized into 5 meaningful themes (Table 1).
| Barriers and Strategies | Responses, % (n) |
|---|---|
| |
| Main barriers to establishing a PCS | 93 hospitals provided 186 barriers |
| Insufficient funding and/or resources | 31 (58) |
| Insufficient staff to support a PCS | 20 (37) |
| Perceived lack of need for a PCS | 14 (27) |
| Lack of support among nonpalliative care physicians | 13 (25) |
| Competing priorities | 8 (15) |
| Don't know/unsure | 14 (24) |
| Main strategies to overcome barriers to establishing a PCS | 65 hospitals provided 72 strategies |
| Reroute funding to establish a PCS | 28 (20) |
| Explain benefits of PCS to staff and community | 24 (17) |
| Provide a framework for how to establish a PCS | 21 (15) |
| Staff for a PCS | 18 (13) |
| Physician support | 10 (7) |
DISCUSSION
Despite citing obstacles to providing PCSs, one‐third of hospitals surveyed report that they are planning to establish a program. As an alternative, many hospitals without a PCS reported that they provide their patients with PC through partnerships with local hospice services. This approach may provide some hospitals with a practical alternative to having a PCS, especially in smaller institutions where budgets and the need for PC are proportionally small. Future surveys should account for this approach to providing PCS to patients. Sharing the strong evidence of return on investment from PCS[6, 7] with hospital leaders could help overcome the perceived barrier of cost and garner financial support. Training programs and technical assistance provided by the Palliative Care Leadership Center initiative and the Center to Advance Palliative Care have a proven track record in helping hospitals establish a PCS through mentored training,[9] and the End‐of‐Life Nursing Education Consortium has demonstrated effectiveness with nursing education.[10] These programs could provide the resources that many hospitals seek. Educating hospital leaders and clinicians about the evidence for PCSs improving care for patients with serious illness may further help to engender support for PCSs. One barrier that may be more difficult to overcome is the lack of trained PC clinicians. Efforts to educate and train generalist clinicians in primary PC may mitigate this shortfall.[1] Increasing the number of trained primary PC clinicians may also reduce fragmentation in patient care and reduce burden on specialist PC clinicians.[11] Specialty PC clinicians can also lend their expertise to hospitals seeking to start a PCS to achieve the goal of universal access to PCS.
Acknowledgements
The authors thank the Hospital Council of Northern and Central California, the Hospital Council of Southern California, and the Hospital Council of San Diego and Imperial Counties for their support in encouraging their members to participate. The authors also thank all of the respondents for their diligence and care in responding to the survey.
Disclosures
The California HealthCare Foundation provided funding to support the administration of the survey and analysis of findings, as well as limited dissemination of results though the foundation's communication venues. The authors report no conflicts of interest.
- Institute of Medicine. Dying in America: Improving Quality and Honoring Individual Preferences Near the End of Life. Washington, DC: The National Academies Press; 2014.
- , , , et al. Impact of an inpatient palliative care team: a randomized control trial. J Palliat Med. 2008;11(2):180–190.
- , , , , . A systematic review of satisfaction with care at the end of life. J Am Geriatr Soc. 2008;56(1):124–129.
- . Health care system factors affecting end‐of‐life care. J Palliat Med. 2005;8(suppl 1):S79–S87.
- , , . Impact of palliative care case management on resource use by patients dying of cancer at a Veterans Affairs medical center. J Palliat Med. 2005;8(1):26–35.
- , , , et al. Cost savings associated with US hospital palliative care consultation programs. Arch Intern Med. 2008;168(16):1783–1790.
- , , . Two steps forward, one step back: changes in palliative care consultation services in California hospitals from 2007 to 2011. J Palliat Med. 2014;17(11):1214–1220.
- , . Using qualitative methods to explore key questions in palliative care. J Palliat Med. 2009;12(8):725–730.
- , , . Center to Advance Palliative Care palliative care consultation service metrics: consensus recommendations. J Palliat Med. 2008;11(10):1294–1298.
- , , , et al. Evaluation of the End‐of‐Life Nursing Education Consortium undergraduate faculty training program. J Palliat Med. 2005;8(1):107–114.
- , . Generalist plus specialist palliative care–creating a more sustainable model. N Engl J Med. 2013;368(13):1173–1175.
Palliative care (PC) focuses on relieving distressing symptoms such as pain, dyspnea, fatigue, and depression; providing psychological, social, emotional, and spiritual support; and helping patients choose treatments consistent with their values.[1] Palliative care consultation services (PCSs) increase patient and family satisfaction,[2, 3] improve quality of life,[4] reduce resource utilization,[5] and decrease hospital expenditure.[2, 6] Hospitals that fund a PCS typically realize a sizable return on investment and good value, as these services provide better care at lower cost.[7] These benefits provide a strong rationale for all hospitals to establish a PCS. However, only 53% of acute care hospitals in California offer PC services, and only 37% have a hospital‐based PCS.[7] To increase access for patients with serious illness, it is necessary to understand the barriers that hinder the development of PCS. In this study, we asked leaders from hospitals without a PCS to describe these barriers and identify strategies that could overcome them and promote PCSs.
METHODS
In 2011, we surveyed all acute care hospitals in California to assess the prevalence of PCSs in the state. We defined a PCS as an interdisciplinary team that sees patients, identifies needs, makes treatment recommendations, facilitates patient and/or family decision making, and/or directly provides palliative care for patients with life‐threatening illness and their families. Hospitals that did not have a PCS were asked questions regarding plans to establish one (Is there an effort underway to establish a palliative care program in your hospital?), perceived barriers to starting one (What are 3 significant barriers or circumstances that have prevented your hospital from creating a palliative care program?), and ideas for overcoming barriers (What resources, training, policy changes would be most helpful in overcoming those barriers?). Questions that allowed for open‐ended responses were analyzed using a thematic approach.[8] Themes were initially reviewed by 1 researcher (C.J.B.), then refined and confirmed at each stage using an iterative process with other research team members (D.L.O., S.Z.P.) to reduce potential biases. Questions assessing hospital characteristics and status toward establishing a PCS provided a list of possible answers. Frequencies to these responses are reported accordingly.
RESULTS
Surveys were distributed to 376 acute care hospitals in California, of which 360 responded to the survey, resulting in a 96% response rate. Of the 360 hospitals surveyed, 46% (n=166) reported not offering any PCS. Out of the 166 that did not have PCS, 7 stated they had a PCS at some point in the last 5 years, but the program was discontinued. Hospitals without a PCS were largely for profit (75%, n=125), small with 150 beds (72%, n=120), and not affiliated with a system (63%, n=105). Overall, 34% (43/128) of hospitals reported that they had efforts underway to establish one, with 21% (9/43) expecting to start seeing patients within a year. Seventy‐two hospitals (56%, 72/128) reported that providers from local hospices aided them in providing their patients with PC, and that this approach met the needs of their patients. A total of 93 hospitals identified multiple barriers (n=186) to establishing a PCS, of which 162 responses could be categorized into 5 meaningful themes. Regarding strategies to overcome these barriers, 65 hospitals provided 72 responses that could be categorized into 5 meaningful themes (Table 1).
| Barriers and Strategies | Responses, % (n) |
|---|---|
| |
| Main barriers to establishing a PCS | 93 hospitals provided 186 barriers |
| Insufficient funding and/or resources | 31 (58) |
| Insufficient staff to support a PCS | 20 (37) |
| Perceived lack of need for a PCS | 14 (27) |
| Lack of support among nonpalliative care physicians | 13 (25) |
| Competing priorities | 8 (15) |
| Don't know/unsure | 14 (24) |
| Main strategies to overcome barriers to establishing a PCS | 65 hospitals provided 72 strategies |
| Reroute funding to establish a PCS | 28 (20) |
| Explain benefits of PCS to staff and community | 24 (17) |
| Provide a framework for how to establish a PCS | 21 (15) |
| Staff for a PCS | 18 (13) |
| Physician support | 10 (7) |
DISCUSSION
Despite citing obstacles to providing PCSs, one‐third of hospitals surveyed report that they are planning to establish a program. As an alternative, many hospitals without a PCS reported that they provide their patients with PC through partnerships with local hospice services. This approach may provide some hospitals with a practical alternative to having a PCS, especially in smaller institutions where budgets and the need for PC are proportionally small. Future surveys should account for this approach to providing PCS to patients. Sharing the strong evidence of return on investment from PCS[6, 7] with hospital leaders could help overcome the perceived barrier of cost and garner financial support. Training programs and technical assistance provided by the Palliative Care Leadership Center initiative and the Center to Advance Palliative Care have a proven track record in helping hospitals establish a PCS through mentored training,[9] and the End‐of‐Life Nursing Education Consortium has demonstrated effectiveness with nursing education.[10] These programs could provide the resources that many hospitals seek. Educating hospital leaders and clinicians about the evidence for PCSs improving care for patients with serious illness may further help to engender support for PCSs. One barrier that may be more difficult to overcome is the lack of trained PC clinicians. Efforts to educate and train generalist clinicians in primary PC may mitigate this shortfall.[1] Increasing the number of trained primary PC clinicians may also reduce fragmentation in patient care and reduce burden on specialist PC clinicians.[11] Specialty PC clinicians can also lend their expertise to hospitals seeking to start a PCS to achieve the goal of universal access to PCS.
Acknowledgements
The authors thank the Hospital Council of Northern and Central California, the Hospital Council of Southern California, and the Hospital Council of San Diego and Imperial Counties for their support in encouraging their members to participate. The authors also thank all of the respondents for their diligence and care in responding to the survey.
Disclosures
The California HealthCare Foundation provided funding to support the administration of the survey and analysis of findings, as well as limited dissemination of results though the foundation's communication venues. The authors report no conflicts of interest.
- Institute of Medicine. Dying in America: Improving Quality and Honoring Individual Preferences Near the End of Life. Washington, DC: The National Academies Press; 2014.
- , , , et al. Impact of an inpatient palliative care team: a randomized control trial. J Palliat Med. 2008;11(2):180–190.
- , , , , . A systematic review of satisfaction with care at the end of life. J Am Geriatr Soc. 2008;56(1):124–129.
- . Health care system factors affecting end‐of‐life care. J Palliat Med. 2005;8(suppl 1):S79–S87.
- , , . Impact of palliative care case management on resource use by patients dying of cancer at a Veterans Affairs medical center. J Palliat Med. 2005;8(1):26–35.
- , , , et al. Cost savings associated with US hospital palliative care consultation programs. Arch Intern Med. 2008;168(16):1783–1790.
- , , . Two steps forward, one step back: changes in palliative care consultation services in California hospitals from 2007 to 2011. J Palliat Med. 2014;17(11):1214–1220.
- , . Using qualitative methods to explore key questions in palliative care. J Palliat Med. 2009;12(8):725–730.
- , , . Center to Advance Palliative Care palliative care consultation service metrics: consensus recommendations. J Palliat Med. 2008;11(10):1294–1298.
- , , , et al. Evaluation of the End‐of‐Life Nursing Education Consortium undergraduate faculty training program. J Palliat Med. 2005;8(1):107–114.
- , . Generalist plus specialist palliative care–creating a more sustainable model. N Engl J Med. 2013;368(13):1173–1175.
Congenital uterine anomalies: A resource of diagnostic images, Part 2
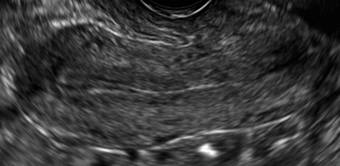
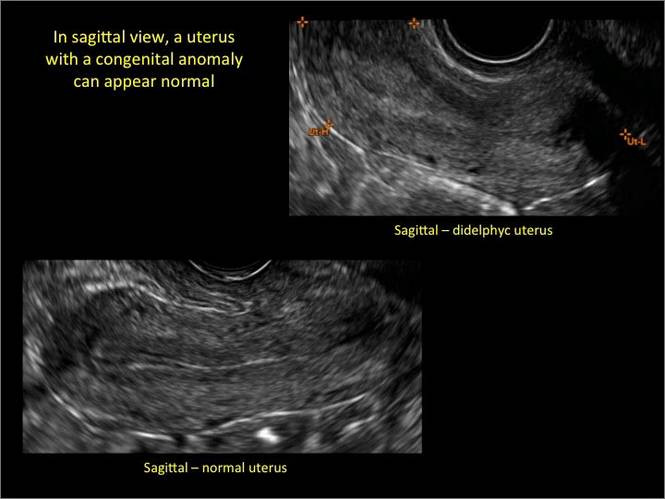
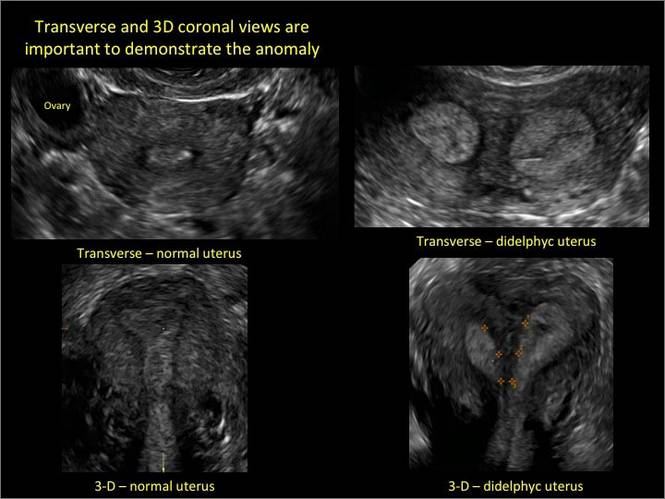
As detailed in Part 1 of this installment on uterine anomalies, a uterus that has developed abnormally can appear to be normal on 2D sonography and on unenhanced sonohysterography (Figure). Without the application of 3D coronal ultrasonography, accurate identification of the fundal contour, and ultimately the type and classification of the uterine anomaly, is not possible.1-3 Fortunately, the lowered cost (compared with magnetic resonance imaging) and the noninvasive nature of this more detailed imaging modality makes its use convenient to both the physician and the patient.
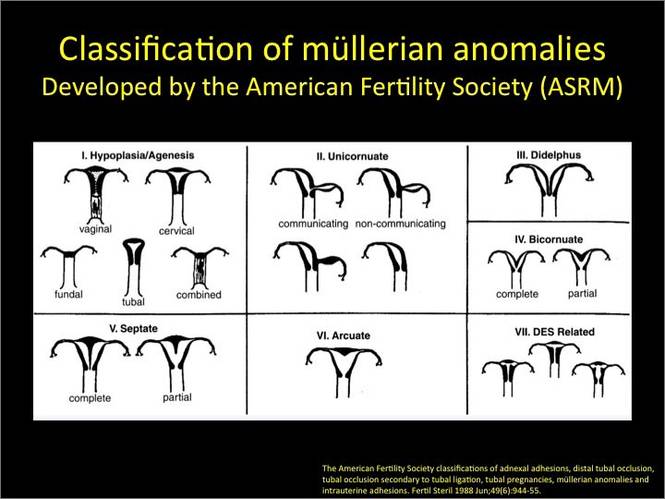
In part 1 of this 2-part installment of our imaging series, we discussed the frequency with which uterine anomalies occur and their types and classifications, as well as offered an imaging library showing the normal endometrial cavity, arcuate uterus, incomplete (partial) uterine septum, and complete uterine septum. Here, we provide two cases demonstrating 3D sonography of the unicornuate, bicornuate, didelphic, and DES-exposed uterus.
A. | B. 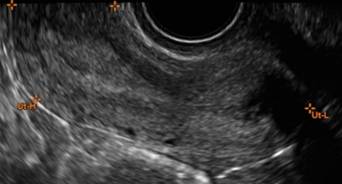
|
C. 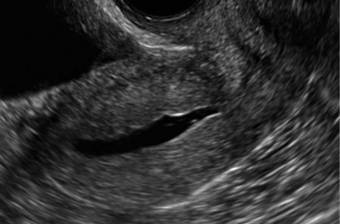
| D. 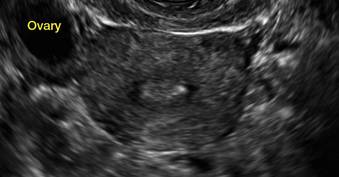
|
| E.
| F. 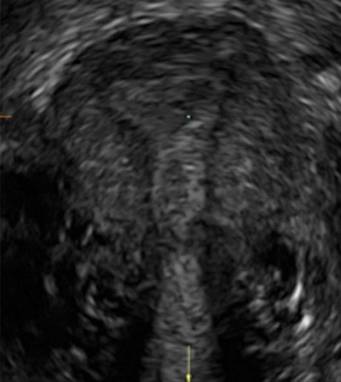
|
G. 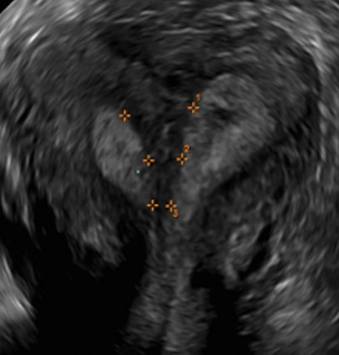
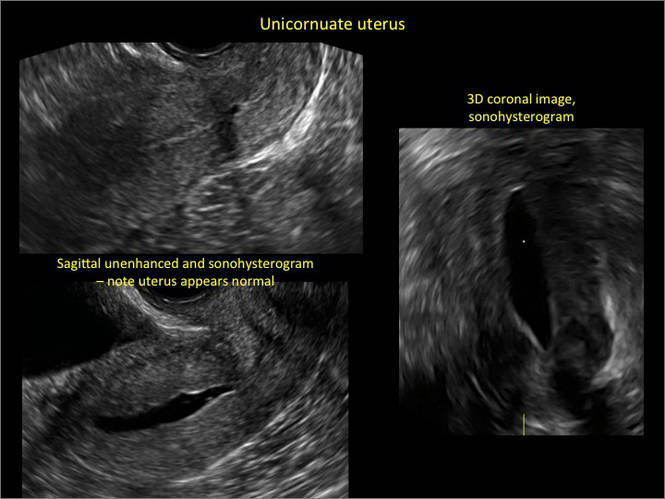
In sagittal view, a uterus with a congenital anomaly can appear normal. Sagittal views of a normal uterus (A) and didelphic uterus (B) and sonohysterogram of a unicornuate uterus (C). Transverse views of a normal (D) and didelphic uterus (E). 3D coronal views of a normal (F) and didelphic uterus (G).
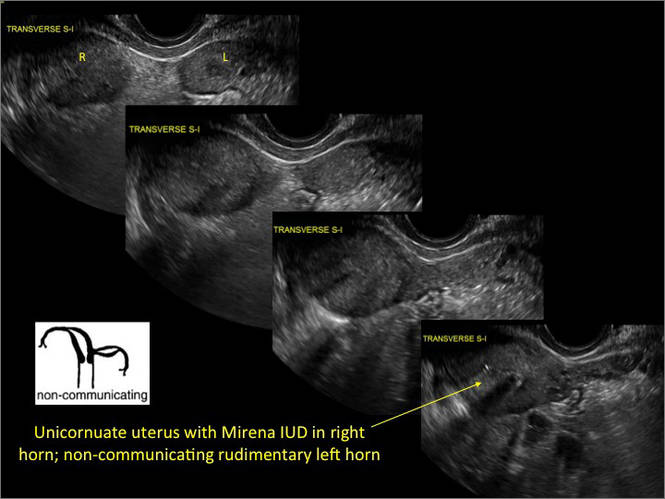
Case 1: Unicornuate uterus
Transverse view of Mirena IUD in right horn and noncommunicating rudimentary left horn.
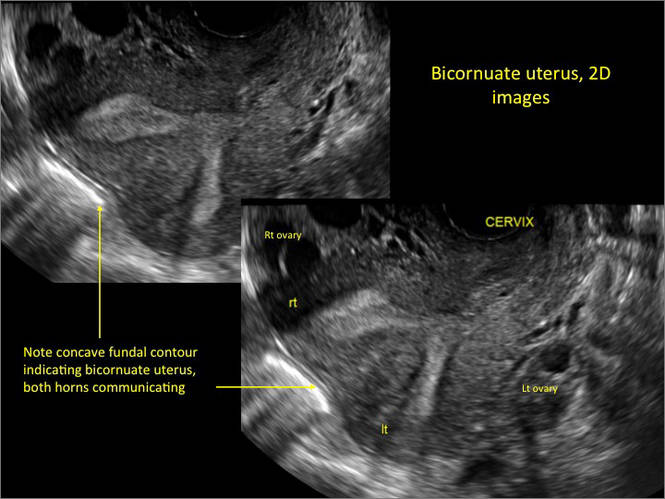
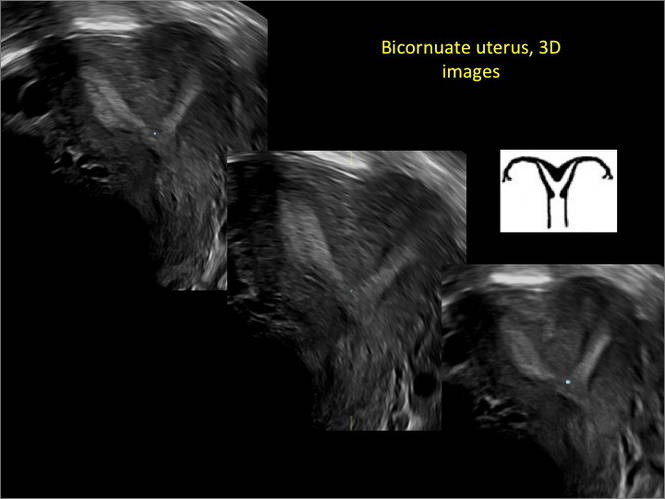
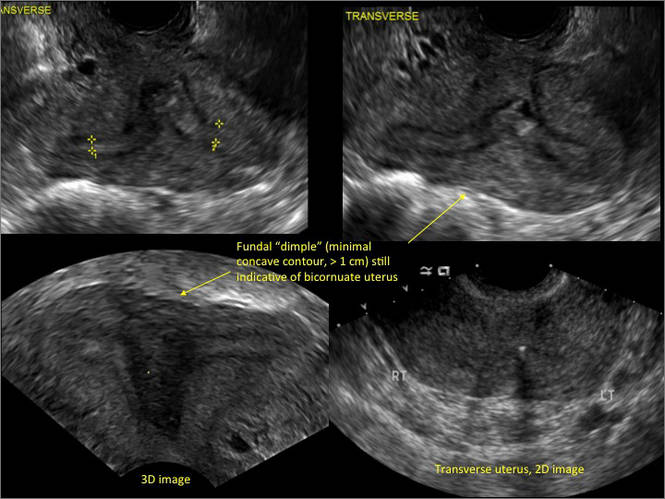
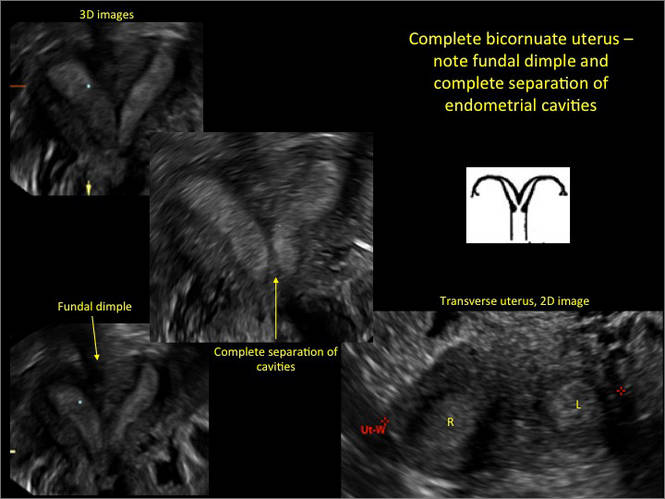
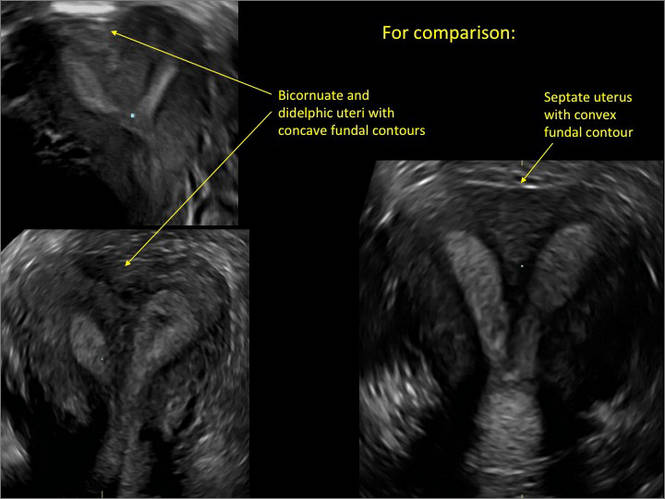
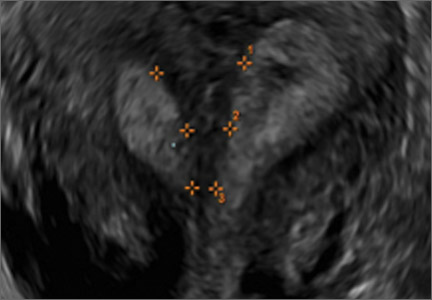
Case 2: Bicornuate uterus, with concave contour
A patient reporting pelvic pain is examined by 2D sonography, which reveals a bicornuate uterus (A). Note the concave fundal contour (arrow), indicating bicornuate uterus, both horns communicating. 3D imaging (B) revealing fundal “dimple” (concave contour, >1 cm), which is indicative of bicornuate uterus. Complete separation of cavities (C).
A. 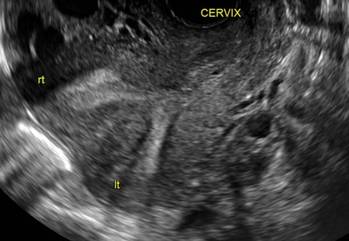
B. 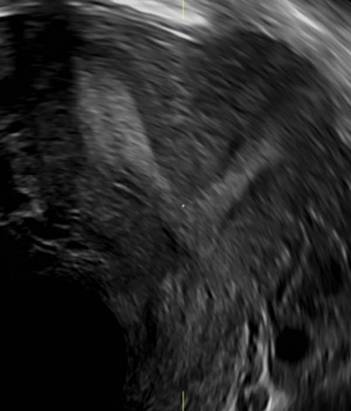
C. 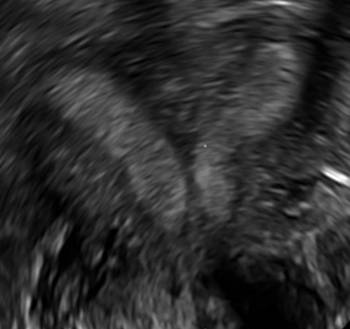
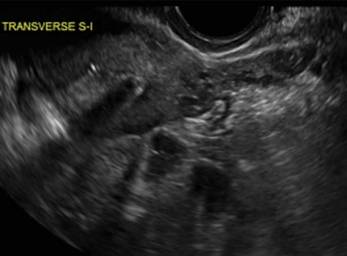
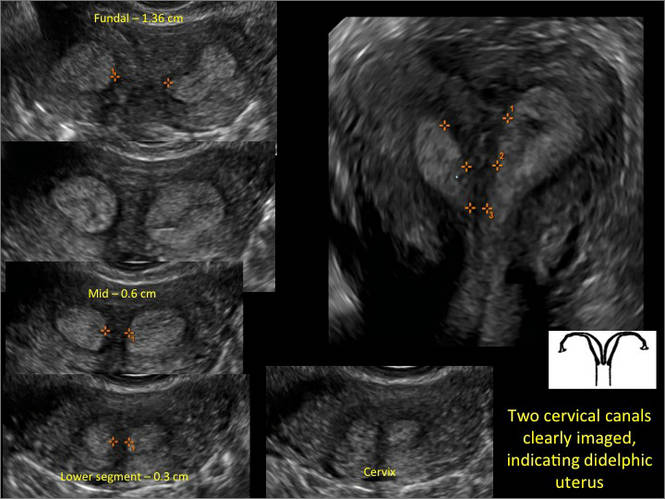
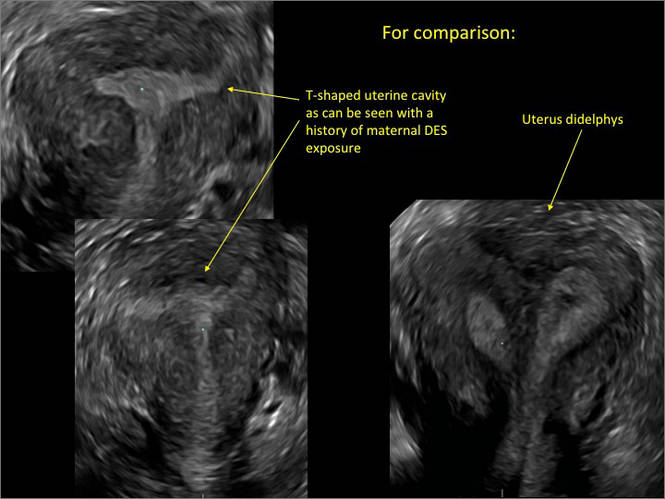
Case 3: Didelphic uterus
A patient presenting with primary infertility is found to have a didelphic uterus on 2D and 3D imaging. Note complete separation of uterine cavities on transverse, 2D views (A and B). The left horn sagittal, 2D view shows a normal appearing uterus (C). 3D imaging (D).
A. 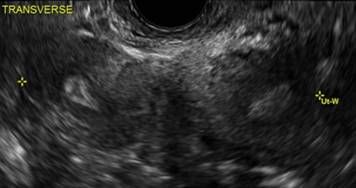
B. 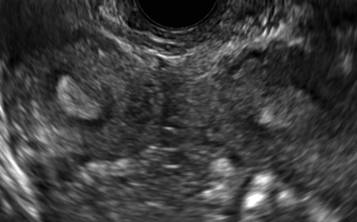
C. 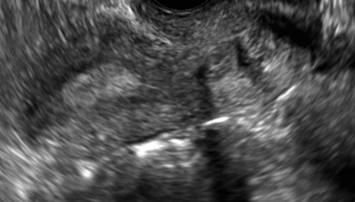
D. 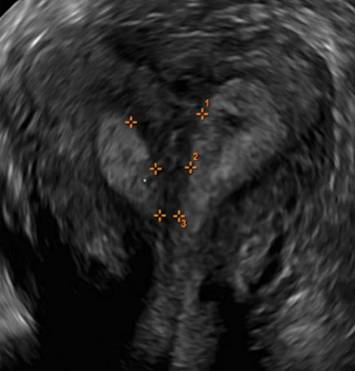
Additional images

- Deutch T, Bocca S, Oehninger S, et al. Magnetic resonance imaging versus three-dimensional transvaginal ultrasound for the diagnosis of müllerian anomalies [abstract]. Fertil Steril 2006; 86(suppl):S308.15.
- Wu MH, Hsu CC, Huang KE. Detection of congenital müllerian duct anomalies using three-dimensional ultrasound. J Clin Ultrasound 1997; 25:487–492.
- Deutch TD, Abuhamad AZ. The role of 3-dimensional ultrasonography and magnetic resonance imaging in the diagnosis of müllerian duct anomalies: a review of the literature. J Ultrasound Med 2008; 27:413–423.

Michelle L. Stalnaker Ozcan, MD
Assistant Professor and Associate Program Director, Obstetrics and Gynecology Residency, Department of Obstetrics and Gynecology at the University of Florida College of Medicine–Jacksonville

Andrew M. Kaunitz, MD
University of Florida Research Foundation Professor and Associate Chairman, Department of Obstetrics and Gynecology at the University of Florida College of Medicine–Jacksonville. Dr. Kaunitz is a member of the OBG Management Board of Editors.
The authors report no financial relationships relevant to this article.
Michelle L. Stalnaker Ozcan, MD
Assistant Professor and Associate Program Director, Obstetrics and Gynecology Residency, Department of Obstetrics and Gynecology at the University of Florida College of Medicine–Jacksonville
Andrew M. Kaunitz, MD
University of Florida Research Foundation Professor and Associate Chairman, Department of Obstetrics and Gynecology at the University of Florida College of Medicine–Jacksonville. Dr. Kaunitz is a member of the OBG Management Board of Editors.
The authors report no financial relationships relevant to this article.
As detailed in Part 1 of this installment on uterine anomalies, a uterus that has developed abnormally can appear to be normal on 2D sonography and on unenhanced sonohysterography (Figure). Without the application of 3D coronal ultrasonography, accurate identification of the fundal contour, and ultimately the type and classification of the uterine anomaly, is not possible.1-3 Fortunately, the lowered cost (compared with magnetic resonance imaging) and the noninvasive nature of this more detailed imaging modality makes its use convenient to both the physician and the patient.
In part 1 of this 2-part installment of our imaging series, we discussed the frequency with which uterine anomalies occur and their types and classifications, as well as offered an imaging library showing the normal endometrial cavity, arcuate uterus, incomplete (partial) uterine septum, and complete uterine septum. Here, we provide two cases demonstrating 3D sonography of the unicornuate, bicornuate, didelphic, and DES-exposed uterus.
A. | B.
|
| C.
| D.
|
| E.
| F.
|
G.
In sagittal view, a uterus with a congenital anomaly can appear normal. Sagittal views of a normal uterus (A) and didelphic uterus (B) and sonohysterogram of a unicornuate uterus (C). Transverse views of a normal (D) and didelphic uterus (E). 3D coronal views of a normal (F) and didelphic uterus (G).
Case 1: Unicornuate uterus
Transverse view of Mirena IUD in right horn and noncommunicating rudimentary left horn.
Case 2: Bicornuate uterus, with concave contour
A patient reporting pelvic pain is examined by 2D sonography, which reveals a bicornuate uterus (A). Note the concave fundal contour (arrow), indicating bicornuate uterus, both horns communicating. 3D imaging (B) revealing fundal “dimple” (concave contour, >1 cm), which is indicative of bicornuate uterus. Complete separation of cavities (C).
A.
B.
C.
Case 3: Didelphic uterus
A patient presenting with primary infertility is found to have a didelphic uterus on 2D and 3D imaging. Note complete separation of uterine cavities on transverse, 2D views (A and B). The left horn sagittal, 2D view shows a normal appearing uterus (C). 3D imaging (D).
A.
B.
C.
D.
Additional images
- Deutch T, Bocca S, Oehninger S, et al. Magnetic resonance imaging versus three-dimensional transvaginal ultrasound for the diagnosis of müllerian anomalies [abstract]. Fertil Steril 2006; 86(suppl):S308.15.
- Wu MH, Hsu CC, Huang KE. Detection of congenital müllerian duct anomalies using three-dimensional ultrasound. J Clin Ultrasound 1997; 25:487–492.
- Deutch TD, Abuhamad AZ. The role of 3-dimensional ultrasonography and magnetic resonance imaging in the diagnosis of müllerian duct anomalies: a review of the literature. J Ultrasound Med 2008; 27:413–423.
CAR-T cell therapy rolls on in pediatric ALL
SAN FRANCISCO – CAR-T cell therapy drove relapsed, refractory acute lymphoblastic leukemia into complete remission in 92% or all but three of 39 children in a phase I/IIa study.
Complete responses were seen within 28 days of receiving a chimeric antigen receptor (CAR)-T cell infusion and have persisted in 15 patients for a year or more, Dr. Stephan A. Grupp reported at the annual meeting of the American Society of Hematology.

Ten relapses have occurred during follow-up of up to 31 months (median 6 months). Half were due to disappearance of the T cells, resulting in CD19-positive relapse, and half were related to antigen escape, resulting in CD19-negative relapse.
Five of the relapsed patients died. No events have been seen in patients who remain in remission after 12 months.
Importantly, CAR-T cell therapy was not used as a bridge to transplant, with only three patients subsequently going on to stem cell transplantation, Dr. Grupp, a pediatric oncologist at the Children’s Hospital of Philadelphia (CHOP) and professor of pediatrics at the University of Pennsylvania, said during a press briefing.
When asked whether CAR-T therapy could be a replacement for transplantation in the future, Dr. Grupp responded, “That would be my fondest hope. We’re not quite there yet, but we’re a lot closer than we used to be.”
The novel immunotherapy first hit the front pages in 2011 after researchers at CHOP and the University of Pennsylvania reported breakthrough results in a handful of children treated with CTL019 cells. T cells are collected from the patient and then genetically reengineered with a CAR directed against tumor B cells expressing the CD19 surface antigen.
More than 130 patients have now been treated by the Pennsylvania team with the CTL019 approach, which received breakthrough therapy status from the Food and Drug Administration in July 2014.
The updated results presented by Dr. Grupp build on those reported earlier this year (N. Engl. J. Med. 2014;371:1507-17) and involve 39 children and young adults. This includes the first 30 pediatric patients with relapsed, refractory ALL treated in the pilot trial. Their median age was 10 years and most were refractory to multiple prior therapies.
At 6 months, the duration of response was 76% and event-free survival was 70%.
The ability of patients to retain their T cells for 6 months or longer was observed in about two-thirds of patients and “is a key point in maintaining remission in these patients,” Dr. Grupp said.
Response rates were independent of disease burden at the time of infusion: 82% response in patients with more than 50% leukemia blast cells, 88% in those with more than 5% blasts, and 100% in those with 0.01%-5% blasts or less than 0.01% blasts.
Patients with higher baseline disease burden (more than 50% blasts), however, were significantly more likely to experience severe cytokine release syndrome (CRS), compared with those with lower disease burden (P < .002).
CRS has been seen across CAR-T cell studies, but there are insufficient data to determine whether this toxicity differs between adult and pediatric patients.
“The key to the cytokine release syndrome, and I believe this carries across platforms and actually may also apply to blinatumomab, is the amplification of the macrophage system through interleukin-6,” Dr. Grupp explained. “This is a classical feedback loop that is actually druggable” using the IL-6 receptor blocker tocilizumab (Actemra).
This strategy produced “remarkable control” of the CRS toxicity, with many of the severe CRS cases experiencing resolution within hours and all cases resolving within 2-3 days, he said.
B-cell aplasia was observed in all responding patients to date and was managed with intravenous immunoglobulin replacement therapy.
The two key questions for the future of CTL019 therapy are toxicity and the logistics of collecting a cell sample and sending it to a centralized manufacturing facility, Dr. Grupp said. This process has already been done on a small scale at CHOP because their cells are made at the University of Pennsylvania. Novartis, which licensed the technology, has built a cell-manufacturing facility and an ongoing phase II study is evaluating whether the technology can be safely rolled out to eight or nine pediatric centers across the country. An adult study will follow, he said.
SAN FRANCISCO – CAR-T cell therapy drove relapsed, refractory acute lymphoblastic leukemia into complete remission in 92% or all but three of 39 children in a phase I/IIa study.
Complete responses were seen within 28 days of receiving a chimeric antigen receptor (CAR)-T cell infusion and have persisted in 15 patients for a year or more, Dr. Stephan A. Grupp reported at the annual meeting of the American Society of Hematology.
Ten relapses have occurred during follow-up of up to 31 months (median 6 months). Half were due to disappearance of the T cells, resulting in CD19-positive relapse, and half were related to antigen escape, resulting in CD19-negative relapse.
Five of the relapsed patients died. No events have been seen in patients who remain in remission after 12 months.
Importantly, CAR-T cell therapy was not used as a bridge to transplant, with only three patients subsequently going on to stem cell transplantation, Dr. Grupp, a pediatric oncologist at the Children’s Hospital of Philadelphia (CHOP) and professor of pediatrics at the University of Pennsylvania, said during a press briefing.
When asked whether CAR-T therapy could be a replacement for transplantation in the future, Dr. Grupp responded, “That would be my fondest hope. We’re not quite there yet, but we’re a lot closer than we used to be.”
The novel immunotherapy first hit the front pages in 2011 after researchers at CHOP and the University of Pennsylvania reported breakthrough results in a handful of children treated with CTL019 cells. T cells are collected from the patient and then genetically reengineered with a CAR directed against tumor B cells expressing the CD19 surface antigen.
More than 130 patients have now been treated by the Pennsylvania team with the CTL019 approach, which received breakthrough therapy status from the Food and Drug Administration in July 2014.
The updated results presented by Dr. Grupp build on those reported earlier this year (N. Engl. J. Med. 2014;371:1507-17) and involve 39 children and young adults. This includes the first 30 pediatric patients with relapsed, refractory ALL treated in the pilot trial. Their median age was 10 years and most were refractory to multiple prior therapies.
At 6 months, the duration of response was 76% and event-free survival was 70%.
The ability of patients to retain their T cells for 6 months or longer was observed in about two-thirds of patients and “is a key point in maintaining remission in these patients,” Dr. Grupp said.
Response rates were independent of disease burden at the time of infusion: 82% response in patients with more than 50% leukemia blast cells, 88% in those with more than 5% blasts, and 100% in those with 0.01%-5% blasts or less than 0.01% blasts.
Patients with higher baseline disease burden (more than 50% blasts), however, were significantly more likely to experience severe cytokine release syndrome (CRS), compared with those with lower disease burden (P < .002).
CRS has been seen across CAR-T cell studies, but there are insufficient data to determine whether this toxicity differs between adult and pediatric patients.
“The key to the cytokine release syndrome, and I believe this carries across platforms and actually may also apply to blinatumomab, is the amplification of the macrophage system through interleukin-6,” Dr. Grupp explained. “This is a classical feedback loop that is actually druggable” using the IL-6 receptor blocker tocilizumab (Actemra).
This strategy produced “remarkable control” of the CRS toxicity, with many of the severe CRS cases experiencing resolution within hours and all cases resolving within 2-3 days, he said.
B-cell aplasia was observed in all responding patients to date and was managed with intravenous immunoglobulin replacement therapy.
The two key questions for the future of CTL019 therapy are toxicity and the logistics of collecting a cell sample and sending it to a centralized manufacturing facility, Dr. Grupp said. This process has already been done on a small scale at CHOP because their cells are made at the University of Pennsylvania. Novartis, which licensed the technology, has built a cell-manufacturing facility and an ongoing phase II study is evaluating whether the technology can be safely rolled out to eight or nine pediatric centers across the country. An adult study will follow, he said.
AT ASH 2014
Key clinical point: CAR-T cell therapy continues to provide durable responses in early studies of children with refractory ALL.
Major finding: Complete remission occurred in 36 of 39 patients (92%) treated with CAR-T cell therapy.
Data source: Phase I/IIa a study in 39 children and young adults with relapsed, refractory acute lymphoblastic leukemia.
Disclosures: The authors reported financial ties with Novartis, the study sponsor.

AHRQ releases update on radiotherapy for head and neck cancer
A new guideline update on radiotherapy treatments for head and neck cancer strengthened the previous guideline’s findings but did not find any new significant evidence on the effectiveness of other procedures.
The guideline, prepared by the Blue Cross and Blue Shield Association and published by the Agency for Healthcare Research and Quality, updates Comparative Effectiveness Review (CER) No. 20, published in 2010. The update includes three-dimensional conformal radiotherapy (3DCRT), intensity-modulated RT (IMRT), and proton-beam RT (PBT), which were in the previous guideline, but also includes stereotactic body RT (SBRT) and excludes two-dimensional RT (2DRT). The search included studies published from September 2009 to April 2013, except for SBRT, where studies from January 1, 1990, through April 2013 were included. Fourteen studies and one randomized controlled trial met inclusion criteria.
The update found new evidence that IMRT reduced xerostomia more than did 3DCRT or 2DRT, but no new evidence was found on how quality of life domains were improved, which were the primary findings of the CER No. 20. Evidence toward other radiotherapy comparisons was limited and insufficient to draw any new conclusions, and no evidence was found for PBT.
Small victories add up to paradigm shifts for hard-to-treat tumors
Click on the PDF icon at the top of this introduction to read the full article.
Click on the PDF icon at the top of this introduction to read the full article.
Click on the PDF icon at the top of this introduction to read the full article.
2013 ACC/AHA guideline on the assessment of cardiovascular risk: a report of the American College of Cardiology/American Heart Association Task Force on Practice Guidelines.
Recommendations
Each recommendation has been mapped from the NHLBI grading format to the American College of Cardiology/American Heart Association Class of Recommendation/Level of Evidence (ACC/AHA COR/LOE) construct and is expressed in both formats. Because of the inherent differences in grading systems and the clinical questions driving the recommendations, alignment between the NHLBI and ACC/AHA formats is in some cases imperfect. Definitions for the NHLBI strength of recommendation (A-E, N) and quality of evidence (High, Moderate, Low) and the ACC/AHA levels of the evidence (LOE: A-C) and classes of recommendations (COR: I-III) are provided at the end of the "Major Recommendations" field.
Summary of Recommendations for Risk Assessment
Assessment of 10-Year Risk of a First Hard Atherosclerotic Cardiovascular Disease (ASCVD) Event
- The race- and sex-specific Pooled Cohort Equations* to predict 10-year risk of a first hard ASCVD event should be used in non-Hispanic African Americans and non-Hispanic whites, 40–79 years of age. NHLBI Grade: B (Moderate); ACC/AHA COR: I; ACC/AHA LOE: B (Dawber, Kannel, & Lyell, 1963; Fried et al., 1991; Kannel et al., 1979; "The Atherosclerosis Risk in Communities (ARIC) Study," 1989)
- Use of the sex-specific Pooled Cohort Equations for non-Hispanic whites may be considered for estimation of risk in patients from populations other than African Americans and non-Hispanic whites. NHLBI Grade: E (Expert Opinion); ACC/AHA COR: IIb; ACC/AHA LOE: C
Critical Question (CQ) 1: Use of Newer Risk Markers after Quantitative Risk Assessment
- If, after quantitative risk assessment, a risk-based treatment decision is uncertain, assessment of ≥1 of the following–family history, high-sensitivity C-reactive protein (hs-CRP), coronary artery calcium (CAC) score, or ankle-brachial index (ABI)–may be considered to inform treatment decision making. NHLBI Grade: E (Expert Opinion); ACC/AHA COR: IIb†; ACC/AHA LOE: B (Buckley et al., 2009; Empana et al., 2011; Ankle Brachial Index Collaboration et al., 2008; Helfand et al., 2009; Emerging Risk Factors Collaboration et al., 2010; Kashani et al., 2013; U.S. Preventive Services Task Force (USPSTF), 2013; Peters et al., 2012; Schnell-Inderst et al., 2010)
- Routine measurement of carotid intima-media thickness (CIMT) is not recommended in clinical practice for risk assessment for a first ASCVD event. NHLBI Grade: N (No recommendation for or against); ACC/AHA COR: III: No Benefit†; ACC/AHA LOE: B (Helfand et al., 2009; Peters et al., 2012; Den Ruijter et al., 2012)
- The contribution of apolipoprotein B (ApoB), chronic kidney disease (CKD), albuminuria, and cardiorespiratory fitness to risk assessment for a first ASCVD event is uncertain at present. NHLBI Grade: N (No recommendation for or against)
CQ2: Long-Term Risk Assessment
- It is reasonable to assess traditional ASCVD risk factors‡ every 4 to 6 years in adults 20 to 79 years of age who are free from ASCVD and to estimate 10-year ASCVD risk every 4 to 6 years in adults 40 to 79 years of age who are free from ASCVD. NHLBI Grade: B (Moderate); ACC/AHA COR: IIa; ACC/AHA LOE: B (Karp et al., 2004; Pencina et al., 2009)
- Assessment of 30-year or lifetime ASCVD risk on the basis of traditional risk factors‡ may be considered in adults 20 to 59 years of age who are free from ASCVD and are not at high short-term risk. NHLBI Grade: C (Weak); ACC/AHA COR: IIb; ACC/AHA LOE: C (Pencina et al., 2009; Lloyd-Jones et al., 2006; Lloyd-Jones et al., 2004)
A downloadable spreadsheet enabling estimation of 10-year and lifetime risk of ASCVD and a Web-based calculator is available from the American Heart Association Web site ![]()
![]()
*Derived from the ARIC (Atherosclerosis Risk in Communities) study (1989), Cardiovascular Health Study (Fried et al., 1991), CARDIA (Coronary Artery Risk Development in Young Adults) study (Friedman et al., 1988), and Framingham original and offspring cohorts (Dawber, Kannel, & Lyell, 1963; Kannel et al., 1979).
†Based on new evidence reviewed during ACC/AHA update of evidence.
‡Age, sex, total cholesterol, high-density lipoprotein cholesterol, systolic BP, use of antihypertensive therapy, diabetes, and current smoking.
Definitions:
NHLBI Grading of the Strength of Recommendations
Note: Each recommendation has been mapped from the National Heart, Lung and Blood Institute (NHLBI) grading format below to the American College of Cardiology/American Heart Association (ACC/AHA) Classification of Recommendation/Level of Evidence (COR/LOE) construct (see the "Rating Scheme for the Strength of the Evidence" field) and is expressed in both formats.
NHLBI Grading of the Strength of Recommendations
| Grade | Strength of Recommendation* |
|---|---|
| A | Strong recommendation There is high certainty based on evidence that the net benefit† is substantial. |
| B | Moderate recommendation There is moderate certainty based on evidence that the net benefit is moderate to substantial, or there is high certainty that the net benefit is moderate. |
| C | Weak recommendation There is at least moderate certainty based on evidence that there is a small net benefit. |
| D | Recommendation against There is at least moderate certainty based on evidence that there is no net benefit or that risks/harms outweigh benefits. |
| E | Expert opinion ("There is insufficient evidence or evidence is unclear or conflicting, but this is what the Work Group recommends.") Net benefit is unclear. Balance of benefits and harms cannot be determined because of no evidence, insufficient evidence, unclear evidence, or conflicting evidence, but the Work Group thought it was important to provide clinical guidance and make a recommendation. Further research is recommended in this area. |
| N | No recommendation for or against ("There is insufficient evidence or evidence is unclear or conflicting.") Net benefit is unclear. Balance of benefits and harms cannot be determined because of no evidence, insufficient evidence, unclear evidence, or conflicting evidence, and the Work Group thought no recommendation should be made. Further research is recommended in this area. |
*In most cases, the strength of the recommendation should be closely aligned with the quality of the evidence; however, under some circumstances, there may be valid reasons for making recommendations that are not closely aligned with the quality of the evidence (e.g., strong recommendation when the evidence quality is moderate, such as smoking cessation to reduce cardiovascular disease [CVD] risk or ordering an electrocardiogram [ECG] as part of the initial diagnostic work-up for a patient presenting with possible myocardial infarction [MI]). Those situations should be limited and the rationale explained clearly by the Work Group.
†Net benefit is defined as benefits minus risks/harms of the service/intervention.
NHLBI Quality Rating of the Strength of Evidence
| Type of Evidence | Quality Rating* |
|---|---|
| High |
| Moderate |
| Low |
*In some cases, other evidence, such as large all-or-none case series (e.g., jumping from airplanes or tall structures), can represent high- or moderate-quality evidence. In such cases, the rationale for the evidence rating exception should be explained by the Work Group and clearly justified.
†"Well-designed, well-executed" refers to studies that directly address the question; use adequate randomization, blinding, and allocation concealment; are adequately powered; use intention-to-treat analyses; and have high follow-up rates.
‡Limitations include concerns with the design and execution of a study that result in decreased confidence in the true estimate of the effect. Examples of such limitations include but are not limited to: inadequate randomization, lack of blinding of study participants or outcome assessors, inadequate power, outcomes of interest that are not prespecified for the primary outcomes, low follow-up rates, and findings based on subgroup analyses. Whether the limitations are considered minor or major is based on the number and severity of flaws in design or execution. Rules for determining whether the limitations are considered minor or major and how they will affect rating of the individual studies will be developed collaboratively with the methodology team.
§Nonrandomized controlled studies refer to intervention studies where assignment to intervention and comparison groups is not random (e.g., quasi-experimental study design).
¶Observational studies include prospective and retrospective cohort, case-control, and cross-sectional studies.
Applying Classification of Recommendations and Level of Evidence
| Size of Treatment Effect | |||||||
|---|---|---|---|---|---|---|---|
| CLASS I Benefit >>> Risk Procedure/Treatment SHOULD be performed/ administered | CLASS IIa Benefit >> Risk Additional studies with focused objectives needed IT IS REASONABLE to perform procedure/administer treatment | CLASS IIb Benefit ≥ Risk Additional studies with broad objectives needed; additional registry data would be helpful Procedure/Treatment MAY BE CONSIDERED | CLASS III No Benefit or Class III Harm | ||||
| Procedure/Test | Treatment | ||||||
| COR III: No Benefit | Not helpful | No proven benefit | |||||
| COR III: Harm | Excess cost without benefit or harmful | Harmful to patients | |||||
| Estimate of Certainty (Precision) of Treatment Effect | LEVEL A Multiple populations evaluated* Data derived from multiple randomized clinical trials or meta-analyses |
|
|
|
| ||
| LEVEL B Limited populations evaluated* Data derived from a single randomized trial or nonrandomized studies |
|
|
|
| |||
| LEVEL C Very limited populations evaluated* Only consensus opinion of experts, case studies, or standard of care |
|
|
|
| |||
A recommendation with Level of Evidence B or C does not imply that the recommendation is weak. Many important clinical questions addressed in the guidelines do not lend themselves to clinical trials. Although randomized trials are unavailable, there may be a very clear clinical consensus that a particular test or therapy is useful or effective.
*Data available from clinical trials or registries about the usefulness/efficacy in different subpopulations, such as sex, age, history of diabetes, history of prior myocardial infarction, history of heart failure, and prior aspirin use.
†For comparative-effectiveness recommendations (Class I and IIa; Level of Evidence A and B only), studies that support the use of comparator verbs should involve direct comparisons of the treatments or strategies being evaluated.
OBJECTIVE: To develop or recommend an approach to quantitative risk assessment that could be used to guide care. To use systematic review methodology to pose and address a small number of questions judged to be critical to refining and adopting risk assessment in clinical practice.
Guidelines are copyright © 2014 American College of Cardiology/American Heart Association. All rights reserved. The summary is provided by the Agency for Healthcare Research and Quality.
Ionizing radiation linked to BCC
SAN DIEGO – Patients treated with ionizing radiation were 2.65 to 3.78 times more likely to develop basal cell carcinoma than were controls, and exposure at younger ages or relatively high doses further increased that risk, according to a pooled analysis presented at the annual meeting of the American Society for Dermatologic Surgery.
“Concomitant exposure to ultraviolet radiation may potentiate this effect,” said Dr. Min Deng, a dermatology resident at the University of Chicago. “With newer treatment protocols and improved shielding, it would be interesting to see if the effect of ionizing radiation has changed, or whether we as dermatologists should more actively screen this at-risk population.”
Basal cell carcinoma (BCC) is the most common skin cancer worldwide, but relatively few dermatology papers have assessed the effects of ionizing radiation on the incidence of BCC, said Dr. Deng and coauthor Dr. Diana Bolotin, also of the University of Chicago.
To better understand the link, the researchers searched PubMed for controlled studies on the topic by using the terms “radiation,” “risk,” and “basal cell carcinoma.” They excluded case reports, animal studies, studies published in languages other than English, and trials of radiation as a treatment of BCC, they said. They also excluded studies of atomic bomb survivors, because exposure was uncontrolled and methods to estimate exposure in this group have changed over time, they noted.
In all, six studies published between 1991 and 2012 met the inclusion criteria, and all six showed a statistically significant relative risk or odds of BCC with ionizing radiation exposure, the investigators reported. Three analyses calculated the relative risk of BCC in patients who received radiation for tinea capitis or who underwent total-body irradiation before hematopoietic cell transplantation, they said. Two studies evaluated the odds of BCC in patients with a past history of radiation exposure, and one study assessed time to subsequent BCCs in patients with a history of BCC.
For the three studies that calculated relative risk, the researchers calculated a pooled RR of BCC after ionizing radiation treatment of 2.65 (95% confidence interval, 1.22-5.72) compared with controls. The study of total-body irradiation (TBI) did not report or control for the primary disease for which patients were treated, “which may have confounded the results,” they said. When they excluded that study from their calculation, the overall RR rose to 3.78 (95% CI, 2.62 to 5.44).
Notably, in the two studies of patients with tinea capitis, the relative risk of BCC fell by 12% to 16% for every additional year of age at which patients received radiation treatment, the researchers said. Similarly, risk of BCC dropped by 10.9% for every 1-year increase in age at total-body irradiation prior to cell transplantation.
The combined odds ratio for the next two studies was 4.28 (1.45-12.63). “Likewise, both studies found an elevated odds ratio with younger age at radiation exposure,” the researchers added. One study that stratified patients by type of medical condition detected a “markedly elevated” 8.7 odds of BCC after radiation treatment for acne (2.0 to 38.0), they noted.
The sixth study was a nested case-control analysis that found a statistically significant increase in the odds of BCC starting at a 1-Gy dose of ionizing radiation, and rising linearly up to doses of 35-63.3 Gy. “The risk for developing multiple BCCs also appears to be elevated in patients with a history of radiation therapy,” the researchers said. Patients who had been exposed to ionizing ratio were 2.3 times more likely to develop new BCCs compared with unexposed patients (1.7 to 3.1), they said.
The investigators reported no funding sources or conflicts of interest.
Key clinical point: Ionizing radiation therapy significantly increased risk of basal cell carcinoma, especially when patients were younger or were treated at relatively high doses.
Major finding: The pooled relative risk of BCC after ionizing radiation treatment was 2.65 (95% confidence interval, 1.22-5.72) compared with controls.
Data source: Pooled analysis of six studies of ionizing radiation exposure and risk or odds of basal cell carcinoma.
Disclosures: The researchers reported no funding sources or conflicts of interest.
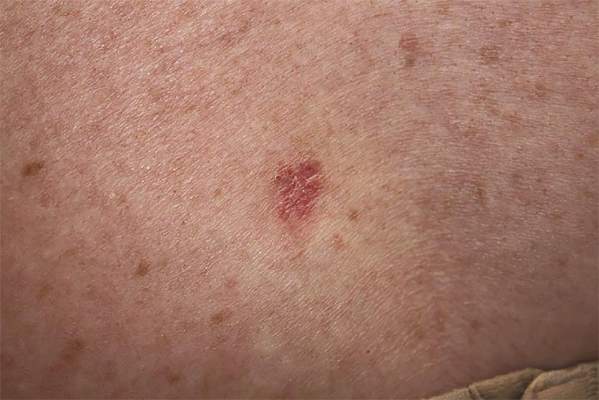
Blinatumomab confirmed as treatment option in MRD+ ALL

SAN FRANCISCO—The first international, multicenter trial in acute lymphoblastic leukemia (ALL) using minimal residual disease (MRD) as a criterion for inclusion has confirmed clinical benefit for patients using a non-chemotherapeutic approach.
In the BLAST trial, blinatumomab, a bispecific T-cell engager antibody that directs cytotoxic T cells to CD19-positive cells, produced a complete MRD response in 80% of patients who were in complete hematologic remission but had quantifiable MRD at the time of treatment.
This echoes results of an earlier phase 2 study, in which blinatumomab produced an 80% MRD response rate in 20 patients with B-precursor ALL and persistent or relapsed MRD.
Nearly all patients with persistent or recurrent MRD relapse despite continued chemotherapy, according to Nicola Gökbuget, MD, PhD, of Goethe University Hospital in Frankfurt, Germany.
“The question,” she said, “is how to treat these patients.”
She presented one effective method, as shown by the BLAST trial, at the 2014 ASH Annual Meeting (abstract 379).
The trial enrolled 116 patients aged 18 or older with B-precursor ALL in complete hematologic remission but with MRD ≥ 10-3.
Patients could be in second or later remission, but they were excluded if they had a prior allogeneic stem cell transplant, circulating blasts or extra medullary ALL involvement, CNS pathology, prior chemotherapy within 2 weeks, or radiotherapy within 4 weeks.
Enrolled patients were a median age of 45 years (range, 18-76), and 34% were 65 or older. Most patients had high baseline MRD levels: 39% were ≥ 10-2 to < 10-1, and 45% were ≥ 10-3 to < 10-2.
Investigators evaluated MRD levels after each cycle. Analysis was performed in a central lab in Kiel, Germany, and was based on amplification of immunoglobulin and/or T-cell receptor gene rearrangements by PCR.
The primary endpoint was the proportion of patients achieving a complete MRD response after 1 cycle of blinatumomab.
Patients received 15 μg/m2 of blinatumomab per day by continuous intravenous infusion for 4 weeks, followed by a treatment-free period of 2 weeks. Responders could receive up to 4 cycles of therapy or receive a transplant any time after the first cycle.
Results
In the efficacy-evaluable population, 80% of 103 patients achieved a complete MRD response after 1 cycle, defined as MRD negative with no amplification in PCR with a minimum sensitivity of 10-4. And 85% achieved an incomplete MRD response of <10-4 with a minimum sensitivity of 10-4.
Results were similar in the full analysis set of 113 patients: 78% achieved complete MRD response after 1 cycle, and 85% achieved an incomplete MRD response.
Dr Gökbuget noted that 2 patients who initially achieved an incomplete response achieved a complete response during continued treatment in cycle 2.
The investigators analyzed the clinical characteristics of the patients and found that no factor—age, treatment interruptions, neurologic events, relapse history, nor gender—correlated with MRD response.
“I think that the good news is that it means that the compound was active in all of the patients,” Dr Gökbuget commented.
Adverse events
All patients experienced at least one adverse event (AE), and 2 were fatal—subdural hemorrhage and treatment-related pneumonitis. Serious treatment-related AEs that occurred in 3% or more of the
patients included tremor (7%), aphasia (5%), and encephalopathy (5%).
Thirty-one percent of patients interrupted their treatment because of AEs, which were primarily due to cytokine-related symptoms like pyrexia and neurologic events, including tremor, aphasia, and dizziness. Seventeen percent of patients permanently discontinued treatment due to an AE.
However, Dr Gökbuget pointed out that most AEs were grade 1 or 2, and the treatment interruption did not correlate with response.
She said the next step for this trial is to investigate whether high MRD response translates into long-term clinical benefit such as continued molecular remission and long-term survival.
“For me personally, this trial is very important because it is an up-to-date trial where we used PCR-based methods to identify patients with a high risk of relapse and treat them before the relapse occurs,” Dr Gökbuget said. “[W]e used a new endpoint, which is also MRD based, and . . . we used a new, non-chemotherapy treatment to eradicate this highly resistant, persistent ALL subclone.”
Blinatumomab received US Food and Drug Administration approval a few days before the start of the ASH Annual Meeting.
The BLAST trial was funded by Amgen Inc., the company developing blinatumomab. ![]()