User login
Evolving Role of the PNP Hospitalist
The Accreditation Council for Graduate Medical Education implemented rules limiting work hours for residents in 2003 and 2011, decreasing the availability of residents as providers at teaching hospitals.[1] These restrictions have increased reliance on advance practice providers (APPs) including nurse practitioners (NPs) and physicians' assistants in providing inpatient care. The NP hospitalist role includes inpatient medical management, coordination of care, patient and staff education, and quality improvement activities.[2] The NP hospitalist role has expanded beyond a replacement for reduced resident work hours, adding value through resident teaching, development of clinical care guidelines (CCGs), continuity of care, and familiarity with inpatient management.[3] The NP hospitalist role has been shown to improve the quality, efficiency, and cost effectiveness of inpatient care.[4, 5]
Favorable quality and cost measure results have been documented for adult NP hospitalists compared to housestaff, including improved patient outcomes, increased patient and staff satisfaction, decreased length of stay (LOS) and cost of care, and improved access to care.[6] These findings are supported by NP inpatient program evaluations at several academic medical centers, which also show increased patient and family satisfaction and improved communication between physicians, nurses, and families.[6, 7, 8] One study demonstrated that collaborative care management of adult medical patients by a hospitalist physician and advanced practice nurse led to decreased LOS and improved hospital profit without changing patient readmission or mortality.[9] Although there is a growing body of evidence supporting the quality and cost effectiveness of the NP hospitalist role in adult inpatient care, there are little published data for pediatric programs.
METHODS
The pediatric nurse practitioner (PNP) hospitalist role at Children's Hospital Colorado (CHCO) was initiated in 2006 to meet the need for additional inpatient providers. Inpatient staffing challenges included decreased resident work hours as well as high inpatient volume during the winter respiratory season. The PNP hospitalist providers at CHCO independently manage care throughout hospitalization for patients within their scope of practice, and comanage more complex patients with the attending doctor of medicine (MD). The PNPs complete history and physical exams, order and interpret diagnostic tests, perform procedures, prescribe medications, and assist with discharge coordination. Patient populations within the PNP hospitalist scope of practice include uncomplicated bronchiolitis, pneumonia, and asthma.
The hospitalist section at CHCO's main campus includes 2 resident teams and 1 PNP team. The hospitalist section also provides inpatient care at several network of care (NOC) sites. These NOC sites are CHCO‐staffed facilities that are either freestanding or connected to a community hospital, with an emergency department and 6 to 8 inpatient beds. The PNP hospitalist role includes inpatient management at the CHCO main campus as well as in the NOC. The NOC sites are staffed with a PNP and MD team who work collaboratively to manage inpatient care. The Advanced Practice Hospitalist Program was implemented to improve staffing and maintain quality of patient care in a cost‐effective manner. We undertook a program evaluation with the goal of comparing quality and cost of care between the PNP team, PNP/MD team, and resident teams.
Administrative and electronic medical record data from July 1, 2009 through June 30, 2010 were reviewed retrospectively. Data were obtained from inpatient records at CHCO inpatient medical unit and inpatient satellite sites in the CHCO NOC. The 2008 versions 26 and 27 of the 3M All Patient Refined Diagnosis‐Related Groups (APR‐DRG) were used to categorize patients by diagnosis, severity of illness, and risk of mortality.[10, 11] The top 3 APR‐DRGs at CHCO, based on volume of inpatient admissions, were selected for this analysis, including bronchiolitis and RSV pneumonia (APR‐DRG 138), pneumonia NEC (APR‐DRG 139), and asthma (APR‐DRG 141) (N = 1664). These 3 diagnoses accounted for approximately 60% of all inpatient hospitalist encounters and comprised 78% of the PNP encounters, 52% of the resident encounters, and 76% of the PNP/MD encounters. APR‐DRG severity of illness categories include I, II, III, and IV (minor, moderate, major, and extreme, respectively).[12] Severity of illness levels I and II were used for this analysis. Severity III and IV levels were excluded due to lack of patients in these categories on the PNP team and in the NOC. We also included observation status patients. The PNP team accounted for approximately 20% of the inpatient encounters, with 45% on the resident teams and 35% on the PNP/MD team in the NOC (Table 1).
| Distribution of Patients | Patient Type/Severity of Illness | NP | Resident | PNP/MD |
|---|---|---|---|---|
| ||||
| Bronchiolitis | Observation | 26 (23%) | 32 (28%) | 55 (49%) |
| Severity I | 93 (29%) | 77 (24%) | 151 (47%) | |
| Severity II | 49 (24%) | 95 (47%) | 60 (29%) | |
| Asthma | Observation | 7 (14%) | 23 (45%) | 21 (41%) |
| Severity I | 48 (14%) | 191 (57%) | 97 (29%) | |
| Severity II | 19 (12%) | 106 (66%) | 35 (22%) | |
| Pneumonia | Observation | 6 (22%) | 12 (44%) | 9 (34%) |
| Severity I | 33 (17%) | 68 (35%) | 93 (48%) | |
| Severity II | 37 (14%) | 152 (59%) | 69 (27%) | |
The PNP hospitalist program was evaluated by comparing patient records from the PNP team, the PNP/MD team, and the resident teams. Evaluation measures included compliance with specific components of the bronchiolitis and asthma CCGs, LOS, and cost of care.
Outcomes Measured
Quality measures for this program evaluation included compliance with the bronchiolitis CCG recommendation to diagnose bronchiolitis based on history and exam findings while minimizing the use of chest x‐ray and respiratory viral testing.[13] Current evidence suggests that these tests add cost and exposure to radiation and do not necessarily predict severity of disease or change medical management.[14] This program evaluation also measured compliance with the asthma CCG recommendation to give every asthma patient an asthma action plan (AAP) prior to hospital discharge.[15] Of note, this evaluation was completed prior to more recent evidence that questions the utility of AAP for improving asthma clinical outcomes.[16] There were no related measures for pneumonia available because there was no CCG in place at the time of this evaluation.
Outcomes measures for this evaluation included LOS and cost of care for the top 3 inpatient diagnoses: bronchiolitis, asthma, and pneumonia. LOS for the inpatient hospitalization was measured in hours. Direct cost of care was used for this analysis, which included medical supplies, pharmacy, radiology, laboratory, and bed charges. Nursing charges were also included in the direct cost due to the proximity of nursing cost to the patient, versus more distant costs such as infrastructure or administration. Hospitalist physician and NP salaries were not included in direct cost analysis. Outcomes were compared for the PNP team, the resident teams, and the PN/MD team in the NOC.
Analysis
Patients were summarized by diagnosis‐related groups (APR‐DRG) and severity of illness using counts and percentages across the PNP team, resident teams, and the PNP/MD team in the NOC (Table 1). LOS and direct cost is skewed, therefore natural log transformations were used to meet normal assumption for statistical testing and modeling. Chi squared and t tests were performed to compare outcomes between the PNP and resident physician teams, stratified by APR‐DRG. Analysis of variance was used to analyze LOS and direct cost for the top 3 APR‐DRG admission codes while adjusting for acuity. The outcomes were also compared pairwise among the 3 teams using a linear mixed model to adjust for APR‐DRG and severity of illness, treating severity as a nested effect within the APR‐DRG. Bonferroni corrections were used to adjust for multiple comparisons; a P value 0.017 was considered statistically significant. Post hoc power analysis was completed for the analysis of bronchiolitis chest x‐ray ordering, even though the sample size was relatively large (PNP team 128, resident team 204) (Table 1). There was a 7% difference between the PNP and resident groups, and the power of detecting a significant difference was 40%. A sample size of 482 for each group would be necessary to achieve 80% power of detecting a 7% difference, while controlling for 5% type I error. All statistical analyses were performed with SAS version 9.3 (SAS Institute Inc., Cary, NC).
RESULTS
PNP adherence to CCGs was comparable to resident teams for the specific measures used in this evaluation. Based on a hospital‐wide goal of ordering diagnostic tests for less than 25% of inpatients with bronchiolitis, there was no significant difference between the PNP team and resident teams. There was no significant difference in the rate of chest x‐ray ordering between the PNP team and the resident teams (15% vs 22%, P = 0.1079). Similarly, there was no significant difference in viral testing between the PNP and physician teams (24% vs 25%, P = 0.9813) (Table 2). Post hoc power analysis indicated that a larger sample size would be required to increase the power of detecting a statistically significant difference in chest x‐ray ordering between these groups. The PNP and resident teams were also compared using compliance with the asthma CCGs, specifically related to the goal of providing an accurate AAP to every patient admitted for asthma. The PNP and resident teams had a similar rate of compliance, with PNPs achieving 81% compliance and MDs 76% (P = 0.4351) (Table 2).
| Clinical Care Guidelines | Diagnostic Test | PNP Team | Resident Teams | P Value |
|---|---|---|---|---|
| ||||
| Bronchiolitis care | Chest x‐ray | 15% | 22% | 0.1079 |
| Diagnostic testing | Viral test | 24% | 25% | 0.9813 |
| Completed asthma action plans | 81% | 76% | 0.4351 | |
LOS and direct costs were compared for the 3 teams for the top 3 APR‐DRGs and controlling for acuity. Table 3 illustrates that there were no significant differences in LOS between the PNP and resident teams or between the PNP and PNP/MD teams for these 3 APR‐DRGs (P 0.017 considered statistically significant). There was a statistically significant difference in LOS between resident and PNP/MD teams for asthma and pneumonia (P 0.001). The direct cost of care per patient encounter provided by the PNP team was significantly less than the PNP/MD team for all 3 APR‐DRGs (P 0.001). The direct cost of care per patient encounter provided by the PNP team was significantly less than the resident teams for asthma (P = 0.0021) and pneumonia (P = 0.0001), although the difference was not statistically significant for bronchiolitis (P = 0.0228) for level of significance P 0.0017 (Table 3, 4).
| PNP | Resident | PNP/MD | P Value PNP vs Resident | P Value
PNP vs PNP/MD |
P Value Resident vs PNP/MD | |
|---|---|---|---|---|---|---|
| ||||||
| Cost | ||||||
| Bronchiolitis | $2190 | $2513 | $3072 | 0.0228 | 0.0001 | 0.0002 |
| Asthma | $2089 | $2655 | $3220 | 0.0021 | 0.0001 | 0.0190 |
| Pneumonia | $2348 | $3185 | $3185 | 0.0001 | 0.0001 | 0.1142 |
| LOS, h | ||||||
| Bronchiolitis | 52 | 52 | 51 | 0.9112 | 0.1600 | 0.1728 |
| Asthma | 36 | 42 | 48 | 0.0158 | 0.3151 | 0.0001 |
| Pneumonia | 54 | 61 | 68 | 0.1136 | 0.1605 | 0.0001 |
| PNP | Resident | PNP/MD | PHIS Observation | PHIS SeverityIII | |
|---|---|---|---|---|---|
| |||||
| LOS, h | |||||
| Bronchiolitis | 52 | 52 | 51 | 43 | 70 |
| Asthma | 36 | 42 | 48 | 31 | 48 |
| Pneumonia | 54 | 61 | 68 | 46 | 64 |
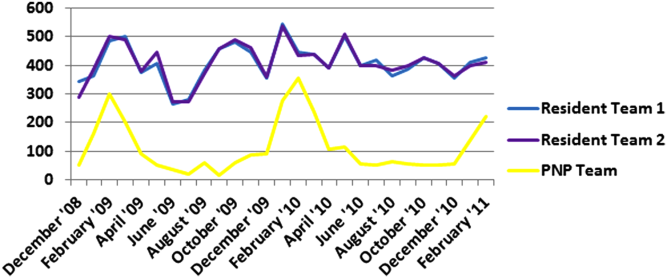
Figure 1 illustrates the monthly patient census on the PNP and resident teams obtained from daily midnight census. There was a dramatic seasonal fluctuation in PNP team census, with a low census in July 2009 (22 patients) and high census in February 2010 (355 patients). The resident teams maintained a relatively stable census year round compared to the PNP team.

CONCLUSIONS/DISCUSSION
The results of this program evaluation suggest that the PNP team at CHCO provides inpatient care comparable to the resident teams at a lower cost per patient encounter for uncomplicated bronchiolitis, pneumonia, and asthma. The results of this program evaluation are consistent with previously published studies demonstrating that NPs improve outcomes such as decreased LOS and cost of care.[9]
In the setting of increasingly stringent restrictions in residency work hours, PNP hospitalists are a valuable resource for managing inpatient care. PNPs can provide additional benefits not explored in this program evaluation, such as increased access to care, increased patient and family satisfaction, improved documentation, and improved communication between nurses and physicians.[6] NP hospitalist providers can also decrease the patient care burden on housestaff, allowing teaching teams to focus on resident education.[6] This point could be made for the PNP team at CHCO, which contributed to care of inpatients during the peak respiratory season census. This strategy has allowed the resident teaching teams to maintain a more manageable patient census during the winter respiratory season, and presumably has allowed greater focus on resident education year round.[17]
Hospitals have been increasingly using evidence based CCGs as a strategy to improve patient outcomes and decrease LOS and cost.[18] CCGs provide an excellent tool for hospitalist physicians and APPs to deliver consistent inpatient care for common diagnoses such as bronchiolitis, asthma, and pneumonia. Increased reliance on CCGs has provided an opportunity to standardize evidence‐based practices and has allowed PNPs to expand their inpatient role at CHCO. The addition of a PNP inpatient team at CHCO also provided an effective strategy for management of seasonal fluctuations in inpatient census, particularly during the winter respiratory season.
Limitations
This is a single‐site program evaluation at a free standing children's hospital. Colorado law allows NPs to practice independently and obtain full prescriptive authority, although licensing and certification regulations for APPs vary from state to state. Our results may not be generalizable to other hospitals or to states where regulations differ. Patients admitted to the NOC sites and those assigned to the PNP team at the main campus are generally lower acuity and complexity compared to patients assigned to the resident teams at the main campus. Although we controlled for severity using the APR‐DRG severity classification, it is possible that our results were biased due to different patient profiles among the PNP and MD hospitalist teams. There were also potential limitations in the cost analysis, which included nursing in direct costs. Although nurse‐to‐patient ratios are comparable across hospitalist sites, the ratios may have varied due to fluctuations in patient census at each site. The CCG monitoring measures used in this evaluation also presented limitations. These measures were selected due to the availability of these data in the electronic medical record. Future studies may provide more clinically relevant information by including additional patient outcomes measures specifically related to inpatient medical management.
Despite the limitations in this program evaluation, we feel that these data add to the current knowledge in pediatrics by showing equipoise between these 2 groups. The PNP hospitalist role continues to evolve at CHCO, and the utility of this role must continue to be evaluated and reported.
Acknowledgements
Dashka Ranade provided Children's Hospital Colorado CCG comparison data for this program evaluation. David Bertoch provided LOS data from the Children's Hospital Association Pediatric Health Information System database.
Disclosures: Supported by NIH/NCATS Colorado CTSI grant number UL1 TR000154. The contents are the authors' sole responsibility and do not necessarily represent official NIH views.
- Education ACfGM. Common Program Requirements. Accreditation Council for Graduate Medical Education, 2011.
- , , , , , . Hospitalist services: an evolving opportunity. Nurse Pract. 2008;33(5):9–10.
- . APRN hospitalist: just a resident replacement? J Pediatr Health Care. 2004;18(4):208–210.
- , , , . Evaluation of the role of the pediatric nurse practitioner in an inpatient asthma program. J Pediatr Health Care. 2008;22(5):273–281.
- , . Acute care nurse practitioner as hospitalist: role description. AACN Adv Crit Care. 2009;20(2):133–136.
- , . Acute care nurse practitioners: creating and implementing a model of care for an inpatient general medical service. Am J Crit Care. 2002;11(5):448–458.
- , , , et al. Pediatric trauma nurse practitioners provide excellent care with superior patient satisfaction for injured children. J Pediatr Surg. 2006;41(1):277–281.
- , , , et al. Pediatric trauma nurse practitioners increase bedside nurses' satisfaction with pediatric trauma patient care. J Trauma Nurs. 2006;13(2):66–69.
- , , , et al. The effect of a multidisciplinary hospitalist/physician and advanced practice nurse collaboration on hospital costs. J Nurs Adm. 2006;36(2):79–85.
- , , , , . A closer look at all‐patient refined DRGs. J AHIMA. 2002;73(1):46–50.
- . Structure and performance of different DRG classification systems for neonatal medicine. Pediatrics. 1999;103(1 suppl E):302–318.
- Association CsH. Patient classification system, Children's Hospital Association. Available at: http://www.childrenshospitals.org/. Accessed January 4, 2014.
- . Children's Hospital Colorado bronchiolitis clinical care guideline, Bronchiolitis CCG Task Force 2011. Available at: http://www.childrenscolorado.org/conditions/lung/healthcare_professionals/clinical_care_guidelines.aspx. Accessed January 4, 2014.
- American Academy of Pediatrics Subcommittee on Diagnosis and Management of Bronchiolitis. Diagnosis and management of bronchiolitis. Pediatrics. 2006;118(4):1774–1793.
- .Children's Hospital Colorado asthma clinical care guideline, Asthma Task Force, 2011. Available at: http://www.childrenscolorado.org/conditions/lung/healthcare_professionals/clinical_care_guidelines.aspx. Accessed January 4, 2014.
- , , . Written action plans for asthma in children. Cochrane Database Syst Rev. 2006;(3):CD005306.
- , . Pediatric nurse practitioners as hospitalists. J Pediatr Health Care. 2010;24(5):347–350.
- , , . Health policy issues and applications for evidence‐based medicine and clinical practice guidelines. Health Policy. 1998;46(1):1–19.
The Accreditation Council for Graduate Medical Education implemented rules limiting work hours for residents in 2003 and 2011, decreasing the availability of residents as providers at teaching hospitals.[1] These restrictions have increased reliance on advance practice providers (APPs) including nurse practitioners (NPs) and physicians' assistants in providing inpatient care. The NP hospitalist role includes inpatient medical management, coordination of care, patient and staff education, and quality improvement activities.[2] The NP hospitalist role has expanded beyond a replacement for reduced resident work hours, adding value through resident teaching, development of clinical care guidelines (CCGs), continuity of care, and familiarity with inpatient management.[3] The NP hospitalist role has been shown to improve the quality, efficiency, and cost effectiveness of inpatient care.[4, 5]
Favorable quality and cost measure results have been documented for adult NP hospitalists compared to housestaff, including improved patient outcomes, increased patient and staff satisfaction, decreased length of stay (LOS) and cost of care, and improved access to care.[6] These findings are supported by NP inpatient program evaluations at several academic medical centers, which also show increased patient and family satisfaction and improved communication between physicians, nurses, and families.[6, 7, 8] One study demonstrated that collaborative care management of adult medical patients by a hospitalist physician and advanced practice nurse led to decreased LOS and improved hospital profit without changing patient readmission or mortality.[9] Although there is a growing body of evidence supporting the quality and cost effectiveness of the NP hospitalist role in adult inpatient care, there are little published data for pediatric programs.
METHODS
The pediatric nurse practitioner (PNP) hospitalist role at Children's Hospital Colorado (CHCO) was initiated in 2006 to meet the need for additional inpatient providers. Inpatient staffing challenges included decreased resident work hours as well as high inpatient volume during the winter respiratory season. The PNP hospitalist providers at CHCO independently manage care throughout hospitalization for patients within their scope of practice, and comanage more complex patients with the attending doctor of medicine (MD). The PNPs complete history and physical exams, order and interpret diagnostic tests, perform procedures, prescribe medications, and assist with discharge coordination. Patient populations within the PNP hospitalist scope of practice include uncomplicated bronchiolitis, pneumonia, and asthma.
The hospitalist section at CHCO's main campus includes 2 resident teams and 1 PNP team. The hospitalist section also provides inpatient care at several network of care (NOC) sites. These NOC sites are CHCO‐staffed facilities that are either freestanding or connected to a community hospital, with an emergency department and 6 to 8 inpatient beds. The PNP hospitalist role includes inpatient management at the CHCO main campus as well as in the NOC. The NOC sites are staffed with a PNP and MD team who work collaboratively to manage inpatient care. The Advanced Practice Hospitalist Program was implemented to improve staffing and maintain quality of patient care in a cost‐effective manner. We undertook a program evaluation with the goal of comparing quality and cost of care between the PNP team, PNP/MD team, and resident teams.
Administrative and electronic medical record data from July 1, 2009 through June 30, 2010 were reviewed retrospectively. Data were obtained from inpatient records at CHCO inpatient medical unit and inpatient satellite sites in the CHCO NOC. The 2008 versions 26 and 27 of the 3M All Patient Refined Diagnosis‐Related Groups (APR‐DRG) were used to categorize patients by diagnosis, severity of illness, and risk of mortality.[10, 11] The top 3 APR‐DRGs at CHCO, based on volume of inpatient admissions, were selected for this analysis, including bronchiolitis and RSV pneumonia (APR‐DRG 138), pneumonia NEC (APR‐DRG 139), and asthma (APR‐DRG 141) (N = 1664). These 3 diagnoses accounted for approximately 60% of all inpatient hospitalist encounters and comprised 78% of the PNP encounters, 52% of the resident encounters, and 76% of the PNP/MD encounters. APR‐DRG severity of illness categories include I, II, III, and IV (minor, moderate, major, and extreme, respectively).[12] Severity of illness levels I and II were used for this analysis. Severity III and IV levels were excluded due to lack of patients in these categories on the PNP team and in the NOC. We also included observation status patients. The PNP team accounted for approximately 20% of the inpatient encounters, with 45% on the resident teams and 35% on the PNP/MD team in the NOC (Table 1).
| Distribution of Patients | Patient Type/Severity of Illness | NP | Resident | PNP/MD |
|---|---|---|---|---|
| ||||
| Bronchiolitis | Observation | 26 (23%) | 32 (28%) | 55 (49%) |
| Severity I | 93 (29%) | 77 (24%) | 151 (47%) | |
| Severity II | 49 (24%) | 95 (47%) | 60 (29%) | |
| Asthma | Observation | 7 (14%) | 23 (45%) | 21 (41%) |
| Severity I | 48 (14%) | 191 (57%) | 97 (29%) | |
| Severity II | 19 (12%) | 106 (66%) | 35 (22%) | |
| Pneumonia | Observation | 6 (22%) | 12 (44%) | 9 (34%) |
| Severity I | 33 (17%) | 68 (35%) | 93 (48%) | |
| Severity II | 37 (14%) | 152 (59%) | 69 (27%) | |
The PNP hospitalist program was evaluated by comparing patient records from the PNP team, the PNP/MD team, and the resident teams. Evaluation measures included compliance with specific components of the bronchiolitis and asthma CCGs, LOS, and cost of care.
Outcomes Measured
Quality measures for this program evaluation included compliance with the bronchiolitis CCG recommendation to diagnose bronchiolitis based on history and exam findings while minimizing the use of chest x‐ray and respiratory viral testing.[13] Current evidence suggests that these tests add cost and exposure to radiation and do not necessarily predict severity of disease or change medical management.[14] This program evaluation also measured compliance with the asthma CCG recommendation to give every asthma patient an asthma action plan (AAP) prior to hospital discharge.[15] Of note, this evaluation was completed prior to more recent evidence that questions the utility of AAP for improving asthma clinical outcomes.[16] There were no related measures for pneumonia available because there was no CCG in place at the time of this evaluation.
Outcomes measures for this evaluation included LOS and cost of care for the top 3 inpatient diagnoses: bronchiolitis, asthma, and pneumonia. LOS for the inpatient hospitalization was measured in hours. Direct cost of care was used for this analysis, which included medical supplies, pharmacy, radiology, laboratory, and bed charges. Nursing charges were also included in the direct cost due to the proximity of nursing cost to the patient, versus more distant costs such as infrastructure or administration. Hospitalist physician and NP salaries were not included in direct cost analysis. Outcomes were compared for the PNP team, the resident teams, and the PN/MD team in the NOC.
Analysis
Patients were summarized by diagnosis‐related groups (APR‐DRG) and severity of illness using counts and percentages across the PNP team, resident teams, and the PNP/MD team in the NOC (Table 1). LOS and direct cost is skewed, therefore natural log transformations were used to meet normal assumption for statistical testing and modeling. Chi squared and t tests were performed to compare outcomes between the PNP and resident physician teams, stratified by APR‐DRG. Analysis of variance was used to analyze LOS and direct cost for the top 3 APR‐DRG admission codes while adjusting for acuity. The outcomes were also compared pairwise among the 3 teams using a linear mixed model to adjust for APR‐DRG and severity of illness, treating severity as a nested effect within the APR‐DRG. Bonferroni corrections were used to adjust for multiple comparisons; a P value 0.017 was considered statistically significant. Post hoc power analysis was completed for the analysis of bronchiolitis chest x‐ray ordering, even though the sample size was relatively large (PNP team 128, resident team 204) (Table 1). There was a 7% difference between the PNP and resident groups, and the power of detecting a significant difference was 40%. A sample size of 482 for each group would be necessary to achieve 80% power of detecting a 7% difference, while controlling for 5% type I error. All statistical analyses were performed with SAS version 9.3 (SAS Institute Inc., Cary, NC).
RESULTS
PNP adherence to CCGs was comparable to resident teams for the specific measures used in this evaluation. Based on a hospital‐wide goal of ordering diagnostic tests for less than 25% of inpatients with bronchiolitis, there was no significant difference between the PNP team and resident teams. There was no significant difference in the rate of chest x‐ray ordering between the PNP team and the resident teams (15% vs 22%, P = 0.1079). Similarly, there was no significant difference in viral testing between the PNP and physician teams (24% vs 25%, P = 0.9813) (Table 2). Post hoc power analysis indicated that a larger sample size would be required to increase the power of detecting a statistically significant difference in chest x‐ray ordering between these groups. The PNP and resident teams were also compared using compliance with the asthma CCGs, specifically related to the goal of providing an accurate AAP to every patient admitted for asthma. The PNP and resident teams had a similar rate of compliance, with PNPs achieving 81% compliance and MDs 76% (P = 0.4351) (Table 2).
| Clinical Care Guidelines | Diagnostic Test | PNP Team | Resident Teams | P Value |
|---|---|---|---|---|
| ||||
| Bronchiolitis care | Chest x‐ray | 15% | 22% | 0.1079 |
| Diagnostic testing | Viral test | 24% | 25% | 0.9813 |
| Completed asthma action plans | 81% | 76% | 0.4351 | |
LOS and direct costs were compared for the 3 teams for the top 3 APR‐DRGs and controlling for acuity. Table 3 illustrates that there were no significant differences in LOS between the PNP and resident teams or between the PNP and PNP/MD teams for these 3 APR‐DRGs (P 0.017 considered statistically significant). There was a statistically significant difference in LOS between resident and PNP/MD teams for asthma and pneumonia (P 0.001). The direct cost of care per patient encounter provided by the PNP team was significantly less than the PNP/MD team for all 3 APR‐DRGs (P 0.001). The direct cost of care per patient encounter provided by the PNP team was significantly less than the resident teams for asthma (P = 0.0021) and pneumonia (P = 0.0001), although the difference was not statistically significant for bronchiolitis (P = 0.0228) for level of significance P 0.0017 (Table 3, 4).
| PNP | Resident | PNP/MD | P Value PNP vs Resident | P Value
PNP vs PNP/MD |
P Value Resident vs PNP/MD | |
|---|---|---|---|---|---|---|
| ||||||
| Cost | ||||||
| Bronchiolitis | $2190 | $2513 | $3072 | 0.0228 | 0.0001 | 0.0002 |
| Asthma | $2089 | $2655 | $3220 | 0.0021 | 0.0001 | 0.0190 |
| Pneumonia | $2348 | $3185 | $3185 | 0.0001 | 0.0001 | 0.1142 |
| LOS, h | ||||||
| Bronchiolitis | 52 | 52 | 51 | 0.9112 | 0.1600 | 0.1728 |
| Asthma | 36 | 42 | 48 | 0.0158 | 0.3151 | 0.0001 |
| Pneumonia | 54 | 61 | 68 | 0.1136 | 0.1605 | 0.0001 |
| PNP | Resident | PNP/MD | PHIS Observation | PHIS SeverityIII | |
|---|---|---|---|---|---|
| |||||
| LOS, h | |||||
| Bronchiolitis | 52 | 52 | 51 | 43 | 70 |
| Asthma | 36 | 42 | 48 | 31 | 48 |
| Pneumonia | 54 | 61 | 68 | 46 | 64 |
Figure 1 illustrates the monthly patient census on the PNP and resident teams obtained from daily midnight census. There was a dramatic seasonal fluctuation in PNP team census, with a low census in July 2009 (22 patients) and high census in February 2010 (355 patients). The resident teams maintained a relatively stable census year round compared to the PNP team.
CONCLUSIONS/DISCUSSION
The results of this program evaluation suggest that the PNP team at CHCO provides inpatient care comparable to the resident teams at a lower cost per patient encounter for uncomplicated bronchiolitis, pneumonia, and asthma. The results of this program evaluation are consistent with previously published studies demonstrating that NPs improve outcomes such as decreased LOS and cost of care.[9]
In the setting of increasingly stringent restrictions in residency work hours, PNP hospitalists are a valuable resource for managing inpatient care. PNPs can provide additional benefits not explored in this program evaluation, such as increased access to care, increased patient and family satisfaction, improved documentation, and improved communication between nurses and physicians.[6] NP hospitalist providers can also decrease the patient care burden on housestaff, allowing teaching teams to focus on resident education.[6] This point could be made for the PNP team at CHCO, which contributed to care of inpatients during the peak respiratory season census. This strategy has allowed the resident teaching teams to maintain a more manageable patient census during the winter respiratory season, and presumably has allowed greater focus on resident education year round.[17]
Hospitals have been increasingly using evidence based CCGs as a strategy to improve patient outcomes and decrease LOS and cost.[18] CCGs provide an excellent tool for hospitalist physicians and APPs to deliver consistent inpatient care for common diagnoses such as bronchiolitis, asthma, and pneumonia. Increased reliance on CCGs has provided an opportunity to standardize evidence‐based practices and has allowed PNPs to expand their inpatient role at CHCO. The addition of a PNP inpatient team at CHCO also provided an effective strategy for management of seasonal fluctuations in inpatient census, particularly during the winter respiratory season.
Limitations
This is a single‐site program evaluation at a free standing children's hospital. Colorado law allows NPs to practice independently and obtain full prescriptive authority, although licensing and certification regulations for APPs vary from state to state. Our results may not be generalizable to other hospitals or to states where regulations differ. Patients admitted to the NOC sites and those assigned to the PNP team at the main campus are generally lower acuity and complexity compared to patients assigned to the resident teams at the main campus. Although we controlled for severity using the APR‐DRG severity classification, it is possible that our results were biased due to different patient profiles among the PNP and MD hospitalist teams. There were also potential limitations in the cost analysis, which included nursing in direct costs. Although nurse‐to‐patient ratios are comparable across hospitalist sites, the ratios may have varied due to fluctuations in patient census at each site. The CCG monitoring measures used in this evaluation also presented limitations. These measures were selected due to the availability of these data in the electronic medical record. Future studies may provide more clinically relevant information by including additional patient outcomes measures specifically related to inpatient medical management.
Despite the limitations in this program evaluation, we feel that these data add to the current knowledge in pediatrics by showing equipoise between these 2 groups. The PNP hospitalist role continues to evolve at CHCO, and the utility of this role must continue to be evaluated and reported.
Acknowledgements
Dashka Ranade provided Children's Hospital Colorado CCG comparison data for this program evaluation. David Bertoch provided LOS data from the Children's Hospital Association Pediatric Health Information System database.
Disclosures: Supported by NIH/NCATS Colorado CTSI grant number UL1 TR000154. The contents are the authors' sole responsibility and do not necessarily represent official NIH views.
- Education ACfGM. Common Program Requirements. Accreditation Council for Graduate Medical Education, 2011.
- , , , , , . Hospitalist services: an evolving opportunity. Nurse Pract. 2008;33(5):9–10.
- . APRN hospitalist: just a resident replacement? J Pediatr Health Care. 2004;18(4):208–210.
- , , , . Evaluation of the role of the pediatric nurse practitioner in an inpatient asthma program. J Pediatr Health Care. 2008;22(5):273–281.
- , . Acute care nurse practitioner as hospitalist: role description. AACN Adv Crit Care. 2009;20(2):133–136.
- , . Acute care nurse practitioners: creating and implementing a model of care for an inpatient general medical service. Am J Crit Care. 2002;11(5):448–458.
- , , , et al. Pediatric trauma nurse practitioners provide excellent care with superior patient satisfaction for injured children. J Pediatr Surg. 2006;41(1):277–281.
- , , , et al. Pediatric trauma nurse practitioners increase bedside nurses' satisfaction with pediatric trauma patient care. J Trauma Nurs. 2006;13(2):66–69.
- , , , et al. The effect of a multidisciplinary hospitalist/physician and advanced practice nurse collaboration on hospital costs. J Nurs Adm. 2006;36(2):79–85.
- , , , , . A closer look at all‐patient refined DRGs. J AHIMA. 2002;73(1):46–50.
- . Structure and performance of different DRG classification systems for neonatal medicine. Pediatrics. 1999;103(1 suppl E):302–318.
- Association CsH. Patient classification system, Children's Hospital Association. Available at: http://www.childrenshospitals.org/. Accessed January 4, 2014.
- . Children's Hospital Colorado bronchiolitis clinical care guideline, Bronchiolitis CCG Task Force 2011. Available at: http://www.childrenscolorado.org/conditions/lung/healthcare_professionals/clinical_care_guidelines.aspx. Accessed January 4, 2014.
- American Academy of Pediatrics Subcommittee on Diagnosis and Management of Bronchiolitis. Diagnosis and management of bronchiolitis. Pediatrics. 2006;118(4):1774–1793.
- .Children's Hospital Colorado asthma clinical care guideline, Asthma Task Force, 2011. Available at: http://www.childrenscolorado.org/conditions/lung/healthcare_professionals/clinical_care_guidelines.aspx. Accessed January 4, 2014.
- , , . Written action plans for asthma in children. Cochrane Database Syst Rev. 2006;(3):CD005306.
- , . Pediatric nurse practitioners as hospitalists. J Pediatr Health Care. 2010;24(5):347–350.
- , , . Health policy issues and applications for evidence‐based medicine and clinical practice guidelines. Health Policy. 1998;46(1):1–19.
Bridging the Inpatient–Outpatient Divide
There is consensus that the hospital is an appropriate place to start chronic medications for conditions that caused the hospitalization (e.g., aspirin for a patient admitted with acute myocardial infarction). However, little is known about physician attitudes toward starting chronic medications for conditions unrelated to the reason for hospitalization (e.g., aspirin in a patient with a history of myocardial infarction admitted for cellulitis). Although hospitalists can identify and remedy potential gaps in the management of chronic conditions, changes in such medications during the hospital stay can create a number of problems. Contextual factors, such as prior medication trials, patient preferences, and longstanding patterns of disease management, may be unknown to the inpatient clinician, and medication confusion, nonadherence, and adverse effects can result from multiple medication changes.[1, 2] The lack of consensus about changing chronic medications for conditions unrelated to the reason for admission reflects a lack of clarity regarding the risk‐benefit equation in this area.
The study by Breu and colleagues[3] in this issue provides one of the first studies of hospitalist and primary care physician (PCP) attitudes about changing chronic medications during hospitalization for conditions unrelated to the reason for admission. The authors had hospitalists and PCPs consider six cases, half involving a medication change related to the reason for admission and half involving a medication change unrelated to the reason for admission. They found that PCPs were more likely than hospitalists to feel that inpatient interventions were appropriate when unrelated to the reason for admission. However, the majority of both hospitalists and PCPs did not feel interventions in these cases were appropriate.
Although this study provides useful insight into the attitudes of physicians toward these issues, it is likely that even more physicians would be skeptical of initiating chronic medications in the hospital if the scenarios reflected the messy reality that often faces clinicians when patients are hospitalized. The study asked physician respondents to assume full outpatient electronic medical record (EMR) access and communication at discharge. However, in practice, inpatient physicians often do not have full outpatient EMR access. If they do have full access to records, they typically do not have the time to thoroughly review the chart, leading to over half of internal medicine patients having at least one medication discrepancy at admission.[4] In addition, communication between hospitalists and PCPs occurs infrequently, and discharge summaries are often not available by the time of the first postdischarge clinic visit and lack important information, such as diagnostic test results and discharge medications.[2]
We believe that in most clinical settings, the serious problems that accompany changing medications in hospitalized patients argue for a judicious approach to modifying medications for chronic conditions not related to the reason for hospitalization. However, the more important question is how the prescribing process in hospitalized patients can be re‐envisioned in a manner that allows individualization of these decisions to serve both the short‐ and long‐term needs of patients. Because the success and appropriateness of long‐term treatment decisions often depends on contextual factors, PCP follow‐up, and patient medication compliance, in most cases decisions about initiating long‐term therapy for conditions not central to the hospital admission should involve each of these circumstances. Shared decision making models involve clinicians and patients sharing information, expressing treatment preferences, deliberating the options, and coming to an agreement on a treatment plan,[5] and these models have been associated with improved adherence and disease‐specific outcomes.[6] Shared decision making in many cases could be done quickly and efficiently through a quick check‐in with the PCP and a brief discussion with the patient. When consensus cannot be reached with these methods, then raising the issue with the PCP and patient but deferring the final decision until after discharge would be appropriate.
In hospitalized patients, less is often more, and minimizing the number of nonessential medication changes may ultimately yield better outcomes. Although inpatient clinicians can identify important gaps in care, the best solutions come from discussions that can bridge the inpatient‐outpatient divide and ultimately serve the long‐term needs of patients.
Disclosures
The authors are supported by the National Institutes of Health and the American Federation for Aging Research (1K23‐AG030999) and the Department of Veterans Affairs Quality Scholars Program.
- , , , , . Adverse drug events occurring following hospital discharge. J Gen Intern Med. 2005;20:317–323.
- , , , . Promoting effective transitions of care at hospital discharge: a review of key issues for hospitalists. J Hospital Med. 2007;2:314–323.
- , , , , . Hospitalist and primary care physician perspectives on medication management of chronic conditions for hospitalized patients. J Hosp Med. 2014;9(5):303–309.
- , , , , , . Inpatient medication reconciliation at admission and discharge: a retrospective cohort study of age and other risk factors for medication discrepancies. Am J Geriatr Pharmacother. 2010;8:115–126.
- , , , , . Doctor‐patient communication about drugs: the evidence for shared decision making. Soc Sci Med. 2000;50:829–840.
- , , , et al. Shared treatment decision making improves adherence and outcomes in poorly controlled asthma. Am J Respir Crit Care Med. 2010;181:566–577.
There is consensus that the hospital is an appropriate place to start chronic medications for conditions that caused the hospitalization (e.g., aspirin for a patient admitted with acute myocardial infarction). However, little is known about physician attitudes toward starting chronic medications for conditions unrelated to the reason for hospitalization (e.g., aspirin in a patient with a history of myocardial infarction admitted for cellulitis). Although hospitalists can identify and remedy potential gaps in the management of chronic conditions, changes in such medications during the hospital stay can create a number of problems. Contextual factors, such as prior medication trials, patient preferences, and longstanding patterns of disease management, may be unknown to the inpatient clinician, and medication confusion, nonadherence, and adverse effects can result from multiple medication changes.[1, 2] The lack of consensus about changing chronic medications for conditions unrelated to the reason for admission reflects a lack of clarity regarding the risk‐benefit equation in this area.
The study by Breu and colleagues[3] in this issue provides one of the first studies of hospitalist and primary care physician (PCP) attitudes about changing chronic medications during hospitalization for conditions unrelated to the reason for admission. The authors had hospitalists and PCPs consider six cases, half involving a medication change related to the reason for admission and half involving a medication change unrelated to the reason for admission. They found that PCPs were more likely than hospitalists to feel that inpatient interventions were appropriate when unrelated to the reason for admission. However, the majority of both hospitalists and PCPs did not feel interventions in these cases were appropriate.
Although this study provides useful insight into the attitudes of physicians toward these issues, it is likely that even more physicians would be skeptical of initiating chronic medications in the hospital if the scenarios reflected the messy reality that often faces clinicians when patients are hospitalized. The study asked physician respondents to assume full outpatient electronic medical record (EMR) access and communication at discharge. However, in practice, inpatient physicians often do not have full outpatient EMR access. If they do have full access to records, they typically do not have the time to thoroughly review the chart, leading to over half of internal medicine patients having at least one medication discrepancy at admission.[4] In addition, communication between hospitalists and PCPs occurs infrequently, and discharge summaries are often not available by the time of the first postdischarge clinic visit and lack important information, such as diagnostic test results and discharge medications.[2]
We believe that in most clinical settings, the serious problems that accompany changing medications in hospitalized patients argue for a judicious approach to modifying medications for chronic conditions not related to the reason for hospitalization. However, the more important question is how the prescribing process in hospitalized patients can be re‐envisioned in a manner that allows individualization of these decisions to serve both the short‐ and long‐term needs of patients. Because the success and appropriateness of long‐term treatment decisions often depends on contextual factors, PCP follow‐up, and patient medication compliance, in most cases decisions about initiating long‐term therapy for conditions not central to the hospital admission should involve each of these circumstances. Shared decision making models involve clinicians and patients sharing information, expressing treatment preferences, deliberating the options, and coming to an agreement on a treatment plan,[5] and these models have been associated with improved adherence and disease‐specific outcomes.[6] Shared decision making in many cases could be done quickly and efficiently through a quick check‐in with the PCP and a brief discussion with the patient. When consensus cannot be reached with these methods, then raising the issue with the PCP and patient but deferring the final decision until after discharge would be appropriate.
In hospitalized patients, less is often more, and minimizing the number of nonessential medication changes may ultimately yield better outcomes. Although inpatient clinicians can identify important gaps in care, the best solutions come from discussions that can bridge the inpatient‐outpatient divide and ultimately serve the long‐term needs of patients.
Disclosures
The authors are supported by the National Institutes of Health and the American Federation for Aging Research (1K23‐AG030999) and the Department of Veterans Affairs Quality Scholars Program.
- , , , , . Adverse drug events occurring following hospital discharge. J Gen Intern Med. 2005;20:317–323.
- , , , . Promoting effective transitions of care at hospital discharge: a review of key issues for hospitalists. J Hospital Med. 2007;2:314–323.
- , , , , . Hospitalist and primary care physician perspectives on medication management of chronic conditions for hospitalized patients. J Hosp Med. 2014;9(5):303–309.
- , , , , , . Inpatient medication reconciliation at admission and discharge: a retrospective cohort study of age and other risk factors for medication discrepancies. Am J Geriatr Pharmacother. 2010;8:115–126.
- , , , , . Doctor‐patient communication about drugs: the evidence for shared decision making. Soc Sci Med. 2000;50:829–840.
- , , , et al. Shared treatment decision making improves adherence and outcomes in poorly controlled asthma. Am J Respir Crit Care Med. 2010;181:566–577.
Management of Chronic Conditions
Over the past 2 decades, the care of the hospitalized patient has changed dramatically. Hospitalists now account for the care of more than one‐third of general medicine inpatients, and this number is likely to grow.[1] The emergence of hospital medicine has resulted in a partnership between primary care physicians (PCPs) and hospitalists wherein hospitalists focus on acute medical issues requiring hospitalization, whereas more chronic issues unrelated to the reason for hospitalization remain largely the domain of the PCP.[2, 3]
However, several evolving financial and quality incentives have already begun to blur the distinction between inpatient and outpatient care. First, as private and public payers increasingly scrutinize readmission rates, it has become clear that the responsibility for patient outcomes extends beyond the day of discharge.[4] The birth of Accountable Care Organizations and patient‐centered medical homes may further blur distinctions between what has traditionally constituted inpatient and outpatient care.[5] Bundled payments may force providers to ensure that each visit, whether hospital‐ or clinic‐based, is taken as an opportunity to enact meaningful change.[6] The Centers for Medicare and Medicaid Services (CMS) are already tracking hospital performance on institution of medical therapy for certain conditions regardless of their relatedness to the reason for hospitalization.[7]
No published literature has yet examined the attitudes of inpatient and outpatient providers regarding this issue. Through a case‐based survey conducted at 3 large urban academic medical centers, we aimed to assess opinions among hospitalists and PCPs regarding the role of hospitalists in the management of conditions unrelated to the reason for admission. Our study had 2 main objectives: (1) to determine whether surveyed physicians were more likely to rate an inpatient intervention as appropriate when it related to the reason for admission as compared to interventions unrelated to the reason for admission; and (2) to determine whether these attitudes differed between PCPs and hospitalists.
METHODS
Setting and Subjects
We surveyed hospitalists and hospital‐based PCPs at Beth Israel Deaconess Medical Center (BIDMC), Brigham and Women's Hospital, and Massachusetts General Hospital, 3 large academic medical centers in Boston, Massachusetts. Each hospitalist group includes both teaching and nonteaching services and admits patients from both the surveyed hospital‐based PCP groups and other nonhospital‐based PCP groups. All 3 study sites use electronic medical records with patient information for each hospital‐based PCP available to treating hospitalists.
Survey Design
Using a commercially available online product (SurveyMonkey, Palo Alto, CA), we created a 3‐part case‐based survey instrument. The first section included demographic questions regarding age, sex, primary clinical role (hospitalist or PCP), prior experience as a PCP (for hospitalists only) or a hospitalist (for PCPs only; defined as a position with >30% of clinical time as the attending of record in the inpatient setting), years of clinical experience, and hospital affiliation.
The second section aimed to indirectly assess physician opinions on the appropriateness of inpatient management of conditions unrelated to the reason for admission. It consisted of 6 paired case scenarios, each with an inpatient management decision for a hypothetical hospitalist (Table 1). For each pair, 1 case dealt with management of the condition prompting admission (eg, starting aspirin in a patient admitted with acute nonST‐elevation myocardial infarction). The partner case involved the same intervention (eg, starting aspirin) but for a patient with a chronic condition (eg, history of prior myocardial infarction) and an alternate admitting diagnosis (eg, cellulitis). In an attempt to mitigate concerns regarding the flow of information and communication between providers, the survey asked respondents to assume that the hospitalist has access to the patient's outpatient electronic medical record, and that the hospitalist communicates the details of any hospitalizations at the time of discharge. For each case, the physician was asked to rate the appropriateness of enacting the intervention without discussing it with the PCP on a 5‐point scale from very inappropriate to very appropriate. When a physician answered that an intervention was inappropriate or very inappropriate, an additional question soliciting reasons for inappropriateness was included, with multiple predefined answer choices, as well as the option of a free‐text reply under the other designation.
| |
| Starting aspirin (related to the reason for admission) | A 60‐year‐old patient is admitted with a nonST‐elevation MI, medically managed without cardiac catheterization or percutaneous coronary intervention. Knowing that aspirin reduces mortality as part of secondary prevention in cardiovascular disease, how appropriate is it for the hospitalist to start the patient on this medication without discussing it with the primary care physician? |
| Starting aspirin (unrelated to the reason for admission) | A 60‐year‐old patient with a past medical history of a prior nonST‐elevation MI that was medically managed is admitted to the hospital for treatment of cellulitis. The hospitalist notes the patient is not on aspirin at home. Knowing that aspirin reduces mortality as part of secondary prevention in cardiovascular disease, how appropriate is it for the hospitalist to start the patient on this medication without discussing it with the primary care physician? |
| Starting spironolactone (related to the reason for admission) | A 70‐year‐old patient with a past medical history significant for NYHA class II congestive heart failure (LVEF of 20%) is admitted for acute on chronic, left‐sided systolic congestive heart failure. The patient has been maintained on furosemide, metoprolol, and lisinopril. Admission serum potassium and creatinine are both normal. Knowing that spironolactone decreases mortality in heart failure, how appropriate is it for the hospitalist to start this medication without discussing it with the primary care physician? |
| Starting spironolactone (unrelated to the reason for admission) | A 70‐year‐old patient with a past history of NYHA class II congestive heart failure (LVEF of 20%) on furosemide, metoprolol, and lisinopril is admitted with pneumonia. Serum potassium and creatinine are both normal. Knowing that spironolactone decreases mortality in heart failure, how appropriate is it for the hospitalist to start this medication without discussing it with the primary care physician? |
| Starting warfarin (related to the reason for admission) | A 75‐year‐old patient with a past medical history of hypertension and diabetes is admitted with new atrial fibrillation. Given the patient's CHADS2 score of 3, the hospitalist calculates that the patient has a significant risk of thromboembolic stroke. Knowing that warfarin will decrease the risk of thromboembolic stroke, how appropriate is it for the hospitalist to start the patient on this medication without discussing it with the primary care physician (assume that an outpatient anticoagulation clinic is able to see the patient within 3 days of discharge)? |
| Starting warfarin (unrelated to the reason for admission) | A 75‐year‐old patient with a past medical history of hypertension, diabetes, and atrial fibrillation is admitted with pneumonia. The patient is not anticoagulation therapy. Given the patient's CHADS2 score of 3, the hospitalist calculates that the patient has a significant risk of thromboembolic stroke. Knowing that warfarin will decrease the risk of thromboembolic stroke, how appropriate is it for the hospitalist to start the patient on this medication without discussing it with the primary care physician (assume that an outpatient anticoagulation clinic is able to see the patient within 3 days of discharge)? |
| Stopping proton pump inhibitor (related to the reason for admission) | A 65‐year‐old patient with a past medical history of GERD maintained on a proton pump inhibitor is admitted for treatment of Clostridium difficile colitis. The patient denies having any GERD‐like symptoms for several years. Knowing that proton pump inhibitors can increase the risk of C difficile colitis and recurrence (as well as pneumonia and osteoporosis), how appropriate is it for the hospitalist to initiate a taper of this medication without discussing it with the primary care physician? |
| Stopping proton pump inhibitor (unrelated to the reason for admission) | A 65‐year‐old patient with a past medical history of GERD maintained on a proton pump inhibitor is admitted for treatment of a urinary tract infection. The patient denies having any GERD‐like symptoms for several years. Knowing that proton pump inhibitors can increase the risk of C difficile colitis and recurrence (as well as pneumonia and osteoporosis), how appropriate is it for the hospitalist to initiate a taper of this medication without discussing it with the primary care physician? |
| Stopping statin or fibrate (related to the reason for admission) | A 60‐year‐old patient with a history of hyperlipidemia is admitted with an elevated creatine kinase to 5000. The hospitalist notes that the patient is on both simvastatin and gemfibrozil. The patient's most recent serum LDL was at goal. Knowing that coadministration of simvastatin and gemfibrozil can increase the risk of rhabdomyolysis, how appropriate is it for the hospitalist to stop one of these medications without discussing it with the primary care physician? |
| Stopping statin or fibrate (unrelated to the reason for admission) | A 60‐year‐old patient is admitted with an acute diarrheal illness. The hospitalist notes that the patient is on both simvastatin and gemfibrozil. The patient's most recent LDL was at goal. Knowing that coadministration of simvastatin and gemfibrozil can increase the risk of rhabdomyolysis, how appropriate is it for the hospitalist to stop one of these medications without discussing it with the primary care physician? |
| Changing statin (related to the reason for admission) | A 65‐year‐old patient with a past medical history of hyperlipidemia on maximum‐dose simvastatin is admitted with a nonST‐elevation MI. The patient's cholesterol is noted to be above goal. Knowing that improving lipid management reduces mortality in cardiovascular disease, how appropriate is it for the hospitalist to replace simvastatin with atorvastatin without discussing it with the primary care physician? |
| Changing statin (unrelated to the reason for admission) | A 65‐year‐old patient with a past medical history of a prior nonST‐elevation MI that was medically managed and hyperlipidemia on maximum‐dose simvastatin is admitted with pneumonia. Incidentally, the hospitalist notes that the patient's cholesterol has been above goal for the last 2 years. Knowing that improving lipid management reduces mortality in cardiovascular disease, how appropriate is it for the hospitalist to replace simvastatin with atorvastatin without discussing it with the primary care physician? |
The third section aimed to directly assess physicians' opinions. It consisted of questions regarding the appropriateness of inpatient management of conditions related to and unrelated to a patient's reason for admission.
Prior to administration, we conducted focus groups of hospitalists and PCPs to help hypothesize current physician perceptions on inpatient management, assess physician understanding of survey cases and questions, and to evaluate survey length.
Survey Administration
Between October 23, 2012 and November 10, 2012, 3 emails containing a link to the online survey were sent to all hospitalist and hospital‐based PCPs at the 3 study institutions. The BIDMC Committee on Clinical Investigations, to whom authority was ceded by the remaining 2 study institutions, certified this research protocol as exempt.
Statistical Analysis
We hypothesized that respondents as a whole would be more likely to rate an intervention as appropriate or very appropriate if it was related to the reason for admission, compared to unrelated, and that there would be no difference between PCPs and hospitalists.
We used 2 and Fisher exact tests (where applicable) to compare categorical variables, and a nonparametric median test for continuous variables. We used the Fisher exact test to compare the percent of respondents rating each intervention as appropriate or very appropriate by relatedness or unrelatedness to the reason for admission, and by PCP vs hospitalist. To derive the relative risk (RR) of rating each intervention as appropriate or very appropriate by PCPs compared to hospitalists, adjusting for potential confounders including years out of residency and sex, we used multivariable generalized estimating equation models, each with a Poisson distribution error term, a log link, and an exchangeable working correlation structure to account for dependency of observations arising from clustering at either the hospital or participant level, depending on the comparison: for comparisons within a given case, we controlled for clustering at the hospital level; for comparisons of cases in aggregate, owing to multiple responses from each participant, we controlled for clustering at the individual level.
Assuming a 50% response rate from both PCPs and hospitalists, and that 50% of PCPs would rate a given intervention as appropriate, we calculated that we would have 90% power to detect a 50% increase in the proportion of hospitalists rating an intervention as appropriate as compared to PCPs, using an of .05.
RESULTS
Demographics
One hundred sixty‐two out of 295 providers (55%) responded to the survey (Table 2). The response rate did not differ between hospitalists (70 out of 128; 55%) and PCPs (92 out of 167; 55%). Female respondents made up 58.7% of the PCP and 50.0% of the hospitalist groups (P=0.34). On average, PCPs were older (P<0.001) with a greater median number of years since graduation from residency (P<0.001). A greater percentage of hospitalists spent more than three‐quarters of their time clinically (42.9% vs 19.6%, P=0.009).
| Total, n=162 (100.0%) | PCP, n=92 (6.8%) | Hospitalist, n=70 (43.2%) | P Valuea | |
|---|---|---|---|---|
| ||||
| Hospital, n (%) | ||||
| BIDMC | 79 (48.8) | 48 (60.8) | 31 (39.2) | 0.115 |
| BWH | 36 (22.2) | 15 (41.7) | 21 (58.3) | |
| MGH | 47 (29.0) | 29 (61.7) | 18 (38.3) | |
| Sex, n (%) | ||||
| Male | 73 (45.1) | 38 (41.3) | 35 (50.0) | 0.339 |
| Female | 89 (54.9) | 54 (58.7) | 35 (50.0) | |
| Age interval, y, n (%) | ||||
| 2534 | 36 (22.2) | 9 (9.8) | 27 (38.6) | <0.001 |
| 3544 | 67 (41.4) | 34 (37.0) | 33 (47.1) | |
| 4554 | 35 (21.6) | 29 (31.5) | 6 (8.6) | |
| 5564 | 19 (11.7) | 16 (17.4) | 3 (4.3) | |
| 6574 | 5 (3.1) | 4 (4.4) | 1 (1.4) | |
| Years out of residency, median (IQR) | 10 (417) | 15 (74) | 5 (211) | <0.001 |
| Clinical FTE, n (%) | ||||
| 0.25 | 30 (18.6) | 22 (23.9) | 8 (11.4) | 0.009 |
| 0.260.50 | 41 (25.3) | 25 (27.2) | 16 (22.9) | |
| 0.510.75 | 43 (26.5) | 27 (29.4) | 16 (22.9) | |
| >0.75 | 48 (29.6) | 18 (19.6) | 30 (42.9) | |
| Worked as PCP?b | ||||
| Yes | 6 (8.6) | |||
| No | 64 (91.4) | |||
| Worked as hospitalist? | ||||
| Yes | 11 (12.0) | |||
| No | 81 (88.0) | |||
| AOR for admitted patients | ||||
| Always | 16 (17.4) | |||
| Mostly | 8 (8.7) | |||
| Rarely | 7 (7.6) | |||
| Never | 60 (65.2) | |||
Appropriateness of Inpatient Management Based on Admitting Diagnosis
For each of the 6 case pairings individually and in aggregate, respondents were significantly more likely to deem the intervention appropriate or very appropriate if it was related to the reason for admission, compared to those interventions unrelated to the reason for admission (in aggregate, 78.9% vs 38.8% respectively, P<0.001). For example, whereas 96.9% felt that the addition of aspirin in a patient admitted with acute myocardial infarction (MI) was appropriate, only 54.3% felt it appropriate to start aspirin in a patient with a prior history of MI admitted with cellulitis (P<0.001). Significant differences (all P values <0.001) were seen for all case pairs: starting spironolactone (68.1% when related to the reason for reason for admission vs 43.1% when unrelated to reason for admission); starting warfarin (62.3% vs 23.3%), stopping proton pump inhibitor (72.3% vs 42.8%), stopping statin or fibrate (90.6% vs 28.3%), and changing statin (83.0% vs 40.5%).
Appropriateness of Inpatient Management based on Primary Role
Table 3 compares the percent of PCPs and hospitalists rating each intervention as appropriate or very appropriate, by relatedness of the intervention to the reason for admission. In both unadjusted and adjusted comparisons for all cases in aggregate, PCPs were significantly more likely than hospitalists to rate the inpatient interventions as appropriate or very appropriate when the intervention was related to the reason for admission (83.4% of PCP responses vs 73.0% of hospitalist responses, P<0.001; RR: 1.2, 95% confidence interval [CI]: 1.11.3), unrelated to the reason for admission (44.7% vs 31.1%, P<0.001; RR: 1.5, 95% CI: 1.11.9), and overall (64.1% vs 52.1%, P<0.001; RR: 1.3, 95% CI: 1.11.4).
| Relationship to Admission Diagnosis | PCP, n (%) | Hospitalist, n (%) | P Value | Adjusted RR | 95% CI |
|---|---|---|---|---|---|
| |||||
| Related | 453 (83.4) | 303 (73.0) | <0.001 | 1.2a | 1.11.3 |
| Unrelated | 242 (44.7) | 129 (31.1) | <0.001 | 1.5a | 1.11.9 |
| Overall | 695 (64.1) | 432 (52.1) | <0.001 | 1.3b | 1.11.4 |
Reasons for Inappropriate Designation
Among those respondents rating an intervention as inappropriate or very inappropriate, the 3 most common reasons selected as explanation for perceived inappropriateness from our predefined answer choices were: This medication will necessitate follow‐up testing/monitoring, for which the PCP will be responsible (chosen by physicians in 49.4% of instances); I am not confident that the hospitalist will have access to all of the medical history necessary to make this decision (35.7%); and Even if the hospitalist has all of the medical history and reviews it, the PCP should be involved in all decisions surrounding new medications (34.6%). The least common explanation chosen was I do not believe this is an appropriate pharmacologic intervention for this particular medical problem (6.5%). See Table 4 for a complete list of explanations, overall and stratified by PCP/hospitalist.
| Predefined Reason for Inappropriateness | Total, n=583 (%) | PCP, n=318 (%) | Hospitalist, n=265 (%) | P Value |
|---|---|---|---|---|
| ||||
| This medication will necessitate follow‐up testing/monitoring, for which the PCP will be responsible. | 288 (49.4) | 151 (47.5) | 137 (51.7) | 0.32 |
| I am not confident that the hospitalist will have access to all of the medical history necessary to make this decision. | 208 (35.7) | 98 (30.8) | 110 (41.5) | 0.009 |
| Even if the hospitalist has all of the medical history and reviews it, the PCP should be involved in all decisions surrounding new medications. | 201 (34.5) | 125 (39.3) | 76 (28.7) | 0.009 |
| I am not confident that the hospitalist will adequately review the medical history necessary to make this decision. | 184 (31.6) | 130 (40.9) | 54 (20.4) | <0.001 |
| Even if the hospitalist has all of the medical history, I do not believe hospitalization is the right time to start this new medication | 106 (21.4) | 69 (21.7) | 56 (21.1) | 0.92 |
| I am not confident that the hospitalist will appropriately discuss the risks and benefits of this new medication with the patient. | 106 (18.2) | 85 (26.7) | 21 (7.9) | <0.001 |
| The benefit of this medication will be too remote to justify starting it in the acute setting. | 66 (11.3) | 40 (12.6) | 26 (9.8) | 0.36 |
| I do not believe this is an appropriate pharmacologic intervention for this particular medical problem. | 38 (6.5) | 27 (8.5) | 11 (4.2) | 0.04 |
There were significant differences in the proportion of PCPs and hospitalists choosing several of the prespecified reasons for inappropriateness. Although hospitalists were more likely than PCPs to select I am not confident that the hospitalist will have access to all of the medical history necessary to make this decision (chosen by 41.5% of hospitalists vs 30.8% of PCPs, P=0.009), PCPs were more likely than hospitalists to select, I am not confident that the hospitalist will adequately review the medical history necessary to make this decision (chosen by 40.9% of PCPs vs 20.4% of hospitalists, P<0.001) and I am not confident that the hospitalist will appropriately discuss the risks and benefits of this new medication with the patient (26.7% of PCPs vs 9.8% of hospitalists, P<0.001).
Opinions on Current Management of Conditions Related and Unrelated to Admission
A minority of PCPs and hospitalists agreed or strongly agreed that hospitalists should play a larger role in the management of medical conditions unrelated to the reason for admission (28.1% of PCPs vs 34.8% of hospitalists; P=0.39).
DISCUSSION
In this survey‐based study of PCPs and hospitalists across 3 Boston‐area academic medical centers, we found that: (1) physicians were more likely to see inpatient interventions as appropriate when those interventions dealt with the reason for admission as compared to interventions unrelated to the reason for admission; and (2) PCPs were more likely than hospitalists to feel that inpatient interventions were appropriate, even when they targeted chronic conditions unrelated to the reason for admission. To our knowledge, this study represents the first investigation into the attitudes of PCPs and hospitalists regarding the inpatient management of conditions unrelated to the reason for admission.
That surveyed physicians, regardless of role, were less likely to report an intervention unrelated to the reason for hospitalization as appropriateeven those with likely mortality benefitsuggests that opportunities to affect meaningful change may be missed in a healthcare system that adheres to strict inpatient and outpatient roles. For several of the cases, a change in therapy could lead to benefit soon after implementation. For example, aldosterone antagonists reduce mortality as early as 1 month after initiation in select patients.[8] If a major goal of inpatient care is to reduce 30‐day mortality, it could be argued that hospitalists should more actively adjust congestive heart failure therapy in appropriate inpatients, even when this is not their admitting diagnosis.
For some conditions, CMS is already tracking hospital performance. Since 2003, hospitals have been required to document whether a patient with congestive heart failure (either acute or chronic and regardless of the relationship to admission) was prescribed an angiotensin‐converting enzyme (ACE) inhibitor or angiotensin receptor blocker (ARB) at the time of discharge.[7] CMS has determined that the proven benefits of ACE inhibitors and ARBs confer hospital accountability for their inclusion in appropriate patients, independent of the acuity of heart failure. There are many potential therapeutic maneuvers on which health systems (and their physicians) may be graded, and accepting the view that a hospitalization provides a window of opportunity for medical optimization may allow for more fruitful interventions and more patient‐centered care.
Despite the potential benefits of addressing chronic medical issues during hospitalization, there are important limitations on what can and/or should be done in the hospital setting. Hospitalizations are a time of fluctuating clinical status, which continues beyond discharge and is often accompanied by several medication changes.[9] In our study, more than 20% of those who believed that a medication intervention was inappropriate selected I do not believe hospitalization is the right time to start this new medication as one of their explanations. Although some medication interventions have been shown in randomized controlled trials to reduce short‐term mortality, the ability to generalize these findings to the average hospitalized patient with multiple comorbidities, concurrent medication changes, and rapidly fluctuating clinical status is limited. Furthermore, there are interventions most would agree should not be dealt with in the hospital (eg, screening colonoscopy) and encounters that may be too short to allow for change (eg, 24‐hour observation). These issues notwithstanding, the average 4‐day hospitalization likely provides an opportunity for monitored change that may currently be underutilized.
Our study suggests several additional explanations for physicians' current practice and opinions. Only 6.5% of respondents who answered that an intervention was inappropriate indicated as a justification that I do not believe this is an appropriate pharmacologic intervention for this particular medical problem. This suggests that the hesitancy has little to do with a lack of benefit but instead relates to systems issues (eg, access to all pertinent records and concerns regarding follow‐up testing) and perceived limitations to what a hospitalist should and should not do without actively involving the PCP. There are likely additional concerns that the medical record and/or patient histories do not fully outline the rationale for exclusion or inclusion of particular medications. Advances in information technology that enhance information exchange and enable streamlined communication may help to address these perceived barriers. However, an additional barrier may be trust, as PCPs appear more concerned that hospitalists will not review all the pertinent records or discuss risks and benefits before enacting important medication changes. Increased attempts at communication between hospitalists and outpatient providers may help to build trust and alleviate concerns regarding the loss of information that often occurs both on admission and at discharge.
We also noted that PCPs were more likely than hospitalists to feel that inpatient interventions were appropriate, even when targeting chronic conditions unrelated to the reason for admission. It may be that PCPs, with an increasing number of problems to address per outpatient visit,[10, 11] are more open to hospitalists managing any medical problems during their patients' admissions. At the same time, with increased acuity[12, 13, 14] and shortened length of stays,[15, 16] hospitalists have only a finite amount of time to ensure acute issues are managed, leaving potentially modifiable chronic conditions to the outpatient setting. These differences aside, a minority of both PCPs and hospitalists in our study were ready to embrace the idea of hospitalists playing a larger role in the management of conditions unrelated to the reason for hospitalization.
Even though our study benefits from its multisite design, there are a number of limitations. First, although we crafted our survey with input from general medicine focus groups, our survey instrument has not been validated. In addition, the cases are necessarily contrived and do not take into account the complexities of inpatient medicine. Furthermore, though our goal was to create paired cases that isolate a management decision as being simply based on whether it was related or unrelated to the reason for admission, it is possible that other factors, not captured by our survey, influenced the responses. For example, the benefits of aspirin as part of secondary prevention are not equal to the benefits in an acute MI.[17]
In an attempt to isolate the hospitalists' role in these management decisions, respondents were instructed to assume that the decisions were being made without discussing it with the primary care physician, but that the hospitalist would communicate the details of any hospitalization at the time of discharge. They were also instructed to assume that the hospitalist has access to the patient's outpatient electronic medical record. These assumptions were made to address concerns regarding the flow of information and communication, and to simulate the ideal system from a communication and information accessibility standpoint. Had these assumptions not been placed, the responses may have differed. It is likely that PCPs and hospitalists practicing in systems without shared, accessible inpatient/outpatient medical records would be even more reluctant to enact medication changes unrelated to the reason for admission.
Along the same lines, our physician cohort consisted of several metropolitan academic physician groups, in which hospitalists have had a presence for almost 20 years. As a result, our findings may not be generalizable to other academic hospitals, community‐based hospitalist programs, or nonhospital‐based PCP practices. Finally, we do not know whether survey nonresponders differed from responders in ways that could have meaningfully affected our results.
In conclusion, our findings suggest that both PCPs and hospitalists see the management of conditions unrelated to the reason for admission as less appropriate than the management of conditions related to the reason for admission. Our findings also suggest that PCPs may be more open to this practice when compared to hospitalists. Failure to capitalize on opportunities for meaningful medical interventions, independent of patient location, suggests a possible lack of patient centeredness in the current partnership between PCPs and hospitalists. Further studies should examine existing barriers and investigate interventions designed to address those barriers, in an effort to improve both quality of care and the degree of patient‐centeredness in our current healthcare system.
Disclosures: Dr. Herzig is supported by a grant from the National Institute on Aging (K23 AG042459). Dr. Herzig had full access to all of the data in the study and takes responsibility for the integrity of the data and the accuracy of the data analysis. Author contributions: study concept and design, Breu, Allen‐Dicker, Mueller, Herzig; acquisition of data, Breu, Allen‐Dicker, Mueller, Palamara, Herzig; analysis and interpretation of data, Breu, Allen‐Dicker, Hinami, Herzig; drafting of the manuscript, Breu; critical revision of the manuscript for important intellectual content, Breu, Allen‐Dicker, Mueller, Palamara, Hinami, Herzig; statistical analysis, Allen‐Dicker, Hinami, Herzig; study supervision, Breu, Herzig. This study was presented as a poster at the Society of Hospital Medicine National Meeting, Washington, DC, May 17, 2013.
- , , , . Growth in the care of older patients by hospitalists in the United States. N Engl J Med. 2009;360(11):1102–1112.
- , . The emerging role of “hospitalists” in the American health care system. N Engl J Med. 1996;335(7):514–517.
- . An introduction to the hospitalist model. Ann Intern Med. 1999;130(4 pt 2):338–342.
- , . Hospital readmission as an accountability measure. JAMA. 2011;305(5):504–505.
- , , , , . A national strategy to put accountable care into practice. Health Aff (Millwood). 2010;29(5):982–990.
- . Keeping score under a global payment system. N Engl J Med. 2012;366(5):393–395.
- Reporting Hospital Quality Data for Annual Payment Update. Available at: http://www.cms.gov/Medicare/Quality‐Initiatives‐Patient‐Assessment‐Instruments/HospitalQualityInits/Downloads/HospitalRHQDAPU200808. Accessed December 18, 2013.
- , , , et al. Eplerenone in patients with systolic heart failure and mild symptoms. N Engl J Med. 2011;364(1):11–21.
- , , , , , . How are drug regimen changes during hospitalisation handled after discharge: a cohort study. BMJ Open. 2012;2(6):e001461.
- , , . Primary care visit duration and quality: does good care take longer? Arch Intern Med. 2009;169(20):1866–1872.
- , , , The increasing number of clinical items addressed during the time of adult primary care visits. J Gen Intern Med. 2008;23(12):2058–2065.
- , , . Multiple chronic conditions among adults aged 45 and over: trends over the past 10 years. NCHS Data Brief. 2012;(100):1–8.
- , , . Prevalence of multiple chronic conditions in the United States' Medicare population. Health Qual Life Outcomes. 2009;7(1):82.
- , , , et al. Multiple chronic conditions: prevalence, health consequences, and implications for quality, care management, and costs. J Gen Intern Med. 2007;22(suppl 3):391–395.
- , , , et al. Associations between reduced hospital length of stay and 30‐day readmission rate and mortality: 14‐year experience in 129 Veterans Affairs hospitals. Ann Intern Med. 2012;157(12):837–845.
- , , , et al. Trends in length of stay and short‐term outcomes among Medicare patients hospitalized for heart failure, 1993–2006. JAMA. 2010;303(21):2141–2147.
- Antithrombotic Trialists' Collaboration. Collaborative meta‐analysis of randomised trials of antiplatelet therapy for prevention of death, myocardial infarction, and stroke in high risk patients. BMJ. 2002;324(7329):71–86.
Over the past 2 decades, the care of the hospitalized patient has changed dramatically. Hospitalists now account for the care of more than one‐third of general medicine inpatients, and this number is likely to grow.[1] The emergence of hospital medicine has resulted in a partnership between primary care physicians (PCPs) and hospitalists wherein hospitalists focus on acute medical issues requiring hospitalization, whereas more chronic issues unrelated to the reason for hospitalization remain largely the domain of the PCP.[2, 3]
However, several evolving financial and quality incentives have already begun to blur the distinction between inpatient and outpatient care. First, as private and public payers increasingly scrutinize readmission rates, it has become clear that the responsibility for patient outcomes extends beyond the day of discharge.[4] The birth of Accountable Care Organizations and patient‐centered medical homes may further blur distinctions between what has traditionally constituted inpatient and outpatient care.[5] Bundled payments may force providers to ensure that each visit, whether hospital‐ or clinic‐based, is taken as an opportunity to enact meaningful change.[6] The Centers for Medicare and Medicaid Services (CMS) are already tracking hospital performance on institution of medical therapy for certain conditions regardless of their relatedness to the reason for hospitalization.[7]
No published literature has yet examined the attitudes of inpatient and outpatient providers regarding this issue. Through a case‐based survey conducted at 3 large urban academic medical centers, we aimed to assess opinions among hospitalists and PCPs regarding the role of hospitalists in the management of conditions unrelated to the reason for admission. Our study had 2 main objectives: (1) to determine whether surveyed physicians were more likely to rate an inpatient intervention as appropriate when it related to the reason for admission as compared to interventions unrelated to the reason for admission; and (2) to determine whether these attitudes differed between PCPs and hospitalists.
METHODS
Setting and Subjects
We surveyed hospitalists and hospital‐based PCPs at Beth Israel Deaconess Medical Center (BIDMC), Brigham and Women's Hospital, and Massachusetts General Hospital, 3 large academic medical centers in Boston, Massachusetts. Each hospitalist group includes both teaching and nonteaching services and admits patients from both the surveyed hospital‐based PCP groups and other nonhospital‐based PCP groups. All 3 study sites use electronic medical records with patient information for each hospital‐based PCP available to treating hospitalists.
Survey Design
Using a commercially available online product (SurveyMonkey, Palo Alto, CA), we created a 3‐part case‐based survey instrument. The first section included demographic questions regarding age, sex, primary clinical role (hospitalist or PCP), prior experience as a PCP (for hospitalists only) or a hospitalist (for PCPs only; defined as a position with >30% of clinical time as the attending of record in the inpatient setting), years of clinical experience, and hospital affiliation.
The second section aimed to indirectly assess physician opinions on the appropriateness of inpatient management of conditions unrelated to the reason for admission. It consisted of 6 paired case scenarios, each with an inpatient management decision for a hypothetical hospitalist (Table 1). For each pair, 1 case dealt with management of the condition prompting admission (eg, starting aspirin in a patient admitted with acute nonST‐elevation myocardial infarction). The partner case involved the same intervention (eg, starting aspirin) but for a patient with a chronic condition (eg, history of prior myocardial infarction) and an alternate admitting diagnosis (eg, cellulitis). In an attempt to mitigate concerns regarding the flow of information and communication between providers, the survey asked respondents to assume that the hospitalist has access to the patient's outpatient electronic medical record, and that the hospitalist communicates the details of any hospitalizations at the time of discharge. For each case, the physician was asked to rate the appropriateness of enacting the intervention without discussing it with the PCP on a 5‐point scale from very inappropriate to very appropriate. When a physician answered that an intervention was inappropriate or very inappropriate, an additional question soliciting reasons for inappropriateness was included, with multiple predefined answer choices, as well as the option of a free‐text reply under the other designation.
| |
| Starting aspirin (related to the reason for admission) | A 60‐year‐old patient is admitted with a nonST‐elevation MI, medically managed without cardiac catheterization or percutaneous coronary intervention. Knowing that aspirin reduces mortality as part of secondary prevention in cardiovascular disease, how appropriate is it for the hospitalist to start the patient on this medication without discussing it with the primary care physician? |
| Starting aspirin (unrelated to the reason for admission) | A 60‐year‐old patient with a past medical history of a prior nonST‐elevation MI that was medically managed is admitted to the hospital for treatment of cellulitis. The hospitalist notes the patient is not on aspirin at home. Knowing that aspirin reduces mortality as part of secondary prevention in cardiovascular disease, how appropriate is it for the hospitalist to start the patient on this medication without discussing it with the primary care physician? |
| Starting spironolactone (related to the reason for admission) | A 70‐year‐old patient with a past medical history significant for NYHA class II congestive heart failure (LVEF of 20%) is admitted for acute on chronic, left‐sided systolic congestive heart failure. The patient has been maintained on furosemide, metoprolol, and lisinopril. Admission serum potassium and creatinine are both normal. Knowing that spironolactone decreases mortality in heart failure, how appropriate is it for the hospitalist to start this medication without discussing it with the primary care physician? |
| Starting spironolactone (unrelated to the reason for admission) | A 70‐year‐old patient with a past history of NYHA class II congestive heart failure (LVEF of 20%) on furosemide, metoprolol, and lisinopril is admitted with pneumonia. Serum potassium and creatinine are both normal. Knowing that spironolactone decreases mortality in heart failure, how appropriate is it for the hospitalist to start this medication without discussing it with the primary care physician? |
| Starting warfarin (related to the reason for admission) | A 75‐year‐old patient with a past medical history of hypertension and diabetes is admitted with new atrial fibrillation. Given the patient's CHADS2 score of 3, the hospitalist calculates that the patient has a significant risk of thromboembolic stroke. Knowing that warfarin will decrease the risk of thromboembolic stroke, how appropriate is it for the hospitalist to start the patient on this medication without discussing it with the primary care physician (assume that an outpatient anticoagulation clinic is able to see the patient within 3 days of discharge)? |
| Starting warfarin (unrelated to the reason for admission) | A 75‐year‐old patient with a past medical history of hypertension, diabetes, and atrial fibrillation is admitted with pneumonia. The patient is not anticoagulation therapy. Given the patient's CHADS2 score of 3, the hospitalist calculates that the patient has a significant risk of thromboembolic stroke. Knowing that warfarin will decrease the risk of thromboembolic stroke, how appropriate is it for the hospitalist to start the patient on this medication without discussing it with the primary care physician (assume that an outpatient anticoagulation clinic is able to see the patient within 3 days of discharge)? |
| Stopping proton pump inhibitor (related to the reason for admission) | A 65‐year‐old patient with a past medical history of GERD maintained on a proton pump inhibitor is admitted for treatment of Clostridium difficile colitis. The patient denies having any GERD‐like symptoms for several years. Knowing that proton pump inhibitors can increase the risk of C difficile colitis and recurrence (as well as pneumonia and osteoporosis), how appropriate is it for the hospitalist to initiate a taper of this medication without discussing it with the primary care physician? |
| Stopping proton pump inhibitor (unrelated to the reason for admission) | A 65‐year‐old patient with a past medical history of GERD maintained on a proton pump inhibitor is admitted for treatment of a urinary tract infection. The patient denies having any GERD‐like symptoms for several years. Knowing that proton pump inhibitors can increase the risk of C difficile colitis and recurrence (as well as pneumonia and osteoporosis), how appropriate is it for the hospitalist to initiate a taper of this medication without discussing it with the primary care physician? |
| Stopping statin or fibrate (related to the reason for admission) | A 60‐year‐old patient with a history of hyperlipidemia is admitted with an elevated creatine kinase to 5000. The hospitalist notes that the patient is on both simvastatin and gemfibrozil. The patient's most recent serum LDL was at goal. Knowing that coadministration of simvastatin and gemfibrozil can increase the risk of rhabdomyolysis, how appropriate is it for the hospitalist to stop one of these medications without discussing it with the primary care physician? |
| Stopping statin or fibrate (unrelated to the reason for admission) | A 60‐year‐old patient is admitted with an acute diarrheal illness. The hospitalist notes that the patient is on both simvastatin and gemfibrozil. The patient's most recent LDL was at goal. Knowing that coadministration of simvastatin and gemfibrozil can increase the risk of rhabdomyolysis, how appropriate is it for the hospitalist to stop one of these medications without discussing it with the primary care physician? |
| Changing statin (related to the reason for admission) | A 65‐year‐old patient with a past medical history of hyperlipidemia on maximum‐dose simvastatin is admitted with a nonST‐elevation MI. The patient's cholesterol is noted to be above goal. Knowing that improving lipid management reduces mortality in cardiovascular disease, how appropriate is it for the hospitalist to replace simvastatin with atorvastatin without discussing it with the primary care physician? |
| Changing statin (unrelated to the reason for admission) | A 65‐year‐old patient with a past medical history of a prior nonST‐elevation MI that was medically managed and hyperlipidemia on maximum‐dose simvastatin is admitted with pneumonia. Incidentally, the hospitalist notes that the patient's cholesterol has been above goal for the last 2 years. Knowing that improving lipid management reduces mortality in cardiovascular disease, how appropriate is it for the hospitalist to replace simvastatin with atorvastatin without discussing it with the primary care physician? |
The third section aimed to directly assess physicians' opinions. It consisted of questions regarding the appropriateness of inpatient management of conditions related to and unrelated to a patient's reason for admission.
Prior to administration, we conducted focus groups of hospitalists and PCPs to help hypothesize current physician perceptions on inpatient management, assess physician understanding of survey cases and questions, and to evaluate survey length.
Survey Administration
Between October 23, 2012 and November 10, 2012, 3 emails containing a link to the online survey were sent to all hospitalist and hospital‐based PCPs at the 3 study institutions. The BIDMC Committee on Clinical Investigations, to whom authority was ceded by the remaining 2 study institutions, certified this research protocol as exempt.
Statistical Analysis
We hypothesized that respondents as a whole would be more likely to rate an intervention as appropriate or very appropriate if it was related to the reason for admission, compared to unrelated, and that there would be no difference between PCPs and hospitalists.
We used 2 and Fisher exact tests (where applicable) to compare categorical variables, and a nonparametric median test for continuous variables. We used the Fisher exact test to compare the percent of respondents rating each intervention as appropriate or very appropriate by relatedness or unrelatedness to the reason for admission, and by PCP vs hospitalist. To derive the relative risk (RR) of rating each intervention as appropriate or very appropriate by PCPs compared to hospitalists, adjusting for potential confounders including years out of residency and sex, we used multivariable generalized estimating equation models, each with a Poisson distribution error term, a log link, and an exchangeable working correlation structure to account for dependency of observations arising from clustering at either the hospital or participant level, depending on the comparison: for comparisons within a given case, we controlled for clustering at the hospital level; for comparisons of cases in aggregate, owing to multiple responses from each participant, we controlled for clustering at the individual level.
Assuming a 50% response rate from both PCPs and hospitalists, and that 50% of PCPs would rate a given intervention as appropriate, we calculated that we would have 90% power to detect a 50% increase in the proportion of hospitalists rating an intervention as appropriate as compared to PCPs, using an of .05.
RESULTS
Demographics
One hundred sixty‐two out of 295 providers (55%) responded to the survey (Table 2). The response rate did not differ between hospitalists (70 out of 128; 55%) and PCPs (92 out of 167; 55%). Female respondents made up 58.7% of the PCP and 50.0% of the hospitalist groups (P=0.34). On average, PCPs were older (P<0.001) with a greater median number of years since graduation from residency (P<0.001). A greater percentage of hospitalists spent more than three‐quarters of their time clinically (42.9% vs 19.6%, P=0.009).
| Total, n=162 (100.0%) | PCP, n=92 (6.8%) | Hospitalist, n=70 (43.2%) | P Valuea | |
|---|---|---|---|---|
| ||||
| Hospital, n (%) | ||||
| BIDMC | 79 (48.8) | 48 (60.8) | 31 (39.2) | 0.115 |
| BWH | 36 (22.2) | 15 (41.7) | 21 (58.3) | |
| MGH | 47 (29.0) | 29 (61.7) | 18 (38.3) | |
| Sex, n (%) | ||||
| Male | 73 (45.1) | 38 (41.3) | 35 (50.0) | 0.339 |
| Female | 89 (54.9) | 54 (58.7) | 35 (50.0) | |
| Age interval, y, n (%) | ||||
| 2534 | 36 (22.2) | 9 (9.8) | 27 (38.6) | <0.001 |
| 3544 | 67 (41.4) | 34 (37.0) | 33 (47.1) | |
| 4554 | 35 (21.6) | 29 (31.5) | 6 (8.6) | |
| 5564 | 19 (11.7) | 16 (17.4) | 3 (4.3) | |
| 6574 | 5 (3.1) | 4 (4.4) | 1 (1.4) | |
| Years out of residency, median (IQR) | 10 (417) | 15 (74) | 5 (211) | <0.001 |
| Clinical FTE, n (%) | ||||
| 0.25 | 30 (18.6) | 22 (23.9) | 8 (11.4) | 0.009 |
| 0.260.50 | 41 (25.3) | 25 (27.2) | 16 (22.9) | |
| 0.510.75 | 43 (26.5) | 27 (29.4) | 16 (22.9) | |
| >0.75 | 48 (29.6) | 18 (19.6) | 30 (42.9) | |
| Worked as PCP?b | ||||
| Yes | 6 (8.6) | |||
| No | 64 (91.4) | |||
| Worked as hospitalist? | ||||
| Yes | 11 (12.0) | |||
| No | 81 (88.0) | |||
| AOR for admitted patients | ||||
| Always | 16 (17.4) | |||
| Mostly | 8 (8.7) | |||
| Rarely | 7 (7.6) | |||
| Never | 60 (65.2) | |||
Appropriateness of Inpatient Management Based on Admitting Diagnosis
For each of the 6 case pairings individually and in aggregate, respondents were significantly more likely to deem the intervention appropriate or very appropriate if it was related to the reason for admission, compared to those interventions unrelated to the reason for admission (in aggregate, 78.9% vs 38.8% respectively, P<0.001). For example, whereas 96.9% felt that the addition of aspirin in a patient admitted with acute myocardial infarction (MI) was appropriate, only 54.3% felt it appropriate to start aspirin in a patient with a prior history of MI admitted with cellulitis (P<0.001). Significant differences (all P values <0.001) were seen for all case pairs: starting spironolactone (68.1% when related to the reason for reason for admission vs 43.1% when unrelated to reason for admission); starting warfarin (62.3% vs 23.3%), stopping proton pump inhibitor (72.3% vs 42.8%), stopping statin or fibrate (90.6% vs 28.3%), and changing statin (83.0% vs 40.5%).
Appropriateness of Inpatient Management based on Primary Role
Table 3 compares the percent of PCPs and hospitalists rating each intervention as appropriate or very appropriate, by relatedness of the intervention to the reason for admission. In both unadjusted and adjusted comparisons for all cases in aggregate, PCPs were significantly more likely than hospitalists to rate the inpatient interventions as appropriate or very appropriate when the intervention was related to the reason for admission (83.4% of PCP responses vs 73.0% of hospitalist responses, P<0.001; RR: 1.2, 95% confidence interval [CI]: 1.11.3), unrelated to the reason for admission (44.7% vs 31.1%, P<0.001; RR: 1.5, 95% CI: 1.11.9), and overall (64.1% vs 52.1%, P<0.001; RR: 1.3, 95% CI: 1.11.4).
| Relationship to Admission Diagnosis | PCP, n (%) | Hospitalist, n (%) | P Value | Adjusted RR | 95% CI |
|---|---|---|---|---|---|
| |||||
| Related | 453 (83.4) | 303 (73.0) | <0.001 | 1.2a | 1.11.3 |
| Unrelated | 242 (44.7) | 129 (31.1) | <0.001 | 1.5a | 1.11.9 |
| Overall | 695 (64.1) | 432 (52.1) | <0.001 | 1.3b | 1.11.4 |
Reasons for Inappropriate Designation
Among those respondents rating an intervention as inappropriate or very inappropriate, the 3 most common reasons selected as explanation for perceived inappropriateness from our predefined answer choices were: This medication will necessitate follow‐up testing/monitoring, for which the PCP will be responsible (chosen by physicians in 49.4% of instances); I am not confident that the hospitalist will have access to all of the medical history necessary to make this decision (35.7%); and Even if the hospitalist has all of the medical history and reviews it, the PCP should be involved in all decisions surrounding new medications (34.6%). The least common explanation chosen was I do not believe this is an appropriate pharmacologic intervention for this particular medical problem (6.5%). See Table 4 for a complete list of explanations, overall and stratified by PCP/hospitalist.
| Predefined Reason for Inappropriateness | Total, n=583 (%) | PCP, n=318 (%) | Hospitalist, n=265 (%) | P Value |
|---|---|---|---|---|
| ||||
| This medication will necessitate follow‐up testing/monitoring, for which the PCP will be responsible. | 288 (49.4) | 151 (47.5) | 137 (51.7) | 0.32 |
| I am not confident that the hospitalist will have access to all of the medical history necessary to make this decision. | 208 (35.7) | 98 (30.8) | 110 (41.5) | 0.009 |
| Even if the hospitalist has all of the medical history and reviews it, the PCP should be involved in all decisions surrounding new medications. | 201 (34.5) | 125 (39.3) | 76 (28.7) | 0.009 |
| I am not confident that the hospitalist will adequately review the medical history necessary to make this decision. | 184 (31.6) | 130 (40.9) | 54 (20.4) | <0.001 |
| Even if the hospitalist has all of the medical history, I do not believe hospitalization is the right time to start this new medication | 106 (21.4) | 69 (21.7) | 56 (21.1) | 0.92 |
| I am not confident that the hospitalist will appropriately discuss the risks and benefits of this new medication with the patient. | 106 (18.2) | 85 (26.7) | 21 (7.9) | <0.001 |
| The benefit of this medication will be too remote to justify starting it in the acute setting. | 66 (11.3) | 40 (12.6) | 26 (9.8) | 0.36 |
| I do not believe this is an appropriate pharmacologic intervention for this particular medical problem. | 38 (6.5) | 27 (8.5) | 11 (4.2) | 0.04 |
There were significant differences in the proportion of PCPs and hospitalists choosing several of the prespecified reasons for inappropriateness. Although hospitalists were more likely than PCPs to select I am not confident that the hospitalist will have access to all of the medical history necessary to make this decision (chosen by 41.5% of hospitalists vs 30.8% of PCPs, P=0.009), PCPs were more likely than hospitalists to select, I am not confident that the hospitalist will adequately review the medical history necessary to make this decision (chosen by 40.9% of PCPs vs 20.4% of hospitalists, P<0.001) and I am not confident that the hospitalist will appropriately discuss the risks and benefits of this new medication with the patient (26.7% of PCPs vs 9.8% of hospitalists, P<0.001).
Opinions on Current Management of Conditions Related and Unrelated to Admission
A minority of PCPs and hospitalists agreed or strongly agreed that hospitalists should play a larger role in the management of medical conditions unrelated to the reason for admission (28.1% of PCPs vs 34.8% of hospitalists; P=0.39).
DISCUSSION
In this survey‐based study of PCPs and hospitalists across 3 Boston‐area academic medical centers, we found that: (1) physicians were more likely to see inpatient interventions as appropriate when those interventions dealt with the reason for admission as compared to interventions unrelated to the reason for admission; and (2) PCPs were more likely than hospitalists to feel that inpatient interventions were appropriate, even when they targeted chronic conditions unrelated to the reason for admission. To our knowledge, this study represents the first investigation into the attitudes of PCPs and hospitalists regarding the inpatient management of conditions unrelated to the reason for admission.
That surveyed physicians, regardless of role, were less likely to report an intervention unrelated to the reason for hospitalization as appropriateeven those with likely mortality benefitsuggests that opportunities to affect meaningful change may be missed in a healthcare system that adheres to strict inpatient and outpatient roles. For several of the cases, a change in therapy could lead to benefit soon after implementation. For example, aldosterone antagonists reduce mortality as early as 1 month after initiation in select patients.[8] If a major goal of inpatient care is to reduce 30‐day mortality, it could be argued that hospitalists should more actively adjust congestive heart failure therapy in appropriate inpatients, even when this is not their admitting diagnosis.
For some conditions, CMS is already tracking hospital performance. Since 2003, hospitals have been required to document whether a patient with congestive heart failure (either acute or chronic and regardless of the relationship to admission) was prescribed an angiotensin‐converting enzyme (ACE) inhibitor or angiotensin receptor blocker (ARB) at the time of discharge.[7] CMS has determined that the proven benefits of ACE inhibitors and ARBs confer hospital accountability for their inclusion in appropriate patients, independent of the acuity of heart failure. There are many potential therapeutic maneuvers on which health systems (and their physicians) may be graded, and accepting the view that a hospitalization provides a window of opportunity for medical optimization may allow for more fruitful interventions and more patient‐centered care.
Despite the potential benefits of addressing chronic medical issues during hospitalization, there are important limitations on what can and/or should be done in the hospital setting. Hospitalizations are a time of fluctuating clinical status, which continues beyond discharge and is often accompanied by several medication changes.[9] In our study, more than 20% of those who believed that a medication intervention was inappropriate selected I do not believe hospitalization is the right time to start this new medication as one of their explanations. Although some medication interventions have been shown in randomized controlled trials to reduce short‐term mortality, the ability to generalize these findings to the average hospitalized patient with multiple comorbidities, concurrent medication changes, and rapidly fluctuating clinical status is limited. Furthermore, there are interventions most would agree should not be dealt with in the hospital (eg, screening colonoscopy) and encounters that may be too short to allow for change (eg, 24‐hour observation). These issues notwithstanding, the average 4‐day hospitalization likely provides an opportunity for monitored change that may currently be underutilized.
Our study suggests several additional explanations for physicians' current practice and opinions. Only 6.5% of respondents who answered that an intervention was inappropriate indicated as a justification that I do not believe this is an appropriate pharmacologic intervention for this particular medical problem. This suggests that the hesitancy has little to do with a lack of benefit but instead relates to systems issues (eg, access to all pertinent records and concerns regarding follow‐up testing) and perceived limitations to what a hospitalist should and should not do without actively involving the PCP. There are likely additional concerns that the medical record and/or patient histories do not fully outline the rationale for exclusion or inclusion of particular medications. Advances in information technology that enhance information exchange and enable streamlined communication may help to address these perceived barriers. However, an additional barrier may be trust, as PCPs appear more concerned that hospitalists will not review all the pertinent records or discuss risks and benefits before enacting important medication changes. Increased attempts at communication between hospitalists and outpatient providers may help to build trust and alleviate concerns regarding the loss of information that often occurs both on admission and at discharge.
We also noted that PCPs were more likely than hospitalists to feel that inpatient interventions were appropriate, even when targeting chronic conditions unrelated to the reason for admission. It may be that PCPs, with an increasing number of problems to address per outpatient visit,[10, 11] are more open to hospitalists managing any medical problems during their patients' admissions. At the same time, with increased acuity[12, 13, 14] and shortened length of stays,[15, 16] hospitalists have only a finite amount of time to ensure acute issues are managed, leaving potentially modifiable chronic conditions to the outpatient setting. These differences aside, a minority of both PCPs and hospitalists in our study were ready to embrace the idea of hospitalists playing a larger role in the management of conditions unrelated to the reason for hospitalization.
Even though our study benefits from its multisite design, there are a number of limitations. First, although we crafted our survey with input from general medicine focus groups, our survey instrument has not been validated. In addition, the cases are necessarily contrived and do not take into account the complexities of inpatient medicine. Furthermore, though our goal was to create paired cases that isolate a management decision as being simply based on whether it was related or unrelated to the reason for admission, it is possible that other factors, not captured by our survey, influenced the responses. For example, the benefits of aspirin as part of secondary prevention are not equal to the benefits in an acute MI.[17]
In an attempt to isolate the hospitalists' role in these management decisions, respondents were instructed to assume that the decisions were being made without discussing it with the primary care physician, but that the hospitalist would communicate the details of any hospitalization at the time of discharge. They were also instructed to assume that the hospitalist has access to the patient's outpatient electronic medical record. These assumptions were made to address concerns regarding the flow of information and communication, and to simulate the ideal system from a communication and information accessibility standpoint. Had these assumptions not been placed, the responses may have differed. It is likely that PCPs and hospitalists practicing in systems without shared, accessible inpatient/outpatient medical records would be even more reluctant to enact medication changes unrelated to the reason for admission.
Along the same lines, our physician cohort consisted of several metropolitan academic physician groups, in which hospitalists have had a presence for almost 20 years. As a result, our findings may not be generalizable to other academic hospitals, community‐based hospitalist programs, or nonhospital‐based PCP practices. Finally, we do not know whether survey nonresponders differed from responders in ways that could have meaningfully affected our results.
In conclusion, our findings suggest that both PCPs and hospitalists see the management of conditions unrelated to the reason for admission as less appropriate than the management of conditions related to the reason for admission. Our findings also suggest that PCPs may be more open to this practice when compared to hospitalists. Failure to capitalize on opportunities for meaningful medical interventions, independent of patient location, suggests a possible lack of patient centeredness in the current partnership between PCPs and hospitalists. Further studies should examine existing barriers and investigate interventions designed to address those barriers, in an effort to improve both quality of care and the degree of patient‐centeredness in our current healthcare system.
Disclosures: Dr. Herzig is supported by a grant from the National Institute on Aging (K23 AG042459). Dr. Herzig had full access to all of the data in the study and takes responsibility for the integrity of the data and the accuracy of the data analysis. Author contributions: study concept and design, Breu, Allen‐Dicker, Mueller, Herzig; acquisition of data, Breu, Allen‐Dicker, Mueller, Palamara, Herzig; analysis and interpretation of data, Breu, Allen‐Dicker, Hinami, Herzig; drafting of the manuscript, Breu; critical revision of the manuscript for important intellectual content, Breu, Allen‐Dicker, Mueller, Palamara, Hinami, Herzig; statistical analysis, Allen‐Dicker, Hinami, Herzig; study supervision, Breu, Herzig. This study was presented as a poster at the Society of Hospital Medicine National Meeting, Washington, DC, May 17, 2013.
- , , , . Growth in the care of older patients by hospitalists in the United States. N Engl J Med. 2009;360(11):1102–1112.
- , . The emerging role of “hospitalists” in the American health care system. N Engl J Med. 1996;335(7):514–517.
- . An introduction to the hospitalist model. Ann Intern Med. 1999;130(4 pt 2):338–342.
- , . Hospital readmission as an accountability measure. JAMA. 2011;305(5):504–505.
- , , , , . A national strategy to put accountable care into practice. Health Aff (Millwood). 2010;29(5):982–990.
- . Keeping score under a global payment system. N Engl J Med. 2012;366(5):393–395.
- Reporting Hospital Quality Data for Annual Payment Update. Available at: http://www.cms.gov/Medicare/Quality‐Initiatives‐Patient‐Assessment‐Instruments/HospitalQualityInits/Downloads/HospitalRHQDAPU200808. Accessed December 18, 2013.
- , , , et al. Eplerenone in patients with systolic heart failure and mild symptoms. N Engl J Med. 2011;364(1):11–21.
- , , , , , . How are drug regimen changes during hospitalisation handled after discharge: a cohort study. BMJ Open. 2012;2(6):e001461.
- , , . Primary care visit duration and quality: does good care take longer? Arch Intern Med. 2009;169(20):1866–1872.
- , , , The increasing number of clinical items addressed during the time of adult primary care visits. J Gen Intern Med. 2008;23(12):2058–2065.
- , , . Multiple chronic conditions among adults aged 45 and over: trends over the past 10 years. NCHS Data Brief. 2012;(100):1–8.
- , , . Prevalence of multiple chronic conditions in the United States' Medicare population. Health Qual Life Outcomes. 2009;7(1):82.
- , , , et al. Multiple chronic conditions: prevalence, health consequences, and implications for quality, care management, and costs. J Gen Intern Med. 2007;22(suppl 3):391–395.
- , , , et al. Associations between reduced hospital length of stay and 30‐day readmission rate and mortality: 14‐year experience in 129 Veterans Affairs hospitals. Ann Intern Med. 2012;157(12):837–845.
- , , , et al. Trends in length of stay and short‐term outcomes among Medicare patients hospitalized for heart failure, 1993–2006. JAMA. 2010;303(21):2141–2147.
- Antithrombotic Trialists' Collaboration. Collaborative meta‐analysis of randomised trials of antiplatelet therapy for prevention of death, myocardial infarction, and stroke in high risk patients. BMJ. 2002;324(7329):71–86.
© 2014 Society of Hospital Medicine
Supercomputer accelerates whole-genome analysis

Credit: NIGMS
The time needed to sequence an entire human genome has decreased greatly in recent years, but analyzing the resulting 3 billion base pairs of genetic information from a single genome can take many months.
Now, researchers have found they can accelerate whole-genome analysis using a Cray XE6 supercomputer.
The team found this computer could process many genomes at once and was able to analyze 240 full genomes in a little over 2 days.
The researchers reported these results in Bioinformatics.
The team used Beagle, a Cray XE6 supercomputer located at Argonne National Laboratory in Illinois, in an attempt to analyze multiple genomes concurrently.
Using publicly available software packages and one quarter of its total capacity, the computer was able to align and call variants on 240 whole genomes in approximately 50 hours.
But the computer did not only speed up whole-genome analysis. It also increased the usable sequences per genome.
“Improving analysis through both speed and accuracy reduces the price per genome,” said study author Elizabeth McNally, MD, PhD, of the University of Chicago.
“With this approach, the price for analyzing an entire genome is less than the cost of looking at just a fraction of the genome. New technology promises to bring the costs of sequencing down to around $1000 per genome. Our goal is get the cost of analysis down into that range.”
The findings of this research have immediate medical applications, according to Dr McNally. She noted that she and her colleagues must often sequence genes from an initial patient as well as multiple family members in order to better understand and either treat or prevent a disease.
“We start genetic testing with the patient,” she said. “But when we find a significant mutation, we have to think about testing the whole family to identify individuals at risk.”
Furthermore, the range of testable mutations has greatly increased in recent years.
“In the early days, we would test 1 to 3 genes,” Dr McNally said. “In 2007, we did our first 5-gene panel. Now, we order 50 to 70 genes at a time, which usually gets us an answer. At that point, it can be more useful and less expensive to sequence the whole genome.”
The information from these genomes combined with careful attention to patient and family histories adds to our knowledge about inherited disorders, according to Dr McNally.
“It can refine the classification of these disorders,” she said. “By paying close attention to family members with genes that place them at increased risk, but who do not yet show signs of disease, we can investigate early phases of a disorder.” ![]()
Mutations linked to blood vessel disorders

Two groups of researchers have shown that variants in the gene CECR1, which encodes for ADA2, are associated with blood vessel disorders.
One group found that mutations in CECR1 are associated with an ADA2 deficiency syndrome that is characterized by early onset, recurrent strokes and systemic vasculopathy.
The other group discovered that variants in CECR1 can cause polyarteritis nodosa vasculopathy.
Results of both studies appear in NEJM.
ADA2 deficiency syndrome
In the first study, Qing Zhou, PhD, of the National Human Genome Research Institute (NHGRI), and his colleagues used whole-exome sequencing to gain insight into the aforementioned syndrome, which was characterized by early onset lacunar strokes, systemic vasculopathy, and other symptoms.
The researchers performed whole-exome sequencing in 3 patients with the syndrome and their unaffected parents. In comparing 2 of the patients’ exomes to the exomes of their parents, the researchers located 2 variants in CECR1.
Sequencing a third patient revealed another harmful variant of CECR1, in addition to a small genomic deletion that shuts down the second copy of the gene.
The researchers needed only a sequence reading of that single gene to confirm that 3 other patients were affected by variants in CECR1. In all, these 6 patients were compound heterozygous for 8 mutations in CECR1.
The team discovered that these CECR1 mutations lead to the elimination of ADA2, which produces abnormalities and inflammation in blood vessel walls that ultimately result in the syndrome. So the team called the syndrome deficiency of ADA2 (DADA2).
To gain more insight into DADA2, the researchers induced ADA2 deficiency in a zebrafish model. They found that zebrafish embryos that produce less ADA2 than normal embryos have cerebral bleeds similar to those seen in some of the children with DADA2.
“Our study raises the possibility that the ADA2 pathway may contribute to susceptibility to stroke in the more general population,” said Daniel Kastner, MD, PhD, of NHGRI.
“This genome sequencing study expands what has previously been known about vascular biology. The role of ADA2 in such serious human disease is important and suggests that ADA2 variants may contribute to other, more common illnesses.”
Dr Kastner and his colleagues also sequenced the CECR1 gene in 3 patients from Turkey who had some of the symptoms of DADA2. These patients, who had polyarteritis nodosa (n=2) or small-vessel vasculitis (n=1), were homozygous for the p.Gly47Arg mutation.
ADA2 in polyarteritis nodosa
In the second study, researchers found the same mutation (p.Gly47Arg) in patients that emigrated to Israel from the country of Georgia.
“We now know that this mutation exists in the Middle East and in Pakistani populations and that it is not that uncommon,” said Ivona Aksentijevich, MD, of NHGRI. “This is the first time a single gene has been discovered that is involved in causing a system-wide form of vasculitis.”
To uncover this mutation, Paulina Navon-Elkan, MD, of the Shaare Zedek Medical Center in Jerusalem, and her colleagues sequenced 37 patients who had features of polyarteritis nodosa.
Nineteen patients were of Georgian Jewish ancestry. Sixteen of these patients came from 5 families, and 3 patients were unrelated. An additional 14 unrelated patients were of Turkish ancestry. And 4 German patients came from the same family.
The researchers found that, in all the families, vasculitis was a result of recessive mutations in CECR1.
All of the Georgian Jewish patients were homozygous for the p.Gly47Arg mutation. The German patients were compound heterozygous for Arg169Gln and Pro251Leu mutations. And 1 Turkish patient was compound heterozygous for Gly47Val and Trp264Ser mutations.
The researchers also analyzed serum specimens from the patients and found their ADA2 activity was significantly reduced.
Taking these results together, the team concluded that mutations in CECR1 cause loss of ADA2 function that can result in polyarteritis nodosa vasculopathy with a highly varied clinical expression. ![]()
Outcomes after 2011 Residency Reform
The Accreditation Council for Graduate Medical Education (ACGME) Common Program Requirements implemented in July 2011 increased supervision requirements and limited continuous work hours for first‐year residents.[1] Similar to the 2003 mandates, these requirements were introduced to improve patient safety and education at academic medical centers.[2] Work‐hour reforms have been associated with decreased resident burnout and improved sleep.[3, 4, 5] However, national observational studies and systematic reviews of the impact of the 2003 reforms on patient safety and quality of care have been varied in terms of outcome.[6, 7, 8, 9, 10] Small studies of the 2011 recommendations have shown increased sleep duration and decreased burnout, but also an increased number of handoffs and increased resident concerns about making a serious medical error.[11, 12, 13, 14] Although national surveys of residents and program directors have not indicated improvements in education or quality of life, 1 observational study did show improvement in clinical exposure and conference attendance.[15, 16, 17, 18] The impact of the 2011 reforms on patient safety remains unclear.[19, 20]
The objective of this study was to evaluate the association between implementation of the 2011 residency work‐hour mandates and patient safety outcomes at a large academic medical center.
METHODS
Study Design
This observational study used a quasi‐experimental difference‐in‐differences approach to evaluate whether residency work‐hour changes were associated with patient safety outcomes among general medicine inpatients. We compared safety outcomes among adult patients discharged from resident general medical services (referred to as resident) to safety outcomes among patients discharged by the hospitalist general medical service (referred to as hospitalist) before and after the 2011 residency work‐hour reforms at a large academic medical center. Differences in outcomes for the resident group were compared to differences observed in the hospitalist group, with adjustment for relevant demographic and case mix factors.[21] We used the hospitalist service as a control group, because ACGME changes applied only to resident services. The strength of this design is that it controls for secular trends that are correlated with patient safety, impacting both residents and hospitalists similarly.[9]
Approval for this study and a Health Insurance Portability and Accountability Act waiver were granted by the Johns Hopkins University School of Medicine institutional review board. We retrospectively examined administrative data on all patient discharges from the general medicine services at Johns Hopkins Hospital between July 1, 2008 and June 30, 2012 that were identified as pertaining to resident or hospitalist services.
Patient Allocation and Physician Scheduling
Patient admission to the resident or hospitalist service was decided by a number of factors. To maintain continuity of care, patients were preferentially admitted to the same service as for prior admissions. New patients were admitted to a service based on bed availability, nurse staffing, patient gender, isolation precautions, and cardiac monitor availability.
The inpatient resident services were staffed prior to July 2011 using a traditional 30‐hour overnight call system. Following July 2011, the inpatient resident services were staffed using a modified overnight call system, in which interns took overnight calls from 8 pm until 12 pm the following day, once every 5 nights with supervision by upper‐level residents. These interns rotated through daytime admitting and coverage roles on the intervening days. The hospitalist service was organized into a 3‐physician rotation of day shift, evening shift, and overnight shift.
Data and Outcomes
Twenty‐nine percent of patients in the sample were admitted more than once during the study period, and patients were generally admitted to the same resident team during each admission. Patients with multiple admissions were counted multiple times in the model. We categorized admissions as prereform (July 1, 2008June 30, 2011) and postreform (July 1, 2011June 30, 2012). Outcomes evaluated included hospital length of stay, 30‐day readmission, intensive care unit stay (ICU) stay, inpatient mortality, and number of Maryland Hospital Acquired Conditions (MHACs). ICU stay pertained to any ICU admission including initial admission and transfer from the inpatient floor. MHACs are a set of inpatient performance indicators derived from a list of 64 inpatient Potentially Preventable Complications developed by 3M Health Information Systems.[22] MHACs are used by the Maryland Health Services Cost Review Commission to link hospital payment to performance for costly, preventable, and clinically relevant complications. MHACs were coded in our analysis as a dichotomous variable. Independent variables included patient age at admission, race, gender, and case mix index. Case mix index (CMI) is a numeric score that measures resource utilization for a specific patient population. CMI is a weighted value assigned to patients based on resource utilization and All Patient Refined Diagnostic Related Group and was included as an indicator of patient illness severity and risk of mortality.[23] Data were obtained from administrative records from the case mix research team at Johns Hopkins Medicine.
To account for transitional differences that may have coincided with the opening of a new hospital wing in late April 2012, we conducted a sensitivity analysis, in which we excluded from analysis any visits that took place in May 2012 to June 2012.
Data Analysis
Based on historical studies, we calculated that a sample size of at least 3600 discharges would allow us to detect a difference of 5% between the pre‐ and postreform period assuming baseline 20% occurrence of dichotomous outcomes (=0.05; =0.2; r=4).[21]
The primary unit of analysis was the hospital discharge. Similar to Horwitz et al., we analyzed data using a difference‐in‐differences estimation strategy.[21] We used multivariable linear regression for length of stay measured as a continuous variable, and multivariable logistic regression for inpatient mortality, 30‐day readmission, MHACs coded as a dichotomous variable, and ICU stay coded as a dichotomous variable.[9] The difference‐in‐differences estimation was used to determine whether the postreform period relative to prereform period was associated with differences in outcomes comparing resident and hospitalist services. In the regression models, the independent variables of interest included an indicator variable for whether a patient was treated on a resident service, an indicator variable for whether a patient was discharged in the postreform period, and the interaction of these 2 variables (resident*postreform). The interaction term can be interpreted as a differential change over time comparing resident and hospitalist services. In all models, we adjusted for patient age, gender, race, and case mix index.
To determine whether prereform trends were similar among the resident and hospitalist services, we performed a test of controls as described by Volpp and colleagues.[6] Interaction terms for resident service and prereform years 2010 and 2011 were added to the model. A Wald test was then used to test for improved model fit, which would indicate differential trends among resident and hospitalist services during the prereform period. Where such trends were found, postreform results were compared only to 2011 rather than the 2009 to 2011 prereform period.[6]
To account for correlation within patients who had multiple discharges, we used a clustering approach and estimated robust variances.[24] From the regression model results, we calculated predicted probabilities adjusted for relevant covariates and prepost differences, and used linear probability models to estimate percentage‐point differences in outcomes, comparing residents and hospitalists in the pre‐ and postreform periods.[25] All analyses were performed using Stata/IC version 11 (StataCorp, College Station, TX).
RESULTS
In the 3 years before the 2011 residency work‐hour reforms were implemented (prereform), there were a total of 15,688 discharges for 8983 patients to the resident services and 4622 discharges for 3649 patients to the hospitalist services. In the year following implementation of residency work‐hour changes (postreform), there were 5253 discharges for 3805 patients to the resident services and 1767 discharges for 1454 patients to the hospitalist service. Table 1 shows the characteristics of patients discharged from the resident and hospitalist services in the pre‐ and postreform periods. Patients discharged from the resident services were more likely to be older, male, African American, and have a higher CMI.
| Resident Services | Hospitalist Service | ||||||||
|---|---|---|---|---|---|---|---|---|---|
| 2009 | 2010 | 2011 | 2012 | 2009 | 2010 | 2011 | 2012 | P Valuea | |
| |||||||||
| Discharges, n | 5345 | 5299 | 5044 | 5253 | 1366 | 1492 | 1764 | 1767 | |
| Unique patients, n | 3082 | 2968 | 2933 | 3805 | 1106 | 1180 | 1363 | 1454 | |
| Age, y, mean (SD) | 55.1 (17.7) | 55.7 (17.4) | 56.4 (17.9) | 56.7 (17.1) | 55.9 (17.9) | 56.2 (18.4) | 55.5 (18.8) | 54 (18.7) | 0.02 |
| Sex male, n (%) | 1503 (48.8) | 1397 (47.1) | 1432 (48.8) | 1837 (48.3) | 520 (47) | 550 (46.6) | 613 (45) | 654 (45) | <0.01 |
| Race | |||||||||
| African American, n (%) | 2072 (67.2) | 1922 (64.8) | 1820 (62.1) | 2507 (65.9) | 500 (45.2) | 592 (50.2) | 652 (47.8) | 747 (51.4) | <0.01 |
| White, n (%) | 897 (29.1) | 892 (30.1) | 957 (32.6) | 1118 (29.4) | 534 (48.3) | 527 (44.7) | 621 (45.6) | 619 (42.6) | |
| Asian, n (%) | 19 (.6%) | 35 (1.2) | 28 (1) | 32 (.8) | 11 (1) | 7 (.6) | 25 (1.8) | 12 (.8) | |
| Other, n (%) | 94 (3.1) | 119 (4) | 128 (4.4) | 148 (3.9) | 61 (5.5) | 54 (4.6) | 65 (4.8) | 76 (5.2) | |
| Case mix index, mean (SD) | 1.2 (1) | 1.1 (0.9) | 1.1 (0.9) | 1.1 (1.2) | 1.2 (1) | 1.1 (1) | 1.1 (1) | 1 (0.7) | <0.01 |
Differences in Outcomes Among Resident and Hospitalist Services Pre‐ and Postreform
Table 2 shows unadjusted results. Patients discharged from the resident services in the postreform period as compared to the prereform period had a higher likelihood of an ICU stay (5.9% vs 4.5%, P<0.01), and lower likelihood of 30‐day readmission (17.1% vs 20.1%, P<0.01). Patients discharged from the hospitalist service in the postreform period as compared to the prereform period had a significantly shorter mean length of stay (4.51 vs 4.88 days, P=0.03)
| Resident Services | Hospitalist Service | |||||
|---|---|---|---|---|---|---|
| Outcome | Prereforma | Postreform | P Value | Prereforma | Postreform | P Value |
| ||||||
| Length of stay (mean) | 4.55 (5.39) | 4.50 (5.47) | 0.61 | 4.88 (5.36) | 4.51 (4.64) | 0.03 |
| Any ICU stay (%) | 225 (4.5%) | 310 (5.9%) | <0.01 | 82 (4.7%) | 83 (4.7%) | 0.95 |
| Any MHACs (%) | 560 (3.6%) | 180 (3.4%) | 0.62 | 210 (4.5%) | 64 (3.6%) | 0.09 |
| Readmit in 30 days (%) | 3155 (20.1%) | 900 (17.1%) | <0.01 | 852 (18.4%) | 296 (16.8%) | 0.11 |
| Inpatient mortality (%) | 71 (0.5%) | 28 (0.5%) | 0.48 | 18 (0.4%) | 7 (0.4%) | 0.97 |
Table 3 presents the results of regression analyses examining correlates of patient safety outcomes, adjusted for age, gender, race, and CMI. As the test of controls indicated differential prereform trends for ICU admission and length of stay, the prereform period was limited to 2011 for these outcomes. After adjustment for covariates, the probability of an ICU stay remained greater, and the 30‐day readmission rate was lower among patients discharged from resident services in the postreform period than the prereform period. Among patients discharged from the hospitalist services, there were no significant differences in length of stay, readmissions, ICU admissions, MHACs, or inpatient mortality comparing the pre‐ and postreform periods.
| Resident Services | Hospitalist Service | Difference in Differences | |||||
|---|---|---|---|---|---|---|---|
| Outcome | Prereforma | Postreform | Difference | Prereform | Postreform | Difference | (ResidentHospitalist) |
| |||||||
| ICU stay | 4.5% (4.0% to 5.1%) | 5.7% (5.1% to 6.3%) | 1.4% (0.5% to 2.2%) | 4.4% (3.5% to 5.3%) | 5.3% (4.3% to 6.3%) | 1.1% (0.2 to 2.4%) | 0.3% (1.1% to 1.8%) |
| Inpatient mortality | 0.5% (0.4% to 0.6%) | 0.5% (0.3% to 0.7%) | 0 (0.2% to 0.2%) | 0.3% (0.2% to 0.6%) | 0.5% (0.1% to 0.8%) | 0.1% (0.3% to 0.5%) | 0.1% (0.5% to 0.3%) |
| MHACs | 3.6% (3.3% to 3.9%) | 3.3% (2.9% to 3.7%) | 0.4% (0.9 to 0.2%) | 4.5% (3.9% to 5.1%) | 4.1% (3.2% to 5.1%) | 0.3% (1.4% to 0.7%) | 0.2% (1.0% to 1.3%) |
| Readmit 30 days | 20.1% (19.1% to 21.1%) | 17.2% (15.9% to 18.5%) | 2.8% (4.3% to 1.3%) | 18.4% (16.5% to 20.2%) | 16.6% (14.7% to 18.5%) | 1.7% (4.1% to 0.8%) | 1.8% (0.2% to 3.7%) |
| Length of stay | 4.6 (4.4 to 4.7) | 4.4 (4.3 to 4.6) | 0.1 (0.3 to 0.1) | 4.9 (4.6 to 5.1) | 4.7 (4.5 to 5.0) | 0.1 (0.4 to 0.2) | 0.01 (0.37 to 0.34) |
Differences in Outcomes Comparing Resident and Hospitalist Services Pre‐ and Postreform
Comparing pre‐ and postreform periods in the resident and hospitalist services, there were no significant differences in ICU admission, length of stay, MHACs, 30‐day readmissions, or inpatient mortality. In the sensitivity analysis, in which we excluded all discharges in May 2012 to June 2012, results were not significantly different for any of the outcomes examined.
DISCUSSION
Using difference‐in‐differences estimation, we evaluated whether the implementation of the 2011 residency work‐hour mandate was associated with differences in patient safety outcomes including length of stay, 30‐day readmission, inpatient mortality, MHACs, and ICU admissions comparing resident and hospitalist services at a large academic medical center. Adjusting for patient age, race, gender, and clinical complexity, we found no significant changes in any of the patient safety outcomes indicators in the postreform period comparing resident to hospitalist services.
Our quasiexperimental study design allowed us to gauge differences in patient safety outcomes, while reducing bias due to unmeasured confounders that might impact patient safety indicators.[9] We were able to examine all discharges from the resident and hospitalist general medicine services during the academic years 2009 to 2012, while adjusting for age, race, gender, and clinical complexity. Though ICU admission was higher and readmission rates were lower on the resident services post‐2011, we did not observe a significant difference in ICU admission or 30‐day readmission rates in the postreform period comparing patients discharged from the resident and hospitalist services and all patients in the prereform period.
Our neutral findings differ from some other single‐institution evaluations of reduced resident work hours, several of which have shown improved quality of life, education, and patient safety indicators.[18, 21, 26, 27, 28] It is unclear why improvements in patient safety were not identified in the current study. The 2011 reforms were more broad‐based than some of the preliminary studies of reduced work hours, and therefore additional variables may be at play. For instance, challenges related to decreased work hours, including the increased number of handoffs in care and work compression, may require specific interventions to produce sustained improvements in patient safety.[3, 14, 29, 30]
Improving patient safety requires more than changing resident work hours. Blum et al. recommended enhanced funding to increase supervision, decrease resident caseload, and incentivize achievement of quality indicators to achieve the goal of improved patient safety within work‐hour reform.[31] Schumacher et al. proposed a focus on supervision, professionalism, safe transitions of care, and optimizing workloads as a means to improve patient safety and education within the new residency training paradigm.[29]
Limitations of this study include limited follow‐up time after implementation of the work‐hour reforms. It may take more time to optimize systems of care to see benefits in patient safety indicators. This was a single‐institution study of a limited number of outcomes in a single department, which limits generalizability and may reflect local experience rather than broader trends. The call schedule on the resident service in this study differs from programs that have adopted night float schedules. [27] This may have had an effect on patient care outcomes.[32] In an attempt to conduct a timely study of inpatient safety indicators following the 2011 changes, our study was not powered to detect small changes in low‐frequency outcomes such as mortality; longer‐term studies at multiple institutions will be needed to answer these key questions. We limited the prereform period where our test of controls indicated differential prereform trends, which reduced power.
As this was an observational study rather than an experiment, there may have been both measured and unmeasured differences in patient characteristics and comorbidity between the intervention and control group. For example, CMI was lower on the hospitalist service than the resident services. Demographics varied somewhat between services; male and African American patients were more likely to be discharged from resident services than hospitalist services for unknown reasons. Although we adjusted for demographics and CMI in our model, there may be residual confounding. Limitations in data collection did not allow us to separate patients initially admitted to the ICU from patients transferred to the ICU from the inpatient floors. We attempted to overcome this limitation through use of a difference‐in‐differences model to account for secular trends, but factors other than residency work hours may have impacted the resident and hospitalist services differentially. For example, hospital quality‐improvement programs or provider‐level factors may have differentially impacted the resident versus hospitalist services during the study period.
Work‐hour limitations for residents were established to improve residency education and patient safety. As noted by the Institute of Medicine, improving patient safety will require significant investment by program directors, hospitals, and the public to keep resident caseloads manageable, ensure adequate supervision of first‐year residents, train residents on safe handoffs in care, and conduct ongoing evaluations of patient safety and any unintended consequences of the regulations.[33] In the first year after implementation of the 2011 work‐hour reforms, we found no change in ICU admission, inpatient mortality, 30‐day readmission rates, length of stay, or MHACs compared with patients treated by hospitalists. Studies of the long‐term impact of residency work‐hour reform are necessary to determine whether changes in work hours have been associated with improvement in resident education and patient safety.
Disclosure: Nothing to report.
- Accreditation Council for Graduate Medical Education. Common program requirements effective: July 1, 2011. Available at: http://www.acgme.org/acgmeweb/Portals/0/PFAssets/ProgramResources/Common_Program_Requirements_07012011[1].pdf. Accessed February 10, 2014.
- , , . The new recommendations on duty hours from the ACGME Task Force. N Engl J Med. 2010;363:e3.
- , , , , . Interns' compliance with Accreditation Council for Graduate Medical Education work‐hour limits. JAMA. 2006;296(9):1063–1070.
- , , , , , . Effects of work hour reduction on residents' lives: a systematic review. JAMA. 2005;294(9):1088–1100.
- , , , et al. Effects of the ACGME duty hour limits on sleep, work hours, and safety. Pediatrics. 2008;122(2):250–258.
- , , . Teaching hospital five‐year mortality trends in the wake of duty hour reforms. J Gen Intern Med. 2013;28(8):1048–1055.
- , , , . Duty hour limits and patient care and resident outcomes: can high‐quality studies offer insight into complex relationships? Ann Rev Med. 2013;64:467–483.
- , , . Patient safety, resident education and resident well‐being following implementation of the 2003 ACGME duty hour rules. J Gen Intern Med. 2011;26(8):907–919.
- , , , et al. Mortality among hospitalized Medicare beneficiaries in the first 2 years following ACGME resident duty hour reform. JAMA. 2007;298(9):975–983.
- , , , et al. Effects of resident duty hour reform on surgical and procedural patient safety indicators among hospitalized Veterans Health Administration and Medicare patients. Med Care. 2009;47(7):723–731.
- , , , et al. Pilot trial of IOM duty hour recommendations in neurology residency programs. Neurology. 2011;77(9):883–887.
- , , , et al. Effect of 16‐hour duty periods of patient care and resident education. Mayo Clin Proc. 2011;86:192–196.
- , , , et al. Effects of the 2011 duty hour reforms on interns and their patients: a prospective longitudinal cohort study. JAMA Intern Med. 2013;173(8):657–662.
- , , , et al. Effect of the 2011 vs 2003 duty hour regulation—compliant models on sleep duration, trainee education, and continuity of patient care among internal medicine house staff. JAMA Intern Med. 2013;173(8):649–655.
- , , . Residents' response to duty‐hour regulations—a follow‐up national survey. N Engl J Med. 2012;366:e35.
- , , , . Surgical residents' perceptions of 2011 Accreditation Council for Graduate Medical Education duty hour regulations. JAMA Surg. 2013;148(5):427–433.
- , , . The 2011 duty hour requirements—a survey of residency program directors. N Engl J Med. 2013;368:694–697.
- , , , et al. The effect of reducing maximum shift lengths to 16 hours on internal medicine interns' educational opportunities. Acad Med. 2013;88(4):512–518.
- , . Residency work‐hours reform. A cost analysis including preventable adverse events. J Gen Intern Med. 2005;20(10):873–878.
- , , , , . Cost implications of reduced work hours and workloads for resident physicians. N Engl J Med. 2009;360:2202–2215.
- , , , . Changes in outcomes for internal medicine inpatients after work‐hour regulations. Ann Intern Med. 2007;147:97–103.
- .Maryland Health Services Cost Review Commission. Complications: Maryland Hospital Acquired Conditions. Available at: http://www.hscrc.state.md.us/init_qi_MHAC.cfm. Accessed May 23, 2013.
- , , , et al. What are APR‐DRGs? An introduction to severity of illness and risk of mortality adjustment methodology. 3M Health Information Systems. Available at: http://solutions.3m.com/3MContentRetrievalAPI/BlobServlet?locale=it_IT44(4):1049–1060.
- , , , , . Impact of the 2008 US Preventive Services Task Force Recommendation to discontinue prostate cancer screening among male Medicare beneficiaries. Arch Intern Med. 2012;172(20):1601–1603.
- , , , et al. Effect of reducing interns' work hour on serious medical errors in intensive care units. N Engl J Med. 2004;351(18):1838–1848.
- , , . Effects of reducing or eliminating resident work shifts over 16 hours: a systematic review. Sleep. 2010;33(8):1043–1053.
- , , , et al. Impact of duty hours restrictions on quality of care and clinical outcomes. Am J Med. 2007;120(11):968–974.
- , , , , , . Beyond counting hours: the importance of supervision, professionalism, transitions in care, and workload in residency training. Acad Med. 2012;87(7):883–888.
- , , , , , . One possible future for resident hours: interns' perspective on a one‐month trial of the Institute of Medicine recommended duty hour limits. J Grad Med Educ. 2009;1(2):185–187.
- , , , , . Implementing the 2009 Institute of Medicine recommendations on resident physician work hours, supervision, and safety. Nature Sci Sleep. 2001;3:47–85.
- , . Night float teaching and learning: perceptions of residents and faculty. J Grad Med Educ. 2010;2(2):236–241.
- Institute of Medicine. Resident duty hours: enhancing sleep, supervision, and safety. Report brief. Washington, DC: National Academies; 2008. Available at: http://www.iom.edu/∼/media/Files/Report Files/2008/Resident‐Duty‐Hours/residency hours revised for web.pdf. Accessed May 23, 2013.
The Accreditation Council for Graduate Medical Education (ACGME) Common Program Requirements implemented in July 2011 increased supervision requirements and limited continuous work hours for first‐year residents.[1] Similar to the 2003 mandates, these requirements were introduced to improve patient safety and education at academic medical centers.[2] Work‐hour reforms have been associated with decreased resident burnout and improved sleep.[3, 4, 5] However, national observational studies and systematic reviews of the impact of the 2003 reforms on patient safety and quality of care have been varied in terms of outcome.[6, 7, 8, 9, 10] Small studies of the 2011 recommendations have shown increased sleep duration and decreased burnout, but also an increased number of handoffs and increased resident concerns about making a serious medical error.[11, 12, 13, 14] Although national surveys of residents and program directors have not indicated improvements in education or quality of life, 1 observational study did show improvement in clinical exposure and conference attendance.[15, 16, 17, 18] The impact of the 2011 reforms on patient safety remains unclear.[19, 20]
The objective of this study was to evaluate the association between implementation of the 2011 residency work‐hour mandates and patient safety outcomes at a large academic medical center.
METHODS
Study Design
This observational study used a quasi‐experimental difference‐in‐differences approach to evaluate whether residency work‐hour changes were associated with patient safety outcomes among general medicine inpatients. We compared safety outcomes among adult patients discharged from resident general medical services (referred to as resident) to safety outcomes among patients discharged by the hospitalist general medical service (referred to as hospitalist) before and after the 2011 residency work‐hour reforms at a large academic medical center. Differences in outcomes for the resident group were compared to differences observed in the hospitalist group, with adjustment for relevant demographic and case mix factors.[21] We used the hospitalist service as a control group, because ACGME changes applied only to resident services. The strength of this design is that it controls for secular trends that are correlated with patient safety, impacting both residents and hospitalists similarly.[9]
Approval for this study and a Health Insurance Portability and Accountability Act waiver were granted by the Johns Hopkins University School of Medicine institutional review board. We retrospectively examined administrative data on all patient discharges from the general medicine services at Johns Hopkins Hospital between July 1, 2008 and June 30, 2012 that were identified as pertaining to resident or hospitalist services.
Patient Allocation and Physician Scheduling
Patient admission to the resident or hospitalist service was decided by a number of factors. To maintain continuity of care, patients were preferentially admitted to the same service as for prior admissions. New patients were admitted to a service based on bed availability, nurse staffing, patient gender, isolation precautions, and cardiac monitor availability.
The inpatient resident services were staffed prior to July 2011 using a traditional 30‐hour overnight call system. Following July 2011, the inpatient resident services were staffed using a modified overnight call system, in which interns took overnight calls from 8 pm until 12 pm the following day, once every 5 nights with supervision by upper‐level residents. These interns rotated through daytime admitting and coverage roles on the intervening days. The hospitalist service was organized into a 3‐physician rotation of day shift, evening shift, and overnight shift.
Data and Outcomes
Twenty‐nine percent of patients in the sample were admitted more than once during the study period, and patients were generally admitted to the same resident team during each admission. Patients with multiple admissions were counted multiple times in the model. We categorized admissions as prereform (July 1, 2008June 30, 2011) and postreform (July 1, 2011June 30, 2012). Outcomes evaluated included hospital length of stay, 30‐day readmission, intensive care unit stay (ICU) stay, inpatient mortality, and number of Maryland Hospital Acquired Conditions (MHACs). ICU stay pertained to any ICU admission including initial admission and transfer from the inpatient floor. MHACs are a set of inpatient performance indicators derived from a list of 64 inpatient Potentially Preventable Complications developed by 3M Health Information Systems.[22] MHACs are used by the Maryland Health Services Cost Review Commission to link hospital payment to performance for costly, preventable, and clinically relevant complications. MHACs were coded in our analysis as a dichotomous variable. Independent variables included patient age at admission, race, gender, and case mix index. Case mix index (CMI) is a numeric score that measures resource utilization for a specific patient population. CMI is a weighted value assigned to patients based on resource utilization and All Patient Refined Diagnostic Related Group and was included as an indicator of patient illness severity and risk of mortality.[23] Data were obtained from administrative records from the case mix research team at Johns Hopkins Medicine.
To account for transitional differences that may have coincided with the opening of a new hospital wing in late April 2012, we conducted a sensitivity analysis, in which we excluded from analysis any visits that took place in May 2012 to June 2012.
Data Analysis
Based on historical studies, we calculated that a sample size of at least 3600 discharges would allow us to detect a difference of 5% between the pre‐ and postreform period assuming baseline 20% occurrence of dichotomous outcomes (=0.05; =0.2; r=4).[21]
The primary unit of analysis was the hospital discharge. Similar to Horwitz et al., we analyzed data using a difference‐in‐differences estimation strategy.[21] We used multivariable linear regression for length of stay measured as a continuous variable, and multivariable logistic regression for inpatient mortality, 30‐day readmission, MHACs coded as a dichotomous variable, and ICU stay coded as a dichotomous variable.[9] The difference‐in‐differences estimation was used to determine whether the postreform period relative to prereform period was associated with differences in outcomes comparing resident and hospitalist services. In the regression models, the independent variables of interest included an indicator variable for whether a patient was treated on a resident service, an indicator variable for whether a patient was discharged in the postreform period, and the interaction of these 2 variables (resident*postreform). The interaction term can be interpreted as a differential change over time comparing resident and hospitalist services. In all models, we adjusted for patient age, gender, race, and case mix index.
To determine whether prereform trends were similar among the resident and hospitalist services, we performed a test of controls as described by Volpp and colleagues.[6] Interaction terms for resident service and prereform years 2010 and 2011 were added to the model. A Wald test was then used to test for improved model fit, which would indicate differential trends among resident and hospitalist services during the prereform period. Where such trends were found, postreform results were compared only to 2011 rather than the 2009 to 2011 prereform period.[6]
To account for correlation within patients who had multiple discharges, we used a clustering approach and estimated robust variances.[24] From the regression model results, we calculated predicted probabilities adjusted for relevant covariates and prepost differences, and used linear probability models to estimate percentage‐point differences in outcomes, comparing residents and hospitalists in the pre‐ and postreform periods.[25] All analyses were performed using Stata/IC version 11 (StataCorp, College Station, TX).
RESULTS
In the 3 years before the 2011 residency work‐hour reforms were implemented (prereform), there were a total of 15,688 discharges for 8983 patients to the resident services and 4622 discharges for 3649 patients to the hospitalist services. In the year following implementation of residency work‐hour changes (postreform), there were 5253 discharges for 3805 patients to the resident services and 1767 discharges for 1454 patients to the hospitalist service. Table 1 shows the characteristics of patients discharged from the resident and hospitalist services in the pre‐ and postreform periods. Patients discharged from the resident services were more likely to be older, male, African American, and have a higher CMI.
| Resident Services | Hospitalist Service | ||||||||
|---|---|---|---|---|---|---|---|---|---|
| 2009 | 2010 | 2011 | 2012 | 2009 | 2010 | 2011 | 2012 | P Valuea | |
| |||||||||
| Discharges, n | 5345 | 5299 | 5044 | 5253 | 1366 | 1492 | 1764 | 1767 | |
| Unique patients, n | 3082 | 2968 | 2933 | 3805 | 1106 | 1180 | 1363 | 1454 | |
| Age, y, mean (SD) | 55.1 (17.7) | 55.7 (17.4) | 56.4 (17.9) | 56.7 (17.1) | 55.9 (17.9) | 56.2 (18.4) | 55.5 (18.8) | 54 (18.7) | 0.02 |
| Sex male, n (%) | 1503 (48.8) | 1397 (47.1) | 1432 (48.8) | 1837 (48.3) | 520 (47) | 550 (46.6) | 613 (45) | 654 (45) | <0.01 |
| Race | |||||||||
| African American, n (%) | 2072 (67.2) | 1922 (64.8) | 1820 (62.1) | 2507 (65.9) | 500 (45.2) | 592 (50.2) | 652 (47.8) | 747 (51.4) | <0.01 |
| White, n (%) | 897 (29.1) | 892 (30.1) | 957 (32.6) | 1118 (29.4) | 534 (48.3) | 527 (44.7) | 621 (45.6) | 619 (42.6) | |
| Asian, n (%) | 19 (.6%) | 35 (1.2) | 28 (1) | 32 (.8) | 11 (1) | 7 (.6) | 25 (1.8) | 12 (.8) | |
| Other, n (%) | 94 (3.1) | 119 (4) | 128 (4.4) | 148 (3.9) | 61 (5.5) | 54 (4.6) | 65 (4.8) | 76 (5.2) | |
| Case mix index, mean (SD) | 1.2 (1) | 1.1 (0.9) | 1.1 (0.9) | 1.1 (1.2) | 1.2 (1) | 1.1 (1) | 1.1 (1) | 1 (0.7) | <0.01 |
Differences in Outcomes Among Resident and Hospitalist Services Pre‐ and Postreform
Table 2 shows unadjusted results. Patients discharged from the resident services in the postreform period as compared to the prereform period had a higher likelihood of an ICU stay (5.9% vs 4.5%, P<0.01), and lower likelihood of 30‐day readmission (17.1% vs 20.1%, P<0.01). Patients discharged from the hospitalist service in the postreform period as compared to the prereform period had a significantly shorter mean length of stay (4.51 vs 4.88 days, P=0.03)
| Resident Services | Hospitalist Service | |||||
|---|---|---|---|---|---|---|
| Outcome | Prereforma | Postreform | P Value | Prereforma | Postreform | P Value |
| ||||||
| Length of stay (mean) | 4.55 (5.39) | 4.50 (5.47) | 0.61 | 4.88 (5.36) | 4.51 (4.64) | 0.03 |
| Any ICU stay (%) | 225 (4.5%) | 310 (5.9%) | <0.01 | 82 (4.7%) | 83 (4.7%) | 0.95 |
| Any MHACs (%) | 560 (3.6%) | 180 (3.4%) | 0.62 | 210 (4.5%) | 64 (3.6%) | 0.09 |
| Readmit in 30 days (%) | 3155 (20.1%) | 900 (17.1%) | <0.01 | 852 (18.4%) | 296 (16.8%) | 0.11 |
| Inpatient mortality (%) | 71 (0.5%) | 28 (0.5%) | 0.48 | 18 (0.4%) | 7 (0.4%) | 0.97 |
Table 3 presents the results of regression analyses examining correlates of patient safety outcomes, adjusted for age, gender, race, and CMI. As the test of controls indicated differential prereform trends for ICU admission and length of stay, the prereform period was limited to 2011 for these outcomes. After adjustment for covariates, the probability of an ICU stay remained greater, and the 30‐day readmission rate was lower among patients discharged from resident services in the postreform period than the prereform period. Among patients discharged from the hospitalist services, there were no significant differences in length of stay, readmissions, ICU admissions, MHACs, or inpatient mortality comparing the pre‐ and postreform periods.
| Resident Services | Hospitalist Service | Difference in Differences | |||||
|---|---|---|---|---|---|---|---|
| Outcome | Prereforma | Postreform | Difference | Prereform | Postreform | Difference | (ResidentHospitalist) |
| |||||||
| ICU stay | 4.5% (4.0% to 5.1%) | 5.7% (5.1% to 6.3%) | 1.4% (0.5% to 2.2%) | 4.4% (3.5% to 5.3%) | 5.3% (4.3% to 6.3%) | 1.1% (0.2 to 2.4%) | 0.3% (1.1% to 1.8%) |
| Inpatient mortality | 0.5% (0.4% to 0.6%) | 0.5% (0.3% to 0.7%) | 0 (0.2% to 0.2%) | 0.3% (0.2% to 0.6%) | 0.5% (0.1% to 0.8%) | 0.1% (0.3% to 0.5%) | 0.1% (0.5% to 0.3%) |
| MHACs | 3.6% (3.3% to 3.9%) | 3.3% (2.9% to 3.7%) | 0.4% (0.9 to 0.2%) | 4.5% (3.9% to 5.1%) | 4.1% (3.2% to 5.1%) | 0.3% (1.4% to 0.7%) | 0.2% (1.0% to 1.3%) |
| Readmit 30 days | 20.1% (19.1% to 21.1%) | 17.2% (15.9% to 18.5%) | 2.8% (4.3% to 1.3%) | 18.4% (16.5% to 20.2%) | 16.6% (14.7% to 18.5%) | 1.7% (4.1% to 0.8%) | 1.8% (0.2% to 3.7%) |
| Length of stay | 4.6 (4.4 to 4.7) | 4.4 (4.3 to 4.6) | 0.1 (0.3 to 0.1) | 4.9 (4.6 to 5.1) | 4.7 (4.5 to 5.0) | 0.1 (0.4 to 0.2) | 0.01 (0.37 to 0.34) |
Differences in Outcomes Comparing Resident and Hospitalist Services Pre‐ and Postreform
Comparing pre‐ and postreform periods in the resident and hospitalist services, there were no significant differences in ICU admission, length of stay, MHACs, 30‐day readmissions, or inpatient mortality. In the sensitivity analysis, in which we excluded all discharges in May 2012 to June 2012, results were not significantly different for any of the outcomes examined.
DISCUSSION
Using difference‐in‐differences estimation, we evaluated whether the implementation of the 2011 residency work‐hour mandate was associated with differences in patient safety outcomes including length of stay, 30‐day readmission, inpatient mortality, MHACs, and ICU admissions comparing resident and hospitalist services at a large academic medical center. Adjusting for patient age, race, gender, and clinical complexity, we found no significant changes in any of the patient safety outcomes indicators in the postreform period comparing resident to hospitalist services.
Our quasiexperimental study design allowed us to gauge differences in patient safety outcomes, while reducing bias due to unmeasured confounders that might impact patient safety indicators.[9] We were able to examine all discharges from the resident and hospitalist general medicine services during the academic years 2009 to 2012, while adjusting for age, race, gender, and clinical complexity. Though ICU admission was higher and readmission rates were lower on the resident services post‐2011, we did not observe a significant difference in ICU admission or 30‐day readmission rates in the postreform period comparing patients discharged from the resident and hospitalist services and all patients in the prereform period.
Our neutral findings differ from some other single‐institution evaluations of reduced resident work hours, several of which have shown improved quality of life, education, and patient safety indicators.[18, 21, 26, 27, 28] It is unclear why improvements in patient safety were not identified in the current study. The 2011 reforms were more broad‐based than some of the preliminary studies of reduced work hours, and therefore additional variables may be at play. For instance, challenges related to decreased work hours, including the increased number of handoffs in care and work compression, may require specific interventions to produce sustained improvements in patient safety.[3, 14, 29, 30]
Improving patient safety requires more than changing resident work hours. Blum et al. recommended enhanced funding to increase supervision, decrease resident caseload, and incentivize achievement of quality indicators to achieve the goal of improved patient safety within work‐hour reform.[31] Schumacher et al. proposed a focus on supervision, professionalism, safe transitions of care, and optimizing workloads as a means to improve patient safety and education within the new residency training paradigm.[29]
Limitations of this study include limited follow‐up time after implementation of the work‐hour reforms. It may take more time to optimize systems of care to see benefits in patient safety indicators. This was a single‐institution study of a limited number of outcomes in a single department, which limits generalizability and may reflect local experience rather than broader trends. The call schedule on the resident service in this study differs from programs that have adopted night float schedules. [27] This may have had an effect on patient care outcomes.[32] In an attempt to conduct a timely study of inpatient safety indicators following the 2011 changes, our study was not powered to detect small changes in low‐frequency outcomes such as mortality; longer‐term studies at multiple institutions will be needed to answer these key questions. We limited the prereform period where our test of controls indicated differential prereform trends, which reduced power.
As this was an observational study rather than an experiment, there may have been both measured and unmeasured differences in patient characteristics and comorbidity between the intervention and control group. For example, CMI was lower on the hospitalist service than the resident services. Demographics varied somewhat between services; male and African American patients were more likely to be discharged from resident services than hospitalist services for unknown reasons. Although we adjusted for demographics and CMI in our model, there may be residual confounding. Limitations in data collection did not allow us to separate patients initially admitted to the ICU from patients transferred to the ICU from the inpatient floors. We attempted to overcome this limitation through use of a difference‐in‐differences model to account for secular trends, but factors other than residency work hours may have impacted the resident and hospitalist services differentially. For example, hospital quality‐improvement programs or provider‐level factors may have differentially impacted the resident versus hospitalist services during the study period.
Work‐hour limitations for residents were established to improve residency education and patient safety. As noted by the Institute of Medicine, improving patient safety will require significant investment by program directors, hospitals, and the public to keep resident caseloads manageable, ensure adequate supervision of first‐year residents, train residents on safe handoffs in care, and conduct ongoing evaluations of patient safety and any unintended consequences of the regulations.[33] In the first year after implementation of the 2011 work‐hour reforms, we found no change in ICU admission, inpatient mortality, 30‐day readmission rates, length of stay, or MHACs compared with patients treated by hospitalists. Studies of the long‐term impact of residency work‐hour reform are necessary to determine whether changes in work hours have been associated with improvement in resident education and patient safety.
Disclosure: Nothing to report.
- Accreditation Council for Graduate Medical Education. Common program requirements effective: July 1, 2011. Available at: http://www.acgme.org/acgmeweb/Portals/0/PFAssets/ProgramResources/Common_Program_Requirements_07012011[1].pdf. Accessed February 10, 2014.
- , , . The new recommendations on duty hours from the ACGME Task Force. N Engl J Med. 2010;363:e3.
- , , , , . Interns' compliance with Accreditation Council for Graduate Medical Education work‐hour limits. JAMA. 2006;296(9):1063–1070.
- , , , , , . Effects of work hour reduction on residents' lives: a systematic review. JAMA. 2005;294(9):1088–1100.
- , , , et al. Effects of the ACGME duty hour limits on sleep, work hours, and safety. Pediatrics. 2008;122(2):250–258.
- , , . Teaching hospital five‐year mortality trends in the wake of duty hour reforms. J Gen Intern Med. 2013;28(8):1048–1055.
- , , , . Duty hour limits and patient care and resident outcomes: can high‐quality studies offer insight into complex relationships? Ann Rev Med. 2013;64:467–483.
- , , . Patient safety, resident education and resident well‐being following implementation of the 2003 ACGME duty hour rules. J Gen Intern Med. 2011;26(8):907–919.
- , , , et al. Mortality among hospitalized Medicare beneficiaries in the first 2 years following ACGME resident duty hour reform. JAMA. 2007;298(9):975–983.
- , , , et al. Effects of resident duty hour reform on surgical and procedural patient safety indicators among hospitalized Veterans Health Administration and Medicare patients. Med Care. 2009;47(7):723–731.
- , , , et al. Pilot trial of IOM duty hour recommendations in neurology residency programs. Neurology. 2011;77(9):883–887.
- , , , et al. Effect of 16‐hour duty periods of patient care and resident education. Mayo Clin Proc. 2011;86:192–196.
- , , , et al. Effects of the 2011 duty hour reforms on interns and their patients: a prospective longitudinal cohort study. JAMA Intern Med. 2013;173(8):657–662.
- , , , et al. Effect of the 2011 vs 2003 duty hour regulation—compliant models on sleep duration, trainee education, and continuity of patient care among internal medicine house staff. JAMA Intern Med. 2013;173(8):649–655.
- , , . Residents' response to duty‐hour regulations—a follow‐up national survey. N Engl J Med. 2012;366:e35.
- , , , . Surgical residents' perceptions of 2011 Accreditation Council for Graduate Medical Education duty hour regulations. JAMA Surg. 2013;148(5):427–433.
- , , . The 2011 duty hour requirements—a survey of residency program directors. N Engl J Med. 2013;368:694–697.
- , , , et al. The effect of reducing maximum shift lengths to 16 hours on internal medicine interns' educational opportunities. Acad Med. 2013;88(4):512–518.
- , . Residency work‐hours reform. A cost analysis including preventable adverse events. J Gen Intern Med. 2005;20(10):873–878.
- , , , , . Cost implications of reduced work hours and workloads for resident physicians. N Engl J Med. 2009;360:2202–2215.
- , , , . Changes in outcomes for internal medicine inpatients after work‐hour regulations. Ann Intern Med. 2007;147:97–103.
- .Maryland Health Services Cost Review Commission. Complications: Maryland Hospital Acquired Conditions. Available at: http://www.hscrc.state.md.us/init_qi_MHAC.cfm. Accessed May 23, 2013.
- , , , et al. What are APR‐DRGs? An introduction to severity of illness and risk of mortality adjustment methodology. 3M Health Information Systems. Available at: http://solutions.3m.com/3MContentRetrievalAPI/BlobServlet?locale=it_IT44(4):1049–1060.
- , , , , . Impact of the 2008 US Preventive Services Task Force Recommendation to discontinue prostate cancer screening among male Medicare beneficiaries. Arch Intern Med. 2012;172(20):1601–1603.
- , , , et al. Effect of reducing interns' work hour on serious medical errors in intensive care units. N Engl J Med. 2004;351(18):1838–1848.
- , , . Effects of reducing or eliminating resident work shifts over 16 hours: a systematic review. Sleep. 2010;33(8):1043–1053.
- , , , et al. Impact of duty hours restrictions on quality of care and clinical outcomes. Am J Med. 2007;120(11):968–974.
- , , , , , . Beyond counting hours: the importance of supervision, professionalism, transitions in care, and workload in residency training. Acad Med. 2012;87(7):883–888.
- , , , , , . One possible future for resident hours: interns' perspective on a one‐month trial of the Institute of Medicine recommended duty hour limits. J Grad Med Educ. 2009;1(2):185–187.
- , , , , . Implementing the 2009 Institute of Medicine recommendations on resident physician work hours, supervision, and safety. Nature Sci Sleep. 2001;3:47–85.
- , . Night float teaching and learning: perceptions of residents and faculty. J Grad Med Educ. 2010;2(2):236–241.
- Institute of Medicine. Resident duty hours: enhancing sleep, supervision, and safety. Report brief. Washington, DC: National Academies; 2008. Available at: http://www.iom.edu/∼/media/Files/Report Files/2008/Resident‐Duty‐Hours/residency hours revised for web.pdf. Accessed May 23, 2013.
© 2014 Society of Hospital Medicine
ACO Insider: Anatomy of an independent primary care ACO, part 1
While concepts and theories can go a long way, sometimes the best way to understand something is through a concrete example.
So, from time to time, ACO Insider will check in on a new accountable care organization composed of 14 independent physicians in 11 practices in McAllen, Tex.
We chose them because they share many of the same questions and concerns as quite a few of you readers: Will this work? Where do I begin? How can we do this, since we have no free time or money? How much will this cost? Will there be any shared savings? Do we have to affiliate with a hospital or a large practice? Are we too small? How do we apply for the Medicare Shared Savings Program (MSSP)? What will change in my practice?
The name of the ACO is Rio Grande Valley Health Alliance (RGVHA). It was formed in January 2012 as a "network-model" ACO, meaning that the physicians stay in their separate independent practices but participate in the ACO through contract. Its first – and as of this writing, only – ACO payer contract is with Medicare, the MSSP.
So far, there have been a number of unexpected highs and a number of unexpected lows. The primary care physicians of RGVHA hope that by sharing their story, they can help you better navigate your own ACO course.
Opportunity for primary care
Dr. Luis Delgado became intrigued by the possibility under accountable care of rewarding primary care physicians for the savings they generate while maintaining or improving quality. Instead of resisting change, he saw opportunity.
He also saw a chance to do something about McAllen’s reputation, gained through Dr. Atul Gawande’s 2009 article in the New Yorker entitled, "The Cost Conundrum." That article focused on McAllen’s Medicare health costs, which were almost twice those of its Rio Grande River neighbor, El Paso.
However, beyond having a vision, he had no know-how and no budget.
Fortunately, as readers of this column know, there is so much documented "low-hanging fruit" for primary care to generate savings through value-based care that the strategic time and expertise expenditures proved not to be significant. The legal structure and backroom business logistics for a small network-model primary care physician ACO are also relatively straightforward. RGVHA has two full-time administrative staffers, one part-time president (Dr. Delgado), and one part-time medical director (Dr. Roger Heredia).
However, the new ACO data collection, sorting, and reporting requirements were somewhat daunting – that is, until they met Dr. Gretchen Hoyle of MD Online Solutions (MDOS). Dr. Hoyle is a practicing pediatrician who spearheaded the design of a physician-friendly care management data system for her practice and found it ideal for the accountable care era. Her company targets small- to medium-sized physician-led ACOs.
MDOS was able to tailor a nimble ACO solution scaled to RGVHA’s needs, thus allowing RGVHA to supply its last missing piece in a cost-effective manner. Because she is a practicing physician, Dr. Hoyle helps interpret the data and leads a weekly data-driven staff conference call with the ACO’s nurse care coordinators.
Approved for the Medicare ACO
Despite initial fears, RGVHA found that the MSSP application process was not intimidating at all. It turned out to be a reflection of its business structure and primary care physician ACO strategy.
"If you get your game plan together ahead of time, independent primary care physicians should be successful in applying for the Medicare Shared Savings Program," stated Dr. Delgado. "We found that Medicare is supportive of this type of ACO, I guess because it sees their potential to improve health care," he said.
The Centers for Medicare & Medicaid Services does indeed support these types of ACOs, as RGVHA qualified for one of the last Advanced Payment Program grants. The CMS is so confident that these physician-led, nonmetropolitan ACOs will work, that the agency actually fronted the infrastructure and operational money to them. RGVHA was one of the last grantees of this one-time appropriation.
They began the MSSP program Jan. 1, 2013, opting not to take risk and to receive 50% of the savings they generated for the 5,000 patients attributed to them, if quality and patient satisfaction metrics are met.
‘I haven’t had this much fun practicing medicine in 10 years!’
To decide what type of initiatives to undertake, the physicians read the Physician’s Accountable Care Toolkit (profiled in an earlier column) and convened a weekend workshop. They were pleasantly surprised when they realized that so many savings and quality improvement opportunities are available to primary care physicians under accountable care – and control over the physician-patient relationship was being returned to them.
They targeted diabetes management, patient engagement, best practices for enhanced prevention and wellness, and home health management.
One physician summed up the mood when she exclaimed, "I haven’t had this much fun practicing medicine in 10 years."
As they celebrate their first year under the MSSP, how are they doing? Check in next month for part 2: Our secret weapon, and our biggest disappointment.
Mr. Bobbitt is a senior partner and head of the Health Law Group at the Smith Anderson law firm in Raleigh, N.C. He has many years’ experience assisting physicians in forming integrated delivery systems. He has spoken and written nationally to primary care physicians on the strategies and practicalities of forming or joining ACOs. This article is meant to be educational and does not constitute legal advice. For additional information, readers may contact the author at [email protected] or at 919-821-6612.

Insight and involuntary outpatient treatment
In my last column, I summarized a lecture given by Jeffrey Swanson, Ph.D., a medical sociologist who studies outcomes with outpatient civil commitment. Several readers posted comments, including a very articulate letter from Evelyn Burton, a patient advocate who is on the Public Policy Committee of the National Alliance on Mental Illness–Maryland (NAMI MD).
Ms. Burton, along with one or two other commenters, believed that I missed the point of "assisted outpatient treatment" (AOT) and did not understand the target population; and I will contend that, with 20 years of experience in four community mental health centers, including Baltimore’s Health Care for the Homeless, I do understand that there are some people who might do better if forced to undergo treatment. I also understand that the consequences of untreated mental illness can be both trying and tragic for the patients and their families.
Because Maryland has not legalized forced outpatient care, I do not have experience with this, and I was struck by the fact that Dr. Swanson felt that much of the benefit of forcing treatment could be explained by the way AOT obligates society to the patient by granting these patients case management services, housing, and access to mental health care – things that society is not obligated to provide for those with severe psychotic disorders who willingly seek care. Done poorly, AOT is often unenforceable and poorly funded, and laws may be written such that the intended target population – the sickest, most psychotic members of society who cycle in and out of hospitals due to their noncompliance – are not clearly identified as those to receive "assisted" treatment.
While we may agree or disagree as to whether AOT is helpful and under what circumstances and whether it benefits those who might otherwise end up on the streets, in jail, or dead, the truth is that states with AOT still have psychotic people living on the streets and eating from the garbage. AOT has not proven to be a panacea for homelessness, suicide, or wasted lives. I realize that to a parent who fears her child might join those ranks, the heartbreak is immense, and the anecdotes about forced treatment offer hope.
I have no doubt that there are times when AOT, together with its attendant services, provides a lifeline. It’s unfortunate – if not disgraceful – that these services are not routinely provided to our sickest members of society. Still, it’s important to make sure that any given patient’s civil rights be considered. I’m also well aware that there are people who believe that a discussion of civil rights has no place in the treatment of psychosis, and there we will need to respectfully disagree.
While Ms. Burton’s heartfelt letter was articulate and compelling, I have to say that I was taken back by one paragraph. I expressed concern that patients do not generally endorse involuntary treatments, and I suggested that we need to look at why the treatments we offer are not palatable to those receiving forced care.
Ms. Burton responded:
"You do not need to waste your time trying to figure out why your treatment is not palatable to this particular group of individuals. NAMI MD families can tell you, you are asking the wrong question. It has nothing to do with palatable services and everything to do with anosognosia."
I was baffled by this. Compliant patients with good insight complain about side effects. If they take antipsychotic medications, they sometimes feel sedated, and they are told of the risks of weight gain, diabetes, and hyperlipidemia, conditions that can decrease both the quality and length of their lives. Sometimes we have little choice and are left to say that we believe the benefit to the patient is worth the trade-off, but with voluntary patients, the ultimate decision is theirs. Sometimes patients talk with their feet. Sometimes they fare better without medications, therapy, and the other treatments we have to offer, and sometimes they fare catastrophically worse. If they always did better, lived fuller, healthier, happier, and longer lives with the treatments we offer, the choice would be simple. Unfortunately, the medications we offer to treat psychosis are not benign.
The idea that "anosognosia," or simply lack of insight, is the pivotal issue, is a difficult one. People with substance abuse disorders, especially alcoholism and cannabis abuse, may insist that their use of these intoxicants is consistent with the societal norms around them and deny that it’s a problem, despite the difficulties it brings to them. And people with major mental illnesses may deny their existence, but still come to appointments and take prescribed medications. Patients can lack insight at one point in time and gain it later. The issue should not be the patient’s insight, because that label may be stamped on anyone who simply disagrees with their diagnosis or treatment recommendations.
The risk of labeling people with anosognosia is that we might cease to see them as humans, that we might write off their resistance to treatment as simply an inability to know what’s best for them, in a way that enables us to close our ears to what may well be their valid concerns. It may become too easy to say that the court order calls for the medications, and changing doses or medications to alter the risks or the side-effect profile is no longer part of the effort. Such a mind-set may lead the psychiatrist to complacence and disregard for the patient’s concerns.
Why take the time to know the patient, to develop rapport, to convince the patient to come to therapy and to try medications on his terms, when a court order might cut all those corners and a nurse can administer an injection? That’s not the targeted group of patients, you say, that’s not whom AOT captures. If we’re not careful – if we feel that addressing the concerns of our patients is simply a "waste of time" because, after all, they have no insight – then we risk losing sight of what needs to be our real goal: helping patients to live the lives they want to live in productive and meaningful ways. Forcing treatment may get one person help at a particular period in time, but it comes with a cost: It leaves some patients afraid to seek voluntary care for fear of what may occur down the line, and it stigmatizes our profession. Finally, it makes us the adversaries of the patients we serve.
It would be easy to read this and think I’m against involuntary outpatient treatment, and that’s not completely true (ah, it’s mostly true). If involuntary treatment is limited to those patients who cycle in and out of hospitals and jails because of noncompliance, who become dangerous when ill, for whom treatment has proven to be effective, and who have failed thoughtful attempts at voluntary care, then forced care with its array of ancillary services and housing provisions may be a reasonable resource, regardless of the patient’s level of insight. Still, I remain interested in making our treatments more palatable to all of our patients – those who are forced into care as well as those who come willingly – and I believe it’s a mistake to see that effort as a waste of anyone’s time.
Dr. Miller is a coauthor of "Shrink Rap: Three Psychiatrists Explain Their Work" (Baltimore: The Johns Hopkins University Press, 2011).

Photodynamic therapy: ‘Often not worth the trouble’
WAIKOLOA, HAWAII – Just because a dermatologist has photodynamic therapy equipment in the office doesn’t mean it should be applied to every skin condition that comes through the door, Dr. Jerome M. Garden cautioned at the Hawaii Dermatology Seminar sponsored by the Global Academy for Medical Education/Skin Disease Education Foundation.
"Used selectively, I think PDT can be truly worthwhile in some of our patients. But we run into problems when we decide it’s a cure-all for everything. Just because it’s available does not always make it the best choice around," said Dr. Garden, who is director of the Physicians Laser and Dermatology Institute as well as a professor of clinical dermatology and biomedical engineering at Northwestern University in Chicago.
Looking through the literature, it’s quickly apparent that PDT has been used to treat a bewildering array of dermatologic disorders, in most cases with less than stellar results.

"In my practice, I’m using PDT to treat just two things: actinic keratoses and actinic cheilitis, which is a close cousin. Why am I not using it to treat more disease processes? Because it has to be worth it. PDT is not simple to do. It takes a lot of your time and it costs you money. Insurance doesn’t necessarily help you with this. Either the patient’s insurance will reimburse you at an incredibly low rate, where it’s basically costing you money to do it, or you go outside of the insurance – and PDT is an expensive procedure," he noted.
The substantial time expenditure involved in PDT stems from the need to use microdermabrasion or another method of skin preparation to help the topical photosensitizing agent penetrate better. This is followed by an incubation time of 1-3 hours as the photosensitizer finds its target, and then light therapy to create the reactive oxygen species, which kills the targeted cells. The duration of light therapy is source dependent; blue light, for example, must be applied for 15-20 minutes.
PDT has other shortcomings in addition to the cost and time involved. It can be painful and entails several days of down time because of scaling and crusting. Plus, multiple treatment sessions are usually required, the dermatologist continued.
The 2012 American Society for Dermatologic Surgery member survey found that dermatologic surgeons performed roughly 205,000 PDT procedures during the year. The bulk was for actinic keratoses, acne, and rosacea.
"I didn’t even know until I saw this list that anybody treats rosacea with PDT," noted Dr. Garden. "A lot of people out there who are doing PDT use it for many more things than I do. But I’m just telling you what I do."
"I’ve tried it for acne. It helps, but depending on the light source, it can be a painful procedure. There’s a lot of desquamation afterward, and you have to go through it a few times. So you have to have a highly motivated patient – and even then, it doesn’t work all the time," he said.
Dr. Garden cited a Danish split-face study of pulsed-dye laser-assisted PDT vs. pulsed-dye laser therapy alone. Twelve weeks after completing three treatment sessions, the PDT side showed an 80% reduction in inflammatory acne lesions, compared with a 67% drop with pulsed-dye laser, and a 53% decrease in noninflammatory lesions compared to a 42% reduction with laser alone (J. Am. Acad. Dermatol. 2008; 58:387-94).
"Even without the topical photosensitizer, patients did pretty well," he commented.
As for PDT in cutaneous malignancies, Dr. Garden highlighted a recent literature review by dermatologists at the University of South Florida, Tampa, which concluded that the therapy is equivalent or superior to cryosurgery for actinic keratoses. The investigators also deemed PDT suitable for Bowen’s disease lesions provided they are large, widespread, or on difficult to treat areas, as well as for squamous cell carcinomas, but only when surgery is contraindicated. PDT may also provide better cosmetic outcomes than surgery or cryosurgery for superficial basal cell carcinomas (Dermatol. Surg. 2013;39:1733-44).
Dr. Garden called PDT his current first-line treatment for actinic cheilitis.
"I used to use the CO2 laser exclusively. It works very well, much better than PDT. But when I’d strip off the top layer of skin with the CO2 laser, patients would end up with an open wound that took a long time to heal. That’s hard for the patient to tolerate. And occasionally we’d see fibrosis of the lip. You don’t see that with PDT, although with PDT you usually need to do two or three treatments, and the area is red and swollen for 2-4 days. I like PDT. It’s my go-to therapy. When it fails, I turn on the CO2 laser," he said.
In treating actinic keratoses, he reserves PDT for patients with numerous lesions over a large field.
"It does work, but it’s a lot of effort. So if you’re just going after a handful of [actinic keratoses] do you need PDT? Probably not," Dr. Garden said.
Ending on an encouraging note, the dermatologist pointed to the ongoing substantial research commitment to PDT as very promising. Finding more specific photosensitizers is a priority. And ablative fractional laser-assisted delivery of the standard photosensitizer methyl aminolevulinic acid appears to be "an exciting development," in Dr. Garden’s view, although to date the work is limited to animal studies.
Dr. Garden reported having financial relationships with Alma, Candela & Syneron, and Palomar/Cynosure.
The SDEF and this news organization are owned by the same parent company.
WAIKOLOA, HAWAII – Just because a dermatologist has photodynamic therapy equipment in the office doesn’t mean it should be applied to every skin condition that comes through the door, Dr. Jerome M. Garden cautioned at the Hawaii Dermatology Seminar sponsored by the Global Academy for Medical Education/Skin Disease Education Foundation.
"Used selectively, I think PDT can be truly worthwhile in some of our patients. But we run into problems when we decide it’s a cure-all for everything. Just because it’s available does not always make it the best choice around," said Dr. Garden, who is director of the Physicians Laser and Dermatology Institute as well as a professor of clinical dermatology and biomedical engineering at Northwestern University in Chicago.
Looking through the literature, it’s quickly apparent that PDT has been used to treat a bewildering array of dermatologic disorders, in most cases with less than stellar results.
"In my practice, I’m using PDT to treat just two things: actinic keratoses and actinic cheilitis, which is a close cousin. Why am I not using it to treat more disease processes? Because it has to be worth it. PDT is not simple to do. It takes a lot of your time and it costs you money. Insurance doesn’t necessarily help you with this. Either the patient’s insurance will reimburse you at an incredibly low rate, where it’s basically costing you money to do it, or you go outside of the insurance – and PDT is an expensive procedure," he noted.
The substantial time expenditure involved in PDT stems from the need to use microdermabrasion or another method of skin preparation to help the topical photosensitizing agent penetrate better. This is followed by an incubation time of 1-3 hours as the photosensitizer finds its target, and then light therapy to create the reactive oxygen species, which kills the targeted cells. The duration of light therapy is source dependent; blue light, for example, must be applied for 15-20 minutes.
PDT has other shortcomings in addition to the cost and time involved. It can be painful and entails several days of down time because of scaling and crusting. Plus, multiple treatment sessions are usually required, the dermatologist continued.
The 2012 American Society for Dermatologic Surgery member survey found that dermatologic surgeons performed roughly 205,000 PDT procedures during the year. The bulk was for actinic keratoses, acne, and rosacea.
"I didn’t even know until I saw this list that anybody treats rosacea with PDT," noted Dr. Garden. "A lot of people out there who are doing PDT use it for many more things than I do. But I’m just telling you what I do."
"I’ve tried it for acne. It helps, but depending on the light source, it can be a painful procedure. There’s a lot of desquamation afterward, and you have to go through it a few times. So you have to have a highly motivated patient – and even then, it doesn’t work all the time," he said.
Dr. Garden cited a Danish split-face study of pulsed-dye laser-assisted PDT vs. pulsed-dye laser therapy alone. Twelve weeks after completing three treatment sessions, the PDT side showed an 80% reduction in inflammatory acne lesions, compared with a 67% drop with pulsed-dye laser, and a 53% decrease in noninflammatory lesions compared to a 42% reduction with laser alone (J. Am. Acad. Dermatol. 2008; 58:387-94).
"Even without the topical photosensitizer, patients did pretty well," he commented.
As for PDT in cutaneous malignancies, Dr. Garden highlighted a recent literature review by dermatologists at the University of South Florida, Tampa, which concluded that the therapy is equivalent or superior to cryosurgery for actinic keratoses. The investigators also deemed PDT suitable for Bowen’s disease lesions provided they are large, widespread, or on difficult to treat areas, as well as for squamous cell carcinomas, but only when surgery is contraindicated. PDT may also provide better cosmetic outcomes than surgery or cryosurgery for superficial basal cell carcinomas (Dermatol. Surg. 2013;39:1733-44).
Dr. Garden called PDT his current first-line treatment for actinic cheilitis.
"I used to use the CO2 laser exclusively. It works very well, much better than PDT. But when I’d strip off the top layer of skin with the CO2 laser, patients would end up with an open wound that took a long time to heal. That’s hard for the patient to tolerate. And occasionally we’d see fibrosis of the lip. You don’t see that with PDT, although with PDT you usually need to do two or three treatments, and the area is red and swollen for 2-4 days. I like PDT. It’s my go-to therapy. When it fails, I turn on the CO2 laser," he said.
In treating actinic keratoses, he reserves PDT for patients with numerous lesions over a large field.
"It does work, but it’s a lot of effort. So if you’re just going after a handful of [actinic keratoses] do you need PDT? Probably not," Dr. Garden said.
Ending on an encouraging note, the dermatologist pointed to the ongoing substantial research commitment to PDT as very promising. Finding more specific photosensitizers is a priority. And ablative fractional laser-assisted delivery of the standard photosensitizer methyl aminolevulinic acid appears to be "an exciting development," in Dr. Garden’s view, although to date the work is limited to animal studies.
Dr. Garden reported having financial relationships with Alma, Candela & Syneron, and Palomar/Cynosure.
The SDEF and this news organization are owned by the same parent company.
EXPERT ANALYSIS FROM SDEF HAWAII DERMATOLOGY SEMINAR

Study reveals potential target for mucositis, GVHD prevention

Results of preclinical research point to a possible way of preventing mucositis, graft-vs-host disease, and other disorders associated with epithelial permeability.
Investigators created a mouse model of mucositis and discovered that interleukin-1 (IL-1) beta, a protein secreted by the stressed mucosa, played an important role in the condition.
But inhibiting IL-1 beta alleviated mucositis. So the researchers speculated that targeting IL-1 beta might prevent mucositis in humans.
Naama Kanarek, a doctoral student at Hebrew University Hadassah Medical School in Jerusalem, and her colleagues described this research in PNAS.
The investigators began by generating a mouse model deficient in a gene encoding the enzyme beta-TrCP. They chose this enzyme because it’s a major regulator of inflammatory cascades.
The team found that beta-TrCP deletion in the gut caused mucosal DNA damage in the mice, mimicking the effects of chemotherapy and irradiation. Similar to human patients, a severe mucositis reaction occurred in mice that were genetically engineered to be beta-TrCP-deficient.
Tracing the pathological basis of the mouse mucositis revealed that the source of the problem was IL-1 beta. IL-1 beta opened the gut lining, allowing gut bacteria to penetrate and destroy the gut interior.
To confirm this finding, the researchers treated mice with an antibody neutralizing IL-1 beta prior to deleting beta-TrCP. They found this prevented the onset of mucositis.
Therefore, the team has proposed that IL-1 receptor agonists should be tested as mucositis prophylaxis in humans. An example is anakinra (Kineret), which is used to treat chronic inflammatory conditions, such as rheumatoid arthritis and Crohn’s disease.
The investigators believe such treatments might also be used to prevent graft-vs-host disease, burn injuries, head and neck trauma, and other disorders associated with
epithelial permeability. ![]()