User login
Pandemic adds more weight to burden of obesity in children
according to a new report from the Robert Wood Johnson Foundation.

“Our nation’s safety net is fragile, outdated, and out of reach for millions of eligible kids and caregivers,” said Jamie Bussel, senior program officer at the RWJF, and senior author of the report. She added that the pandemic further fractured an already broken system that disproportionately overlooks “children of color and those who live farthest from economic opportunity”.
It’s time to think ‘bigger and better’
Ms. Bussel said, during a press conference, that congress responded to the pandemic with “an array of policy solutions,” but it’s now time to think ‘bigger and better.’
“There have been huge flexibilities deployed across the safety net program and these have been really important reliefs, but the fact is many of them are temporary emergency relief measures,” she explained.
For the past 3 years, the RWJF’s annual State of Childhood Obesity report has drawn national and state obesity data from large surveys including the National Survey of Children’s Health, the Youth Risk Behavior Surveillance System, the WIC Participant and Program Characteristics Survey, and the National Health and Nutrition Examination Survey.
Similar to in past years, this year’s data show that rates of obesity and overweight have remained relatively steady and have been highest among minority and low-income populations. For example, data from the 2019-2020 National Survey of Children’s Health, along with an analysis conducted by the Health Resources and Services Administration’s Maternal and Child Health Bureau, show that one in six – or 16.2% – of youth aged 10-17 years have obesity.
While non-Hispanic Asian children had the lowest obesity rate (8.1%), followed by non-Hispanic White children (12.1%), rates were significantly higher for Hispanic (21.4%), non-Hispanic Black (23.8%), and non-Hispanic American Indian/Alaska Native (28.7%) children, according to the report.
“Additional years of data are needed to assess whether obesity rates changed after the onset of the pandemic,” explained Ms. Bussel.
Digging deeper
Other studies included in this year’s report were specifically designed to measure the impact of the pandemic, and show a distinct rise in overweight and obesity, especially in younger children. For example, a retrospective cohort study using data from Kaiser Permanente Southern California showed the rate of overweight and obesity in children aged 5-11 years rose to 45.7% between March 2020 and January 2021, up from 36.2% before the pandemic.
Another of these studies, which was based on national electronic health records of more than 430,000 children, showed the obesity rate crept from 19.3% to 22.4% between August 2019 and August 2020.
“The lid we had been trying desperately to put on the obesity epidemic has come off again,” said Sandra G Hassink, MD, MSc, who is medical director of the American Academy of Pediatrics Institute for Healthy Childhood Weight.
“In the absence of COVID we had been seeing slow upticks in the numbers – and in some groups we’d been thinking maybe we were headed toward stabilization – but these numbers blow that out of the water ... COVID has escalated the rates,” she said in an interview.
“Unfortunately, these two crises – the COVID pandemic, the childhood obesity epidemic – in so many ways have exacerbated one another,” said Ms. Bussel. “It’s not a huge surprise that we’re seeing an increase in childhood obesity rates given the complete and utter disruption of every single system that circumscribes our lives.”
The systems that feed obesity
Addressing childhood obesity requires targeting far beyond healthy eating and physical activity, Ms. Bussel said.
“As important is whether that child has a safe place to call home. Does mom or dad or their care provider have a stable income? Is there reliable transportation? Is their access to health insurance? Is there access to high-quality health care? ... All of those factors influence the child and the family’s opportunities to live well, be healthy, and be at a healthy weight,” she noted.
The report includes a list of five main policy recommendations.
- Making free, universal school meal programs permanent.
- Extending eligibility for WIC, the Special Supplemental Nutrition Program for Women, Infants, and Children, to postpartum mothers and to children through age 6.
- Extending and expanding other programs, such as the Child Tax Credit.
- Closing the Medicaid coverage gap.
- Developing a consistent approach to collecting obesity data organized by race, ethnicity, and income level.
“Collectively, over at least the course of the last generation or two, our policy approach to obesity prevention has not been sufficient. But that doesn’t mean all of our policy approaches have been failures,” Ms. Bussel said during an interview. “Policy change does not always need to be dramatic to have a real impact on families.”
Fighting complacency
For Dr. Hassink, one of the barriers to change is society’s level of acceptance. She said an identifiable explanation for pandemic weight gain doesn’t mean society should simply shrug it off.
“If we regarded childhood obesity as the population level catastrophe that it is for chronic disease maybe people would be activated around these policy changes,” she said.
“We’re accepting a disease process that wreaks havoc on people,” noted Dr. Hassink, who was not involved in the new report. “I think it’s hard for people to realize the magnitude of the disease burden that we’re seeing. If you’re in a weight management clinic or any pediatrician’s office you would see it – you would see kids coming in with liver disease, 9-year-olds on [continuous positive airway pressure] for sleep apnea, kids needing their hips pinned because they had a hip fracture because of obesity.
“So, those of us that see the disease burden see what’s behind those numbers. The sadness of what we’re talking about is we know a lot about what could push the dial and help reduce this epidemic and we’re not doing what we already know,” added Dr. Hassink.
Ms. Bussel and Dr. Hassink reported no conflicts.
according to a new report from the Robert Wood Johnson Foundation.
“Our nation’s safety net is fragile, outdated, and out of reach for millions of eligible kids and caregivers,” said Jamie Bussel, senior program officer at the RWJF, and senior author of the report. She added that the pandemic further fractured an already broken system that disproportionately overlooks “children of color and those who live farthest from economic opportunity”.
It’s time to think ‘bigger and better’
Ms. Bussel said, during a press conference, that congress responded to the pandemic with “an array of policy solutions,” but it’s now time to think ‘bigger and better.’
“There have been huge flexibilities deployed across the safety net program and these have been really important reliefs, but the fact is many of them are temporary emergency relief measures,” she explained.
For the past 3 years, the RWJF’s annual State of Childhood Obesity report has drawn national and state obesity data from large surveys including the National Survey of Children’s Health, the Youth Risk Behavior Surveillance System, the WIC Participant and Program Characteristics Survey, and the National Health and Nutrition Examination Survey.
Similar to in past years, this year’s data show that rates of obesity and overweight have remained relatively steady and have been highest among minority and low-income populations. For example, data from the 2019-2020 National Survey of Children’s Health, along with an analysis conducted by the Health Resources and Services Administration’s Maternal and Child Health Bureau, show that one in six – or 16.2% – of youth aged 10-17 years have obesity.
While non-Hispanic Asian children had the lowest obesity rate (8.1%), followed by non-Hispanic White children (12.1%), rates were significantly higher for Hispanic (21.4%), non-Hispanic Black (23.8%), and non-Hispanic American Indian/Alaska Native (28.7%) children, according to the report.
“Additional years of data are needed to assess whether obesity rates changed after the onset of the pandemic,” explained Ms. Bussel.
Digging deeper
Other studies included in this year’s report were specifically designed to measure the impact of the pandemic, and show a distinct rise in overweight and obesity, especially in younger children. For example, a retrospective cohort study using data from Kaiser Permanente Southern California showed the rate of overweight and obesity in children aged 5-11 years rose to 45.7% between March 2020 and January 2021, up from 36.2% before the pandemic.
Another of these studies, which was based on national electronic health records of more than 430,000 children, showed the obesity rate crept from 19.3% to 22.4% between August 2019 and August 2020.
“The lid we had been trying desperately to put on the obesity epidemic has come off again,” said Sandra G Hassink, MD, MSc, who is medical director of the American Academy of Pediatrics Institute for Healthy Childhood Weight.
“In the absence of COVID we had been seeing slow upticks in the numbers – and in some groups we’d been thinking maybe we were headed toward stabilization – but these numbers blow that out of the water ... COVID has escalated the rates,” she said in an interview.
“Unfortunately, these two crises – the COVID pandemic, the childhood obesity epidemic – in so many ways have exacerbated one another,” said Ms. Bussel. “It’s not a huge surprise that we’re seeing an increase in childhood obesity rates given the complete and utter disruption of every single system that circumscribes our lives.”
The systems that feed obesity
Addressing childhood obesity requires targeting far beyond healthy eating and physical activity, Ms. Bussel said.
“As important is whether that child has a safe place to call home. Does mom or dad or their care provider have a stable income? Is there reliable transportation? Is their access to health insurance? Is there access to high-quality health care? ... All of those factors influence the child and the family’s opportunities to live well, be healthy, and be at a healthy weight,” she noted.
The report includes a list of five main policy recommendations.
- Making free, universal school meal programs permanent.
- Extending eligibility for WIC, the Special Supplemental Nutrition Program for Women, Infants, and Children, to postpartum mothers and to children through age 6.
- Extending and expanding other programs, such as the Child Tax Credit.
- Closing the Medicaid coverage gap.
- Developing a consistent approach to collecting obesity data organized by race, ethnicity, and income level.
“Collectively, over at least the course of the last generation or two, our policy approach to obesity prevention has not been sufficient. But that doesn’t mean all of our policy approaches have been failures,” Ms. Bussel said during an interview. “Policy change does not always need to be dramatic to have a real impact on families.”
Fighting complacency
For Dr. Hassink, one of the barriers to change is society’s level of acceptance. She said an identifiable explanation for pandemic weight gain doesn’t mean society should simply shrug it off.
“If we regarded childhood obesity as the population level catastrophe that it is for chronic disease maybe people would be activated around these policy changes,” she said.
“We’re accepting a disease process that wreaks havoc on people,” noted Dr. Hassink, who was not involved in the new report. “I think it’s hard for people to realize the magnitude of the disease burden that we’re seeing. If you’re in a weight management clinic or any pediatrician’s office you would see it – you would see kids coming in with liver disease, 9-year-olds on [continuous positive airway pressure] for sleep apnea, kids needing their hips pinned because they had a hip fracture because of obesity.
“So, those of us that see the disease burden see what’s behind those numbers. The sadness of what we’re talking about is we know a lot about what could push the dial and help reduce this epidemic and we’re not doing what we already know,” added Dr. Hassink.
Ms. Bussel and Dr. Hassink reported no conflicts.
Failure to communicate ‘doc-to-doc’ blamed for patient’s death
alleging that his death would have been avoided had there been better communication between the surgical oncologist and the treatment team.
The patient was a 49-year-old man who was experiencing chronic pain in his right ear. He saw a local ear, nose, and throat specialist, who could find no apparent cause after conducting a physical exam.
A CT scan revealed a 1.4-cm mass in the right pharyngeal space. A 1.6-cm lymph node in the right retropharyngeal/parapharyngeal carotid space was affected.
The following week, the patient underwent a positron-emission tomography scan and was subsequently referred to a head and neck surgical oncologist.
The surgeon performed a right radical tonsillectomy and pharyngectomy. During the surgery, the patient experienced significant bleeding complications. The surgeon was able to remove the tonsillar mass but could not resect the affected lymph node, owing to its proximity to the carotid artery. The affected lymph node was not removed, and the patient was informed that the problem would be addressed at another time.
Pathology revealed stage III squamous cell carcinoma (T3N0M0) that was HPV/p16 positive.
According to the lawsuit, which was reported in Expert Witness Newsletter, a critical error occurred.
The surgical oncologist apparently did not clearly communicate the situation to the rest of the clinicians involved in the patient’s care. The patient was treated as if the entire cancer had been surgically resected. He never underwent follow-up surgery to address the enlarged lymph node.
Because the care team believed that the patient had undergone a complete surgical resection, follow-up treatment consisted of radiotherapy without concurrent chemotherapy.
The patient underwent radiotherapy to a dose of 60 Gy over 30 treatment days.
About 5 months later, the patient once again presented with ear pain on the right side and difficulty speaking. Imaging showed that there was recurrence of a mass in his right parapharyngeal carotid space. Biopsy results indicated recurrent/progressive squamous cell carcinoma. The patient underwent a second round of radiotherapy. This time, he received concurrent chemotherapy.
Four months later, the patient presented to the emergency department complaining of episodes of syncope. Imaging revealed that the mass in his right parapharyngeal carotid space had increased in size, causing carotid stenosis. The patient was hospitalized for 4 days and was treated with steroids. The day after his discharge, he died at home.
Carotid blowout syndrome due to negligence
An autopsy was performed, and the cause of death was determined to be an acute massive bleed secondary to perforation of the right artery, which was “encased by a partially necrotic poorly differentiated squamous cell carcinoma.” This is known as carotid blowout syndrome.
After his death, the patient’s family contacted an attorney, who hired several expert witnesses to review the case. The alleged negligence by the head and neck oncologist was described as follows:
- There was a failure to appropriately assess the patient’s neck anatomy, and the entire tumor was not surgically removed.
- Frank disease tissue was left behind, and the disease subsequently progressed.
- The surgery was never completed; the cancer progressed and ultimately took the patient’s life.
- There was a failure to communicate the fact that the cancer had not been completely resected.
The alleged negligence by the radiation oncologist was described as follows:
- There was a failure to realize that the tumor had not been completely resected.
- The patient was given a suboptimal radiation dose of 60 Gy, which would have been appropriate only had the tumor been completely resected.
- There was a failure to give a radiation dose of 70 Gy (ie, the appropriate dose for remaining tumor).
The medical oncologist was alleged to have been negligent because chemotherapy was not given when indicated.
Very high stakes
None of the treating physicians were named in the lawsuit. Only the medical center where the treatment was given was named. The center is affiliated with an Ivy League university.
The patient was an extremely wealthy man who had worked as an insurance executive and investor. His premature death resulted in the loss of a massive amount of earnings, and the plaintiffs asked for a sum of $34 million as compensation. Because doctors do not carry insurance sufficient to cover that amount and generally do not have personal assets of that amount, the plaintiff targeted the hospital.
“The plaintiff knows that the physicians will never be able to pay an 8-figure settlement, so instead they go after the hospital itself,” says the newsletter. “The physicians simply become pawns in a protracted legal game.”
The lawsuit was settled out of court in 2021 for an undisclosed amount.
A version of this article first appeared on Medscape.com.
True or false: Breast density increases breast cancer risk
Which of the following statements about breast density is TRUE?
Text copyright DenseBreast-info.org.
Answer
D. The risks associated with dense breast tissue are 2-fold: Dense tissue can mask cancer on a mammogram, and having dense breasts also increases the risk of developing breast cancer. As breast density increases, the sensitivity of mammography decreases, and the risk of developing breast cancer increases.
A woman’s breast density is usually determined by a radiologist’s visual evaluation of the mammogram. Breast density also can be measured quantitatively by computer software or estimated on computed tomography scan or magnetic resonance imaging. Breast density cannot be determined by the way a breast looks or feels.
Breast density and mammographic sensitivity
Cancers can be hidden or “masked” by dense tissue. On a mammogram, cancer is white. Normal dense tissue also appears white. If a cancer develops in an area of normal dense tissue, it can be harder or sometimes impossible to see it on the mammogram, like trying to see a snowman in a blizzard. As breast density increases, the ability to see cancer on mammography decreases (FIGURE 1).
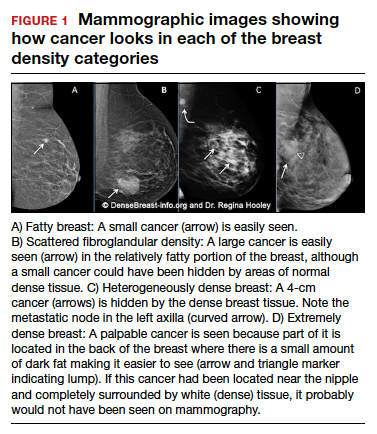
Standard 2D mammography has been shown to miss about 40% of cancers present in women with extremely dense breasts and 25% of cancers present in women with heterogeneously dense breasts.1-6 A cancer still can be masked on tomosynthesis (3D mammography) if it occurs in an area of dense tissue (where breast cancers more commonly occur), and tomosynthesis does not improve cancer detection appreciably in women with extremely dense breasts. To find cancer in a woman with dense breasts, additional screening beyond mammography should be considered.
Breast density and breast cancer risk
Dense breast tissue not only reduces mammography effectiveness, it also is a risk factor for the development of breast cancer: the denser the breast, the higher the risk.7 A meta-analysis across many studies concluded that magnitude of risk increases with each increase in density category, and women with extremely dense breasts (category D) have a 4-fold greater risk of developing breast cancer than do women with fatty breasts (category A), with upper limit of nearly 6-fold greater risk (FIGURE 2).8
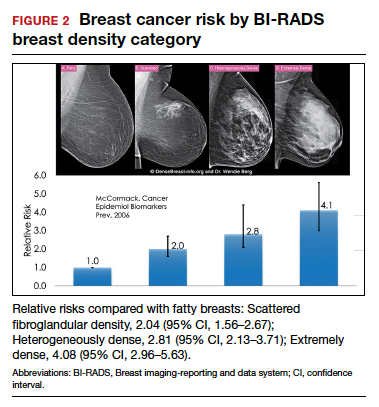
Most women do not have fatty breasts, however. More women have breasts with scattered fibroglandular density.9 Women with heterogeneously dense breasts (category C) have about a 1.5-fold greater risk of developing breast cancer than those with scattered fibroglandular density (category B), while women with extremely dense breasts (category D) have about a 2-fold greater risk.
There are probably several reasons that dense tissue increases breast cancer risk. One is that cancers arise microscopically in the glandular tissue. The more glandular tissue, the more susceptible tissue where cancer can develop. Glandular cells divide with hormonal stimulation throughout a woman’s lifetime, and each time a cell divides, “mistakes” can be made. An accumulation of mistakes can result in cancer. The more glandular the tissue, the greater the breast cancer risk. Women who have had breast reduction experience a reduced risk for breast cancer: thus, even a reduced absolute amount of glandular tissue reduces the risk for breast cancer. The second is that the local environment around the glands may produce certain growth hormones that stimulate cells to divide, and this is observed with fibrous breast tissue more than fatty breast tissue. ●
For more information, visit medically sourced DenseBreast-info.org. Comprehensive resources include a free CME opportunity, Dense Breasts and Supplemental Screening.
- Berg WA, Zhang Z, Lehrer D, et al. Detection of breast cancer with addition of annual screening ultrasound or a single screening MRI to mammography in women with elevated breast cancer risk. JAMA. 2012;307:1394-1404. doi: 10.1001 /jama.2012.388.
- Destounis S, Johnston L, Highnam R, et al. Using volumetric breast density to quantify the potential masking risk of mammographic density. AJR Am J Roentgenol. 2017;208:222-227. doi: 10.2214/AJR.16.16489.
- Kerlikowske K, Scott CG, Mahmoudzadeh AP, et al. Automated and clinical breast imaging reporting and data system density measures predict risk for screen-detected and interval cancers: a case-control study. Ann Intern Med. 2018;168:757-765. doi: 10.7326/M17-3008.
- Kolb TM, Lichy J, Newhouse JH. Comparison of the performance of screening mammography, physical examination, and breast US and evaluation of factors that influence them: an analysis of 27,825 patient evaluations. Radiology. 2002;225:165-175. doi: 10.1148/radiol.2251011667.
- Mandelson MT, Oestreicher N, Porter PL, et al. Breast density as a predictor of mammographic detection: comparison of interval- and screen-detected cancers. J Natl Cancer Inst. 2000;92:1081-1087. doi: 10.1093/jnci/92.13.1081.
- Wanders JOP, Holland K, Karssemeijer N, et al. The effect of volumetric breast density on the risk of screen-detected and interval breast cancers: a cohort study. Breast Cancer Res. 2017;19:67. doi: 10.1186/s13058-017-0859-9.
- Society AC. Breast Cancer Facts & Figures 2019-2020. American Cancer Society, Inc. https://www.cancer.org/content/dam/cancer-org/research/cancer -facts-and-statistics/breast-cancer-facts-and-figures/breast-cancer-facts -and-figures-2019-2020.pdf. Published 2019. Accessed September 23, 2021.
- McCormack VA, dos Santos Silva I. Breast density and parenchymal patterns as markers of breast cancer risk: a meta-analysis. Cancer Epidemiol Biomarkers Prev. 2006;15:1159-1169. doi: 10.1158/1055-9965.EPI-06-0034.
- Kerlikowske K, Cook AJ, Buist DS, et al. Breast cancer risk by breast density, menopause, and postmenopausal hormone therapy use. J Clin Oncol. 2010;28:3830-3837. doi: 10.1200/JCO.2009.26.4770.
Which of the following statements about breast density is TRUE?
Text copyright DenseBreast-info.org.
Answer
D. The risks associated with dense breast tissue are 2-fold: Dense tissue can mask cancer on a mammogram, and having dense breasts also increases the risk of developing breast cancer. As breast density increases, the sensitivity of mammography decreases, and the risk of developing breast cancer increases.
A woman’s breast density is usually determined by a radiologist’s visual evaluation of the mammogram. Breast density also can be measured quantitatively by computer software or estimated on computed tomography scan or magnetic resonance imaging. Breast density cannot be determined by the way a breast looks or feels.
Breast density and mammographic sensitivity
Cancers can be hidden or “masked” by dense tissue. On a mammogram, cancer is white. Normal dense tissue also appears white. If a cancer develops in an area of normal dense tissue, it can be harder or sometimes impossible to see it on the mammogram, like trying to see a snowman in a blizzard. As breast density increases, the ability to see cancer on mammography decreases (FIGURE 1).
Standard 2D mammography has been shown to miss about 40% of cancers present in women with extremely dense breasts and 25% of cancers present in women with heterogeneously dense breasts.1-6 A cancer still can be masked on tomosynthesis (3D mammography) if it occurs in an area of dense tissue (where breast cancers more commonly occur), and tomosynthesis does not improve cancer detection appreciably in women with extremely dense breasts. To find cancer in a woman with dense breasts, additional screening beyond mammography should be considered.
Breast density and breast cancer risk
Dense breast tissue not only reduces mammography effectiveness, it also is a risk factor for the development of breast cancer: the denser the breast, the higher the risk.7 A meta-analysis across many studies concluded that magnitude of risk increases with each increase in density category, and women with extremely dense breasts (category D) have a 4-fold greater risk of developing breast cancer than do women with fatty breasts (category A), with upper limit of nearly 6-fold greater risk (FIGURE 2).8
Most women do not have fatty breasts, however. More women have breasts with scattered fibroglandular density.9 Women with heterogeneously dense breasts (category C) have about a 1.5-fold greater risk of developing breast cancer than those with scattered fibroglandular density (category B), while women with extremely dense breasts (category D) have about a 2-fold greater risk.
There are probably several reasons that dense tissue increases breast cancer risk. One is that cancers arise microscopically in the glandular tissue. The more glandular tissue, the more susceptible tissue where cancer can develop. Glandular cells divide with hormonal stimulation throughout a woman’s lifetime, and each time a cell divides, “mistakes” can be made. An accumulation of mistakes can result in cancer. The more glandular the tissue, the greater the breast cancer risk. Women who have had breast reduction experience a reduced risk for breast cancer: thus, even a reduced absolute amount of glandular tissue reduces the risk for breast cancer. The second is that the local environment around the glands may produce certain growth hormones that stimulate cells to divide, and this is observed with fibrous breast tissue more than fatty breast tissue. ●
For more information, visit medically sourced DenseBreast-info.org. Comprehensive resources include a free CME opportunity, Dense Breasts and Supplemental Screening.
- Berg WA, Zhang Z, Lehrer D, et al. Detection of breast cancer with addition of annual screening ultrasound or a single screening MRI to mammography in women with elevated breast cancer risk. JAMA. 2012;307:1394-1404. doi: 10.1001 /jama.2012.388.
- Destounis S, Johnston L, Highnam R, et al. Using volumetric breast density to quantify the potential masking risk of mammographic density. AJR Am J Roentgenol. 2017;208:222-227. doi: 10.2214/AJR.16.16489.
- Kerlikowske K, Scott CG, Mahmoudzadeh AP, et al. Automated and clinical breast imaging reporting and data system density measures predict risk for screen-detected and interval cancers: a case-control study. Ann Intern Med. 2018;168:757-765. doi: 10.7326/M17-3008.
- Kolb TM, Lichy J, Newhouse JH. Comparison of the performance of screening mammography, physical examination, and breast US and evaluation of factors that influence them: an analysis of 27,825 patient evaluations. Radiology. 2002;225:165-175. doi: 10.1148/radiol.2251011667.
- Mandelson MT, Oestreicher N, Porter PL, et al. Breast density as a predictor of mammographic detection: comparison of interval- and screen-detected cancers. J Natl Cancer Inst. 2000;92:1081-1087. doi: 10.1093/jnci/92.13.1081.
- Wanders JOP, Holland K, Karssemeijer N, et al. The effect of volumetric breast density on the risk of screen-detected and interval breast cancers: a cohort study. Breast Cancer Res. 2017;19:67. doi: 10.1186/s13058-017-0859-9.
- Society AC. Breast Cancer Facts & Figures 2019-2020. American Cancer Society, Inc. https://www.cancer.org/content/dam/cancer-org/research/cancer -facts-and-statistics/breast-cancer-facts-and-figures/breast-cancer-facts -and-figures-2019-2020.pdf. Published 2019. Accessed September 23, 2021.
- McCormack VA, dos Santos Silva I. Breast density and parenchymal patterns as markers of breast cancer risk: a meta-analysis. Cancer Epidemiol Biomarkers Prev. 2006;15:1159-1169. doi: 10.1158/1055-9965.EPI-06-0034.
- Kerlikowske K, Cook AJ, Buist DS, et al. Breast cancer risk by breast density, menopause, and postmenopausal hormone therapy use. J Clin Oncol. 2010;28:3830-3837. doi: 10.1200/JCO.2009.26.4770.
Quiz developed in collaboration with 
Do you use intrapartum warm compresses to the perineum or perineal massage in your practice?
[polldaddy:10937454]
[polldaddy:10937454]
[polldaddy:10937454]
Evolving management strategies for patient service excellence: Is your practice up to speed?
Over the past decade, the use of technology with the focus on optimizing the consumer experience has exploded throughout numerous industries, including education, retail, and entertainment. Within health care, we would be naïve to ignore patient expectations for an optimized consumer experience within our offices. Thus, clinicians across all health care disciplines must remain cognizant of and work to optimize the patient experience in the ever-expanding world of health care.
Reengineering one’s practice will continue to be a work in progress. As medicine and technology continuously advance, clinicians must be able to adapt and implement changes. An excellent example of such adaptation is the use of telemedicine during the COVID-19 pandemic.1 We hope that the use of telemedicine remains an integral part of our armamentarium as we move forward.
In this article, we offer perspectives on using telemedicine, improving the patient experience, and implementing the use of social media in your practice. We look for a common denominator when provision of clinical care is the topic of discussion. Knowing the details of your medical practice and addressing its highlights as well as its concerns will benefit patients, staff, and health care providers. We hope that you glean some insights that you can apply in your practice.
Telemedicine: Part of the new normal
The American College of Obstetricians and Gynecologists defines telehealth as a “technology-enhanced health care framework that includes services, such as virtual visits, remote patient monitoring and mobile health care.”2 The American Telemedicine Association and the World Health Organization use the terms telemedicine and telehealth interchangeably.3 We live in a relatively new era since the COVID-19 pandemic necessitated that traditional face-to-face meeting(s) with patients be conducted virtually. The good news is that the outcomes with telehealth visits appear to be on par with those of traditional office visits.4
Telehealth allows clinicians to deliver medical evaluation and management plans right in a patient’s home and to receive appropriate reimbursement for doing so. This is a result of actions by Congress and the Department of Health and Human Services that removed restrictions related to telemedicine.5 The telemedicine approach provides a different perspective on provision of care (FIGURE 1).
For telemedicine practice, prerequisites include having the appropriate hardware, software, and a secure internet connection to maintain quality and patient safety.4 It is wise to check with regulatory laws at the local, state, and federal levels, as some states have separate licensure requirements for delivering this type of health care. Review insurance carrier guidelines as well as medical malpractice coverage for telehealth care provision. Ideally, obtain proof in writing from third-party payers and malpractice insurance carriers. TABLE 1 lists ObGyn-related activities and services that can be provided via telemedicine.3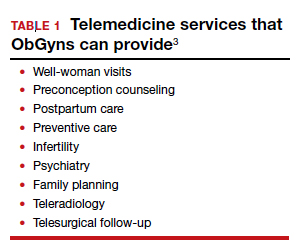
While in many circumstances the indications for telemedicine are obvious, some remain less apparent. For example, patients may be more receptive to the use of telemedicine for counseling and education for family planning services and termination of pregnancy.6 Psychological counseling lends itself to a telemedicine approach to address levels of anxiety and depression, especially in the postpartum setting.
An initial telemedicine consultation often is complemented by subsequent patient examination when deemed necessary. Pelvic imaging often is ordered to address concerns expressed during the telemedicine visit. Teleradiology is an interesting aspect of telemedicine that is expanding. Telesonography, the use of ultrasonography, is extremely relevant to obstetrics and gynecology. Specifically, the development of self-operated endovaginal telemonitors and 3D as well as 4D imaging incorporates self-operated endovaginal telemonitoring. This technology remains a work in progress.7
Another aspect to telemedicine is telesurgery. Although an operative procedure cannot be performed virtually, pre- and postoperative counseling can be provided via telemedicine, offering tremendous convenience to patients.
Understanding the infrastructure of telemedicine and assuring security, adherence with HIPAA (Health Insurance Portability and Accountability Act), state licensure, reimbursement, and medical malpractice aspects is well worth the effort.
Continue to: Reengineer your office to enhance the patient experience...
Reengineer your office to enhance the patient experience
Create a hospitable environment. One way to do this is by having your front desk staffer standing up to greet patients. The medical management literature has reported an interesting analogy.8 Picture going to a retailer whose job is to sell you the product you are interested in. Where is that person positioned? Standing at the counter, at eye level with you, doing his or her best to convince you to buy a particular product. Having your office front desk personnel standing is analogous to the “atmosphere (when approaching the front desk) that conveys clear energy and a clear tone or readiness,” all of which contribute to a more positive patient experience.8
A hospitable environment at the check-in desk sets the stage for the office visit. When a staffer is sitting at the front desk office entrance point, the concept conveyed to the patient is, “You can wait for us because you need us more than we need you.” Changing the staffer’s posture to a standing position conveys, “Welcome, we are glad to see you and address why you are here.”8
Conduct a flow analysis of your office procedures. It is clear that the front desk serves as an advertisement of what your practice has to offer. A friendly smile from the receptionist goes a long way. In addition, the total time from patient check-in to checkout should be monitored. Having this type of data aids staff evaluation and patient satisfaction.9
Examine your office’s aspects of what the business world calls throughput. In essence, problems related to throughput include that the clinician is chronically late or slow with patients or that inadequate time was allocated per patient visit or per procedure.
It is valuable to allocate staff resources ahead of time, including patient registration and insurance verification details. Staff records review and preparation for the clinician streamlines time with the patient. Having lab tests, other consultations, and so on readily available for the clinician is time well spent by the medical assistants. For procedures, preparation of equipment that is in good working order and having supplies appropriately stocked can help facilitate success and efficiency. Creation of an “electronic on-time board” displays if the clinician is running on time or not.9 These practical tips can result in better patient and staff satisfaction. In addition, periodic surveys help engage patients in the process. TABLE 2 provides sample survey questions to ask patients.10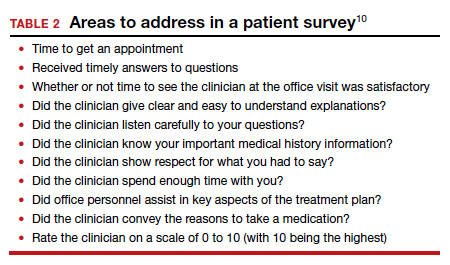
Taking a careful look at your current office practices and reengineering them as needed is an investment that provides an excellent return.
Continue to: Develop a presence on social media...
Develop a presence on social media
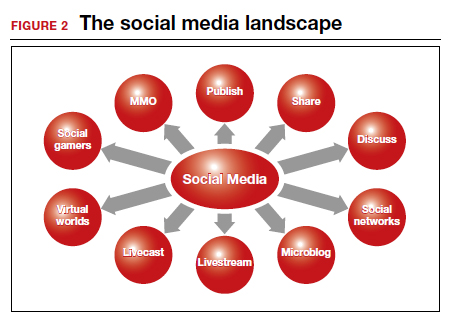
Having a social media presence is becoming one of the most effective strategies for reaching an intended audience. In the United States, more than 70% of the public uses at least one social media platform.11 It can be an effective and efficient tool for clinicians to grow their practice; distribute information about unique areas of the practice; and reach potential patients, referring physicians, and prospective faculty/trainees. Social media also is increasingly being used by clinicians to connect with other health care providers in their own specialty or other specialties. Digital communities have been created where ideas are shared and topics of interest are discussed. Clinicians can listen in on expert opinions, disseminate their research, and discuss practice management challenges or health advocacy. FIGURE 2 provides a snapshot of the social media landscape.
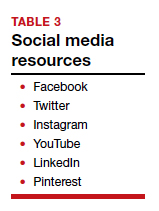
There is a wealth of options when it comes to social media platforms, including but not limited to Facebook, Twitter, LinkedIn, Instagram, YouTube, and blogs (TABLE 3). Facebook has the largest user base of all social media platforms, with approximately 1.7 billion active monthly users; thus, its use creates an opportunity to reach a massive audience.12,13 People use Facebook for both personal and professional reasons. The platform allows for sharing of photos, live videos, posted text, and comments. It can be used as a helpful resource to engage patients and disseminate accurate medical information. Importantly, remember that content posted should comply with the HIPAA Privacy Rule and that information shared should come from a credible source.
The Mayo Clinic is an impressive example of the use of social media for consumer education, research, and expansion of the reach of its brand. They incorporated social media into their strategic marketing plan, and between 2015 and 2016, social media referrals led to a 139% increase in patient appointment requests.13 Of the 20 different social media sites used, Facebook was the top social media referrer, accounting for 81% of social media referrals in 2015 and 88% in 2016. They have expanded their reach through different social media platforms and have more than 1.5 million followers on Twitter. Their videos on YouTube were viewed more than 4.9 million times in 2016 alone. This example illustrates social media’s effectiveness and the potential role it can play in connecting with patients.
Final thoughts
The practice of medicine has undeniably changed over the years and will continue to evolve. Understanding how to implement change to ensure that high-quality, efficient patient care is being delivered is paramount.
We have highlighted various aspects of practice management that you can use to overcome current obstacles and changing standards. The advent of telemedicine has provided easy access to clinicians. Consultation occurs in the comfort of the patient’s home, and the ability to provide local examination telecast to a clinician allows physicians and advanced practice practitioners to reach a wider range of patients. Social media has established an infrastructure for educating patients and providers while at the same time conveying educational tools to patients. This level of communication will continue to expand as time progresses.
Practitioners have a whole new cadre to add to their toolbox to provide patients with state-of-the-art communication and care. ●
- Anifandis G, Tempest H, Oliva R, et al. COVID-19 and human reproduction: a pandemic that packs a serious punch. Systems Biol Reprod Med. 2021;67:3-23.
- American College of Obstetricians and Gynecologists Presidential Task Force on Telehealth. Implementing telehealth in practice: ACOG Committee Opinion No. 798. Obstet Gynecol. 2020;135:e73-e79.
- Lee S, Hitt WC. Clinical applications of telemedicine in gynecology and women’s health. Obstet Gynecol Clin North Am. 2020;47:259-270.
- DeNicola N, Grossman D, Marko K, et al. Telehealth interventions to improve obstetrics and gynecologic health outcomes: a systematic review. Obstet Gynecol. 2020;135:371-382.
- Keesara S, Jonas A, Schulman K. Covid-19 and health care’s digital revolution. N Engl J Med. 2020;382:e82.
- Grossman D, Grindlay K. Safety of medical abortion provided through telemedicine compared with in person. Obstet Gynecol. 2017;130:778-782.
- Pereira I, von Horn K, Depebusch M, et al. Self-operated endovaginal telemonitoring: a prospective clinical validation study. Fertil Steril. 2016;106:306-310e1.
- Massey GG, Hunter DG. Enhancing the patient experience with stand-up check-in. MGMA Connex. 2016;34-36.
- The patient experience, from check-in to check out. MGMA Connex. 2017;17:45-46.
- Swankoski KE, Peikes DN, Morrison N, et al. Patient experience during a large primary care practice transformation initiative. Am J Manag Care. 2018;24:607-613.
- Pew Research Center. Social media fact sheet. https://www .pewinternet.org/fact-sheet/social-media/. April 7. 2021. Accessed September 21, 2021.
- Small Business Trends website. Mansfield M. Social media statistics 2016. https://smallbiztrends.com/2016/11/social -media-statistics-2016.html. Updated June 4, 2021. Accessed September 21, 2021.
- Kotsenas AL, Arce M, Aase L, et al. The strategic imperative for the use of social media in health care. J Am Coll Radiol. 2018;15(1 pt B):155-161.

Dr. Schointuch is Fellow, Department of Reproductive Endocrinology and Infertility, University of Pittsburgh Medical Center, Pennsylvania.

Dr. Vitez is Fellow, Department of Reproductive Endocrinology and Infertility, University of Pittsburgh Medical Center.

Dr. Sanfilippo is Professor, Department of Obstetrics, Gynecology, and Reproductive Sciences, University of Pittsburgh, and Director, Reproductive Endocrinology and Infertility, at Magee-Womens Hospital, Pittsburgh, Pennsylvania. He also serves on the OBG Management Board of Editors.
The authors report no financial relationships relevant to this article.
Dr. Schointuch is Fellow, Department of Reproductive Endocrinology and Infertility, University of Pittsburgh Medical Center, Pennsylvania.
Dr. Vitez is Fellow, Department of Reproductive Endocrinology and Infertility, University of Pittsburgh Medical Center.
Dr. Sanfilippo is Professor, Department of Obstetrics, Gynecology, and Reproductive Sciences, University of Pittsburgh, and Director, Reproductive Endocrinology and Infertility, at Magee-Womens Hospital, Pittsburgh, Pennsylvania. He also serves on the OBG Management Board of Editors.
The authors report no financial relationships relevant to this article.
Over the past decade, the use of technology with the focus on optimizing the consumer experience has exploded throughout numerous industries, including education, retail, and entertainment. Within health care, we would be naïve to ignore patient expectations for an optimized consumer experience within our offices. Thus, clinicians across all health care disciplines must remain cognizant of and work to optimize the patient experience in the ever-expanding world of health care.
Reengineering one’s practice will continue to be a work in progress. As medicine and technology continuously advance, clinicians must be able to adapt and implement changes. An excellent example of such adaptation is the use of telemedicine during the COVID-19 pandemic.1 We hope that the use of telemedicine remains an integral part of our armamentarium as we move forward.
In this article, we offer perspectives on using telemedicine, improving the patient experience, and implementing the use of social media in your practice. We look for a common denominator when provision of clinical care is the topic of discussion. Knowing the details of your medical practice and addressing its highlights as well as its concerns will benefit patients, staff, and health care providers. We hope that you glean some insights that you can apply in your practice.
Telemedicine: Part of the new normal
The American College of Obstetricians and Gynecologists defines telehealth as a “technology-enhanced health care framework that includes services, such as virtual visits, remote patient monitoring and mobile health care.”2 The American Telemedicine Association and the World Health Organization use the terms telemedicine and telehealth interchangeably.3 We live in a relatively new era since the COVID-19 pandemic necessitated that traditional face-to-face meeting(s) with patients be conducted virtually. The good news is that the outcomes with telehealth visits appear to be on par with those of traditional office visits.4
Telehealth allows clinicians to deliver medical evaluation and management plans right in a patient’s home and to receive appropriate reimbursement for doing so. This is a result of actions by Congress and the Department of Health and Human Services that removed restrictions related to telemedicine.5 The telemedicine approach provides a different perspective on provision of care (FIGURE 1).
For telemedicine practice, prerequisites include having the appropriate hardware, software, and a secure internet connection to maintain quality and patient safety.4 It is wise to check with regulatory laws at the local, state, and federal levels, as some states have separate licensure requirements for delivering this type of health care. Review insurance carrier guidelines as well as medical malpractice coverage for telehealth care provision. Ideally, obtain proof in writing from third-party payers and malpractice insurance carriers. TABLE 1 lists ObGyn-related activities and services that can be provided via telemedicine.3
While in many circumstances the indications for telemedicine are obvious, some remain less apparent. For example, patients may be more receptive to the use of telemedicine for counseling and education for family planning services and termination of pregnancy.6 Psychological counseling lends itself to a telemedicine approach to address levels of anxiety and depression, especially in the postpartum setting.
An initial telemedicine consultation often is complemented by subsequent patient examination when deemed necessary. Pelvic imaging often is ordered to address concerns expressed during the telemedicine visit. Teleradiology is an interesting aspect of telemedicine that is expanding. Telesonography, the use of ultrasonography, is extremely relevant to obstetrics and gynecology. Specifically, the development of self-operated endovaginal telemonitors and 3D as well as 4D imaging incorporates self-operated endovaginal telemonitoring. This technology remains a work in progress.7
Another aspect to telemedicine is telesurgery. Although an operative procedure cannot be performed virtually, pre- and postoperative counseling can be provided via telemedicine, offering tremendous convenience to patients.
Understanding the infrastructure of telemedicine and assuring security, adherence with HIPAA (Health Insurance Portability and Accountability Act), state licensure, reimbursement, and medical malpractice aspects is well worth the effort.
Continue to: Reengineer your office to enhance the patient experience...
Reengineer your office to enhance the patient experience
Create a hospitable environment. One way to do this is by having your front desk staffer standing up to greet patients. The medical management literature has reported an interesting analogy.8 Picture going to a retailer whose job is to sell you the product you are interested in. Where is that person positioned? Standing at the counter, at eye level with you, doing his or her best to convince you to buy a particular product. Having your office front desk personnel standing is analogous to the “atmosphere (when approaching the front desk) that conveys clear energy and a clear tone or readiness,” all of which contribute to a more positive patient experience.8
A hospitable environment at the check-in desk sets the stage for the office visit. When a staffer is sitting at the front desk office entrance point, the concept conveyed to the patient is, “You can wait for us because you need us more than we need you.” Changing the staffer’s posture to a standing position conveys, “Welcome, we are glad to see you and address why you are here.”8
Conduct a flow analysis of your office procedures. It is clear that the front desk serves as an advertisement of what your practice has to offer. A friendly smile from the receptionist goes a long way. In addition, the total time from patient check-in to checkout should be monitored. Having this type of data aids staff evaluation and patient satisfaction.9
Examine your office’s aspects of what the business world calls throughput. In essence, problems related to throughput include that the clinician is chronically late or slow with patients or that inadequate time was allocated per patient visit or per procedure.
It is valuable to allocate staff resources ahead of time, including patient registration and insurance verification details. Staff records review and preparation for the clinician streamlines time with the patient. Having lab tests, other consultations, and so on readily available for the clinician is time well spent by the medical assistants. For procedures, preparation of equipment that is in good working order and having supplies appropriately stocked can help facilitate success and efficiency. Creation of an “electronic on-time board” displays if the clinician is running on time or not.9 These practical tips can result in better patient and staff satisfaction. In addition, periodic surveys help engage patients in the process. TABLE 2 provides sample survey questions to ask patients.10
Taking a careful look at your current office practices and reengineering them as needed is an investment that provides an excellent return.
Continue to: Develop a presence on social media...
Develop a presence on social media
Having a social media presence is becoming one of the most effective strategies for reaching an intended audience. In the United States, more than 70% of the public uses at least one social media platform.11 It can be an effective and efficient tool for clinicians to grow their practice; distribute information about unique areas of the practice; and reach potential patients, referring physicians, and prospective faculty/trainees. Social media also is increasingly being used by clinicians to connect with other health care providers in their own specialty or other specialties. Digital communities have been created where ideas are shared and topics of interest are discussed. Clinicians can listen in on expert opinions, disseminate their research, and discuss practice management challenges or health advocacy. FIGURE 2 provides a snapshot of the social media landscape.
There is a wealth of options when it comes to social media platforms, including but not limited to Facebook, Twitter, LinkedIn, Instagram, YouTube, and blogs (TABLE 3). Facebook has the largest user base of all social media platforms, with approximately 1.7 billion active monthly users; thus, its use creates an opportunity to reach a massive audience.12,13 People use Facebook for both personal and professional reasons. The platform allows for sharing of photos, live videos, posted text, and comments. It can be used as a helpful resource to engage patients and disseminate accurate medical information. Importantly, remember that content posted should comply with the HIPAA Privacy Rule and that information shared should come from a credible source.
The Mayo Clinic is an impressive example of the use of social media for consumer education, research, and expansion of the reach of its brand. They incorporated social media into their strategic marketing plan, and between 2015 and 2016, social media referrals led to a 139% increase in patient appointment requests.13 Of the 20 different social media sites used, Facebook was the top social media referrer, accounting for 81% of social media referrals in 2015 and 88% in 2016. They have expanded their reach through different social media platforms and have more than 1.5 million followers on Twitter. Their videos on YouTube were viewed more than 4.9 million times in 2016 alone. This example illustrates social media’s effectiveness and the potential role it can play in connecting with patients.
Final thoughts
The practice of medicine has undeniably changed over the years and will continue to evolve. Understanding how to implement change to ensure that high-quality, efficient patient care is being delivered is paramount.
We have highlighted various aspects of practice management that you can use to overcome current obstacles and changing standards. The advent of telemedicine has provided easy access to clinicians. Consultation occurs in the comfort of the patient’s home, and the ability to provide local examination telecast to a clinician allows physicians and advanced practice practitioners to reach a wider range of patients. Social media has established an infrastructure for educating patients and providers while at the same time conveying educational tools to patients. This level of communication will continue to expand as time progresses.
Practitioners have a whole new cadre to add to their toolbox to provide patients with state-of-the-art communication and care. ●
- Anifandis G, Tempest H, Oliva R, et al. COVID-19 and human reproduction: a pandemic that packs a serious punch. Systems Biol Reprod Med. 2021;67:3-23.
- American College of Obstetricians and Gynecologists Presidential Task Force on Telehealth. Implementing telehealth in practice: ACOG Committee Opinion No. 798. Obstet Gynecol. 2020;135:e73-e79.
- Lee S, Hitt WC. Clinical applications of telemedicine in gynecology and women’s health. Obstet Gynecol Clin North Am. 2020;47:259-270.
- DeNicola N, Grossman D, Marko K, et al. Telehealth interventions to improve obstetrics and gynecologic health outcomes: a systematic review. Obstet Gynecol. 2020;135:371-382.
- Keesara S, Jonas A, Schulman K. Covid-19 and health care’s digital revolution. N Engl J Med. 2020;382:e82.
- Grossman D, Grindlay K. Safety of medical abortion provided through telemedicine compared with in person. Obstet Gynecol. 2017;130:778-782.
- Pereira I, von Horn K, Depebusch M, et al. Self-operated endovaginal telemonitoring: a prospective clinical validation study. Fertil Steril. 2016;106:306-310e1.
- Massey GG, Hunter DG. Enhancing the patient experience with stand-up check-in. MGMA Connex. 2016;34-36.
- The patient experience, from check-in to check out. MGMA Connex. 2017;17:45-46.
- Swankoski KE, Peikes DN, Morrison N, et al. Patient experience during a large primary care practice transformation initiative. Am J Manag Care. 2018;24:607-613.
- Pew Research Center. Social media fact sheet. https://www .pewinternet.org/fact-sheet/social-media/. April 7. 2021. Accessed September 21, 2021.
- Small Business Trends website. Mansfield M. Social media statistics 2016. https://smallbiztrends.com/2016/11/social -media-statistics-2016.html. Updated June 4, 2021. Accessed September 21, 2021.
- Kotsenas AL, Arce M, Aase L, et al. The strategic imperative for the use of social media in health care. J Am Coll Radiol. 2018;15(1 pt B):155-161.
Can we return to the ABCs of crafting a medical record note?
Prior to 1980, medical record notes were generally hand-written, short, and to the point. Senior physicians often wrote their 3-line notes using a fountain pen in an elegant cursive. With the transition to electronic medical records, notes have become bloated with irrelevant information and frequently lack a focus on the critical clinical insights that optimize patient care. The use of smart phrases to pull vast amounts of raw data into the note is a major contributor to note bloat. The unrestrained use of the copy and paste functionality generates a sequence of cloned notes that grow in length as new information is added and little information from prior notes removed. With each subsequent clone the note often becomes less accurate, lengthier, and more difficult for a reader to understand. In one survey of 253 physicians who wrote electronic notes, 90% reported that they used the copy and paste function, with 71% reporting that use of this function caused inconsistencies within and among notes and increased the repetitive presentation of outdated information in the note.1 Although the surveyed clinicians recognized that the copy and paste function caused problems, 80% reported that they planned to continue to use the copy and paste function.1
The SOAP note
The problem-oriented SOAP note is written in the classic structure of subjective and objective information, followed by an assessment and plan.2 The structure of the SOAP note emphasizes the logical and sequential collection of data followed by data analysis, resulting in a focused assessment and plan. When notes were hand-written and short, the entire SOAP note could be viewed on one page. Like a dashboard, the eye could quickly scan each key component of the note, facilitating the simultaneous integration of all 4 components of the note, facilitating understanding of the patient’s clinical situation. When the SOAP note structure is used to create a multipage electronic note, the result is a note that often confuses rather than enlightens the reader. A 5- to 10-page SOAP note is often useless for patient care but demonstrates the ability of computer-savvy clinicians to quickly generate a note thousands of words in length.
The APSO note, a response to note bloat
When a medical record note becomes a multipage document, clinicians should consider switching from the SOAP note structure to the APSO note, where the assessment and plan are at the top of the note, and the subjective and objective information is below the assessment and plan. The APSO format permits the reader to more quickly grasp the critical thinking of the author and facilitates a focus on key points relevant to the patient’s condition. The note can be written in the SOAP format, but then the assessment and plan are brought to the top of the note. In my clinical experience fewer than 10% of clinicians are using an APSO note structure. I believe that, with a multipage note, the APSO structure improves the experience of the reader and should be more widely utilized, especially by clinicians who are prone to crafting a bloated note. In a survey of more than 3,000 clinicians, approximately two-thirds of the respondents reported that, compared with SOAP notes, APSO notes were easier and faster to read, and APSO notes made it easier to follow the clinical reasoning of the author.3
Continue to: New evaluation and management billing guidelines—An opportunity to reduce note bloat...
New evaluation and management billing guidelines—An opportunity to reduce note bloat
Previous evaluation and management federal billing guidelines emphasized documentation of a myriad of clinically irrelevant details contributing to note bloat. The new federal evaluation and management billing guidelines pivot the focus of the note to the quality and complexity of medical decision making as demonstrated in the assessment and plan.4 Prioritizing the assessment and plan as the key feature of the medical record note should help reduce the length of notes. The American College of Physicians recently recommended deleting the complete review of systems and prior histories from most notes unless relevant to medical decision making and the assessment and plan.5
The open note
The open note mandate was contained in federal regulations developed to implement the 21st Century Cures Act, which required patients to have access to the information in their medical record. In order to comply with the regulation, health systems are sending most notes and test results to the patient through the health system’s patient gateway. The open note process entered my practice through a stealthy progression, from an initial step of permitting a clinician to easily share their note with a patient to a top-down edict that all notes, except some notes that have a high risk of causing patient harm, must be sent immediately to the patient. Obviously, an open note supports “transparency,” but I am unaware of high quality evidence that open notes improve the health of a population or reduce morbidity or mortality from health problems.
The federal mandate that clinicians share their notes or risk fiscal penalties is coercive and undermines the independence of health professionals. Open notes may have many benefits, including:
- improving a patient’s comprehension and sense of control over their health issues
- increasing patient trust in their health system
- increasing the number of questions patients ask their clinician.6
Open notes may also cause unintended adverse emotional trauma to patients, especially when the note communicates “bad news.” In one study of 100 oncology patients, approximately 25% of respondents reported that reading clinical notes was emotionally difficult, and they sometimes regretted having read the note.6 One patient reported, “I think MyChart is great but in this whole cancer thing MyChart has not been a good thing.” Another patient reported, “Reading serious stuff like that is just too taxing for me to be honest with you.”6 An additional finding of the study was that patients reported their notes were written with too much medical jargon and repetition of information.
Open laboratory, pathology, and imaging data—Helpful or harmful?
A component of the open note mandate is that laboratory, pathology, and imaging data must be shared timely with patients. Some health systems incorporate a 3-day pause prior to sharing such data, in order to provide the clinical team with time to communicate with the patient before the test results are shared. Some health systems, including my health system, have engineered the open note data-sharing system to immediately share the results of most completed laboratory, pathology, and imaging studies with the patient. Immediate sharing of data may result in the patient first learning that they have a serious, life-threatening health problem, such as cancer, from their patient portal rather than from a clinician. As an example, a patient may first learn that they have metastatic cancer from a CT scan that was ordered for a benign indication.
Another example is that a patient may first learn that they have an HIV infection from their patient portal. This can be a shocking and emotionally damaging experience for the patient. For many test results, it would be best if a clinician were able to communicate the result to the patient, providing support and context to the meaning of the result, rather than sending sensitive, life-altering information directly from the laboratory or imaging department to the patient. Leaders in medical education have spent decades teaching clinicians how to communicate “bad news” in a sensitive, supportive, and effective manner. The open sharing of laboratory, pathology, and imaging data short-circuits the superior process of relying on a highly capable clinician to communicate bad news.
Continue to: Crafting the open medical record note...
Crafting the open medical record note
Building on the advice that “when life gives you lemons, make lemonade,” I have begun to pivot the purpose of my medical notes from a product useful to myself and other clinicians to a product whose primary purpose is to be helpful for the patient. The open note can facilitate building a trusting relationship with the patient. My notes are becoming a series of written conversations with the patient, emphasizing compassion and empathy. I am increasing significantly the amount of educational information in the note to help the patient understand their situation. In addition, I am replacing traditional medical terms with verbiage more appropriate in the context of a conversation with the patient, reducing the use of medical jargon. For example, I have stopped using “chief complaint” and replaced it with “health issues.” I am diligently avoiding the use of medical terms that have negative connotations, including “obese,” “psychosomatic,” “alcoholic,” and “drug addiction.” I include encouragement and positive comments in many of my notes. For example, “Ms. X is successfully managing her health issues and experiencing improved health. It is a pleasure collaborating with her on achieving optimal health.”
Can we bring sanity back to medical note writing?
The primary role of a clinician is to spend as much time as possible listening to patients, understanding their needs, and helping them achieve optimal health. There are many benefits to an electronic medical record, including legibility, accessibility, interoperability, and efficiency. However, in current practice “note bloat” undermines the potential of the electronic medical record and makes many notes ineffective to the process of advancing the patient’s health. We are competent and highly trained clinicians. We can craft notes that are simple, specific, story-driven, compassionate, and empathetic. If we return to the ABCs of note writing, focusing on accuracy, brevity, and clarity, we will make note writing and reading more rewarding and improve patient care. ●
- O’Donnell HC, Kaushal R, Barron Y, et al. Physicians’ attitudes towards copy and pasting in the electronic note writing. J Gen Intern Med. 2009;24:63-68.
- Weed LL. Medical records, patient care and medical education. Ir J Med Sci. 1964;462:271-282.
- Sieja A, Pell J, Markley K, et al. Successful implementation of APSO notes across a major health system. Am J Account Care. 2017;5:29-34.
- Barbieri RL, Levy B. Major changes in Medicare billing are planned for January 2021: some specialists fare better that others. OBG Manag. 2020;32:9, 10, 12, 14.
- State of the note summit, 2021. Medical specialty dos and don’ts. https://www.acponline.org/system/files/documents/practice-resources/business-resources/coding/state-of-the-note-summit-2021/sotn21-specialtycare.pdf. Accessed September 21, 2021.
- Kayashtha N, Pollak KI, LeBLanc TW. Open oncology notes: a qualitative study of oncology patients’ experiences reading their cancer care notes. Am Soc Clin Oncol. 2018;14:e251-e257.
Robert L. Barbieri, MD
Chair Emeritus, Department of Obstetrics and Gynecology
Interim Chief, Obstetrics
Brigham and Women’s Hospital
Kate Macy Ladd Distinguished Professor of Obstetrics,
Gynecology and Reproductive Biology
Harvard Medical School
Boston, Massachusetts
Dr. Barbieri reports no financial relationships relevant to this article.
Prior to 1980, medical record notes were generally hand-written, short, and to the point. Senior physicians often wrote their 3-line notes using a fountain pen in an elegant cursive. With the transition to electronic medical records, notes have become bloated with irrelevant information and frequently lack a focus on the critical clinical insights that optimize patient care. The use of smart phrases to pull vast amounts of raw data into the note is a major contributor to note bloat. The unrestrained use of the copy and paste functionality generates a sequence of cloned notes that grow in length as new information is added and little information from prior notes removed. With each subsequent clone the note often becomes less accurate, lengthier, and more difficult for a reader to understand. In one survey of 253 physicians who wrote electronic notes, 90% reported that they used the copy and paste function, with 71% reporting that use of this function caused inconsistencies within and among notes and increased the repetitive presentation of outdated information in the note.1 Although the surveyed clinicians recognized that the copy and paste function caused problems, 80% reported that they planned to continue to use the copy and paste function.1
The SOAP note
The problem-oriented SOAP note is written in the classic structure of subjective and objective information, followed by an assessment and plan.2 The structure of the SOAP note emphasizes the logical and sequential collection of data followed by data analysis, resulting in a focused assessment and plan. When notes were hand-written and short, the entire SOAP note could be viewed on one page. Like a dashboard, the eye could quickly scan each key component of the note, facilitating the simultaneous integration of all 4 components of the note, facilitating understanding of the patient’s clinical situation. When the SOAP note structure is used to create a multipage electronic note, the result is a note that often confuses rather than enlightens the reader. A 5- to 10-page SOAP note is often useless for patient care but demonstrates the ability of computer-savvy clinicians to quickly generate a note thousands of words in length.
The APSO note, a response to note bloat
When a medical record note becomes a multipage document, clinicians should consider switching from the SOAP note structure to the APSO note, where the assessment and plan are at the top of the note, and the subjective and objective information is below the assessment and plan. The APSO format permits the reader to more quickly grasp the critical thinking of the author and facilitates a focus on key points relevant to the patient’s condition. The note can be written in the SOAP format, but then the assessment and plan are brought to the top of the note. In my clinical experience fewer than 10% of clinicians are using an APSO note structure. I believe that, with a multipage note, the APSO structure improves the experience of the reader and should be more widely utilized, especially by clinicians who are prone to crafting a bloated note. In a survey of more than 3,000 clinicians, approximately two-thirds of the respondents reported that, compared with SOAP notes, APSO notes were easier and faster to read, and APSO notes made it easier to follow the clinical reasoning of the author.3
Continue to: New evaluation and management billing guidelines—An opportunity to reduce note bloat...
New evaluation and management billing guidelines—An opportunity to reduce note bloat
Previous evaluation and management federal billing guidelines emphasized documentation of a myriad of clinically irrelevant details contributing to note bloat. The new federal evaluation and management billing guidelines pivot the focus of the note to the quality and complexity of medical decision making as demonstrated in the assessment and plan.4 Prioritizing the assessment and plan as the key feature of the medical record note should help reduce the length of notes. The American College of Physicians recently recommended deleting the complete review of systems and prior histories from most notes unless relevant to medical decision making and the assessment and plan.5
The open note
The open note mandate was contained in federal regulations developed to implement the 21st Century Cures Act, which required patients to have access to the information in their medical record. In order to comply with the regulation, health systems are sending most notes and test results to the patient through the health system’s patient gateway. The open note process entered my practice through a stealthy progression, from an initial step of permitting a clinician to easily share their note with a patient to a top-down edict that all notes, except some notes that have a high risk of causing patient harm, must be sent immediately to the patient. Obviously, an open note supports “transparency,” but I am unaware of high quality evidence that open notes improve the health of a population or reduce morbidity or mortality from health problems.
The federal mandate that clinicians share their notes or risk fiscal penalties is coercive and undermines the independence of health professionals. Open notes may have many benefits, including:
- improving a patient’s comprehension and sense of control over their health issues
- increasing patient trust in their health system
- increasing the number of questions patients ask their clinician.6
Open notes may also cause unintended adverse emotional trauma to patients, especially when the note communicates “bad news.” In one study of 100 oncology patients, approximately 25% of respondents reported that reading clinical notes was emotionally difficult, and they sometimes regretted having read the note.6 One patient reported, “I think MyChart is great but in this whole cancer thing MyChart has not been a good thing.” Another patient reported, “Reading serious stuff like that is just too taxing for me to be honest with you.”6 An additional finding of the study was that patients reported their notes were written with too much medical jargon and repetition of information.
Open laboratory, pathology, and imaging data—Helpful or harmful?
A component of the open note mandate is that laboratory, pathology, and imaging data must be shared timely with patients. Some health systems incorporate a 3-day pause prior to sharing such data, in order to provide the clinical team with time to communicate with the patient before the test results are shared. Some health systems, including my health system, have engineered the open note data-sharing system to immediately share the results of most completed laboratory, pathology, and imaging studies with the patient. Immediate sharing of data may result in the patient first learning that they have a serious, life-threatening health problem, such as cancer, from their patient portal rather than from a clinician. As an example, a patient may first learn that they have metastatic cancer from a CT scan that was ordered for a benign indication.
Another example is that a patient may first learn that they have an HIV infection from their patient portal. This can be a shocking and emotionally damaging experience for the patient. For many test results, it would be best if a clinician were able to communicate the result to the patient, providing support and context to the meaning of the result, rather than sending sensitive, life-altering information directly from the laboratory or imaging department to the patient. Leaders in medical education have spent decades teaching clinicians how to communicate “bad news” in a sensitive, supportive, and effective manner. The open sharing of laboratory, pathology, and imaging data short-circuits the superior process of relying on a highly capable clinician to communicate bad news.
Continue to: Crafting the open medical record note...
Crafting the open medical record note
Building on the advice that “when life gives you lemons, make lemonade,” I have begun to pivot the purpose of my medical notes from a product useful to myself and other clinicians to a product whose primary purpose is to be helpful for the patient. The open note can facilitate building a trusting relationship with the patient. My notes are becoming a series of written conversations with the patient, emphasizing compassion and empathy. I am increasing significantly the amount of educational information in the note to help the patient understand their situation. In addition, I am replacing traditional medical terms with verbiage more appropriate in the context of a conversation with the patient, reducing the use of medical jargon. For example, I have stopped using “chief complaint” and replaced it with “health issues.” I am diligently avoiding the use of medical terms that have negative connotations, including “obese,” “psychosomatic,” “alcoholic,” and “drug addiction.” I include encouragement and positive comments in many of my notes. For example, “Ms. X is successfully managing her health issues and experiencing improved health. It is a pleasure collaborating with her on achieving optimal health.”
Can we bring sanity back to medical note writing?
The primary role of a clinician is to spend as much time as possible listening to patients, understanding their needs, and helping them achieve optimal health. There are many benefits to an electronic medical record, including legibility, accessibility, interoperability, and efficiency. However, in current practice “note bloat” undermines the potential of the electronic medical record and makes many notes ineffective to the process of advancing the patient’s health. We are competent and highly trained clinicians. We can craft notes that are simple, specific, story-driven, compassionate, and empathetic. If we return to the ABCs of note writing, focusing on accuracy, brevity, and clarity, we will make note writing and reading more rewarding and improve patient care. ●
- O’Donnell HC, Kaushal R, Barron Y, et al. Physicians’ attitudes towards copy and pasting in the electronic note writing. J Gen Intern Med. 2009;24:63-68.
- Weed LL. Medical records, patient care and medical education. Ir J Med Sci. 1964;462:271-282.
- Sieja A, Pell J, Markley K, et al. Successful implementation of APSO notes across a major health system. Am J Account Care. 2017;5:29-34.
- Barbieri RL, Levy B. Major changes in Medicare billing are planned for January 2021: some specialists fare better that others. OBG Manag. 2020;32:9, 10, 12, 14.
- State of the note summit, 2021. Medical specialty dos and don’ts. https://www.acponline.org/system/files/documents/practice-resources/business-resources/coding/state-of-the-note-summit-2021/sotn21-specialtycare.pdf. Accessed September 21, 2021.
- Kayashtha N, Pollak KI, LeBLanc TW. Open oncology notes: a qualitative study of oncology patients’ experiences reading their cancer care notes. Am Soc Clin Oncol. 2018;14:e251-e257.
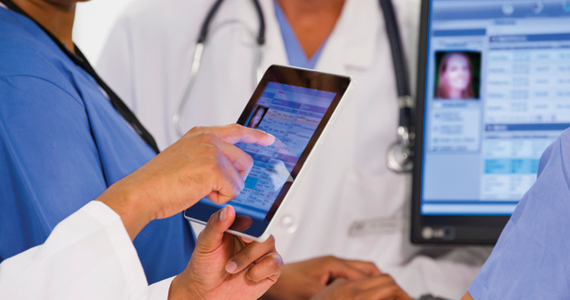
New data illustrate pandemic pivot to telehealth by patients, physicians
Telehealth use, although much higher than before the COVID-19 pandemic, accounted for less than 20% of weekly outpatient visits 6 months into the pandemic, according to a new report from the American Medical Association. Ten percent of weekly visits were conducted via videoconferencing, and 8.1% of visits were conducted using the telephone.
Those figures may overstate the true level of telehealth use in fall 2020. A study by the Commonwealth Fund, Harvard University, Boston, and Phreesia found that in December of that year, only 8% of outpatient visits involved the use of telemedicine – and that was up from 6% in October. In contrast to the AMA results, which came from its 2020 benchmark survey of physicians, the Commonwealth Fund study used data from practice management systems and an online patient registration platform, as well as electronic health record data.
A more recent survey of hospital executives found that as of September 2021, hospital telehealth visits had leveled off at 10% to 20% of appointments. Similarly, a McKinsey survey in July showed that telehealth encounters made up 13% to 17% of evaluation and management visits across all specialties.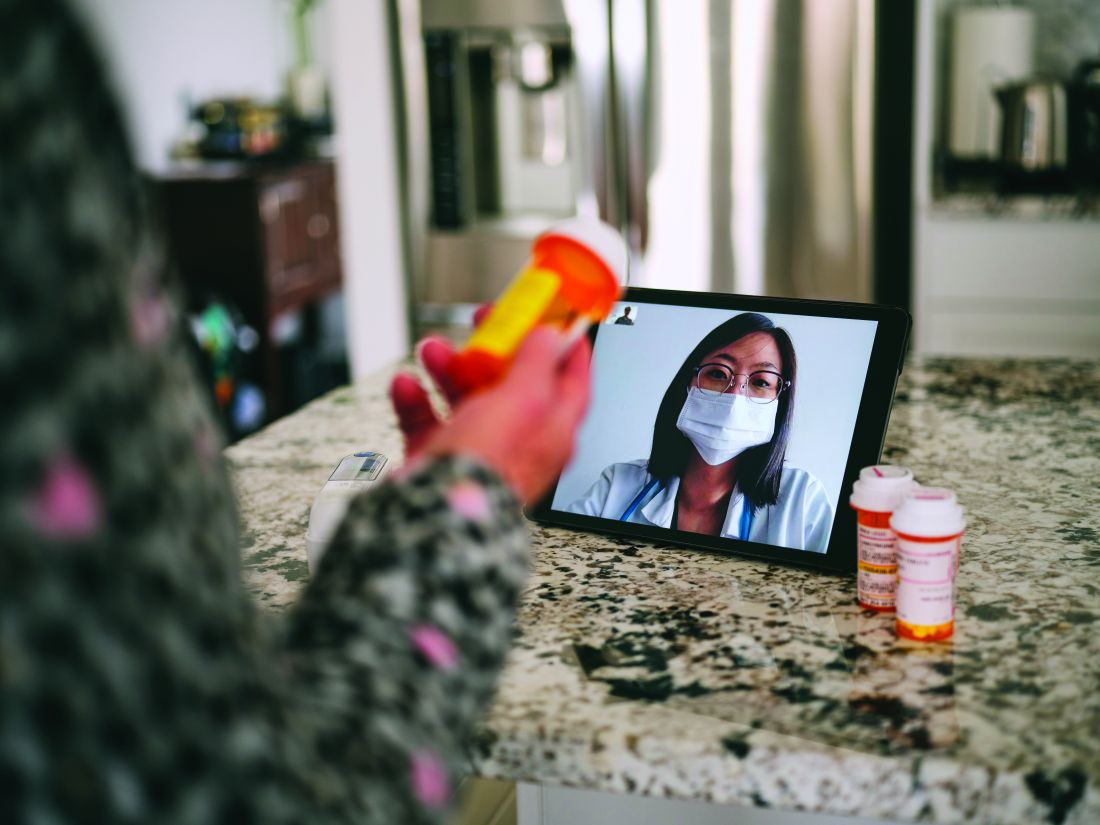
Big jump during pandemic
The AMA report offers a wealth of data on how physicians use telehealth and the differences between specialties in this area.
The report found that 70.3% of physicians worked in practices that used videoconferencing to provide patient visits in September 2020, compared to 14.3% of physicians in September 2018. Sixty-seven percent of physicians worked in practices that used telephone visits (the comparable figure for 2018 was unavailable).
Overall, 79% of physicians worked in a practice that used telehealth, compared to 25% in 2018.
Not every doctor in practices that utilized telehealth conducted virtual visits. In contrast to the 70.3% of doctors who were in practices that had video visits, only 59.1% of the respondents had personally conducted a videoconferencing visit in the previous week. The average numbers of weekly video and telephone visits per physician were 9.9 and 7.6, respectively, including those who did none.
There were big differences in virtual visit use among specialties as well. Eighty-five percent of psychiatrists were in practices that provided online appointments, according to the AMA survey, and three-quarters of primary care physicians said their practices offered telehealth appointments. Pediatricians were much less likely than family practice/general practice physicians (FPs/GPs) or general internists to do so.
The practices of many medical specialists were also highly likely to provide telehealth. Over 75% of practices in cardiology, endocrinology/diabetes, gastroenterology, nephrology, and neurology offered telehealth visits. About 88% of hematologists/oncologists offered video visits. Far fewer surgeons reported that their practice used virtual visits; the exceptions were urologists and dermatologists, 87% of whose practices used telehealth.
How telehealth was used
Across all specialties, 58% of physicians said clinicians in their practices used it to diagnose or treat patients; 59.2%, to manage patients with chronic disease; 50.4%, to provide acute care; and 34.3%, to provide preventive care.
Seventy-two percent of FP/GP and pediatric practices used telehealth to diagnose or treat patients. Just 64.9% of internists said their practices did so, and only 61.9% of them said their practices provided acute care via telehealth, versus 70% of FPs/GPs and pediatricians.
Among medical specialties, endocrinologists/diabetes physicians were those most likely to report the practice-level use of telehealth to diagnose or treat patients (71.9%), manage patients with chronic disease (92.1%), and provide preventive care (52.6%).
Significantly, 33% of medical specialists said their practices used remote patient monitoring. This finding was driven by high rates of use among cardiology practices (63.3%) and endocrinology practices (41.6%). Overall, the practice-level use of remote patient monitoring rose from 10.4% of practices in 2018 to 19.9% in 2020.
Virtual consults with peers
Some practices used telehealth to enable physicians to consult with colleagues. Twelve percent of respondents said their practices used telehealth to seek a second opinion from a health care professional in 2020, compared to 6.9% in 2018. Formal consultations via telehealth were also increasingly common: 17.2% of doctors said their practices did this in 2020, compared to 11.3% in 2018.
Also of note, 22.4% of physicians said their practices used telehealth for after-hours care or night calls in 2020, versus 9.9% in 2018.
The AMA report credited telehealth and expanded coverage and payment rules for enabling physician practices to keep their revenue streams positive and their practices open. However, the Commonwealth Fund study found “a substantial cumulative reduction in visits across all specialties over the course of the pandemic in 2020.” These ranged from a drop of 27% in pediatric visits to a decline of 8% in rheumatology visits during the period from March to December 2020.
A version of this article first appeared on Medscape.com.
Predicted pandemic retirement of many physicians hasn’t happened
The number of physicians who have chosen early retirement or have left medicine because of the COVID-19 pandemic may be considerably lower than previously thought, results of a new study suggest.
The research letter in the Journal of the American Medical Association, based on Medicare claims data, stated that “practice interruption rates were similar before and during the COVID-19 pandemic, except for a spike in April 2020.”
By contrast, in a Physicians Foundation Survey conducted in August 2020, 8% of physicians said they had closed their practices as a result of COVID, and 4% of the respondents said they planned to leave their practices within the next 12 months.
Similarly, a Jackson Physician Search survey in the fourth quarter of 2020 found that 54% of physicians surveyed had changed their employment plans. Of those doctors, 21% said they might hang up their white coat for early retirement. That works out to about 11% of the respondents.
The JAMA study’s authors analyzed the Medicare claims data from Jan. 1, 2019, to Dec. 30, 2020, to see how many physicians with Medicare patients had stopped filing claims for a period during those 2 years.
If a doctor had ceased submitting claims and then resumed filing them within 6 months after the last billing month, the lapse in filing was defined as “interruption with return.” If a physician stopped filing claims to Medicare and did not resume within 6 months, the gap in filing was called “interruption without return.”
In April 2020, 6.9% of physicians billing Medicare had a practice interruption, compared to 1.4% in 2019. But only 1.1% of physicians stopped practice in April 2020 and did not return, compared with 0.33% in 2019.
Physicians aged 55 or older had higher rates of interruption both with and without return than younger doctors did. The change in interruption rates for older doctors was 7.2% vs. 3.9% for younger physicians. The change in older physicians’ interruption-without-return rate was 1.3% vs. 0.34% for younger colleagues.
“Female physicians, specialists, physicians in smaller practices, those not in a health professional shortage area, and those practicing in a metropolitan area experienced greater increases in practice interruption rates in April 2020 vs. April 2019,” the study states. “But those groups typically had higher rates of return, so the overall changes in practice interruptions without return were similar across characteristics other than age.”
Significance for retirement rate
Discussing these results, the authors stressed that practice interruptions without return can’t necessarily be attributed to retirement, and that practice interruptions with return don’t necessarily signify that doctors had been furloughed from their practices.
Also, they said, “this measure of practice interruption likely misses meaningful interruptions that lasted for less than a month or did not involve complete cessation in treating Medicare patients.”
Nevertheless, “the study does capture a signal of some doctors probably retiring,” Jonathan Weiner, DPH, professor of health policy and management at the Johns Hopkins Bloomberg School of Public Health, said in an interview.
But he added, “Some of those people who interrupted their practices and didn’t return may still come back. And there are probably a lot of other doctors who are leaving or changing practices that they didn’t capture.” For example, it’s possible that some doctors who went to work for other health care organizations stopped billing under their own names.
In Dr. Weiner’s view, the true percentage of physicians who have retired since the start of the pandemic is probably somewhere between the portion of doctors who interrupted their practice without return, according to the JAMA study, and the percentage of physicians who said they had closed their practices in the Physicians Foundation survey.
No mass exodus seen
Michael Belkin, JD, divisional vice president of recruiting for Merritt Hawkins, a physician search firm, said in an interview that the real number may be closer to the interruption-without-return figure in the JAMA study.
While many physician practices were disrupted in spring of 2020, he said, “it really didn’t result in a mass exodus [from health care]. We’re not talking to a lot of candidates who retired or walked away from their practices. We are talking to candidates who slowed down last year and then realized that they wanted to get back into medicine. And now they’re actively looking.”
One change in job candidates’ attitude, Mr. Belkin said, is that, because of COVID-19–related burnout, their quality of life is more important to them.
“They want to know, ‘What’s the culture of the employer like? What did they do last year during COVID? How did they handle it? Have they put together any protocols for the next pandemic?’ “
Demand for doctors has returned
In the summer of 2020, there was a major drop in physician recruitment by hospitals and health systems, partly because of fewer patient visits and procedures. But demand for doctors has bounced back over the past year, Mr. Belkin noted. One reason is the pent-up need for care among patients who avoided health care providers in 2020.
Another reason is that some employed doctors – particularly older physicians – have slowed down. Many doctors prefer to work remotely 1 or 2 days a week, providing telehealth visits to patients. That has led to a loss of productivity in many health care organizations and, consequently, a need to hire additional physicians.
Nevertheless, not many doctors are heading for the exit earlier than physicians did before COVID-19.
“They may work reduced hours,” Mr. Belkin said. “But the sense from a physician’s perspective is that this is all they know. For them to walk away from their life in medicine, from who they are, is problematic. So they’re continuing to practice, but at a reduced capacity.”
A version of this article first appeared on Medscape.com.
Improving quality and return-on-investment: Provider onboarding
Physician and advanced practice provider (APP) (collectively, “provider”) onboarding into health care delivery settings requires careful planning and systematic integration. Assimilation into health care settings and cultures necessitates more than a 1- or 2-day orientation. Rather, an intentional, longitudinal onboarding program (starting with orientation) needs to be designed to assimilate providers into the unique culture of a medical practice.
Establishing mutual expectations
Communication concerning mutual expectations is a vital component of the agreement between provider and practice. Items that should be included in provider onboarding (likely addressed in either the practice visit or amplified in a contract) include the following:
- Committees: Committee orientation should include a discussion of provider preferences/expectations and why getting the new provider involved in the business of the practice is a priority of the group.
- Operations: Key clinical operations details should be reviewed with the incoming provider and reinforced through follow-up discussions with a physician mentor/coach (for example, call distribution; role of the senior nonclinical leadership team/accountants, fellow practice/group partners, and IT support; role definitions and expectations for duties, transitioning call, and EHR charting; revenue-sharing; supplies/preferences/adaptability to scope type).
- Interests: Specific provider interests (for example, clinical research, infusion, hemorrhoidal banding, weight loss/nutrition, inflammatory bowel disease, irritable bowel disease, pathology) and productivity expectations (for example, number of procedures, number of new and return patient visits per day) should be communicated.
- Miscellaneous: Discussion about marketing the practice, importance of growing satellite programs and nuance of major referral groups to the practice are also key components of the assimilation process.
Leadership self-awareness and cultural alignment
Leadership self-awareness is a key element of provider onboarding. Physicians and APPs are trained to think independently and may be challenged to share decision-making and rely on others. The following are some no-cost self-assessment and awareness resources:
- Myers-Briggs Personality Profile Preferences:
- VIA Strengths:
- VARK Analysis:
Cultural alignment is also a critical consideration to ensure orderly assimilation into the practice/health care setting and with stakeholders. A shared commitment to embed a culture with shared values has relevance to merging cultures – not only when organizations come together – but with individuals as well. Time spent developing a better understanding of the customs, culture and traditions of the practice will be helpful if a practice must change its trajectory based on meeting an unmovable obstruction (for example, market forces requiring practice consolidation).
Improved quality
Transitioning a new provider into an existing practice culture can have a ripple effect on support staff and patient satisfaction and is, therefore, an important consideration in provider onboarding. Written standards, procedures, expectations, and practices are always advisable when possible. Attention to the demographics of the recruited physician is also important with shifts in interests and priorities from a practice. Millennials will constitute most of the workforce by 2025 and arrive with a mindset that the tenure in a role will be shorter than providers before them. Accordingly, the intentionality of the relationship is critical for successful bonding.
If current physician leaders want to achieve simultaneous succession planning and maintain the legacy of a patient-centric and resilient practice, these leaders must consider bridging the “cultural knowledge acumen gap.” James S. Hernandez, MD, MS, FCAP, and colleagues suggest a “connector” role between new and experienced providers. Reverse mentoring/distance/reciprocal mentoring is also mentioned as a two-way learning process between mentor and mentee.
Process structure considerations
Each new hire affects the culture of the practice. Best practices for the onboarding and orientation process should be followed. A written project master list with a timeline for completion of onboarding tasks with responsible and accountable persons, target dates for completion, and measurement should be established. Establishing mutual expectations up front can help practices tailor committee roles and clinical responsibilities to maximize provider engagement and longevity. A robust onboarding process may take up to 2 years depending on the size of the practice and the complexity of its structure and associated duties.
Desired outcomes
The desired outcome of the onboarding process is a satisfied provider whose passion and enthusiasm for quality patient care is demonstrated objectively through excellent performance on clinical quality measures and metrics of patient and referral source satisfaction.
Periodic reviews of how the onboarding process is progressing should be undertaken. These reviews can be modeled after the After-Action Review (AAR) process used in the military for measuring progress. Simply stated, what items went well with onboarding and why? What items did not go well with onboarding and why not? (Consider something like the Center for Medicare & Medicaid Services’ “5 Whys” assessment to determine root cause for items that need correction.) What elements of the onboarding process could be further improved? Using a Delphi method during the AAR session is an excellent way for the group to hear from all participants ranging from senior partners to recently recruited providers.
Conclusion
Medical practices must recognize that assimilating a new provider into the practice through a robust onboarding process is not lost effort but rather a force multiplier. Effective provider onboarding gives the incoming provider a sense of purpose and resolve, which results in optimized clinical productivity and engagement because the new provider is invested in the future of the practice. Once successfully onboarded and integrated into the practice, new providers need to understand that the work effort invested in their onboarding comes with a “pay it forward” obligation for the next provider recruited by the group. Group members also need to realize that the baseline is always changing–the provider onboarding process needs to continually evolve and adapt as the practice changes and new providers are hired.
Mr. Rudnick is a visiting professor and program director healthcare quality, innovation, and strategy at St Thomas University, Miami. Mr. Turner is regional vice president for the Midatlantic market of Covenant Physician Partners.
References
“Best practices for onboarding physicians.” The Rheumatologist. 2019 Sep 17. Accessed 2021 Sep 6. https://www.the-rheumatologist.org/article/best-practices-for-onboarding-new-physicians/
Centers for Medicare & Medicaid Services. Five Whys Tool for Root Cause Analysis: QAPI. 2021. Accessed 2021 Sep 6. https://www.cms.gov/medicare/provider-enrollment-and-certification/qapi/downloads/fivewhys.pdf.
DeIuliis ET, Saylor E. Open J Occup Ther. 2021;9(1):1-13.
Hernandez JS et al. “Discussion: Mentoring millennials for future leadership.” Physician Leadership Journal. 2018 May 14. Accessed 2021 Sep 6. https://www.physicianleaders.org/news/discussion-mentoring-millennials-future-leadership
Moore L et al. J Trauma Acute Care Surg. 2015 Jun;78(6):1168-75..
Klein CJ et al. West J Nurs Res. 2021 Feb;43(2):105-114.
Weinburger T, Gordon J. Health Prog. Nov-Dec 2013;94(6):76-9.
Wentlandt K et al. Healthc Q. 2016;18(4):36-41.
Greater portal use gives patients access, doctors headaches
The use of patient portals that provide access to electronic health records has dramatically increased in the past several years, and patients whose health care practitioner encouraged them to use their online portal accessed them at a higher rate than those who were not encouraged to do so.
These were among the top-line results of a national survey of U.S. adults conducted by the National Institutes of Health from January 2020 to April 2020. Although the COVID-19 pandemic hit the United States in the middle of that period, a report on the survey by the Office of the National Coordinator for Health IT stated, “These findings largely reflect prepandemic rates of individuals being offered and subsequently using their online medical record, also known as a patient portal.”
But with more patient access can come additional work for physicians and other health care practitioners, ranging from an onslaught of patient communications to managing data sent to them by patients.
According to the report, 59% of individuals were offered access to their patient portal, and 38% accessed their record at least once in 2020. By comparison, in 2014, just 42% were offered access to their portal, and 25% used it. But these percentages hardly changed from 2019 to 2020.
The increase in the percentage of people who accessed portals reflects the fact that more people were offered access. In addition, there were signs of rising activity among portal users.
Among patients offered access to their patient portal, 64% accessed it at least once in 2020 – 11 percentage points more than in 2017. Twenty-seven percent of those who had access to a portal used it once or twice; 20% accessed it three to five times; and 18% used it six or more times. The latter two percentages were significantly higher than in 2017.
Of the respondents who were offered access to portals but didn’t use them, 69% said they didn’t access the portal because they preferred to speak with their health care practitioner directly. Sixty-three percent said they didn’t see a need to use their online medical record. This was similar to the percentage 3 years earlier. Other reasons included respondents’ concerns about the privacy/security of online medical records (24%), their lack of comfort with computers (20%), and their lack of Internet access (13%).
The pros and cons of patient portals, greater access
Among portal users who accessed their records through a mobile health app, 51% used the app to facilitate discussions with their health care practitioner in 2020, an 8–percentage point increase from 2017. Fifty-percent of the mobile health app users utilized it to make a decision about how to treat an illness or condition, up from 45% in 2017. And 71% of these individuals used their app to track progress on a health-related goal, just a bit more than in 2017.
Individuals who were encouraged by their health care practitioner to use their patient portal viewed clinical notes and exchanged secure messages with their practitioner at higher rates than those who had not been encouraged. This is not surprising, but it reflects an unintended result of patient portals that many physicians have found burdensome, especially during the pandemic: overflowing electronic in-boxes.
Robert Wachter, MD, chairman of the department of medicine at the University of California, San Francisco, recently tweeted, “We’re seeing huge uptick in in-box messages for MDs during COVID – now seems like biggest driver of MD burnout. The fundamental problem: We turned on 24/7/365 access for patients (who of course like it) with no operational or business model to handle it. Crucial that we fix this.”
Steven Waldren, MD, vice president and chief medical informatics officer at the American Academy of Family Physicians, told this news organization that he agrees that this is a major challenge. “In-box management is a burden on physicians and practices,” he said. “However, it can be done better, either through a team in-box or through better use of technology.”
The team in-box he refers to is a mechanism for triaging patient messages. For example, a triage nurse can look at the messages and decide which ones can be handled by staff and which ones the doctor needs to see. Or physicians and front office staff can see the messages at the same time; a nurse can triage some messages according to protocols, and the physician can respond to any message, depending on what he or she knows about the patient.
Technology can also be enlisted in the effort, he suggested, perhaps by automating the triaging of messages such as prescription refill requests or using artificial intelligence to sort messages by content.
Making patient records portable
Nearly 40% of portal users accessed it using a smartphone app (17%) or with both their smartphone app and their computer (22%). Sixty-one percent of users relied exclusively on computers to access their portals.
About a third of patient portal users downloaded their online medical records in 2020. This proportion has nearly doubled from 17% since 2017, the ONC report noted.
Although the survey didn’t ask about multiple downloads, it appears that most people had to download their records separately from the patient portal of each practitioner who cared for them. Although the Apple Health app allows people to download records to their iPhones from multiple portals using a standard application programming interface, the ONC report says that only 5% of respondents transmitted their records to a service or app, up slightly from 3% in 2017.
Dr. Waldren hopes most patients will have the ability to download and integrate records from multiple practitioners in a few years, but he wouldn’t bet on it.
“A fair amount of work needs to be done on the business side and on figuring out how the data get connected together,” he said. “And there are still privacy concerns with apps.”
Overall, 21% of portal users transmitted their data to at least one outside party in 2020, compared with 14% in 2017. Seventeen percent of them sent their records to another health care practitioner, up from 10% in 2017. Five percent of the users transmitted their records to a caregiver, slightly more than in 2017.
Managing data is a challenge
Asked how physicians feel about portal users adding information to their record or correcting inaccurate information, Dr. Waldren says, “Doctors are already comfortable with patient-generated data. The challenge is managing it. If the patient provides data that’s not easy to put in the EHR, that’s going to add work, and they don’t want to see 100 blood pressure readings.
“You’d be hard-pressed to find a doctor who doesn’t welcome additional information about the patient’s health, but it can be onerous and can take time to enter the data,” Dr. Waldren said.
Overall, he said, “Giving patients the ability to take more ownership of their health and participate in their own care is good and can help us move forward. How this will be integrated into patient care is another question.”
A version of this article first appeared on Medscape.com.