User login
The Alarm Burden of Excess Continuous Pulse Oximetry Monitoring Among Patients With Bronchiolitis
Practice guidelines discourage continuous pulse oximetry (SpO2) monitoring of patients with bronchiolitis who are not receiving supplemental oxygen.1,2 Overuse of SpO2 monitoring in this patient population has been associated with increased length of stay, unnecessary oxygen therapy, and excess hospital costs, without measurable patient benefit.3-5 In spite of this evidence base and expert guidance, nearly half of the more than 100,000 infants admitted for bronchiolitis each year receive excess SpO2 monitoring.6,7
Bronchiolitis guidelines suggest that guideline-discordant SpO2 monitoring may result in excess alarms, which disrupt families’ sleep and engender alarm fatigue among staff.1 Pediatric nurses receive up to 155 alarms per monitored patient per day.8,9 Frequent alarms are associated with slower nurse response times10,11 and increased nurse subjective workload.12
Methods
Cohort
We retrospectively evaluated SpO2 monitoring patterns and alarm rates of children 0 to 24 months old admitted to a general pediatrics service at a tertiary care children’s hospital. We included patients who had a discharge diagnosis of bronchiolitis (International Classification of Diseases, Tenth Revision codes J45x, T17.2x, T17.3x, T17.4x, T17.5x, T17.8x, T17.9x, A37xx, J04x, J05x, J05.1x, J69.0x, J69.1x, J69.8x) between November 24, 2019, and January 21, 2020, the period of time during which alarm data and monitor data were concurrently available for analysis. In order to conservatively assure applicability of clinical practice guidelines, we excluded patients with discharge diagnoses that included other respiratory conditions (eg, reactive airway disease), patients with complex chronic conditions (CCC) as defined by the CCC version 2 classification system,13 and patients with intensive care unit (ICU) stays during the admission.
Time
Flowsheet data detailing nursing respiratory assessments were extracted from the electronic health record (EHR) database (Clarity, Epic Systems). Using previously validated methodology,14 we identified minutes during which patients received supplemental oxygen or high-flow nasal cannula (supplemental oxygen) based on the documented fraction of inspired oxygen (FiO2), flow rate, and support devices. We then identified the final discontinuation of respiratory support during the hospital admission, and censored the 60 minutes after final discontinuation of supplemental oxygen based upon recent monitoring guidelines.2 Minutes up to an hour after supplemental oxygen discontinuation were classified as receiving supplemental oxygen and not included in our analysis. Only minutes between the end of the censored period and hospital discharge were used in the analysis. For patients who never received respiratory support during the admission, we censored the first 60 minutes of the admission and analyzed the remainder of their stay.
SpO2 Monitoring
We used device-integrated, physiologic-monitor, vital sign data sent each minute from the General Electric monitor network to the EHR to identify minutes during which patients were connected to physiologic monitors and transmitting signals from SpO2 sensors. We extracted minute-level SpO2 data from the hospital clinical data warehouse (CDW). Minutes in which SpO2 data were present were classified as “monitored,” an approach previously validated using in-person observation.14
To categorize time as “not receiving supplemental oxygen and continuously monitored (guideline-discordant monitoring),” or “not receiving supplemental oxygen and not continuously monitored (guideline-concordant intermittent measurement),” we evaluated the percent of minutes within an hour during which the patient received SpO2 monitoring and applied an a priori conservative rule. Hours during which ≥90% of minutes had SpO2 monitoring data were classified as “continuously monitored.” Hours during which ≤10% of minutes had SpO2 monitoring data were classified as “intermittently measured.” Hours during which 11% to 89% of minutes included monitor data were excluded from further analysis. The number of continuously monitored hours was tabulated for each patient. The median number of continuously monitored hours was computed; results were stratified by prior receipt of respiratory support.
Alarm Counts
Minute-level monitor alarm counts (the absolute number of abnormal vital signs that triggered a monitor to alarm) were extracted from the CDW. Alarm counts were tabulated for each patient hour. For each patient, the alarm rate (total number of alarms divided by time) was computed for continuously monitored and intermittently measured time. Results were stratified by prior receipt of respiratory support.
The study was reviewed by the institutional review board and determined to meet exemption criteria.
Results
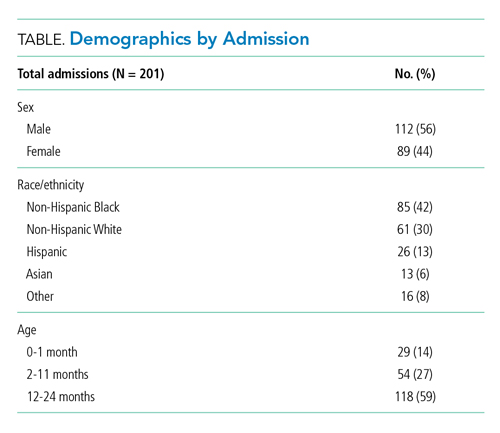
Our cohort included 201 admissions by 197 unique patients (Table). We evaluated 4402 hours that occurred ≥60 minutes following final discontinuation of supplemental oxygen, the time period during which guidelines discourage routine use of continuous SpO2 monitoring. This represented a median of 19 hours (interquartile range [IQR], 14-25) per admission. We excluded 474 hours (11%) that could not be classified as either continuously or intermittently measured.
During time ≥60 minutes following discontinuation of supplemental oxygen, our cohort experienced 1537 hours of guideline-discordant continuous monitoring, a median of 6 hours (IQR, 3-12) per admission. Patients experienced a median of 12 hours (IQR, 5-17) of intermittent measurement. Among patients who received supplemental oxygen, 91% experienced guideline-discordant continuous SpO2 monitoring, as compared to 68% of patients who did not receive supplemental oxygen. Among those who received guideline-discordant continuous SpO2 monitoring, the duration of this monitoring did not differ significantly between those who had received supplemental oxygen during the admission and those who had not.
During classifiable time ≥60 minutes following discontinuation of supplemental oxygen, our cohort experienced 14,371 alarms; 77% (11,101) of these alarms were generated during periods of guideline-discordant continuous monitoring. The median hourly alarm rate during these periods of guideline-discordant continuous monitoring was 6.7 alarms per hour (IQR, 2.1-12.3), representing a median of 35 (IQR, 10-81) additional alarms per patient. During periods of guideline-concordant intermittent measurement, the median hourly alarm rate was 0.5 (IQR, 0.1-0.8), with a median of 5 (IQR, 1-13) alarms per patient.
Those who received supplemental oxygen earlier in the admission had higher alarm rates during continuously monitored time (7.3 per hour [IQR, 2.7-12.7]) than patients who had not received supplemental oxygen (3.3 per hour [IQR, 0.6-11.8]), likely reflecting clinical differences between these patient populations. The most frequent alarm type among continuously monitored patients who had previously received supplemental oxygen was “SpO2 low.”
Discussion
Across 4402 patient hours, guideline-discordant continuous SpO2 monitoring of patients with bronchiolitis resulted in 11,101 alarms, at a rate of approximately 1 additional alarm every 9 minutes. Patients in our cohort received a median of 6 hours of guideline-discordant monitoring, which imposes a significant alarm burden that is potentially modifiable using targeted reduction strategies.15
Transient, self-resolved hypoxemia is a common feature of bronchiolitis and likely of little clinical consequence.16 Therefore, this rate of hypoxemia alarms is not unexpected. Though we evaluated only the period of time following final discontinuation of respiratory support, this finding is in keeping with the literature associating excess physiologic monitoring of patients with bronchiolitis with unnecessary oxygen therapy and increased length of stay,3-5 largely because clinicians may feel compelled to respond to hypoxemia alarms with either supplemental oxygen or longer monitoring.
Our findings must be contextualized in light of the limitations of our approach. We did not evaluate nurse workload associated with guideline-discordant continuous SpO2 monitoring. Prior work conducted by our lab has demonstrated that when nurses experience more than 40 alarms within a 2-hour period, their measured subjective workload increases to a degree associated with missing important tasks, threatening the quality and safety of the care they deliver.12,17 Given that nurses care for multiple patients, it is likely that the excess alarms introduced by guideline-discordant continuous monitoring contribute to increased nurse workload and alarm fatigue.
Similarly, we could not evaluate whether the alarms nurses experienced were actionable. Although our lab has previously reported that ≥99% of alarms occurring on non-ICU pediatric wards are nonactionable,10,11 it is possible that some of the alarms during guideline-discordant monitoring periods required action. However, it is unlikely that any life-sustaining actions were taken because (1) we only evaluated time >60 minutes after final discontinuation of supplemental oxygen, so by definition none of these alarms required treatment with supplemental oxygen, and (2) none of the patients we included received ICU care during their admission.
The avoidable alarm burden identified in our analysis suggests that eliminating continuous SpO2 monitoring overuse in bronchiolitis will likely reduce nurses’ workload and alarm fatigue in hospital settings that care for children with bronchiolitis.
1. Ralston SL, Lieberthal AS, Meissner HC, et al. Clinical practice guideline: the diagnosis, management, and prevention of bronchiolitis. Pediatrics. 2014;134(5):e1474-e1502. https://doi.org/10.1542/peds.2014-2742
2. Schondelmeyer AC, Dewan ML, Brady PW, et al. Cardiorespiratory and pulse oximetry monitoring in hospitalized children: a Delphi process. Pediatrics. 2020;146(2):e20193336. https://doi.org/10.1542/peds.2019-3336
3. Cunningham S, Rodriguez A, Boyd KA, McIntosh E, Lewis SC, BIDS Collaborators Group. Bronchiolitis of Infancy Discharge Study (BIDS): A multicentre, parallel-group, double-blind, randomised controlled, equivalence trial with economic evaluation. Health Technol Assess. 2015;19(71):i-xxiii, 1-172. https://doi.org/10.3310/hta19710
4. McCulloh R, Koster M, Ralston S, et al. Use of intermittent vs continuous pulse oximetry for nonhypoxemic infants and young children hospitalized for bronchiolitis: a randomized clinical trial. JAMA Pediatr. 2015;169(10):898-904. https://doi.org/10.1001/jamapediatrics.2015.1746
5. Schuh S, Freedman S, Coates A, et al. Effect of oximetry on hospitalization in bronchiolitis: a randomized clinical trial. JAMA. 2014;312(7):712-718. https://doi.org/10.1001/jama.2014.8637
6. Fujiogi M, Goto T, Yasunaga H, et al. Trends in bronchiolitis hospitalizations in the United States: 2000–2016. Pediatrics. 2019;144(6):e20192614. https://doi.org/10.1542/peds.2019-2614
7. Bonafide CP, Xiao R, Brady PW, et al. Prevalence of continuous pulse oximetry monitoring in hospitalized children with bronchiolitis not requiring supplemental oxygen. JAMA. 2020;323(15):1467-1477. https://doi.org/10.1001/jama.2020.2998
8. Schondelmeyer AC, Brady PW, Goel VV, et al. Physiologic monitor alarm rates at 5 children’s hospitals. J Hosp Med. 2018;13(6):396-398. https://doi.org/10.12788/jhm.2918
9. Schondelmeyer AC, Bonafide CP, Goel VV, et al. The frequency of physiologic monitor alarms in a children’s hospital. J Hosp Med. 2016;11(11):796-798. https://doi.org/10.1002/jhm.2612
10. Bonafide CP, Lin R, Zander M, et al. Association between exposure to nonactionable physiologic monitor alarms and response time in a children’s hospital. J Hosp Med. 2015;10(6):345-351. https://doi.org/10.1002/jhm.2331
11. Bonafide CP, Localio AR, Holmes JH, et al. Video analysis of factors associated with response time to physiologic monitor alarms in a children’s hospital. JAMA Pediatr. 2017;171(6):524-531. https://doi.org/10.1001/jamapediatrics.2016.5123
12. Rasooly IR, Kern-Goldberger AS, Xiao R, et al. Physiologic monitor alarm burden and nurses’ subjective workload in a children’s hospital. Hosp Pediatr. 2021;11(7):703-710. https://doi.org/10.1542/hpeds.2020-003509
13. Feudtner C, Feinstein JA, Zhong W, Hall M, Dai D. Pediatric complex chronic conditions classification system version 2: updated for ICD-10 and complex medical technology dependence and transplantation. BMC Pediatr. 2014;14:199. https://doi.org/10.1186/1471-2431-14-199
14. Kern-Goldberger AS, Rasooly IR, Luo B, et al. EHR-integrated monitor data to measure pulse oximetry use in bronchiolitis. Hosp Pediatr. 2021;11(10):1073-1082. https://doi.org/10.1542/hpeds.2021-005894
15. Schondelmeyer AC, Bettencourt AP, Xiao R, et al. Evaluation of an educational outreach and audit and feedback program to reduce continuous pulse oximetry use in hospitalized infants with stable bronchiolitis. JAMA Netw Open. 2021;4(9):e2122826. https://doi.org/10.1001/jamanetworkopen.2021.22826
16. Principi T, Coates AL, Parkin PC, Stephens D, DaSilva Z, Schuh S. Effect of oxygen desaturations on subsequent medical visits in infants discharged from the emergency department with bronchiolitis. JAMA Pediatr. 2016;170(6):602-608. https://doi.org/10.1001/jamapediatrics.2016.0114
17. Tubbs-Cooley HL, Mara CA, Carle AC, Mark BA, Pickler RH. Association of nurse workload with missed nursing care in the neonatal intensive care unit. JAMA Pediatr. 2019;173(1):44-51. https://doi.org/10.1001/jamapediatrics.2018.3619
Practice guidelines discourage continuous pulse oximetry (SpO2) monitoring of patients with bronchiolitis who are not receiving supplemental oxygen.1,2 Overuse of SpO2 monitoring in this patient population has been associated with increased length of stay, unnecessary oxygen therapy, and excess hospital costs, without measurable patient benefit.3-5 In spite of this evidence base and expert guidance, nearly half of the more than 100,000 infants admitted for bronchiolitis each year receive excess SpO2 monitoring.6,7
Bronchiolitis guidelines suggest that guideline-discordant SpO2 monitoring may result in excess alarms, which disrupt families’ sleep and engender alarm fatigue among staff.1 Pediatric nurses receive up to 155 alarms per monitored patient per day.8,9 Frequent alarms are associated with slower nurse response times10,11 and increased nurse subjective workload.12
Methods
Cohort
We retrospectively evaluated SpO2 monitoring patterns and alarm rates of children 0 to 24 months old admitted to a general pediatrics service at a tertiary care children’s hospital. We included patients who had a discharge diagnosis of bronchiolitis (International Classification of Diseases, Tenth Revision codes J45x, T17.2x, T17.3x, T17.4x, T17.5x, T17.8x, T17.9x, A37xx, J04x, J05x, J05.1x, J69.0x, J69.1x, J69.8x) between November 24, 2019, and January 21, 2020, the period of time during which alarm data and monitor data were concurrently available for analysis. In order to conservatively assure applicability of clinical practice guidelines, we excluded patients with discharge diagnoses that included other respiratory conditions (eg, reactive airway disease), patients with complex chronic conditions (CCC) as defined by the CCC version 2 classification system,13 and patients with intensive care unit (ICU) stays during the admission.
Time
Flowsheet data detailing nursing respiratory assessments were extracted from the electronic health record (EHR) database (Clarity, Epic Systems). Using previously validated methodology,14 we identified minutes during which patients received supplemental oxygen or high-flow nasal cannula (supplemental oxygen) based on the documented fraction of inspired oxygen (FiO2), flow rate, and support devices. We then identified the final discontinuation of respiratory support during the hospital admission, and censored the 60 minutes after final discontinuation of supplemental oxygen based upon recent monitoring guidelines.2 Minutes up to an hour after supplemental oxygen discontinuation were classified as receiving supplemental oxygen and not included in our analysis. Only minutes between the end of the censored period and hospital discharge were used in the analysis. For patients who never received respiratory support during the admission, we censored the first 60 minutes of the admission and analyzed the remainder of their stay.
SpO2 Monitoring
We used device-integrated, physiologic-monitor, vital sign data sent each minute from the General Electric monitor network to the EHR to identify minutes during which patients were connected to physiologic monitors and transmitting signals from SpO2 sensors. We extracted minute-level SpO2 data from the hospital clinical data warehouse (CDW). Minutes in which SpO2 data were present were classified as “monitored,” an approach previously validated using in-person observation.14
To categorize time as “not receiving supplemental oxygen and continuously monitored (guideline-discordant monitoring),” or “not receiving supplemental oxygen and not continuously monitored (guideline-concordant intermittent measurement),” we evaluated the percent of minutes within an hour during which the patient received SpO2 monitoring and applied an a priori conservative rule. Hours during which ≥90% of minutes had SpO2 monitoring data were classified as “continuously monitored.” Hours during which ≤10% of minutes had SpO2 monitoring data were classified as “intermittently measured.” Hours during which 11% to 89% of minutes included monitor data were excluded from further analysis. The number of continuously monitored hours was tabulated for each patient. The median number of continuously monitored hours was computed; results were stratified by prior receipt of respiratory support.
Alarm Counts
Minute-level monitor alarm counts (the absolute number of abnormal vital signs that triggered a monitor to alarm) were extracted from the CDW. Alarm counts were tabulated for each patient hour. For each patient, the alarm rate (total number of alarms divided by time) was computed for continuously monitored and intermittently measured time. Results were stratified by prior receipt of respiratory support.
The study was reviewed by the institutional review board and determined to meet exemption criteria.
Results
Our cohort included 201 admissions by 197 unique patients (Table). We evaluated 4402 hours that occurred ≥60 minutes following final discontinuation of supplemental oxygen, the time period during which guidelines discourage routine use of continuous SpO2 monitoring. This represented a median of 19 hours (interquartile range [IQR], 14-25) per admission. We excluded 474 hours (11%) that could not be classified as either continuously or intermittently measured.
During time ≥60 minutes following discontinuation of supplemental oxygen, our cohort experienced 1537 hours of guideline-discordant continuous monitoring, a median of 6 hours (IQR, 3-12) per admission. Patients experienced a median of 12 hours (IQR, 5-17) of intermittent measurement. Among patients who received supplemental oxygen, 91% experienced guideline-discordant continuous SpO2 monitoring, as compared to 68% of patients who did not receive supplemental oxygen. Among those who received guideline-discordant continuous SpO2 monitoring, the duration of this monitoring did not differ significantly between those who had received supplemental oxygen during the admission and those who had not.
During classifiable time ≥60 minutes following discontinuation of supplemental oxygen, our cohort experienced 14,371 alarms; 77% (11,101) of these alarms were generated during periods of guideline-discordant continuous monitoring. The median hourly alarm rate during these periods of guideline-discordant continuous monitoring was 6.7 alarms per hour (IQR, 2.1-12.3), representing a median of 35 (IQR, 10-81) additional alarms per patient. During periods of guideline-concordant intermittent measurement, the median hourly alarm rate was 0.5 (IQR, 0.1-0.8), with a median of 5 (IQR, 1-13) alarms per patient.
Those who received supplemental oxygen earlier in the admission had higher alarm rates during continuously monitored time (7.3 per hour [IQR, 2.7-12.7]) than patients who had not received supplemental oxygen (3.3 per hour [IQR, 0.6-11.8]), likely reflecting clinical differences between these patient populations. The most frequent alarm type among continuously monitored patients who had previously received supplemental oxygen was “SpO2 low.”
Discussion
Across 4402 patient hours, guideline-discordant continuous SpO2 monitoring of patients with bronchiolitis resulted in 11,101 alarms, at a rate of approximately 1 additional alarm every 9 minutes. Patients in our cohort received a median of 6 hours of guideline-discordant monitoring, which imposes a significant alarm burden that is potentially modifiable using targeted reduction strategies.15
Transient, self-resolved hypoxemia is a common feature of bronchiolitis and likely of little clinical consequence.16 Therefore, this rate of hypoxemia alarms is not unexpected. Though we evaluated only the period of time following final discontinuation of respiratory support, this finding is in keeping with the literature associating excess physiologic monitoring of patients with bronchiolitis with unnecessary oxygen therapy and increased length of stay,3-5 largely because clinicians may feel compelled to respond to hypoxemia alarms with either supplemental oxygen or longer monitoring.
Our findings must be contextualized in light of the limitations of our approach. We did not evaluate nurse workload associated with guideline-discordant continuous SpO2 monitoring. Prior work conducted by our lab has demonstrated that when nurses experience more than 40 alarms within a 2-hour period, their measured subjective workload increases to a degree associated with missing important tasks, threatening the quality and safety of the care they deliver.12,17 Given that nurses care for multiple patients, it is likely that the excess alarms introduced by guideline-discordant continuous monitoring contribute to increased nurse workload and alarm fatigue.
Similarly, we could not evaluate whether the alarms nurses experienced were actionable. Although our lab has previously reported that ≥99% of alarms occurring on non-ICU pediatric wards are nonactionable,10,11 it is possible that some of the alarms during guideline-discordant monitoring periods required action. However, it is unlikely that any life-sustaining actions were taken because (1) we only evaluated time >60 minutes after final discontinuation of supplemental oxygen, so by definition none of these alarms required treatment with supplemental oxygen, and (2) none of the patients we included received ICU care during their admission.
The avoidable alarm burden identified in our analysis suggests that eliminating continuous SpO2 monitoring overuse in bronchiolitis will likely reduce nurses’ workload and alarm fatigue in hospital settings that care for children with bronchiolitis.
1. Ralston SL, Lieberthal AS, Meissner HC, et al. Clinical practice guideline: the diagnosis, management, and prevention of bronchiolitis. Pediatrics. 2014;134(5):e1474-e1502. https://doi.org/10.1542/peds.2014-2742
2. Schondelmeyer AC, Dewan ML, Brady PW, et al. Cardiorespiratory and pulse oximetry monitoring in hospitalized children: a Delphi process. Pediatrics. 2020;146(2):e20193336. https://doi.org/10.1542/peds.2019-3336
3. Cunningham S, Rodriguez A, Boyd KA, McIntosh E, Lewis SC, BIDS Collaborators Group. Bronchiolitis of Infancy Discharge Study (BIDS): A multicentre, parallel-group, double-blind, randomised controlled, equivalence trial with economic evaluation. Health Technol Assess. 2015;19(71):i-xxiii, 1-172. https://doi.org/10.3310/hta19710
4. McCulloh R, Koster M, Ralston S, et al. Use of intermittent vs continuous pulse oximetry for nonhypoxemic infants and young children hospitalized for bronchiolitis: a randomized clinical trial. JAMA Pediatr. 2015;169(10):898-904. https://doi.org/10.1001/jamapediatrics.2015.1746
5. Schuh S, Freedman S, Coates A, et al. Effect of oximetry on hospitalization in bronchiolitis: a randomized clinical trial. JAMA. 2014;312(7):712-718. https://doi.org/10.1001/jama.2014.8637
6. Fujiogi M, Goto T, Yasunaga H, et al. Trends in bronchiolitis hospitalizations in the United States: 2000–2016. Pediatrics. 2019;144(6):e20192614. https://doi.org/10.1542/peds.2019-2614
7. Bonafide CP, Xiao R, Brady PW, et al. Prevalence of continuous pulse oximetry monitoring in hospitalized children with bronchiolitis not requiring supplemental oxygen. JAMA. 2020;323(15):1467-1477. https://doi.org/10.1001/jama.2020.2998
8. Schondelmeyer AC, Brady PW, Goel VV, et al. Physiologic monitor alarm rates at 5 children’s hospitals. J Hosp Med. 2018;13(6):396-398. https://doi.org/10.12788/jhm.2918
9. Schondelmeyer AC, Bonafide CP, Goel VV, et al. The frequency of physiologic monitor alarms in a children’s hospital. J Hosp Med. 2016;11(11):796-798. https://doi.org/10.1002/jhm.2612
10. Bonafide CP, Lin R, Zander M, et al. Association between exposure to nonactionable physiologic monitor alarms and response time in a children’s hospital. J Hosp Med. 2015;10(6):345-351. https://doi.org/10.1002/jhm.2331
11. Bonafide CP, Localio AR, Holmes JH, et al. Video analysis of factors associated with response time to physiologic monitor alarms in a children’s hospital. JAMA Pediatr. 2017;171(6):524-531. https://doi.org/10.1001/jamapediatrics.2016.5123
12. Rasooly IR, Kern-Goldberger AS, Xiao R, et al. Physiologic monitor alarm burden and nurses’ subjective workload in a children’s hospital. Hosp Pediatr. 2021;11(7):703-710. https://doi.org/10.1542/hpeds.2020-003509
13. Feudtner C, Feinstein JA, Zhong W, Hall M, Dai D. Pediatric complex chronic conditions classification system version 2: updated for ICD-10 and complex medical technology dependence and transplantation. BMC Pediatr. 2014;14:199. https://doi.org/10.1186/1471-2431-14-199
14. Kern-Goldberger AS, Rasooly IR, Luo B, et al. EHR-integrated monitor data to measure pulse oximetry use in bronchiolitis. Hosp Pediatr. 2021;11(10):1073-1082. https://doi.org/10.1542/hpeds.2021-005894
15. Schondelmeyer AC, Bettencourt AP, Xiao R, et al. Evaluation of an educational outreach and audit and feedback program to reduce continuous pulse oximetry use in hospitalized infants with stable bronchiolitis. JAMA Netw Open. 2021;4(9):e2122826. https://doi.org/10.1001/jamanetworkopen.2021.22826
16. Principi T, Coates AL, Parkin PC, Stephens D, DaSilva Z, Schuh S. Effect of oxygen desaturations on subsequent medical visits in infants discharged from the emergency department with bronchiolitis. JAMA Pediatr. 2016;170(6):602-608. https://doi.org/10.1001/jamapediatrics.2016.0114
17. Tubbs-Cooley HL, Mara CA, Carle AC, Mark BA, Pickler RH. Association of nurse workload with missed nursing care in the neonatal intensive care unit. JAMA Pediatr. 2019;173(1):44-51. https://doi.org/10.1001/jamapediatrics.2018.3619
© 2021 Society of Hospital Medicine
Initiation of Long-Acting Opioids Following Hospital Discharge Among Medicare Beneficiaries
Transition out of the hospital is a vulnerable time for older adults. Medications, particularly opioids, are a common cause of adverse events during this transitionary period.1,2 For hospitalized patients with acute noncancer pain that necessitates opioid treatment, guidelines recommend using short-acting, rather than long-acting, opioids.3,4 Long-acting opioids have a longer duration of action but also have a significantly elevated risk of unintentional overdose and morbidity compared to short-acting opioids, even when total daily dosing is identical.5,6 This risk is highest in the first 2 weeks following initial prescription.7,8
Despite the recent decrease in overall prescription of opioids,9 a small but significant proportion continue to be prescribed as long-acting formulations.10-12 We sought to understand the incidence of, and patient characteristics associated with, long-acting opioid initiation following hospital discharge among opioid-naïve older adults.
METHODS
We examined the 20% random sample of US Medicare beneficiaries ≥65 years old who were hospitalized in 2016 and continuously enrolled in Parts A, B, and D for 1 year prior and 1 month following discharge, excluding beneficiaries with cancer or hospice care, those transferred from or discharged to a care facility, and those who had filled a prescription for an opioid within 90 days prior to hospitalization. We identified beneficiaries with a Part D claim for an opioid, excluding methadone and buprenorphine, within 7 days of discharge. We compared beneficiaries with at least one claim for a long-acting opioid (including extended-release formulations) within 7 days of hospital discharge to those with short-acting opioid claims only.
We used a multivariable, generalized estimating equation to determine patient-level factors independently associated with prescription of any long-acting opioids. We selected characteristics that we hypothesized to be associated with new opioid prescription, based on clinical experience and previous literature, including sociodemographics, patient clinical characteristics such as a modified Elixhauser index (a composite index of nearly 30 comorbidities, excluding cancer),13 substance use-related factors, co-prescribed medications, and hospitalization-related factors. The latter included being hospitalized for a medical vs surgical reason, defined based on diagnosis-related group (DRG), primary diagnosis, and primary procedure, grouped using the Agency for Healthcare Research and Quality Clinical Classification System14 (Table 1).
We conducted a sensitivity analysis, excluding beneficiaries with high-dose long-term opioid use in the year before hospitalization.
RESULTS
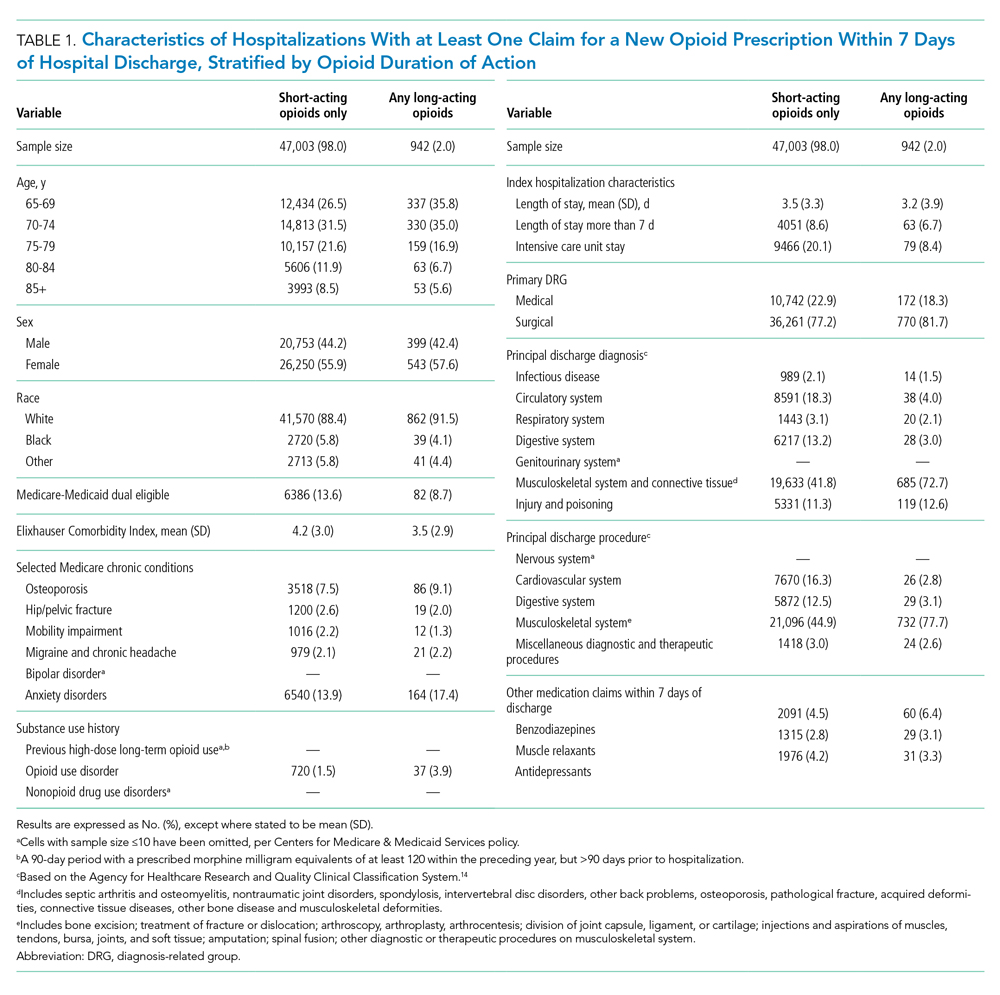
Of 258,193 hospitalizations meeting eligibility criteria, 47,945 (18.6%) had an opioid claim within 7 days of discharge and comprised our analytic cohort (see the Appendix Figure for the study consort diagram), including 47,003 (18.2%) with short-acting opioids only and 942 (0.4%) with at least one claim for long-acting opioids, of whom 817 received both short- and long-acting opioids (Table 1).
Beneficiaries with long-acting opioid claims were more likely to be younger (ages 65-69 and 70-74 years) and White than those with claims for short-acting opioids only. They had a lower mean number of Elixhauser comorbidities but a higher prevalence of mental health conditions, including anxiety disorders and opioid use disorder, as well as a higher prevalence of previous high-dose long-term opioid use (occurring more than 90 days prior to hospitalization). They were more likely to have been hospitalized for a procedural rather than a medical reason, with 770 of the 942 (81.7%) beneficiaries receiving long-acting opioids having been hospitalized for a procedural reason (based on DRG). They were also more likely to have benzodiazepine co-prescription.
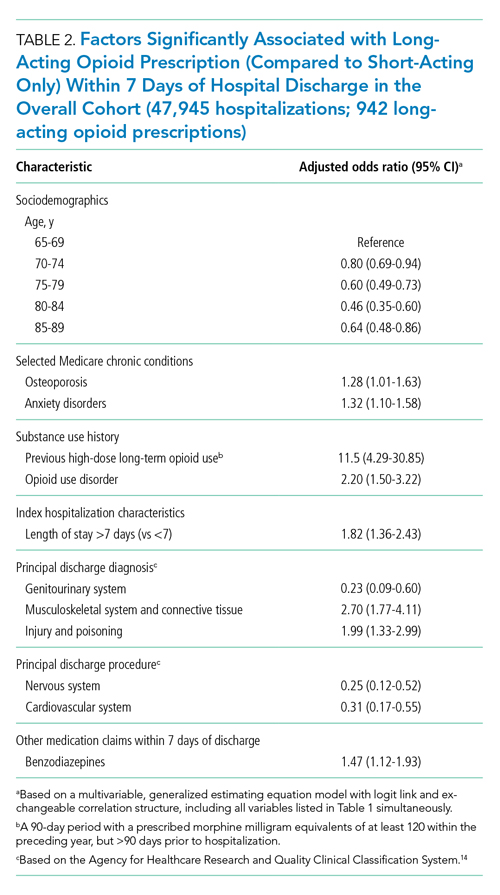
Factors independently associated with receipt of long-acting opioids compared to short-acting opioids only included younger age, having been admitted for a musculoskeletal problem, and presence of known risk factors for opioid-related adverse events, including anxiety disorders, opioid use disorder, prior long-term high-dose opioid use, and benzodiazepine co-prescription (Table 2). After excluding 33 beneficiaries with previous high-dose long-term opioid use in the year before hospitalization, associations were unchanged (Appendix Table).
DISCUSSION
Among a nationally representative sample of opioid-naïve Medicare beneficiaries without cancer, almost 20% filled a new opioid prescription within 7 days of hospital discharge. While prescription of long-acting opioids was uncommon, 81.7% who were prescribed a long-acting opioid had a procedural reason for hospitalization, raising concern since postoperative pain is typically acute and limited. Beneficiaries started on long-acting opioids more frequently had risk factors for opioid-related adverse events, including history of opioid use disorder and benzodiazepine co-prescription. With nearly three-quarters of patients with a long-acting opioid claim having been hospitalized for musculoskeletal disorders or orthopedic procedures, this population represents a key target for quality improvement interventions.
This is the first analysis describing the incidence and factors associated with long-acting opioid receipt shortly after hospital discharge among Medicare beneficiaries. Given that our data predate the publication of the Society of Hospital Medicine’s consensus statement on safe opioid prescribing in hospitalized patients,3 it is possible that there have been changes to prescribing patterns since 2016 that we are unable to characterize with our data. We are also limited by an inability to determine the appropriateness of any individual long-acting opioid prescription, though previous research has shown that long-acting opioids are frequently inappropriately initiated in older adults.15 Finally, our findings may not be generalizable to non-Medicare populations.
While long-acting opioid initiation following hospitalization is uncommon, these medications are most often prescribed to individuals with pain that is typically of limited duration and those at high risk for harm. Our findings highlight potential targets for systems-based solutions to improve guideline-concordant prescribing of long-acting opioids.
1. Tsilimingras D, Schnipper J, Duke A, et al. Post-discharge adverse events among urban and rural patients of an urban community hospital: a prospective cohort study. J Gen Intern Med. 2015;30(8):1164-1171. https://doi.org/10.1007/s11606-015-3260-3
2. Forster AJ, Murff HJ, Peterson JF, Gandhi TK, Bates DW. The incidence and severity of adverse events affecting patients after discharge from the hospital. Ann Intern Med. 2003;138(3):161-167. https://doi.org/10.7326/0003-4819-138-3-200302040-00007
3. Herzig SJ, Mosher HJ, Calcaterra SL, Jena AB, Nuckols TK. Improving the safety of opioid use for acute noncancer pain in hospitalized adults: a consensus statement from the Society of Hospital Medicine. J Hosp Med. 2018;13(4):263-271. https://doi.org/10.12788/jhm.2980
4. Herzig SJ, Calcaterra SL, Mosher HJ, et al. Safe opioid prescribing for acute noncancer pain in hospitalized adults: a systematic review of existing guidelines. J Hosp Med. 2018;13(4):256-262. https://doi.org/10.12788/jhm.2979
5. Barnett ML, Olenski AR, Thygeson NM, et al. A health plan’s formulary led to reduced use of extended-release opioids but did not lower overall opioid use. Health Aff (Millwood). 2018;37(9):1509-1516. https://doi.org/10.1377/hlthaff.2018.0391
6. Carey CM, Jena AB, Barnett ML. Patterns of potential opioid misuse and subsequent adverse outcomes in Medicare, 2008 to 2012. Ann Intern Med. 2018;168(12):837-845. https://doi.org/10.7326/M17-3065
7. Miller M, Barber CW, Leatherman S, et al. Prescription opioid duration of action and the risk of unintentional overdose among patients receiving opioid therapy. JAMA Intern Med. 2015;175(4):608-615. https://doi.org/10.1001/jamainternmed.2014.8071
8. Ray WA, Chung CP, Murray KT, Hall K, Stein CM. Prescription of long-acting opioids and mortality in patients with chronic noncancer pain. JAMA. 2016;315(22):2415-2423. https://doi.org/10.1001/jama.2016.7789
9. Zhu W, Chernew ME, Sherry TB, Maestas N. Initial opioid prescriptions among U.S. commercially insured patients, 2012-2017. N Engl J Med. 2019;380(11):1043-1052. https://doi.org/10.1056/NEJMsa1807069
10. Starner I, Gleason P. Short-acting, long-acting, and abuse-deterrent opioid utilization patterns among 15 million commercially insured members. Presented at: Academy of Managed Care Pharmacy (AMCP) Nexus; October 3-6, 2016; National Harbor, MD.
11. Young JC, Lund JL, Dasgupta N, Jonsson Funk M. Opioid tolerance and clinically recognized opioid poisoning among patients prescribed extended-release long-acting opioids. Pharmacoepidemiol Drug Saf. 2019;28(1):39-47. https://doi.org/10.1002/pds.4572
12. Hwang CS, Kang EM, Ding Y, et al. Patterns of immediate-release and extended-release opioid analgesic use in the management of chronic pain, 2003-2014. JAMA Netw Open. 2018;1(2):e180216. https://doi.org/10.1001/jamanetworkopen.2018.0216
13. Elixhauser A, Steiner C, Harris DR, Coffey RM. Comorbidity measures for use with administrative data. Med Care. 1998;36(1):8-27. https://doi.org/10.1097/00005650-199801000-00004
14. Agency for Healthcare Research and Quality. Clinical Classifications Software (CCS) for ICD-10-CM/PCS. Healthcare Cost and Utilization Project (HCUP). October 2018. www.hcup-us.ahrq.gov/toolssoftware/ccs10/ccs10.jsp
15. Willy ME, Graham DJ, Racoosin JA, et al. Candidate metrics for evaluating the impact of prescriber education on the safe use of extended-release/long-acting (ER/LA) opioid analgesics. Pain Med. 2014;15(9):1558-1568. https://doi.org/10.1111/pme.12459
Transition out of the hospital is a vulnerable time for older adults. Medications, particularly opioids, are a common cause of adverse events during this transitionary period.1,2 For hospitalized patients with acute noncancer pain that necessitates opioid treatment, guidelines recommend using short-acting, rather than long-acting, opioids.3,4 Long-acting opioids have a longer duration of action but also have a significantly elevated risk of unintentional overdose and morbidity compared to short-acting opioids, even when total daily dosing is identical.5,6 This risk is highest in the first 2 weeks following initial prescription.7,8
Despite the recent decrease in overall prescription of opioids,9 a small but significant proportion continue to be prescribed as long-acting formulations.10-12 We sought to understand the incidence of, and patient characteristics associated with, long-acting opioid initiation following hospital discharge among opioid-naïve older adults.
METHODS
We examined the 20% random sample of US Medicare beneficiaries ≥65 years old who were hospitalized in 2016 and continuously enrolled in Parts A, B, and D for 1 year prior and 1 month following discharge, excluding beneficiaries with cancer or hospice care, those transferred from or discharged to a care facility, and those who had filled a prescription for an opioid within 90 days prior to hospitalization. We identified beneficiaries with a Part D claim for an opioid, excluding methadone and buprenorphine, within 7 days of discharge. We compared beneficiaries with at least one claim for a long-acting opioid (including extended-release formulations) within 7 days of hospital discharge to those with short-acting opioid claims only.
We used a multivariable, generalized estimating equation to determine patient-level factors independently associated with prescription of any long-acting opioids. We selected characteristics that we hypothesized to be associated with new opioid prescription, based on clinical experience and previous literature, including sociodemographics, patient clinical characteristics such as a modified Elixhauser index (a composite index of nearly 30 comorbidities, excluding cancer),13 substance use-related factors, co-prescribed medications, and hospitalization-related factors. The latter included being hospitalized for a medical vs surgical reason, defined based on diagnosis-related group (DRG), primary diagnosis, and primary procedure, grouped using the Agency for Healthcare Research and Quality Clinical Classification System14 (Table 1).
We conducted a sensitivity analysis, excluding beneficiaries with high-dose long-term opioid use in the year before hospitalization.
RESULTS
Of 258,193 hospitalizations meeting eligibility criteria, 47,945 (18.6%) had an opioid claim within 7 days of discharge and comprised our analytic cohort (see the Appendix Figure for the study consort diagram), including 47,003 (18.2%) with short-acting opioids only and 942 (0.4%) with at least one claim for long-acting opioids, of whom 817 received both short- and long-acting opioids (Table 1).
Beneficiaries with long-acting opioid claims were more likely to be younger (ages 65-69 and 70-74 years) and White than those with claims for short-acting opioids only. They had a lower mean number of Elixhauser comorbidities but a higher prevalence of mental health conditions, including anxiety disorders and opioid use disorder, as well as a higher prevalence of previous high-dose long-term opioid use (occurring more than 90 days prior to hospitalization). They were more likely to have been hospitalized for a procedural rather than a medical reason, with 770 of the 942 (81.7%) beneficiaries receiving long-acting opioids having been hospitalized for a procedural reason (based on DRG). They were also more likely to have benzodiazepine co-prescription.
Factors independently associated with receipt of long-acting opioids compared to short-acting opioids only included younger age, having been admitted for a musculoskeletal problem, and presence of known risk factors for opioid-related adverse events, including anxiety disorders, opioid use disorder, prior long-term high-dose opioid use, and benzodiazepine co-prescription (Table 2). After excluding 33 beneficiaries with previous high-dose long-term opioid use in the year before hospitalization, associations were unchanged (Appendix Table).
DISCUSSION
Among a nationally representative sample of opioid-naïve Medicare beneficiaries without cancer, almost 20% filled a new opioid prescription within 7 days of hospital discharge. While prescription of long-acting opioids was uncommon, 81.7% who were prescribed a long-acting opioid had a procedural reason for hospitalization, raising concern since postoperative pain is typically acute and limited. Beneficiaries started on long-acting opioids more frequently had risk factors for opioid-related adverse events, including history of opioid use disorder and benzodiazepine co-prescription. With nearly three-quarters of patients with a long-acting opioid claim having been hospitalized for musculoskeletal disorders or orthopedic procedures, this population represents a key target for quality improvement interventions.
This is the first analysis describing the incidence and factors associated with long-acting opioid receipt shortly after hospital discharge among Medicare beneficiaries. Given that our data predate the publication of the Society of Hospital Medicine’s consensus statement on safe opioid prescribing in hospitalized patients,3 it is possible that there have been changes to prescribing patterns since 2016 that we are unable to characterize with our data. We are also limited by an inability to determine the appropriateness of any individual long-acting opioid prescription, though previous research has shown that long-acting opioids are frequently inappropriately initiated in older adults.15 Finally, our findings may not be generalizable to non-Medicare populations.
While long-acting opioid initiation following hospitalization is uncommon, these medications are most often prescribed to individuals with pain that is typically of limited duration and those at high risk for harm. Our findings highlight potential targets for systems-based solutions to improve guideline-concordant prescribing of long-acting opioids.
1. Tsilimingras D, Schnipper J, Duke A, et al. Post-discharge adverse events among urban and rural patients of an urban community hospital: a prospective cohort study. J Gen Intern Med. 2015;30(8):1164-1171. https://doi.org/10.1007/s11606-015-3260-3
2. Forster AJ, Murff HJ, Peterson JF, Gandhi TK, Bates DW. The incidence and severity of adverse events affecting patients after discharge from the hospital. Ann Intern Med. 2003;138(3):161-167. https://doi.org/10.7326/0003-4819-138-3-200302040-00007
3. Herzig SJ, Mosher HJ, Calcaterra SL, Jena AB, Nuckols TK. Improving the safety of opioid use for acute noncancer pain in hospitalized adults: a consensus statement from the Society of Hospital Medicine. J Hosp Med. 2018;13(4):263-271. https://doi.org/10.12788/jhm.2980
4. Herzig SJ, Calcaterra SL, Mosher HJ, et al. Safe opioid prescribing for acute noncancer pain in hospitalized adults: a systematic review of existing guidelines. J Hosp Med. 2018;13(4):256-262. https://doi.org/10.12788/jhm.2979
5. Barnett ML, Olenski AR, Thygeson NM, et al. A health plan’s formulary led to reduced use of extended-release opioids but did not lower overall opioid use. Health Aff (Millwood). 2018;37(9):1509-1516. https://doi.org/10.1377/hlthaff.2018.0391
6. Carey CM, Jena AB, Barnett ML. Patterns of potential opioid misuse and subsequent adverse outcomes in Medicare, 2008 to 2012. Ann Intern Med. 2018;168(12):837-845. https://doi.org/10.7326/M17-3065
7. Miller M, Barber CW, Leatherman S, et al. Prescription opioid duration of action and the risk of unintentional overdose among patients receiving opioid therapy. JAMA Intern Med. 2015;175(4):608-615. https://doi.org/10.1001/jamainternmed.2014.8071
8. Ray WA, Chung CP, Murray KT, Hall K, Stein CM. Prescription of long-acting opioids and mortality in patients with chronic noncancer pain. JAMA. 2016;315(22):2415-2423. https://doi.org/10.1001/jama.2016.7789
9. Zhu W, Chernew ME, Sherry TB, Maestas N. Initial opioid prescriptions among U.S. commercially insured patients, 2012-2017. N Engl J Med. 2019;380(11):1043-1052. https://doi.org/10.1056/NEJMsa1807069
10. Starner I, Gleason P. Short-acting, long-acting, and abuse-deterrent opioid utilization patterns among 15 million commercially insured members. Presented at: Academy of Managed Care Pharmacy (AMCP) Nexus; October 3-6, 2016; National Harbor, MD.
11. Young JC, Lund JL, Dasgupta N, Jonsson Funk M. Opioid tolerance and clinically recognized opioid poisoning among patients prescribed extended-release long-acting opioids. Pharmacoepidemiol Drug Saf. 2019;28(1):39-47. https://doi.org/10.1002/pds.4572
12. Hwang CS, Kang EM, Ding Y, et al. Patterns of immediate-release and extended-release opioid analgesic use in the management of chronic pain, 2003-2014. JAMA Netw Open. 2018;1(2):e180216. https://doi.org/10.1001/jamanetworkopen.2018.0216
13. Elixhauser A, Steiner C, Harris DR, Coffey RM. Comorbidity measures for use with administrative data. Med Care. 1998;36(1):8-27. https://doi.org/10.1097/00005650-199801000-00004
14. Agency for Healthcare Research and Quality. Clinical Classifications Software (CCS) for ICD-10-CM/PCS. Healthcare Cost and Utilization Project (HCUP). October 2018. www.hcup-us.ahrq.gov/toolssoftware/ccs10/ccs10.jsp
15. Willy ME, Graham DJ, Racoosin JA, et al. Candidate metrics for evaluating the impact of prescriber education on the safe use of extended-release/long-acting (ER/LA) opioid analgesics. Pain Med. 2014;15(9):1558-1568. https://doi.org/10.1111/pme.12459
© 2021 Society of Hospital Medicine
The Effect of Hospital Safety Net Status on the Association Between Bundled Payment Participation and Changes in Medical Episode Outcomes
Bundled payments represent one of the most prominent value-based payment arrangements nationwide. Under this payment approach, hospitals assume responsibility for quality and costs across discrete episodes of care. Hospitals that maintain quality while achieving cost reductions are eligible for financial incentives, whereas those that do not are subject to financial penalties.
To date, the largest completed bundled payment program nationwide is Medicare’s Bundled Payments for Care Improvement (BPCI) initiative. Among four different participation models in BPCI, hospital enrollment was greatest in Model 2, in which episodes spanned from hospitalization through 90 days of post–acute care. The overall results from BPCI Model 2 have been positive: hospitals participating in both common surgical episodes, such as joint replacement surgery, and medical episodes, such as acute myocardial infarction (AMI) and congestive heart failure (CHF), have demonstrated long-term financial savings with stable quality performance.1,2
Safety net hospitals that disproportionately serve low-income patients may fare differently than other hospitals under bundled payment models. At baseline, these hospitals typically have fewer financial resources, which may limit their ability to implement measures to standardize care during hospitalization (eg, clinical pathways) or after discharge (eg, postdischarge programs and other strategies to reduce readmissions).3 Efforts to redesign care may be further complicated by greater clinical complexity and social and structural determinants of health among patients seeking care at safety net hospitals. Given the well-known interactions between social determinants and health conditions, these factors are highly relevant for patients hospitalized at safety net hospitals for acute medical events or exacerbations of chronic conditions.
Existing evidence has shown that safety net hospitals have not performed as well as other hospitals in other value-based reforms.4-8 In the context of bundled payments for joint replacement surgery, safety net hospitals have been less likely to achieve financial savings but more likely to receive penalties.9-11 Moreover, the savings achieved by safety net hospitals have been smaller than those achieved by non–safety net hospitals.12
Despite these concerning findings, there are few data about how safety net hospitals have fared under bundled payments for common medical conditions. To address this critical knowledge gap, we evaluated the effect of hospital safety net status on the association between BPCI Model 2 participation and changes in outcomes for medical condition episodes.
METHODS
This study was approved by the University of Pennsylvania Institutional Review Board with a waiver of informed consent.
Data
We used 100% Medicare claims data from 2011 to 2016 for patients receiving care at hospitals participating in BPCI Model 2 for one of four common medical condition episodes: AMI, pneumonia, CHF, and chronic obstructive pulmonary disease (COPD). A 20% random national sample was used for patients hospitalized at nonparticipant hospitals. Publicly available data from the Centers for Medicare & Medicaid Services (CMS) were used to identify hospital enrollment in BPCI Model 2, while data from the 2017 CMS Impact File were used to quantify each hospital’s disproportionate patient percentage (DPP), which reflects the proportion of Medicaid and low-income Medicare beneficiaries served and determines a hospital’s eligibility to earn disproportionate share hospital payments.
Data from the 2011 American Hospital Association Annual Survey were used to capture hospital characteristics, such as number of beds, teaching status, and profit status, while data from the Medicare provider of service, beneficiary summary, and accountable care organization files were used to capture additional hospital characteristics and market characteristics, such as population size and Medicare Advantage penetration. The Medicare Provider Enrollment, Chain, and Ownership System file was used to identify and remove BPCI episodes from physician group practices. State-level data about area deprivation index—a census tract–based measure that incorporates factors such as income, education, employment, and housing quality to describe socioeconomic disadvantage among neighborhoods—were used to define socioeconomically disadvantaged areas as those in the top 20% of area deprivation index statewide.13 Markets were defined using hospital referral regions.14
Study Periods and Hospital Groups
Our analysis spanned the period between January 1, 2011, and December 31, 2016. We separated this period into a baseline period (January 2011–September 2013) prior to the start of BPCI and a subsequent BPCI period (October 2013–December 2016).
We defined any hospitals participating in BPCI Model 2 across this period for any of the four included medical condition episodes as BPCI hospitals. Because hospitals were able to enter or exit BPCI over time, and enrollment data were provided by CMS as quarterly participation files, we were able to identify dates of entry into or exit from BPCI over time by hospital-condition pairs. Hospitals were considered BPCI hospitals until the end of the study period, regardless of subsequent exit.
We defined non-BPCI hospitals as those that never participated in the program and had 10 or more admissions in the BPCI period for the included medical condition episodes. We used this approach to minimize potential bias arising from BPCI entry and exit over time.
Across both BPCI and non-BPCI hospital groups, we followed prior methods and defined safety net hospitals based on a hospital’s DPP.15 Specifically, safety net hospitals were those in the top quartile of DPP among all hospitals nationwide, and hospitals in the other three quartiles were defined as non–safety net hospitals.9,12
Study Sample and Episode Construction
Our study sample included Medicare fee-for-service beneficiaries admitted to BPCI and non-BPCI hospitals for any of the four medical conditions of interest. We adhered to BPCI program rules, which defined each episode type based on a set of Medicare Severity Diagnosis Related Group (MS-DRG) codes (eg, myocardial infarction episodes were defined as MS-DRGs 280-282). From this sample, we excluded beneficiaries with end-stage renal disease or insurance coverage through Medicare Advantage, as well as beneficiaries who died during the index hospital admission, had any non–Inpatient Prospective Payment System claims, or lacked continuous primary Medicare fee-for-service coverage either during the episode or in the 12 months preceding it.
We constructed 90-day medical condition episodes that began with hospital admission and spanned 90 days after hospital discharge. To avoid bias arising from CMS rules related to precedence (rules for handling how overlapping episodes are assigned to hospitals), we followed prior methods and constructed naturally occurring episodes by assigning overlapping ones to the earlier hospital admission.2,16 From this set of episodes, we identified those for AMI, CHF, COPD, and pneumonia.
Exposure and Covariate Variables
Our study exposure was the interaction between hospital safety net status and hospital BPCI participation, which captured whether the association between BPCI participation and outcomes varied by safety net status (eg, whether differential changes in an outcome related to BPCI participation were different for safety net and non–safety net hospitals in the program). BPCI participation was defined using a time-varying indicator of BPCI participation to distinguish between episodes occurring under the program (ie, after a hospital began participating) or before participation in it. Covariates were chosen based on prior studies and included patient variables such as age, sex, Elixhauser comorbidities, frailty, and Medicare/Medicaid dual-eligibility status.17-23 Additionally, our analysis included market variables such as population size and Medicare Advantage penetration.
Outcome Variables
The prespecified primary study outcome was standardized 90-day postdischarge spending. This outcome was chosen owing to the lack of variation in standardized index hospitalization spending given the MS-DRG system and prior work suggesting that bundled payment participants instead targeted changes to postdischarge utilization and spending.2 Secondary outcomes included 90-day unplanned readmission rates, 90-day postdischarge mortality rates, discharge to institutional post–acute care providers (defined as either skilled nursing facilities [SNFs] or inpatient rehabilitation facilities), discharge home with home health agency services, and—among patients discharged to SNFs—SNF length of stay (LOS), measured in number of days.
Statistical Analysis
We described the characteristics of patients and hospitals in our samples. In adjusted analyses, we used a series of difference-in-differences (DID) generalized linear models to conduct a heterogeneity analysis evaluating whether the relationship between hospital BPCI participation and medical condition episode outcomes varied based on hospital safety net status.
In these models, the DID estimator was a time-varying indicator of hospital BPCI participation (equal to 1 for episodes occurring during the BPCI period at BPCI hospitals after they initiated participation; 0 otherwise) together with hospital and quarter-time fixed effects. To examine differences in the association between BPCI and episode outcomes by hospital safety net status—that is, whether there was heterogeneity in the outcome changes between safety net and non–safety net hospitals participating in BPCI—our models also included an interaction term between hospital safety net status and the time-varying BPCI participation term (Appendix Methods). In this approach, BPCI safety net and BPCI non–safety net hospitals were compared with non-BPCI hospitals as the comparison group. The comparisons were chosen to yield the most policy-salient findings, since Medicare evaluated hospitals in BPCI, whether safety net or not, by comparing their performance to nonparticipating hospitals, whether safety net or not.
All models controlled for patient and time-varying market characteristics and included hospital fixed effects (to account for time-invariant hospital market characteristics) and MS-DRG fixed effects. All outcomes were evaluated using models with identity links and normal distributions (ie, ordinary least squares). These variables and models were applied to data from the baseline period to examine consistency with the parallel trends assumption. Overall, Wald tests did not indicate divergent baseline period trends in outcomes between BPCI and non-BPCI hospitals (Appendix Figure 1) or BPCI safety net versus BPCI non–safety net hospitals (Appendix Figure 2).
We conducted sensitivity analyses to evaluate the robustness of our results. First, instead of comparing differential changes at BPCI safety net vs BPCI non–safety net hospitals (ie, evaluating safety net status among BPCI hospitals), we evaluated changes at BPCI safety net vs non-BPCI safety net hospitals compared with changes at BPCI non–safety net vs non-BPCI non–safety net hospitals (ie, marginal differences in the changes associated with BPCI participation among safety net vs non–safety net hospitals). Because safety net hospitals in BPCI were compared with nonparticipating safety net hospitals, and non–safety net hospitals in BPCI were compared with nonparticipating non–safety net hospitals, this set of analyses helped address potential concerns about unobservable differences between safety net and non–safety net organizations and their potential impact on our findings.
Second, we used an alternative, BPCI-specific definition for safety net hospitals: instead of defining safety net status based on all hospitals nationwide, we defined it only among BPCI hospitals (safety net hospitals defined as those in the top quartile of DPP among all BPCI hospitals) and non-BPCI hospitals (safety net hospitals defined as those in the top quartile of DPP among all non-BPCI hospitals). Third, we repeated our main analyses using models with standard errors clustered at the hospital level and without hospital fixed effects. Fourth, we repeated analysis using models with alternative nonlinear link functions and outcome distributions and without hospital fixed effects.
Statistical tests were two-tailed and considered significant at α = .05 for the primary outcome. Statistical analyses were conducted using SAS 9.4 (SAS Institute, Inc.).
RESULTS
Our sample consisted of 3066 hospitals nationwide that collectively provided medical condition episode care to a total of 1,611,848 Medicare fee-for-service beneficiaries. This sample included 238 BPCI hospitals and 2769 non-BPCI hospitals (Table 1, Appendix Table 1).
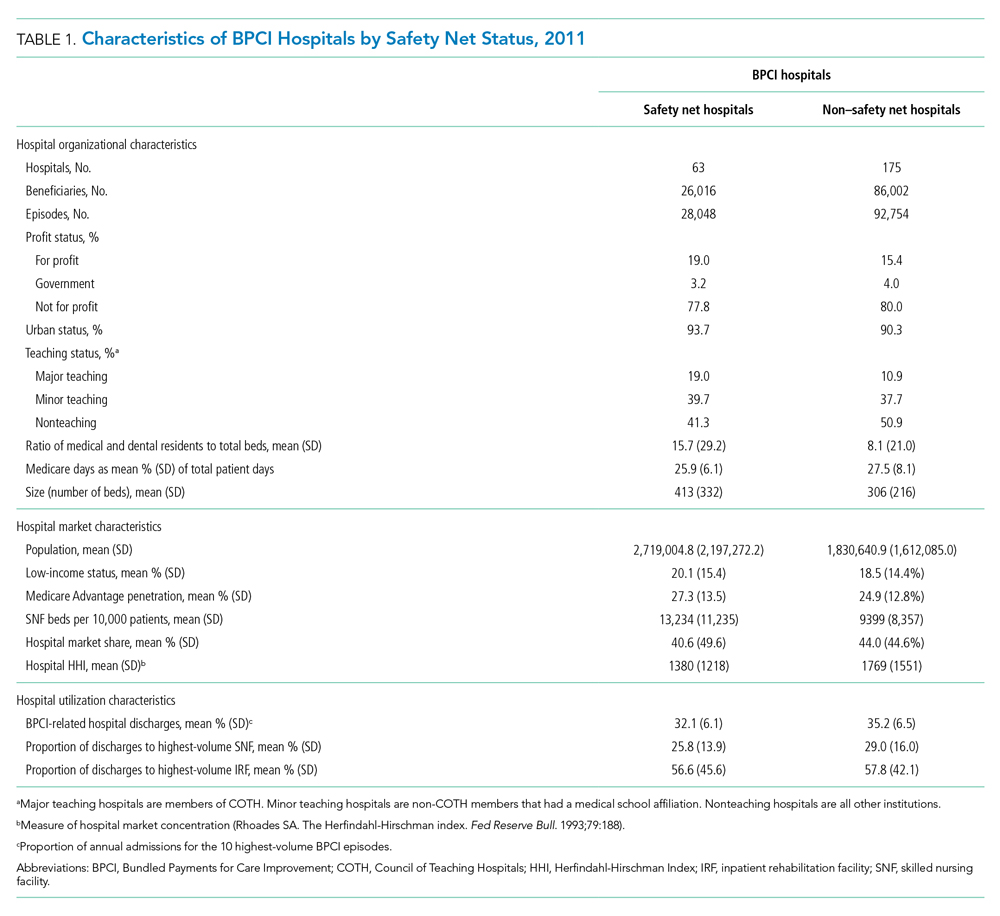
Among BPCI hospitals, 63 were safety net and 175 were non–safety net hospitals. Compared with non–safety net hospitals, safety net hospitals tended to be larger and were more likely to be urban teaching hospitals. Safety net hospitals also tended to be located in areas with larger populations, more low-income individuals, and greater Medicare Advantage penetration.
In both the baseline and BPCI periods, there were differences in several characteristics for patients admitted to safety net vs non–safety net hospitals (Table 2; Appendix Table 2). Among BPCI hospitals, in both periods, patients admitted at safety net hospitals were younger and more likely to be Black, be Medicare/Medicaid dual eligible, and report having a disability than patients admitted to non–safety net hospitals. Patients admitted to safety net hospitals were also more likely to reside in socioeconomically disadvantaged areas.
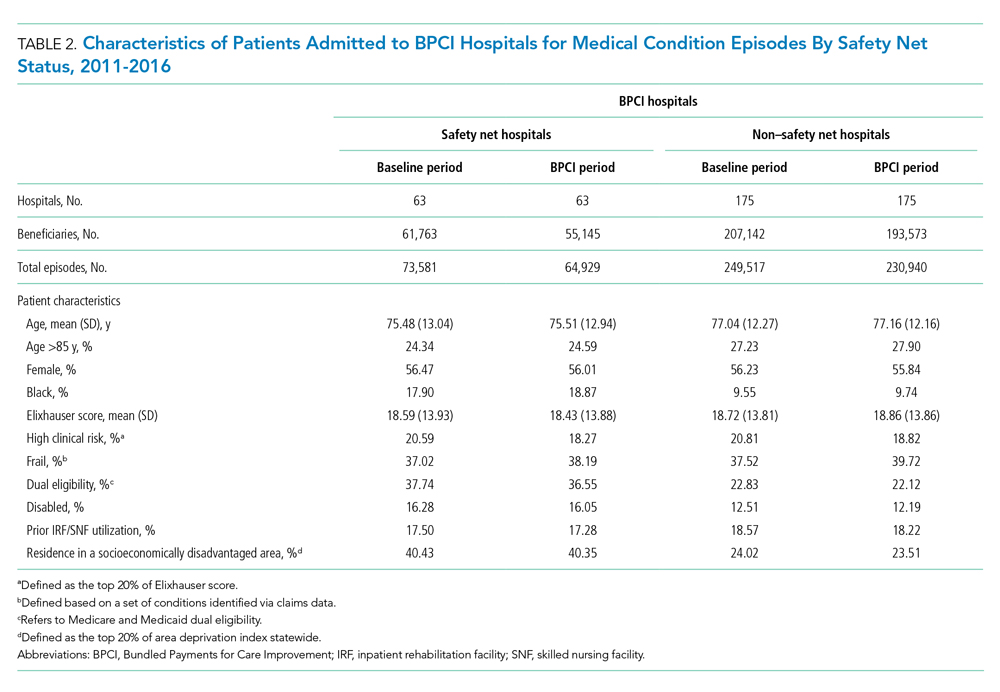
Safety Net Status Among BPCI Hospitals
In the baseline period (Appendix Table 3), postdischarge spending was slightly greater among patients admitted to BPCI safety net hospitals ($18,817) than those admitted to BPCI non–safety net hospitals ($18,335). There were also small differences in secondary outcomes between the BPCI safety net and non−safety net groups.
In adjusted analyses evaluating heterogeneity in the effect of BPCI participation between safety net and non–safety net hospitals (Figure 1), differential changes in postdischarge spending between baseline and BPCI participation periods did not differ between safety net and non–safety net hospitals participating in BPCI (aDID, $40; 95% CI, –$254 to $335; P = .79). 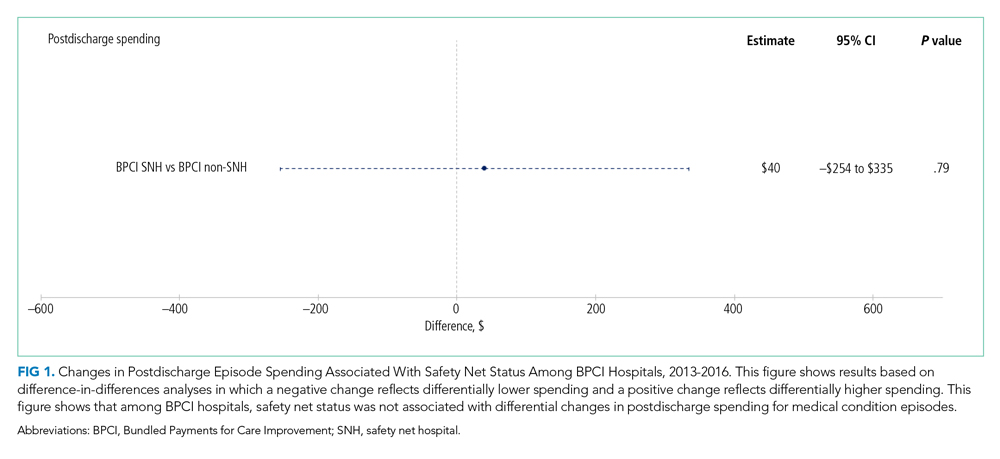

Sensitivity Analysis
Analyses of BPCI participation among safety net vs non–safety net hospitals nationwide yielded results that were similar to those from our main analyses (Appendix Figures 4, 5, and 6). Compared with BPCI participation among non–safety net hospitals, participation among safety net hospitals was associated with a differential increase from baseline to BPCI periods in discharge to institutional post–acute care providers (aDID, 1.07 percentage points; 95% CI, 0.47-1.67 percentage points; P < .001), but no differential changes between baseline and BPCI periods in postdischarge spending (aDID, –$199;95% CI, –$461 to $63; P = .14), SNF LOS (aDID, –0.22 days; 95% CI, –0.54 to 0.09 days; P = .16), or other secondary outcomes.
Replicating our main analyses using an alternative, BPCI-specific definition of safety net hospitals yielded similar results overall (Appendix Table 4; Appendix Figures 7, 8, and 9). There were no differential changes between baseline and BPCI periods in postdischarge spending between BPCI safety net and BPCI non–safety net hospitals (aDID, $111; 95% CI, –$189 to $411; P = .47). Results for secondary outcomes were also qualitatively similar to results from main analyses, with the exception that among BPCI hospitals, safety net hospitals had a differentially higher SNF LOS than non–safety net hospitals between baseline and BPCI periods (aDID, 0.38 days; 95% CI, 0.02-0.74 days; P = .04).
Compared with results from our main analysis, findings were qualitatively similar overall in analyses using models with hospital-clustered standard errors and without hospital fixed effects (Appendix Figures 10, 11, and 12) as well as models with alternative link functions and outcome distributions and without hospital fixed effects (Appendix Figures 13, 14, and 15).
Discussion
This analysis builds on prior work by evaluating how hospital safety net status affected the known association between bundled payment participation and decreased spending and stable quality for medical condition episodes. Although safety net status did not appear to affect those relationships, it did affect the relationship between participation and post–acute care utilization. These results have three main implications.
First, our results suggest that policymakers should continue engaging safety net hospitals in medical condition bundled payments while monitoring for unintended consequences. Our findings with regard to spending provide some reassurance that safety net hospitals can potentially achieve savings while maintaining quality under bundled payments, similar to other types of hospitals. However, the differences in patient populations and post–acute care utilization patterns suggest that policymakers should continue to carefully monitor for disparities based on hospital safety net status and consider implementing measures that have been used in other payment reforms to support safety net organizations. Such measures could involve providing customized technical assistance or evaluating performance using “peer groups” that compare performance among safety net hospitals alone rather than among all hospitals.24,25
Second, our findings underscore potential challenges that safety net hospitals may face when attempting to redesign care. For instance, among hospitals accepting bundled payments for medical conditions, successful strategies in BPCI have often included maintaining the proportion of patients discharged to institutional post–acute care providers while reducing SNF LOS.2 However, in our study, discharge to institutional post–acute care providers actually increased among safety net hospitals relative to other hospitals while SNF LOS did not decrease. Additionally, while other hospitals in bundled payments have exhibited differentially greater discharge home with home health services, we found that safety net hospitals did not. These represent areas for future work, particularly because little is known about how safety net hospitals coordinate post–acute care (eg, the extent to which safety net hospitals integrate with post–acute care providers or coordinate home-based care for vulnerable patient populations).
Third, study results offer insight into potential challenges to practice changes. Compared with other hospitals, safety net hospitals in our analysis provided medical condition episode care to more Black, Medicare/Medicaid dual-eligible, and disabled patients, as well as individuals living in socioeconomically disadvantaged areas. Collectively, these groups may face more challenging socioeconomic circumstances or existing disparities. The combination of these factors and limited financial resources at safety net hospitals could complicate their ability to manage transitions of care after hospitalization by shifting discharge away from high-intensity institutional post–acute care facilities.
Our analysis has limitations. First, given the observational study design, findings are subject to residual confounding and selection bias. For instance, findings related to post–acute care utilization could have been influenced by unobservable changes in market supply and other factors. However, we mitigated these risks using a quasi-experimental methodology that also directly accounted for multiple patient, hospital, and market characteristics and also used fixed effects to account for unobserved heterogeneity. Second, in studying BPCI Model 2, we evaluated one model within one bundled payment program. However, BPCI Model 2 encompassed a wide range of medical conditions, and both this scope and program design have served as the direct basis for subsequent bundled payment models, such as the ongoing BPCI Advanced and other forthcoming programs.26 Third, while our analysis evaluated multiple aspects of patient complexity, individuals may be “high risk” owing to several clinical and social determinants. Future work should evaluate different features of patient risk and how they affect outcomes under payment models such as bundled payments.
CONCLUSION
Safety net status appeared to affect the relationship between bundled payment participation and post–acute care utilization, but not episode spending. These findings suggest that policymakers could support safety net hospitals within bundled payment programs and consider safety net status when evaluating them.
1. Navathe AS, Emanuel EJ, Venkataramani AS, et al. Spending and quality after three years of Medicare’s voluntary bundled payment for joint replacement surgery. Health Aff (Millwood). 2020;39(1):58-66. https://doi.org/10.1377/hlthaff.2019.00466
2. Rolnick JA, Liao JM, Emanuel EJ, et al. Spending and quality after three years of Medicare’s bundled payments for medical conditions: quasi-experimental difference-in-differences study. BMJ. 2020;369:m1780. https://doi.org/10.1136/bmj.m1780
3. Figueroa JF, Joynt KE, Zhou X, Orav EJ, Jha AK. Safety-net hospitals face more barriers yet use fewer strategies to reduce readmissions. Med Care. 2017;55(3):229-235. https://doi.org/10.1097/MLR.0000000000000687
4. Werner RM, Goldman LE, Dudley RA. Comparison of change in quality of care between safety-net and non–safety-net hospitals. JAMA. 2008;299(18):2180-2187. https://doi/org/10.1001/jama.299.18.2180
5. Ross JS, Bernheim SM, Lin Z, et al. Based on key measures, care quality for Medicare enrollees at safety-net and non–safety-net hospitals was almost equal. Health Aff (Millwood). 2012;31(8):1739-1748. https://doi.org/10.1377/hlthaff.2011.1028
6. Gilman M, Adams EK, Hockenberry JM, Milstein AS, Wilson IB, Becker ER. Safety-net hospitals more likely than other hospitals to fare poorly under Medicare’s value-based purchasing. Health Aff (Millwood). 2015;34(3):398-405. https://doi.org/10.1377/hlthaff.2014.1059
7. Joynt KE, Jha AK. Characteristics of hospitals receiving penalties under the Hospital Readmissions Reduction Program. JAMA. 2013;309(4):342-343. https://doi.org/10.1001/jama.2012.94856
8. Rajaram R, Chung JW, Kinnier CV, et al. Hospital characteristics associated with penalties in the Centers for Medicare & Medicaid Services Hospital-Acquired Condition Reduction Program. JAMA. 2015;314(4):375-383. https://doi.org/10.1001/jama.2015.8609
9. Navathe AS, Liao JM, Shah Y, et al. Characteristics of hospitals earning savings in the first year of mandatory bundled payment for hip and knee surgery. JAMA. 2018;319(9):930-932. https://doi.org/10.1001/jama.2018.0678
10. Thirukumaran CP, Glance LG, Cai X, Balkissoon R, Mesfin A, Li Y. Performance of safety-net hospitals in year 1 of the Comprehensive Care for Joint Replacement Model. Health Aff (Millwood). 2019;38(2):190-196. https://doi.org/10.1377/hlthaff.2018.05264
11. Thirukumaran CP, Glance LG, Cai X, Kim Y, Li Y. Penalties and rewards for safety net vs non–safety net hospitals in the first 2 years of the Comprehensive Care for Joint Replacement Model. JAMA. 2019;321(20):2027-2030. https://doi.org/10.1001/jama.2019.5118
12. Kim H, Grunditz JI, Meath THA, Quiñones AR, Ibrahim SA, McConnell KJ. Level of reconciliation payments by safety-net hospital status under the first year of the Comprehensive Care for Joint Replacement Program. JAMA Surg. 2019;154(2):178-179. https://doi.org/10.1001/jamasurg.2018.3098
13. Department of Medicine, University of Wisconsin School of Medicine and Public Health. Neighborhood Atlas. Accessed March 1, 2021. https://www.neighborhoodatlas.medicine.wisc.edu/
14. Dartmouth Atlas Project. The Dartmouth Atlas of Health Care. Accessed March 1, 2021. https://www.dartmouthatlas.org/
15. Chatterjee P, Joynt KE, Orav EJ, Jha AK. Patient experience in safety-net hospitals: implications for improving care and value-based purchasing. Arch Intern Med. 2012;172(16):1204-1210. https://doi.org/10.1001/archinternmed.2012.3158
16. Rolnick JA, Liao JM, Navathe AS. Programme design matters—lessons from bundled payments in the US. June 17, 2020. Accessed March 1, 2021. https://blogs.bmj.com/bmj/2020/06/17/programme-design-matters-lessons-from-bundled-payments-in-the-us
17. Dummit LA, Kahvecioglu D, Marrufo G, et al. Association between hospital participation in a Medicare bundled payment initiative and payments and quality outcomes for lower extremity joint replacement episodes. JAMA. 2016;316(12):1267-1278. https://doi.org/10.1001/jama.2016.12717
18. Navathe AS, Liao JM, Dykstra SE, et al. Association of hospital participation in a Medicare bundled payment program with volume and case mix of lower extremity joint replacement episodes. JAMA. 2018;320(9):901-910. https://doi.org/10.1001/jama.2018.12345
19. Joynt Maddox KE, Orav EJ, Zheng J, Epstein AM. Evaluation of Medicare’s bundled payments initiative for medical conditions. N Engl J Med. 2018;379(3):260-269. https://doi.org/10.1056/NEJMsa1801569
20. Navathe AS, Emanuel EJ, Venkataramani AS, et al. Spending and quality after three years of Medicare’s voluntary bundled payment for joint replacement surgery. Health Aff (Millwood). 2020;39(1):58-66. https://doi.org/10.1377/hlthaff.2019.00466
21. Liao JM, Emanuel EJ, Venkataramani AS, et al. Association of bundled payments for joint replacement surgery and patient outcomes with simultaneous hospital participation in accountable care organizations. JAMA Netw Open. 2019;2(9):e1912270. https://doi.org/10.1001/jamanetworkopen.2019.12270
22. Kim DH, Schneeweiss S. Measuring frailty using claims data for pharmacoepidemiologic studies of mortality in older adults: evidence and recommendations. Pharmacoepidemiol Drug Saf. 2014;23(9):891-901. https://doi.org/10.1002/pds.3674
23. Joynt KE, Figueroa JF, Beaulieu N, Wild RC, Orav EJ, Jha AK. Segmenting high-cost Medicare patients into potentially actionable cohorts. Healthc (Amst). 2017;5(1-2):62-67. https://doi.org/10.1016/j.hjdsi.2016.11.002
24. Quality Payment Program. Small, underserved, and rural practices. Accessed March 1, 2021. https://qpp.cms.gov/about/small-underserved-rural-practices
25. McCarthy CP, Vaduganathan M, Patel KV, et al. Association of the new peer group–stratified method with the reclassification of penalty status in the Hospital Readmission Reduction Program. JAMA Netw Open. 2019;2(4):e192987. https://doi.org/10.1001/jamanetworkopen.2019.2987
26. Centers for Medicare & Medicaid Services. BPCI Advanced. Updated September 16, 2021. Accessed October 18, 2021. https://innovation.cms.gov/innovation-models/bpci-advanced
Bundled payments represent one of the most prominent value-based payment arrangements nationwide. Under this payment approach, hospitals assume responsibility for quality and costs across discrete episodes of care. Hospitals that maintain quality while achieving cost reductions are eligible for financial incentives, whereas those that do not are subject to financial penalties.
To date, the largest completed bundled payment program nationwide is Medicare’s Bundled Payments for Care Improvement (BPCI) initiative. Among four different participation models in BPCI, hospital enrollment was greatest in Model 2, in which episodes spanned from hospitalization through 90 days of post–acute care. The overall results from BPCI Model 2 have been positive: hospitals participating in both common surgical episodes, such as joint replacement surgery, and medical episodes, such as acute myocardial infarction (AMI) and congestive heart failure (CHF), have demonstrated long-term financial savings with stable quality performance.1,2
Safety net hospitals that disproportionately serve low-income patients may fare differently than other hospitals under bundled payment models. At baseline, these hospitals typically have fewer financial resources, which may limit their ability to implement measures to standardize care during hospitalization (eg, clinical pathways) or after discharge (eg, postdischarge programs and other strategies to reduce readmissions).3 Efforts to redesign care may be further complicated by greater clinical complexity and social and structural determinants of health among patients seeking care at safety net hospitals. Given the well-known interactions between social determinants and health conditions, these factors are highly relevant for patients hospitalized at safety net hospitals for acute medical events or exacerbations of chronic conditions.
Existing evidence has shown that safety net hospitals have not performed as well as other hospitals in other value-based reforms.4-8 In the context of bundled payments for joint replacement surgery, safety net hospitals have been less likely to achieve financial savings but more likely to receive penalties.9-11 Moreover, the savings achieved by safety net hospitals have been smaller than those achieved by non–safety net hospitals.12
Despite these concerning findings, there are few data about how safety net hospitals have fared under bundled payments for common medical conditions. To address this critical knowledge gap, we evaluated the effect of hospital safety net status on the association between BPCI Model 2 participation and changes in outcomes for medical condition episodes.
METHODS
This study was approved by the University of Pennsylvania Institutional Review Board with a waiver of informed consent.
Data
We used 100% Medicare claims data from 2011 to 2016 for patients receiving care at hospitals participating in BPCI Model 2 for one of four common medical condition episodes: AMI, pneumonia, CHF, and chronic obstructive pulmonary disease (COPD). A 20% random national sample was used for patients hospitalized at nonparticipant hospitals. Publicly available data from the Centers for Medicare & Medicaid Services (CMS) were used to identify hospital enrollment in BPCI Model 2, while data from the 2017 CMS Impact File were used to quantify each hospital’s disproportionate patient percentage (DPP), which reflects the proportion of Medicaid and low-income Medicare beneficiaries served and determines a hospital’s eligibility to earn disproportionate share hospital payments.
Data from the 2011 American Hospital Association Annual Survey were used to capture hospital characteristics, such as number of beds, teaching status, and profit status, while data from the Medicare provider of service, beneficiary summary, and accountable care organization files were used to capture additional hospital characteristics and market characteristics, such as population size and Medicare Advantage penetration. The Medicare Provider Enrollment, Chain, and Ownership System file was used to identify and remove BPCI episodes from physician group practices. State-level data about area deprivation index—a census tract–based measure that incorporates factors such as income, education, employment, and housing quality to describe socioeconomic disadvantage among neighborhoods—were used to define socioeconomically disadvantaged areas as those in the top 20% of area deprivation index statewide.13 Markets were defined using hospital referral regions.14
Study Periods and Hospital Groups
Our analysis spanned the period between January 1, 2011, and December 31, 2016. We separated this period into a baseline period (January 2011–September 2013) prior to the start of BPCI and a subsequent BPCI period (October 2013–December 2016).
We defined any hospitals participating in BPCI Model 2 across this period for any of the four included medical condition episodes as BPCI hospitals. Because hospitals were able to enter or exit BPCI over time, and enrollment data were provided by CMS as quarterly participation files, we were able to identify dates of entry into or exit from BPCI over time by hospital-condition pairs. Hospitals were considered BPCI hospitals until the end of the study period, regardless of subsequent exit.
We defined non-BPCI hospitals as those that never participated in the program and had 10 or more admissions in the BPCI period for the included medical condition episodes. We used this approach to minimize potential bias arising from BPCI entry and exit over time.
Across both BPCI and non-BPCI hospital groups, we followed prior methods and defined safety net hospitals based on a hospital’s DPP.15 Specifically, safety net hospitals were those in the top quartile of DPP among all hospitals nationwide, and hospitals in the other three quartiles were defined as non–safety net hospitals.9,12
Study Sample and Episode Construction
Our study sample included Medicare fee-for-service beneficiaries admitted to BPCI and non-BPCI hospitals for any of the four medical conditions of interest. We adhered to BPCI program rules, which defined each episode type based on a set of Medicare Severity Diagnosis Related Group (MS-DRG) codes (eg, myocardial infarction episodes were defined as MS-DRGs 280-282). From this sample, we excluded beneficiaries with end-stage renal disease or insurance coverage through Medicare Advantage, as well as beneficiaries who died during the index hospital admission, had any non–Inpatient Prospective Payment System claims, or lacked continuous primary Medicare fee-for-service coverage either during the episode or in the 12 months preceding it.
We constructed 90-day medical condition episodes that began with hospital admission and spanned 90 days after hospital discharge. To avoid bias arising from CMS rules related to precedence (rules for handling how overlapping episodes are assigned to hospitals), we followed prior methods and constructed naturally occurring episodes by assigning overlapping ones to the earlier hospital admission.2,16 From this set of episodes, we identified those for AMI, CHF, COPD, and pneumonia.
Exposure and Covariate Variables
Our study exposure was the interaction between hospital safety net status and hospital BPCI participation, which captured whether the association between BPCI participation and outcomes varied by safety net status (eg, whether differential changes in an outcome related to BPCI participation were different for safety net and non–safety net hospitals in the program). BPCI participation was defined using a time-varying indicator of BPCI participation to distinguish between episodes occurring under the program (ie, after a hospital began participating) or before participation in it. Covariates were chosen based on prior studies and included patient variables such as age, sex, Elixhauser comorbidities, frailty, and Medicare/Medicaid dual-eligibility status.17-23 Additionally, our analysis included market variables such as population size and Medicare Advantage penetration.
Outcome Variables
The prespecified primary study outcome was standardized 90-day postdischarge spending. This outcome was chosen owing to the lack of variation in standardized index hospitalization spending given the MS-DRG system and prior work suggesting that bundled payment participants instead targeted changes to postdischarge utilization and spending.2 Secondary outcomes included 90-day unplanned readmission rates, 90-day postdischarge mortality rates, discharge to institutional post–acute care providers (defined as either skilled nursing facilities [SNFs] or inpatient rehabilitation facilities), discharge home with home health agency services, and—among patients discharged to SNFs—SNF length of stay (LOS), measured in number of days.
Statistical Analysis
We described the characteristics of patients and hospitals in our samples. In adjusted analyses, we used a series of difference-in-differences (DID) generalized linear models to conduct a heterogeneity analysis evaluating whether the relationship between hospital BPCI participation and medical condition episode outcomes varied based on hospital safety net status.
In these models, the DID estimator was a time-varying indicator of hospital BPCI participation (equal to 1 for episodes occurring during the BPCI period at BPCI hospitals after they initiated participation; 0 otherwise) together with hospital and quarter-time fixed effects. To examine differences in the association between BPCI and episode outcomes by hospital safety net status—that is, whether there was heterogeneity in the outcome changes between safety net and non–safety net hospitals participating in BPCI—our models also included an interaction term between hospital safety net status and the time-varying BPCI participation term (Appendix Methods). In this approach, BPCI safety net and BPCI non–safety net hospitals were compared with non-BPCI hospitals as the comparison group. The comparisons were chosen to yield the most policy-salient findings, since Medicare evaluated hospitals in BPCI, whether safety net or not, by comparing their performance to nonparticipating hospitals, whether safety net or not.
All models controlled for patient and time-varying market characteristics and included hospital fixed effects (to account for time-invariant hospital market characteristics) and MS-DRG fixed effects. All outcomes were evaluated using models with identity links and normal distributions (ie, ordinary least squares). These variables and models were applied to data from the baseline period to examine consistency with the parallel trends assumption. Overall, Wald tests did not indicate divergent baseline period trends in outcomes between BPCI and non-BPCI hospitals (Appendix Figure 1) or BPCI safety net versus BPCI non–safety net hospitals (Appendix Figure 2).
We conducted sensitivity analyses to evaluate the robustness of our results. First, instead of comparing differential changes at BPCI safety net vs BPCI non–safety net hospitals (ie, evaluating safety net status among BPCI hospitals), we evaluated changes at BPCI safety net vs non-BPCI safety net hospitals compared with changes at BPCI non–safety net vs non-BPCI non–safety net hospitals (ie, marginal differences in the changes associated with BPCI participation among safety net vs non–safety net hospitals). Because safety net hospitals in BPCI were compared with nonparticipating safety net hospitals, and non–safety net hospitals in BPCI were compared with nonparticipating non–safety net hospitals, this set of analyses helped address potential concerns about unobservable differences between safety net and non–safety net organizations and their potential impact on our findings.
Second, we used an alternative, BPCI-specific definition for safety net hospitals: instead of defining safety net status based on all hospitals nationwide, we defined it only among BPCI hospitals (safety net hospitals defined as those in the top quartile of DPP among all BPCI hospitals) and non-BPCI hospitals (safety net hospitals defined as those in the top quartile of DPP among all non-BPCI hospitals). Third, we repeated our main analyses using models with standard errors clustered at the hospital level and without hospital fixed effects. Fourth, we repeated analysis using models with alternative nonlinear link functions and outcome distributions and without hospital fixed effects.
Statistical tests were two-tailed and considered significant at α = .05 for the primary outcome. Statistical analyses were conducted using SAS 9.4 (SAS Institute, Inc.).
RESULTS
Our sample consisted of 3066 hospitals nationwide that collectively provided medical condition episode care to a total of 1,611,848 Medicare fee-for-service beneficiaries. This sample included 238 BPCI hospitals and 2769 non-BPCI hospitals (Table 1, Appendix Table 1).
Among BPCI hospitals, 63 were safety net and 175 were non–safety net hospitals. Compared with non–safety net hospitals, safety net hospitals tended to be larger and were more likely to be urban teaching hospitals. Safety net hospitals also tended to be located in areas with larger populations, more low-income individuals, and greater Medicare Advantage penetration.
In both the baseline and BPCI periods, there were differences in several characteristics for patients admitted to safety net vs non–safety net hospitals (Table 2; Appendix Table 2). Among BPCI hospitals, in both periods, patients admitted at safety net hospitals were younger and more likely to be Black, be Medicare/Medicaid dual eligible, and report having a disability than patients admitted to non–safety net hospitals. Patients admitted to safety net hospitals were also more likely to reside in socioeconomically disadvantaged areas.
Safety Net Status Among BPCI Hospitals
In the baseline period (Appendix Table 3), postdischarge spending was slightly greater among patients admitted to BPCI safety net hospitals ($18,817) than those admitted to BPCI non–safety net hospitals ($18,335). There were also small differences in secondary outcomes between the BPCI safety net and non−safety net groups.
In adjusted analyses evaluating heterogeneity in the effect of BPCI participation between safety net and non–safety net hospitals (Figure 1), differential changes in postdischarge spending between baseline and BPCI participation periods did not differ between safety net and non–safety net hospitals participating in BPCI (aDID, $40; 95% CI, –$254 to $335; P = .79).
Sensitivity Analysis
Analyses of BPCI participation among safety net vs non–safety net hospitals nationwide yielded results that were similar to those from our main analyses (Appendix Figures 4, 5, and 6). Compared with BPCI participation among non–safety net hospitals, participation among safety net hospitals was associated with a differential increase from baseline to BPCI periods in discharge to institutional post–acute care providers (aDID, 1.07 percentage points; 95% CI, 0.47-1.67 percentage points; P < .001), but no differential changes between baseline and BPCI periods in postdischarge spending (aDID, –$199;95% CI, –$461 to $63; P = .14), SNF LOS (aDID, –0.22 days; 95% CI, –0.54 to 0.09 days; P = .16), or other secondary outcomes.
Replicating our main analyses using an alternative, BPCI-specific definition of safety net hospitals yielded similar results overall (Appendix Table 4; Appendix Figures 7, 8, and 9). There were no differential changes between baseline and BPCI periods in postdischarge spending between BPCI safety net and BPCI non–safety net hospitals (aDID, $111; 95% CI, –$189 to $411; P = .47). Results for secondary outcomes were also qualitatively similar to results from main analyses, with the exception that among BPCI hospitals, safety net hospitals had a differentially higher SNF LOS than non–safety net hospitals between baseline and BPCI periods (aDID, 0.38 days; 95% CI, 0.02-0.74 days; P = .04).
Compared with results from our main analysis, findings were qualitatively similar overall in analyses using models with hospital-clustered standard errors and without hospital fixed effects (Appendix Figures 10, 11, and 12) as well as models with alternative link functions and outcome distributions and without hospital fixed effects (Appendix Figures 13, 14, and 15).
Discussion
This analysis builds on prior work by evaluating how hospital safety net status affected the known association between bundled payment participation and decreased spending and stable quality for medical condition episodes. Although safety net status did not appear to affect those relationships, it did affect the relationship between participation and post–acute care utilization. These results have three main implications.
First, our results suggest that policymakers should continue engaging safety net hospitals in medical condition bundled payments while monitoring for unintended consequences. Our findings with regard to spending provide some reassurance that safety net hospitals can potentially achieve savings while maintaining quality under bundled payments, similar to other types of hospitals. However, the differences in patient populations and post–acute care utilization patterns suggest that policymakers should continue to carefully monitor for disparities based on hospital safety net status and consider implementing measures that have been used in other payment reforms to support safety net organizations. Such measures could involve providing customized technical assistance or evaluating performance using “peer groups” that compare performance among safety net hospitals alone rather than among all hospitals.24,25
Second, our findings underscore potential challenges that safety net hospitals may face when attempting to redesign care. For instance, among hospitals accepting bundled payments for medical conditions, successful strategies in BPCI have often included maintaining the proportion of patients discharged to institutional post–acute care providers while reducing SNF LOS.2 However, in our study, discharge to institutional post–acute care providers actually increased among safety net hospitals relative to other hospitals while SNF LOS did not decrease. Additionally, while other hospitals in bundled payments have exhibited differentially greater discharge home with home health services, we found that safety net hospitals did not. These represent areas for future work, particularly because little is known about how safety net hospitals coordinate post–acute care (eg, the extent to which safety net hospitals integrate with post–acute care providers or coordinate home-based care for vulnerable patient populations).
Third, study results offer insight into potential challenges to practice changes. Compared with other hospitals, safety net hospitals in our analysis provided medical condition episode care to more Black, Medicare/Medicaid dual-eligible, and disabled patients, as well as individuals living in socioeconomically disadvantaged areas. Collectively, these groups may face more challenging socioeconomic circumstances or existing disparities. The combination of these factors and limited financial resources at safety net hospitals could complicate their ability to manage transitions of care after hospitalization by shifting discharge away from high-intensity institutional post–acute care facilities.
Our analysis has limitations. First, given the observational study design, findings are subject to residual confounding and selection bias. For instance, findings related to post–acute care utilization could have been influenced by unobservable changes in market supply and other factors. However, we mitigated these risks using a quasi-experimental methodology that also directly accounted for multiple patient, hospital, and market characteristics and also used fixed effects to account for unobserved heterogeneity. Second, in studying BPCI Model 2, we evaluated one model within one bundled payment program. However, BPCI Model 2 encompassed a wide range of medical conditions, and both this scope and program design have served as the direct basis for subsequent bundled payment models, such as the ongoing BPCI Advanced and other forthcoming programs.26 Third, while our analysis evaluated multiple aspects of patient complexity, individuals may be “high risk” owing to several clinical and social determinants. Future work should evaluate different features of patient risk and how they affect outcomes under payment models such as bundled payments.
CONCLUSION
Safety net status appeared to affect the relationship between bundled payment participation and post–acute care utilization, but not episode spending. These findings suggest that policymakers could support safety net hospitals within bundled payment programs and consider safety net status when evaluating them.
1. Navathe AS, Emanuel EJ, Venkataramani AS, et al. Spending and quality after three years of Medicare’s voluntary bundled payment for joint replacement surgery. Health Aff (Millwood). 2020;39(1):58-66. https://doi.org/10.1377/hlthaff.2019.00466
2. Rolnick JA, Liao JM, Emanuel EJ, et al. Spending and quality after three years of Medicare’s bundled payments for medical conditions: quasi-experimental difference-in-differences study. BMJ. 2020;369:m1780. https://doi.org/10.1136/bmj.m1780
3. Figueroa JF, Joynt KE, Zhou X, Orav EJ, Jha AK. Safety-net hospitals face more barriers yet use fewer strategies to reduce readmissions. Med Care. 2017;55(3):229-235. https://doi.org/10.1097/MLR.0000000000000687
4. Werner RM, Goldman LE, Dudley RA. Comparison of change in quality of care between safety-net and non–safety-net hospitals. JAMA. 2008;299(18):2180-2187. https://doi/org/10.1001/jama.299.18.2180
5. Ross JS, Bernheim SM, Lin Z, et al. Based on key measures, care quality for Medicare enrollees at safety-net and non–safety-net hospitals was almost equal. Health Aff (Millwood). 2012;31(8):1739-1748. https://doi.org/10.1377/hlthaff.2011.1028
6. Gilman M, Adams EK, Hockenberry JM, Milstein AS, Wilson IB, Becker ER. Safety-net hospitals more likely than other hospitals to fare poorly under Medicare’s value-based purchasing. Health Aff (Millwood). 2015;34(3):398-405. https://doi.org/10.1377/hlthaff.2014.1059
7. Joynt KE, Jha AK. Characteristics of hospitals receiving penalties under the Hospital Readmissions Reduction Program. JAMA. 2013;309(4):342-343. https://doi.org/10.1001/jama.2012.94856
8. Rajaram R, Chung JW, Kinnier CV, et al. Hospital characteristics associated with penalties in the Centers for Medicare & Medicaid Services Hospital-Acquired Condition Reduction Program. JAMA. 2015;314(4):375-383. https://doi.org/10.1001/jama.2015.8609
9. Navathe AS, Liao JM, Shah Y, et al. Characteristics of hospitals earning savings in the first year of mandatory bundled payment for hip and knee surgery. JAMA. 2018;319(9):930-932. https://doi.org/10.1001/jama.2018.0678
10. Thirukumaran CP, Glance LG, Cai X, Balkissoon R, Mesfin A, Li Y. Performance of safety-net hospitals in year 1 of the Comprehensive Care for Joint Replacement Model. Health Aff (Millwood). 2019;38(2):190-196. https://doi.org/10.1377/hlthaff.2018.05264
11. Thirukumaran CP, Glance LG, Cai X, Kim Y, Li Y. Penalties and rewards for safety net vs non–safety net hospitals in the first 2 years of the Comprehensive Care for Joint Replacement Model. JAMA. 2019;321(20):2027-2030. https://doi.org/10.1001/jama.2019.5118
12. Kim H, Grunditz JI, Meath THA, Quiñones AR, Ibrahim SA, McConnell KJ. Level of reconciliation payments by safety-net hospital status under the first year of the Comprehensive Care for Joint Replacement Program. JAMA Surg. 2019;154(2):178-179. https://doi.org/10.1001/jamasurg.2018.3098
13. Department of Medicine, University of Wisconsin School of Medicine and Public Health. Neighborhood Atlas. Accessed March 1, 2021. https://www.neighborhoodatlas.medicine.wisc.edu/
14. Dartmouth Atlas Project. The Dartmouth Atlas of Health Care. Accessed March 1, 2021. https://www.dartmouthatlas.org/
15. Chatterjee P, Joynt KE, Orav EJ, Jha AK. Patient experience in safety-net hospitals: implications for improving care and value-based purchasing. Arch Intern Med. 2012;172(16):1204-1210. https://doi.org/10.1001/archinternmed.2012.3158
16. Rolnick JA, Liao JM, Navathe AS. Programme design matters—lessons from bundled payments in the US. June 17, 2020. Accessed March 1, 2021. https://blogs.bmj.com/bmj/2020/06/17/programme-design-matters-lessons-from-bundled-payments-in-the-us
17. Dummit LA, Kahvecioglu D, Marrufo G, et al. Association between hospital participation in a Medicare bundled payment initiative and payments and quality outcomes for lower extremity joint replacement episodes. JAMA. 2016;316(12):1267-1278. https://doi.org/10.1001/jama.2016.12717
18. Navathe AS, Liao JM, Dykstra SE, et al. Association of hospital participation in a Medicare bundled payment program with volume and case mix of lower extremity joint replacement episodes. JAMA. 2018;320(9):901-910. https://doi.org/10.1001/jama.2018.12345
19. Joynt Maddox KE, Orav EJ, Zheng J, Epstein AM. Evaluation of Medicare’s bundled payments initiative for medical conditions. N Engl J Med. 2018;379(3):260-269. https://doi.org/10.1056/NEJMsa1801569
20. Navathe AS, Emanuel EJ, Venkataramani AS, et al. Spending and quality after three years of Medicare’s voluntary bundled payment for joint replacement surgery. Health Aff (Millwood). 2020;39(1):58-66. https://doi.org/10.1377/hlthaff.2019.00466
21. Liao JM, Emanuel EJ, Venkataramani AS, et al. Association of bundled payments for joint replacement surgery and patient outcomes with simultaneous hospital participation in accountable care organizations. JAMA Netw Open. 2019;2(9):e1912270. https://doi.org/10.1001/jamanetworkopen.2019.12270
22. Kim DH, Schneeweiss S. Measuring frailty using claims data for pharmacoepidemiologic studies of mortality in older adults: evidence and recommendations. Pharmacoepidemiol Drug Saf. 2014;23(9):891-901. https://doi.org/10.1002/pds.3674
23. Joynt KE, Figueroa JF, Beaulieu N, Wild RC, Orav EJ, Jha AK. Segmenting high-cost Medicare patients into potentially actionable cohorts. Healthc (Amst). 2017;5(1-2):62-67. https://doi.org/10.1016/j.hjdsi.2016.11.002
24. Quality Payment Program. Small, underserved, and rural practices. Accessed March 1, 2021. https://qpp.cms.gov/about/small-underserved-rural-practices
25. McCarthy CP, Vaduganathan M, Patel KV, et al. Association of the new peer group–stratified method with the reclassification of penalty status in the Hospital Readmission Reduction Program. JAMA Netw Open. 2019;2(4):e192987. https://doi.org/10.1001/jamanetworkopen.2019.2987
26. Centers for Medicare & Medicaid Services. BPCI Advanced. Updated September 16, 2021. Accessed October 18, 2021. https://innovation.cms.gov/innovation-models/bpci-advanced
© 2021 Society of Hospital Medicine
Improving Healthcare Access for Patients With Limited English Proficiency
Patients whose primary language is not English and who have a limited ability to read, speak, write, or understand English experience worse healthcare access than their English-speaking counterparts, highlighted by fewer healthcare visits and filled prescription medications.1 These patients with limited English proficiency (LEP) face additional barriers to quality healthcare during the COVID-19 pandemic, including lower rates of telehealth use,2 lower rates of COVID-19 testing,3 and challenges with implementing high-quality interpretation.4 As a result of such long-standing disparities, healthcare policy has focused on improving access to language-concordant care.
The Civil Rights Act of 1964 and Department of Health and Human Services (HHS) regulations require recipients of federal financial assistance to provide reasonable access to programs, services, and activities to persons with LEP. Section 1557 of the Affordable Care Act extends Title VI nondiscrimination standards to the entire healthcare system, including insurers and health plans. In 2016, the Obama administration implemented Section 1557 through regulations that clarified and expanded language accessibility standards, although several years later the Trump administration sought to weaken the rule’s protections.
Although the requirement to make healthcare accessible to patients with LEP is unequivocal, “reasonable access” provides clinicians who accept federal funds with flexibility in how they deliver language access services. Differing interpretations of what is considered “reasonable” drives variation in how and when medical facilities provide interpreter services. This results in inconsistency of services provided across care settings and decreased availability of language-concordant care. For example, less than one-third of outpatient providers regularly use qualified interpreters when seeing patients with LEP.5 Furthermore, only about 69% of hospitals offer language access services.6 Clinician underutilization of interpreters for patients with LEP results in poor patient satisfaction and worse health outcomes.7 In light of the Biden administration’s commitment to civil rights and healthcare access, we outline a roadmap of actions that this administration must take to ensure access to basic communication needs and improve health equity.
IDENTIFY CURRENT OPPORTUNITIES FOR IMPROVING REGULATIONS
The Trump-era rules loosened the requirement that care providers notify patients with LEP of their rights to language services and provide instructions on how to access these services. These rules also allowed providers to replace video-based interpreter services with audio-based services, which disproportionately impacts patients in rural areas, who rely on high-quality video interpretation to facilitate telehealth visits, especially during the ongoing COVID-19 pandemic, which has increased patient reliance on telehealth infrastructure for primary healthcare access. The Trump administration weakened both the standards for ensuring adequate access to language assistance services and the compliance tests used to assess whether healthcare organizations have met those standards. The revised regulations deem certain healthcare services effectively exempt from interpreter standards if the projected number of encountered patients with LEP falls below preset minimums and a healthcare entity considers the cost of compliance onerous.8 The Trump administration justified these changes as a cost-savings matter, but the suboptimal care resulting from these changes will likely offset any savings.
RESTORE AND IMPROVE LANGUAGE ACCESS PROVISIONS
To restore a strong commitment to language access, the HHS Office for Civil Rights, which the Biden administration has targeted for new investments in fiscal year 2022, should reestablish the HHS Language Access Steering Committee. This committee maintains criteria that guide covered health entities in developing language access compliance plans. Maintaining such plans should become a basic element of the revised Section 1557 compliance rules and should also become a core feature of the standards applicable to Joint Commission–accredited healthcare organizations. In addition, the Center for Medicare and Medicaid Innovation, whose mission is to identify, test, and implement major improvements in healthcare quality and efficiency, could undertake a special project to identify and incentivize adoption of the most effective language access innovations for incorporation into language access plans.
RESTRUCTURE AND STRENGTHEN COMPLIANCE FOR LANGUAGE ACCESS
Section 1557, as well as federal standards governing the conditions of participation in federal healthcare programs, should ensure that covered entities report on interpreter use and associated patient health outcomes for patients with LEP. Overall compliance measurement and reporting in connection with language access is a matter of basic health equity. Currently, any individual who believes they have experienced discrimination based on language can report a potential violation for federal investigation. But an individual remedy is insufficient because it cannot ensure the types of systemic changes essential to overcome decades of structural exclusion and achieve broader health equity. Further, barriers from digital literacy gaps and fear of legal repercussions, such as deportation, hamper individual reporting efforts. Any policy focused on improving language access use should apply to all patients, regardless of immigration status.
INCENTIVIZE LANGUAGE-CONCORDANT CARE
Ultimately, there is little benefit to imposing standards without a concomitant assurance of the resources needed to achieve full adoption and ongoing compliance. For this reason, a commitment to language access must be accompanied by payment reforms that enable Medicare and Medicaid providers to embrace this vital feature of accessible healthcare by recognizing interpreter costs as part of the clinical encounter and care management. Covered entities could use these resources either to strengthen their own staffing or contract with third-party interpreter services organizations. Currently, the Centers for Medicare & Medicaid Services (CMS) allow states to claim federal matching funds for language assistance services provided to Medicaid enrollees, though rates are dependent on how service claims are categorized. State Medicaid programs can facilitate the provision of such services by optimizing reimbursements for provider organizations under CMS policy.
The Merit-based Incentive Payment System (MIPS) provides an opportunity to incorporate the provision of interpreter services into quality measure reporting. Such efforts could improve health equity and address long-standing needs for research into how language barriers affect healthcare outcomes. Given that analyses of inaugural MIPS data revealed that safety-net practices were more likely to receive lower composite scores, additional scoring flexibility under pay-for-performance schemes (rather than strict penalties) may be necessary to ensure the solvency of safety net practices that disproportionately care for patients with LEP.9 Here, CMMI can play a critical role in expanding the use of patient-facing resources by designing new alternative payment models that reward participants for providing high-quality language concordant care.
The COVID-19 pandemic has exacerbated disparities in care for patients with LEP and even starker disparities among immigrant communities and patients of color. These disparities will only worsen if regulations aimed at improving access to language access services are not reinstated and improved. Failing to focus on healthcare access for patients with LEP hurts individual patient health and public health, as we have seen through lower rates of testing and vaccination in communities of color during this pandemic. The Biden administration can put healthcare on a more equitable pathway by expanding and strengthening language access as a core feature of healthcare, as a matter of both civil rights and health care quality.
Acknowledgments
The authors thank Jocelyn Samuels, JD, and Sara Rosenbaum, JD, for comments and guidance on an earlier draft of this article.
1. Himmelstein J, Himmelstein DU, Woolhandler S, et al. Health care spending and use among Hispanic adults with and without limited English proficiency, 1999–2018. Health Aff (Millwood). 2021;40(7):1126-1134. https://doi.org/10.1377/hlthaff.2020.02510
2. Rodriguez JA, Saadi A, Schwamm LH, Bates DW, Samal L. Disparities in telehealth use among California patients with limited English proficiency. Health Aff (Millwood). 2021;40(3):487-495. https://doi.org/10.1377/hlthaff.2020.00823
3. Kim HN, Lan KF, Nkyekyer E, et al. Assessment of disparities in COVID-19 testing and infection across language groups in Seattle, Washington. JAMA Netw Open. 2020;3(9):e2021213. https://doi.org/10.1001/jamanetworkopen.2020.21213
4. Page KR, Flores-Miller A. Lessons we’ve learned - Covid-19 and the undocumented Latinx community. N Engl J Med. 2021;384(1):5-7. https://doi.org/10.1056/NEJMp2024897
5. Schulson LB, Anderson TS. National estimates of professional interpreter use in the ambulatory setting. J Gen Intern Med. Published online November 2, 2020. https://doi.org/10.1007/s11606-020-06336-6
6. Schiaffino MK, Nara A, Mao L. Language services in hospitals vary by ownership and location. Health Aff (Millwood). 2016;35(8):1399-1403. https://doi.org/10.1377/hlthaff.2015.0955
7. Taira BR, Kim K, Mody N. Hospital and health system–level interventions to improve care for limited English proficiency patients: a systematic review. Jt Comm J Qual Patient Saf. 2019;45(6):446-458. https://doi.org/10.1016/j.jcjq.2019.02.005
8. Musumeci M, Kates J, Dawson L, Salganicoff A, Sobel L, Artiga S. The Trump administration’s final rule on Section 1557 non-discrimination regulations under the ACA and current status. Kaiser Family Foundation. September 18, 2020. Accessed September 2, 2021. https://www.kff.org/racial-equity-and-health-policy/issue-brief/the-trump-administrations-final-rule-on-section-1557-non-discrimination-regulations-under-the-aca-and-current-status/
9. Liao JM, Navathe AS. Does the Merit-Based Incentive Payment System disproportionately affect safety-net practices? JAMA Health Forum. 2020;1(5):e200452. https://doi.org/10.1001/jamahealthforum.2020.0452
Patients whose primary language is not English and who have a limited ability to read, speak, write, or understand English experience worse healthcare access than their English-speaking counterparts, highlighted by fewer healthcare visits and filled prescription medications.1 These patients with limited English proficiency (LEP) face additional barriers to quality healthcare during the COVID-19 pandemic, including lower rates of telehealth use,2 lower rates of COVID-19 testing,3 and challenges with implementing high-quality interpretation.4 As a result of such long-standing disparities, healthcare policy has focused on improving access to language-concordant care.
The Civil Rights Act of 1964 and Department of Health and Human Services (HHS) regulations require recipients of federal financial assistance to provide reasonable access to programs, services, and activities to persons with LEP. Section 1557 of the Affordable Care Act extends Title VI nondiscrimination standards to the entire healthcare system, including insurers and health plans. In 2016, the Obama administration implemented Section 1557 through regulations that clarified and expanded language accessibility standards, although several years later the Trump administration sought to weaken the rule’s protections.
Although the requirement to make healthcare accessible to patients with LEP is unequivocal, “reasonable access” provides clinicians who accept federal funds with flexibility in how they deliver language access services. Differing interpretations of what is considered “reasonable” drives variation in how and when medical facilities provide interpreter services. This results in inconsistency of services provided across care settings and decreased availability of language-concordant care. For example, less than one-third of outpatient providers regularly use qualified interpreters when seeing patients with LEP.5 Furthermore, only about 69% of hospitals offer language access services.6 Clinician underutilization of interpreters for patients with LEP results in poor patient satisfaction and worse health outcomes.7 In light of the Biden administration’s commitment to civil rights and healthcare access, we outline a roadmap of actions that this administration must take to ensure access to basic communication needs and improve health equity.
IDENTIFY CURRENT OPPORTUNITIES FOR IMPROVING REGULATIONS
The Trump-era rules loosened the requirement that care providers notify patients with LEP of their rights to language services and provide instructions on how to access these services. These rules also allowed providers to replace video-based interpreter services with audio-based services, which disproportionately impacts patients in rural areas, who rely on high-quality video interpretation to facilitate telehealth visits, especially during the ongoing COVID-19 pandemic, which has increased patient reliance on telehealth infrastructure for primary healthcare access. The Trump administration weakened both the standards for ensuring adequate access to language assistance services and the compliance tests used to assess whether healthcare organizations have met those standards. The revised regulations deem certain healthcare services effectively exempt from interpreter standards if the projected number of encountered patients with LEP falls below preset minimums and a healthcare entity considers the cost of compliance onerous.8 The Trump administration justified these changes as a cost-savings matter, but the suboptimal care resulting from these changes will likely offset any savings.
RESTORE AND IMPROVE LANGUAGE ACCESS PROVISIONS
To restore a strong commitment to language access, the HHS Office for Civil Rights, which the Biden administration has targeted for new investments in fiscal year 2022, should reestablish the HHS Language Access Steering Committee. This committee maintains criteria that guide covered health entities in developing language access compliance plans. Maintaining such plans should become a basic element of the revised Section 1557 compliance rules and should also become a core feature of the standards applicable to Joint Commission–accredited healthcare organizations. In addition, the Center for Medicare and Medicaid Innovation, whose mission is to identify, test, and implement major improvements in healthcare quality and efficiency, could undertake a special project to identify and incentivize adoption of the most effective language access innovations for incorporation into language access plans.
RESTRUCTURE AND STRENGTHEN COMPLIANCE FOR LANGUAGE ACCESS
Section 1557, as well as federal standards governing the conditions of participation in federal healthcare programs, should ensure that covered entities report on interpreter use and associated patient health outcomes for patients with LEP. Overall compliance measurement and reporting in connection with language access is a matter of basic health equity. Currently, any individual who believes they have experienced discrimination based on language can report a potential violation for federal investigation. But an individual remedy is insufficient because it cannot ensure the types of systemic changes essential to overcome decades of structural exclusion and achieve broader health equity. Further, barriers from digital literacy gaps and fear of legal repercussions, such as deportation, hamper individual reporting efforts. Any policy focused on improving language access use should apply to all patients, regardless of immigration status.
INCENTIVIZE LANGUAGE-CONCORDANT CARE
Ultimately, there is little benefit to imposing standards without a concomitant assurance of the resources needed to achieve full adoption and ongoing compliance. For this reason, a commitment to language access must be accompanied by payment reforms that enable Medicare and Medicaid providers to embrace this vital feature of accessible healthcare by recognizing interpreter costs as part of the clinical encounter and care management. Covered entities could use these resources either to strengthen their own staffing or contract with third-party interpreter services organizations. Currently, the Centers for Medicare & Medicaid Services (CMS) allow states to claim federal matching funds for language assistance services provided to Medicaid enrollees, though rates are dependent on how service claims are categorized. State Medicaid programs can facilitate the provision of such services by optimizing reimbursements for provider organizations under CMS policy.
The Merit-based Incentive Payment System (MIPS) provides an opportunity to incorporate the provision of interpreter services into quality measure reporting. Such efforts could improve health equity and address long-standing needs for research into how language barriers affect healthcare outcomes. Given that analyses of inaugural MIPS data revealed that safety-net practices were more likely to receive lower composite scores, additional scoring flexibility under pay-for-performance schemes (rather than strict penalties) may be necessary to ensure the solvency of safety net practices that disproportionately care for patients with LEP.9 Here, CMMI can play a critical role in expanding the use of patient-facing resources by designing new alternative payment models that reward participants for providing high-quality language concordant care.
The COVID-19 pandemic has exacerbated disparities in care for patients with LEP and even starker disparities among immigrant communities and patients of color. These disparities will only worsen if regulations aimed at improving access to language access services are not reinstated and improved. Failing to focus on healthcare access for patients with LEP hurts individual patient health and public health, as we have seen through lower rates of testing and vaccination in communities of color during this pandemic. The Biden administration can put healthcare on a more equitable pathway by expanding and strengthening language access as a core feature of healthcare, as a matter of both civil rights and health care quality.
Acknowledgments
The authors thank Jocelyn Samuels, JD, and Sara Rosenbaum, JD, for comments and guidance on an earlier draft of this article.
1. Himmelstein J, Himmelstein DU, Woolhandler S, et al. Health care spending and use among Hispanic adults with and without limited English proficiency, 1999–2018. Health Aff (Millwood). 2021;40(7):1126-1134. https://doi.org/10.1377/hlthaff.2020.02510
2. Rodriguez JA, Saadi A, Schwamm LH, Bates DW, Samal L. Disparities in telehealth use among California patients with limited English proficiency. Health Aff (Millwood). 2021;40(3):487-495. https://doi.org/10.1377/hlthaff.2020.00823
3. Kim HN, Lan KF, Nkyekyer E, et al. Assessment of disparities in COVID-19 testing and infection across language groups in Seattle, Washington. JAMA Netw Open. 2020;3(9):e2021213. https://doi.org/10.1001/jamanetworkopen.2020.21213
4. Page KR, Flores-Miller A. Lessons we’ve learned - Covid-19 and the undocumented Latinx community. N Engl J Med. 2021;384(1):5-7. https://doi.org/10.1056/NEJMp2024897
5. Schulson LB, Anderson TS. National estimates of professional interpreter use in the ambulatory setting. J Gen Intern Med. Published online November 2, 2020. https://doi.org/10.1007/s11606-020-06336-6
6. Schiaffino MK, Nara A, Mao L. Language services in hospitals vary by ownership and location. Health Aff (Millwood). 2016;35(8):1399-1403. https://doi.org/10.1377/hlthaff.2015.0955
7. Taira BR, Kim K, Mody N. Hospital and health system–level interventions to improve care for limited English proficiency patients: a systematic review. Jt Comm J Qual Patient Saf. 2019;45(6):446-458. https://doi.org/10.1016/j.jcjq.2019.02.005
8. Musumeci M, Kates J, Dawson L, Salganicoff A, Sobel L, Artiga S. The Trump administration’s final rule on Section 1557 non-discrimination regulations under the ACA and current status. Kaiser Family Foundation. September 18, 2020. Accessed September 2, 2021. https://www.kff.org/racial-equity-and-health-policy/issue-brief/the-trump-administrations-final-rule-on-section-1557-non-discrimination-regulations-under-the-aca-and-current-status/
9. Liao JM, Navathe AS. Does the Merit-Based Incentive Payment System disproportionately affect safety-net practices? JAMA Health Forum. 2020;1(5):e200452. https://doi.org/10.1001/jamahealthforum.2020.0452
© 2021 Society of Hospital Medicine
Words from the wise
“When 900-years-old you reach, look as good you will not.” –Yoda
I’ve been on a roll lately: 100, 94, 90, 97, 94. These aren’t grades or even what I scratched on my scorecard for 18 holes (that’s more like 112), but rather patients I’ve seen.

Our oldest-old have been in COVID-19 protection for the last couple of years and only now feel safe to come out again. Many have skin cancers. Some of them have many. I’m grateful that for all their health problems, basal cell carcinomas at least I can cure. And
From a 94-year-old woman who was just discharged from the hospital for sepsis: First, sepsis can sneak up from behind and jump you when you’re 94. She was sitting in a waiting room for a routine exam when she passed out and woke up in the ICU. She made it home and is back on her feet, literally. When I asked her how she made it though, she was very matter of fact. Trust that the doctors know what’s right. Trust that someone will tell you what to do next. Trust that you know your own body and what you can and cannot do. Ask for help, then simply trust it will all work out. It usually does.
From a 97-year-old fighter pilot who fought in the Korean War: Let regrets drop away and live to fight another day. He’s had multiple marriages, built and lost companies, been fired and fired at, and made some doozy mistakes, some that caused considerable pain and collateral damage. But each day is new and requires your best. He has lived long enough to love dozens of grandkids and give away more than what most people ever make. His bottom line, if you worry and fret and regret, you’ll make even more mistakes ahead. Look ahead, the ground never comes up from behind you.
From a 94-year-old whose son was killed in a car accident nearly 60 years ago: You can be both happy and sad. When she retold the story of how the police knocked on her door with the news that her son was dead, she started to cry. Even 60 years isn’t long enough to blunt such pain. She still thinks of him often and to this day sometimes finds it difficult to believe he’s gone. Such pain never leaves you. But she is still a happy person with countless joys and is still having such fun. If you live long enough, both will likely be true.
From a 90-year old who still played tennis: “Just one and one.” That is, one beer and one shot, every day. No more. No less. I daren’t say I recommend this one; however, it might also be the social aspect of drinking that matters. He also advised to be free with friendships. You’ll have many people come in and out of your life; be open to new ones all the time. Also sometimes let your friends win.
From a 100-year-old, I asked how he managed to get through the Great Depression, WWII, civil unrest of the 1950s, and the Vietnam War. His reply? “To be honest, I’ve never seen anything quite like this before.”
When there’s time, consider asking for advice from those elders who happen to have an appointment with you. Bring you wisdom, they will.
Dr. Benabio is director of Healthcare Transformation and chief of dermatology at Kaiser Permanente San Diego. The opinions expressed in this column are his own and do not represent those of Kaiser Permanente. Dr. Benabio is @Dermdoc on Twitter. Write to him at [email protected].
“When 900-years-old you reach, look as good you will not.” –Yoda
I’ve been on a roll lately: 100, 94, 90, 97, 94. These aren’t grades or even what I scratched on my scorecard for 18 holes (that’s more like 112), but rather patients I’ve seen.
Our oldest-old have been in COVID-19 protection for the last couple of years and only now feel safe to come out again. Many have skin cancers. Some of them have many. I’m grateful that for all their health problems, basal cell carcinomas at least I can cure. And
From a 94-year-old woman who was just discharged from the hospital for sepsis: First, sepsis can sneak up from behind and jump you when you’re 94. She was sitting in a waiting room for a routine exam when she passed out and woke up in the ICU. She made it home and is back on her feet, literally. When I asked her how she made it though, she was very matter of fact. Trust that the doctors know what’s right. Trust that someone will tell you what to do next. Trust that you know your own body and what you can and cannot do. Ask for help, then simply trust it will all work out. It usually does.
From a 97-year-old fighter pilot who fought in the Korean War: Let regrets drop away and live to fight another day. He’s had multiple marriages, built and lost companies, been fired and fired at, and made some doozy mistakes, some that caused considerable pain and collateral damage. But each day is new and requires your best. He has lived long enough to love dozens of grandkids and give away more than what most people ever make. His bottom line, if you worry and fret and regret, you’ll make even more mistakes ahead. Look ahead, the ground never comes up from behind you.
From a 94-year-old whose son was killed in a car accident nearly 60 years ago: You can be both happy and sad. When she retold the story of how the police knocked on her door with the news that her son was dead, she started to cry. Even 60 years isn’t long enough to blunt such pain. She still thinks of him often and to this day sometimes finds it difficult to believe he’s gone. Such pain never leaves you. But she is still a happy person with countless joys and is still having such fun. If you live long enough, both will likely be true.
From a 90-year old who still played tennis: “Just one and one.” That is, one beer and one shot, every day. No more. No less. I daren’t say I recommend this one; however, it might also be the social aspect of drinking that matters. He also advised to be free with friendships. You’ll have many people come in and out of your life; be open to new ones all the time. Also sometimes let your friends win.
From a 100-year-old, I asked how he managed to get through the Great Depression, WWII, civil unrest of the 1950s, and the Vietnam War. His reply? “To be honest, I’ve never seen anything quite like this before.”
When there’s time, consider asking for advice from those elders who happen to have an appointment with you. Bring you wisdom, they will.
Dr. Benabio is director of Healthcare Transformation and chief of dermatology at Kaiser Permanente San Diego. The opinions expressed in this column are his own and do not represent those of Kaiser Permanente. Dr. Benabio is @Dermdoc on Twitter. Write to him at [email protected].
Specific blood pressure-lowering drugs prevent onset of new diabetes
results from a new meta-analysis show.
Angiotensin-converting enzyme (ACE) inhibitors and angiotensin II receptor blockers (ARB) – so-called renin-angiotensin system (RAS) blockers – showed the strongest association with preventive effects, while conversely, beta-blocker and thiazide diuretic antihypertensives were linked to an increased risk of new-onset diabetes.
“This study suggests that blood pressure lowering can help prevent diabetes in addition to its well-established beneficial effects in reducing cardiovascular events,” write Milad Nazarzadeh and colleagues with the Blood Pressure Lowering Treatment Trialists’ Collaboration in their article published in The Lancet.
“The differing effects of the drug classes support decision-making for antihypertensive drug choice according to an individual’s risk profile,” note Mr. Nazarzadeh, of Deep Medicine, Oxford Martin School, University of Oxford, U.K., and colleagues.
“In particular, [RAS inhibitors], ACE inhibitors and ARBs, should become the drugs of choice when clinical risk of diabetes is of concern, whereas beta blockers and thiazide diuretics should be avoided where possible,” they add.
In an accompanying editorial, Matthew A. Cavender, MD, MPH, and Robert C. Wirka, MD, of the University of North Carolina at Chapel Hill, agree that the new findings, along with the bulk of previous evidence, point to an important role of RAS-inhibiting drugs in diabetes prevention.
“Based on the accumulated evidence, including the results of these analyses, blood pressure control, particularly with RAS inhibition, should be considered as a possible strategy to reduce the risk of developing diabetes,” they write.
They note that, while “the absolute risk reduction found in this meta-analysis is modest, interventions with small benefits can have an outsized effect when applied to conditions as common as hypertension.”
And commenting on the findings to the U.K. Science & Media Centre, Marc George, MBChB, PhD, blood pressure clinical lead for University College London Hospital, U.K., said: “Lowering blood pressure prevents heart attacks, strokes, and kidney failure, and this new large and comprehensive study published in The Lancet also shows that it lowers the risk of developing diabetes. Until now this effect was not clear.”
Kevin McConway, PhD, emeritus professor of applied statistics, The Open University, U.K., similarly concurs: “Though there is good evidence that lowering people’s blood pressure, if it is too high, can have important health benefits in reducing the risk of heart attacks and strokes, it hasn’t been clear whether lowering blood pressure can reduce the chance of developing type 2 diabetes in the future. This is an impressive study.”
RAS blockers associated with lower diabetes risk
The findings are from an individual data meta-analysis of 19 randomized, placebo-controlled trials conducted between 1973 and 2008 and involving five major classes of antihypertensive drugs: ACE inhibitors, ARBs, beta-blockers, thiazide diuretics, and calcium channel blockers.
Overall, the studies included 145,939 participants, of whom 60.6% were men.
Over a median follow-up of 4.5 years, 9,883 of the study participants developed new-onset type 2 diabetes.
Those treated with ACE inhibitors or ARBs had a reduced relative risk of new-onset diabetes that was nearly identical (risk reduction, 0.84 for both) versus placebo.
However, treatment with beta-blockers or thiazide diuretics was associated with an increased risk of type 2 diabetes (RR, 1.48 and 1.20, respectively), consistent with previous evidence that, specifically, second-line thiazide diuretics and third-line beta blockers increase the risk of diabetes.
No significant reduction or increase in risk was observed with calcium channel blockers (RR, 1.02).
For the reductions with ACE inhibitors and ARBs, each reduction in systolic blood pressure of 5-mm Hg was associated with an 11% reduced risk of developing diabetes.
“The relative magnitude of reduction per 5-mm Hg systolic blood pressure lowering was similar to those reported for prevention of major cardiovascular events,” the authors say.
“[This] will strengthen the case for blood pressure reduction through lifestyle interventions known to reduce blood pressure, and blood pressure lowering treatments with drugs, and possibly device therapies,” they say.
In the opposite direction, research has suggested that each 20-mm Hg increase in systolic blood pressure is associated with as much as a 77% increased risk of type 2 diabetes; however, the causality of that association is uncertain, the authors note.
Results fill gap in evidence for guidelines
The meta-analysis findings were further validated in a supplemental mendelian randomization analysis, which used data from the International Consortium for Blood Pressure genome-wide association study and the UK Biobank. The analysis showed that people with genetic variants that have a similar effect on the RAS pathway as ACE inhibitors and ARBs also had a reduced risk of diabetes.
On this point, Dipender Gill, BMBCh, PhD, lecturer in clinical pharmacology and therapeutics at St. George’s, University of London, told the U.K. Science and Media Centre: “This is a comprehensive study triangulating clinical trial and genetic data to find support for effects of blood pressure reduction through particular pharmacological targets on glycemic control and risk of type 2 diabetes.”
Mr. Nazarzadeh and colleagues say that uncertainty regarding whether the reduction in diabetes risk is caused by blood pressure lowering itself, or by some other effect of the antihypertensive drugs, has meant that guideline recommendations on the role of antihypertensive drugs have been lacking.
However, the authors assert that “our study fills this gap in evidence using individual participant data from randomized controlled trials and assessing effects for a standardized fixed degree of blood pressure reduction.”
“With consistent results from both randomized controlled trials and genetic analyses, we have shown that elevated blood pressure is indeed a modifiable risk factor for new-onset type 2 diabetes in people without a diagnosis of diabetes, with a relative effect size similar to those seen for the prevention of major cardiovascular disease,” they state.
Authors of U.S. hypertension guidelines should follow lead of ESC
Under the European Society of Cardiology (ESC) guidelines, RAS inhibitors (in combination with a calcium channel blocker or thiazide diuretic) have a class 1 recommendation for the treatment of hypertension; however, diabetes and cardiology societies in the United States only recommend a preference for a RAS inhibitor over other agents among those with concomitant albuminuria.
But with an estimated 13% of Americans having diabetes and a striking 34.5% having prediabetes, the need for more measures to tackle the problem is urgent, say Dr. Cavender and Dr. Wirka in their editorial.
“Perhaps these data are enough to encourage the writers of the hypertension guidelines in the U.S. to follow the lead of the ESC to make RAS inhibitors the first-line hypertension treatment for all patients and not just in those with albuminuria,” they state.
Dr. Cavender has reported receiving research support from Amgen, AstraZeneca, Boehringer-Ingelheim, CSL Behring, and Novartis, and consulting fees from Amgen, AstraZeneca, Bayer, Boehringer-Ingelheim, Boston Scientific, Edwards Lifesciences, Merck, and Novo Nordisk. Disclosures for the other authors are listed with the article. Dr. Wirka and Dr. George have reported no relevant financial relationships. Dr. McConway is a trustee of the SMC and member of its advisory committee. Dr. Gill is employed part-time by Novo Nordisk.
A version of this article first appeared on Medscape.com.
FROM THE LANCET
Oral daprodustat safely improves anemia in chronic kidney disease
both in those who are dialysis dependent and those who are not, in a pair of phase 3, randomized trials that together included more than 6,800 patients.
“Daprodustat could represent an oral alternative to ESAs for treating anemia of CKD in both dialysis and nondialysis patients,” said Ajay K. Singh, MBBS, who presented results from both studies at the annual meeting of the American Society of Nephrology.
Concurrently, reports on the trial with dialysis-dependent patients, ASCEND-D, and on the trial with non–dialysis-dependent patients, ASCEND-ND, appeared online in the New England Journal of Medicine.
Singh highlighted that the results prove the noninferiority of oral daprodustat to the injected ESAs – epoetin alfa (Epogen, Procrit) or darbepoetin alfa (Aranesp) – used as the comparator agents in the two trials for the adjudicated safety outcome of major adverse cardiovascular events (MACE). In addition, results from the two studies also showed “no safety signals that pop out, and no new safety signals observed,” he said.
Those were telling assessments, given that two other agents from the same drug class – the hypoxia-inducible factor prolyl hydroxylase inhibitors (HIF-PHIs) roxadustat and vadadustat – have been hobbled by safety concerns that cropped up in their pivotal trials.
A class with a history of safety concerns
The HIF-PHI roxadustat received an overwhelming negative reaction from an advisory committee to the Food and Drug Administration in July 2021 because of safety concerns, although it was approved in the European Union.
And results from a phase 3 trial of the HIF-PHI agent vadadustat reported in April, showed that, in patients with non–dialysis-dependent CKD treated with vadadustat the MACE incidence failed to meet the trial’s criterion for noninferiority, compared with patients treated with the ESA darbepoetin alfa.
In contrast, the safety of daprodustat, based on the results reported so far “is looking really good,” commented Jay B. Wish, MD, a nephrologist and professor at Indiana University in Indianapolis who was not involved with the study.
“You never know what’s behind the curtain, but what’s out there [for daprodustat] seems very encouraging,” Dr. Wish said in an interview.
He cited in particular the data reported by Dr. Singh on thromboembolic events and vascular access thrombosis, adverse effects that were especially problematic for roxadustat. The report by Dr. Singh specifically called out these numbers and showed numerical reductions in these rates, compared with ESA-treated patients among those on dialysis, and small increases among those on daprodustat, compared with ESA treatment among those not on dialysis.
In ASCEND-ND, nonfatal thromboembolic events during median follow-up of 1.9 years occurred 97 times (in 3.0% of patients) among 1,917 patients treated with daprodustat and 65 times (in 2.4% of patients) among 1,935 patients treated with darbepoetin alfa, reported Dr. Singh, a nephrologist at Brigham and Women’s Hospital in Boston. Vascular access thrombosis in ASCEND-ND occurred 69 times in 2.1% of patients on daprodustat and 42 times in 1.5% of patients who received the ESA.
Drugs from the HIF-PHI class for anemia in patients with CKD “have now been evaluated in a number of phase 3, randomized, controlled trials. Initial results in patients with dialysis-dependent CKD are promising, but in patients with non–dialysis-dependent CKD questions about indications and safety warrant further investigations,” Patrick Parfrey, MD, commented in an editorial that accompanied the ASCEND-D and ASCEND-ND reports.
Safety signals seen for cancers and erosions
Dr. Parfrey cited two particular safety findings, both seen in ASCEND-ND. One was a numerically higher rate of cancer-related death, or tumor progression or recurrence, among the daprodustat recipients (3.7%), compared with the controls who received an ESA in the ASCEND-ND trial (2.5%), representing a significant relative risk of 1.47.
In contrast, in ASCEND-D this cancer safety measure showed a reduced relative risk with daprodustat of 0.92 relative to the ESA comparators.
“The safety of HIF-PHIs from the cancer perspective will require longer follow-up, individual patient meta-analysis ... and postmarketing surveillance,” wrote Dr. Parfrey, a nephrologist and professor at Memorial University, St. John’s, Nfld.
Elevated cancer rates are a hypothetical concern with agents from the HIF-PHI class because of their potential for increasing angiogenesis that could support tumor growth, said Dr. Wish.
Dr. Parfrey also cited another safety signal in ASCEND-ND, a higher rate of esophageal or gastric erosions on daprodustat (3.6%), compared with those on darbepoetin alfa (2.1%), with a significant relative risk of 1.7.
Again, this signal was absent in ASCEND-D, where esophageal or gastric erosions were more common in the patients on an ESA, with a relative risk reduction in favor of daprodustat of 0.74.
But even if these cancer and erosion effects in nondialysis patients on daprodustat are real, “these things don’t sink a drug. You deal with them in the drug’s label,” commented Dr. Wish.
During the FDA’s advisory committee meeting on roxadustat, agency staffers especially cited apparent excess rates of thrombosis and seizures associated with the drug. In both ASCEND-D and ASCEND-ND the rate of seizures in both treatment arms was less than 1%.
Dr. Wish speculated that the differences seen between roxadustat and daprodustat are likely more related to the design of their respective studies rather than real drug differences within the class.
Perhaps most importantly, the roxadustat trials in patients with CKD and not requiring dialysis compared the drug against placebo, while in ASCEND-ND the comparator was darbepoetin alfa. He also suggested that patients on dialysis receiving roxadustat may have been “overdosed,” resulting in faster increases in hemoglobin and higher peak levels.
Big potential for oral anemia treatment
In general, having an oral alternative for treating anemia in patients with CKD will be a significant advance, said Dr. Wish, especially for patients not on dialysis as well as for the rapidly growing number of patients who receive dialysis at home.
U.S. patients with CKD who do not require dialysis “often don’t get treated for anemia because it is so cumbersome” to use ESAs on patients not treated at a centralized clinic, said Dr. Wish, medical director of the outpatient dialysis unit at Indiana University Hospital, Indianapolis. “It’s a logistical nightmare.”
On the other hand, Wish did not see nearly as great a need for an oral therapy for anemia in patients treated at a dialysis clinic.
Patients who receive an ESA during their three-times weekly dialysis session usually do very well. “It’s not broken, and does not need to get fixed,” Dr. Wish said.
ASCEND-D and ASCEND-ND were sponsored by GlaxoSmithKline, the company developing daprodustat. Dr. Singh has been a consultant to GlaxoSmithKline and owns stock in Gilead. Dr. Wish has been a consultant to GlaxoSmithKline, as well as an adviser to AstraZeneca, Akebia, Otsuka, Vifor, and Rockwell Medica, and he has been a speaker on behalf of AstraZeneca and Akebia.
A version of this article first appeared on Medscape.com.
FROM KIDNEY WEEK 2021
Adding rituximab to belimumab offers no help for lupus
Adding a single cycle of rituximab to belimumab (Benlysta) did not improve disease control for patients with systemic lupus erythematosus (SLE) in comparison with belimumab alone in a phase 3, randomized, controlled trial.
Among patients with SLE who were randomly assigned to receive belimumab with either rituximab, placebo, or standard care, there were no statistically significant differences between the rituximab and placebo arms for the primary endpoint of the proportion of patients with disease control at week 52 or in the secondary endpoints of clinical remission at week 64 or disease control at week 104, Cynthia Aranow, MD, reported in a late-breaking poster session presented during the virtual annual meeting of the American College of Rheumatology.
“Using a new, clinically meaningful endpoint underscores the efficacy of belimumab for disease control, with some patients maintaining disease control with considerable reductions in steroids, and no immunosuppressants,” said Dr. Aranow, a rheumatologist specializing in SLE and RA in New York and director of the Clinical Autoimmunity Center of Excellence at Feinstein Institutes for Medical Research, Manhasset, N.Y.
Use of the combination of belimumab and rituximab was, however, associated with significant improvement over belimumab and placebo in several secondary efficacy endpoints.
Investigators in the randomized, controlled trial, dubbed BLISS-BELIEVE, had previously published a rationale for sequential therapy with belimumab, a human monoclonal antibody that binds to soluble B-lymphocyte stimulator, and rituximab, a B-cell–depleting anti-CD20 monoclonal antibody.
“These biologics, which operate through complementary mechanisms, might result in an enhanced depletion of circulating and tissue-resident autoreactive B lymphocytes when administered together. Thus, belimumab and rituximab combination may be a highly effective treatment of SLE,” they wrote in an article published in 2019 in BMJ Open.
Three-arm trial
The investigators screened 396 patients, of whom 292 were randomly assigned in a 1:2:1 ratio to receive either subcutaneous belimumab 200 mg/wk plus intravenous placebo at weeks 4 and 6 (BEL/PBO, 72 patients), belimumab plus IV rituximab 1,000 mg at weeks 4 and 6 (BEL/RTX, 144 patients), or open-label belimumab plus standard therapy. Patients were allowed to continue taking antimalarial and nonsteroidal anti-inflammatory drugs throughout the study.
The primary disease-control endpoint was defined as a Systemic Lupus Erythematosus Disease Activity Index 2000 (SLEDAI-2K) score of 2 or less, achieved without other immunosuppression, equivalent to that achieved with prednisone 5 mg/day or less.
As noted before, there were no significant differences between the BEL/RTX and BEL/PBO arms in either disease control at week 52 or in the secondary endpoints of clinical remission at week 64 (SLEDAI-2K score, 0) or in the proportion of patients with disease control at week 104.
However, use of BEL/RTX was associated with a significantly longer duration of disease control through 52 weeks than was BEL/PBO (mean, 105.4 days vs. 60.1 days; P = .0188) and with a large SLEDAI-2K mean change from baseline at week 104 (–7.2 vs 5.1; P = .0033).
In addition, there was a trend toward a shift in proteinuria from baseline high (>0.5 g/24 h) to normal in the BEL/RTX group at week 52 and a significantly greater shift at week 104 (P = .0085).
The overall adverse event profiles were generally consistent with those of the individual agents, although serious infections and infestations occurred more frequently with BEL/RTX than BEL/PBO.
Further analyses planned to look for subgroups that benefit
In a poster discussion session, Akshat Khanna, PhD, of Newtown, Pa., a consultant with Effimed Life Sciences Research, asked Dr. Aranow about the rationale for giving rituximab and belimumab concurrently and noted that, in the BEAT-LUPUS and CALIBRATE trials, anti-CD20 agents were given first, followed by belimumab, to prevent activation of humoral immunity.
“The two B-cell agents were given sequentially. Belimumab was given first to maximize the effect of peripheral B-cell depletion and [was] then continued after rituximab to suppress the elevation [of B-lymphocyte stimulator] that occurs after rituximab monotherapy. We used this approach (instead of that used in CALIBRATE and BEAT LUPUS), as we thought this might be more efficacious,” she explained.
When asked whether there were subgroups of patients who might still benefit from the combination, compared with belimumab alone, Dr. Aranow replied: “There may be individual patients in which it might be considered. Further analyses of the data are ongoing/planned.”
The study was supported by GlaxoSmithKline. Dr. Aranow has received grant/research support from GlaxoSmithKline and has consulted for Bristol-Myers Squibb. Dr. Khanna has disclosed no relevant financial relationships.
A version of this article first appeared on Medscape.com.
FROM ACR 2021
Exercise reduces arm and shoulder problems after breast cancer surgery
However, according to a U.K. study published by The BMJ on Nov. 10, women who exercised shortly after having nonreconstructive breast cancer surgery experienced less pain and regained better shoulder and arm mobility at 1 year than those who did not exercise.
“Hospitals should consider training physiotherapists in the PROSPER program to offer this structured, prescribed exercise program to women undergoing axillary clearance surgery and those having radiotherapy to the axilla,” said lead author Julie Bruce, PhD, a specialist in surgical epidemiology with the University of Warwick, Coventry, England.
Up to one-third of women experience adverse effects to their lymphatic and musculoskeletal systems after breast cancer surgery and radiotherapy targeting the axilla. A study of 2,411 women in Denmark found that pain remained for up to 7 years after breast cancer treatment. U.K. guidelines for the management of breast cancer recommend referral to physical therapy if such problems develop, but the best timing and intensity along with the safety of postoperative exercise remain uncertain. A review of the literature in 2019 found a lack of adequate evidence to support the use of postoperative exercise after breast cancer surgery. Moreover, concerns with such exercise have been reported, such as increased risks of postoperative wound complications and lymphedema.
“The study was conducted to address uncertainty whether early postoperative exercise after women at high risk of shoulder and arm problems after nonreconstructive surgery was safe, clinically, and cost-effective. Previous studies were small, and no large high-quality randomized controlled trials had been undertaken with this patient population in the U.K.,” Dr. Bruce said.
In UK PROSPER, a multicenter, randomized controlled trial, researchers investigated the effects of an exercise program compared with usual care for 392 women (mean age 58) undergoing breast cancer surgery at 17 National Health Service (NHS) cancer centers. The women were randomly assigned to usual care with structured exercise or usual care alone. Structured exercise, introduced 7-10 days postoperatively, consisted of a physical therapy–led exercise program comprising stretching, strengthening, and physical activity, along with behavioral change techniques to support exercise adherence. Two further appointments were offered 1 and 3 months later. Outcomes included upper limb function, as measured by the Disability of Arm, Hand, and Shoulder (DASH) questionnaire at 12 months, complications, health related quality of life, and cost effectiveness.
At 12 months, women in the exercise group showed improved upper limb function compared with those who received usual care (mean DASH 16.3 for exercise, 23.7 for usual care; adjusted mean difference 7.81, 95% confidence interval, 3.17-12.44; P = .001). Compared with the usual care group, women in the exercise group reported lower pain intensity, fewer arm disability symptoms, and better health related quality of life.
“We found that arm function, measured using the DASH scale, improved over time and found surprisingly, these differences between treatment groups persisted at 12 months,” Dr. Bruce said. “There was no increased risk of neuropathic pain or lymphedema, so we concluded that the structured exercise program introduced from the seventh postoperative day was safe. Strengthening exercises were introduced from 1 month postoperatively.”
While the authors noted that the study was limited as participants and physical therapists knew which treatment they were receiving, they stressed that the study included a larger sample size than that of previous trials, along with a long follow-up period.
“We know that some women develop late lymphedema. Our findings are based on follow-up at 12 months. We hope to undertake longer-term follow up of our patient sample in the future,” Dr. Bruce said.
The authors declared support from the UK National Institute for Health Research (NIHR) Technology Assessment Programme.
FROM THE BMJ
Children and COVID: Youngest vaccinees off to a slower start

Specific figures for children aged 5-11 years are not yet available, but CDC data show that 1.55 million children under the age of 12 years had received at least one dose of COVID-19 vaccine as of Nov. 15, of whom almost 204,000 already had been vaccinated before Nov. 2. For children aged 12-15, the first 2 weeks after approval on May 12 produced almost 2.1 million vaccine initiations, according to the CDC’s COVID Data Tracker.
That dataset reveals several other noteworthy differences between the two age groups in the 10 days after approval:
- There were over 7,000 vaccine initiations on the first day in the 12-15 group; the younger group had 32.
- The older children reached 100,000 per day in 3 days; the younger children took 8 days.
- The older group topped 200,000 vaccinations per day on six different days; the younger group didn’t get above 175,000.
Children under 12 made up 27.5% of vaccine initiations in all age groups during the 2 weeks from Nov. 2 to Nov. 15, versus 3.4% for 12- to 15-year-olds and 1.2% for 16- and 17-year-olds, the CDC said, while also reporting that 3.6% of children under age 12 had received at least one dose of the COVID vaccine, compared with 57.8% of those aged 12-15 and 64.4% of 16- to 17-year-olds.
Meanwhile, the first full week of November marked the second consecutive increase in the number of weekly child COVID cases, with 122,000 reported for Nov. 5-11. The number of new cases has now surpassed 100,000 for 14 consecutive weeks, the American Academy of Pediatrics and the Children’s Hospital Association said in their weekly COVID report. That report, which covers state health departments, has not included current information from Alabama, Nebraska, and Texas since the summer.
Regionally, the increases over the past 2 weeks were spread out among the East, the Midwest, and the West, while the decline that had been going on for several weeks in the South has largely come to a halt. The states with the highest percent increases over those 2 weeks are all in New England: Maine, New Hampshire, and Vermont, the AAP and CHA noted. In a separate report, the AAP said that Vermont has the second-highest child vaccination rate (81%) in the country, just behind Massachusetts (82%).