User login
Botulinum toxin for chronic pain: What's on the horizon?
Botulinum toxin (BoNT) was first approved by the US Food and Drug Administration (FDA) for the treatment of strabismus and blepharospasm in 1989. Since then, approved indications have expanded to include spasticity, cervical dystonia, severe axillary hyperhidrosis, bladder dysfunction, and chronic migraine headache, as well as multiple cosmetic uses.1,2 Over the course of 30 years of clinical use, BoNT has proven to be effective and safe.3,4 This has led to the expanded use of BoNT for additional medical conditions.1,2
In the review that follows, we will discuss the utility of BoNT in the treatment of headaches, spasticity, and cervical dystonia. We will then explore the evidence for emerging indications that include chronic joint pain, trigeminal neuralgia, and plantar fasciitis. But first, a brief word about how BoNT works and its safety profile.
Seven toxins, but only 2 are used for medical purposes
BoNT is naturally produced by Clostridium botulinum, an anaerobic, spore-forming bacteria.1 BoNT inhibits acetylcholine release from presynaptic vesicles at the neuromuscular junctions, which results in flaccid paralysis in peripheral skeletal musculature and autonomic nerve terminals.1,5 These effects from BoNT can last up to 3 to 6 months.1
Seven different toxins have been identified (A, B, C, D, E, F, and G), but only toxins A and B are currently used for medical purposes.5 Both have similar effects, although there are slight differences in mechanism of action. Toxin B injections are also reported to be slightly more painful. There are also differences in preparation, with some requiring reconstitution, which vary by brand. Certain types of BoNT require refrigeration, and an in-depth review of the manufacturer’s guidelines is recommended before use.
Safety and adverse effects
Although BoNT is 1 of the most lethal toxins known to humans, it has been used in clinical medicine for more than 30 years and has proven to be safe if used properly.3 Adverse effects are rare and are often location and dose dependent (200 U and higher). Immediate or acute adverse effects are usually mild and can include bruising, headache, allergic reactions, edema, skin conditions, infection, or pain at the injection site.4 Delayed adverse effects can include muscle weakness that persists throughout the 3 to 6 months of duration and is usually related to incorrect placement or unintentional spread.4
Serious adverse events are rare: there are reports of the development of botulism, generalized paralysis, dysphagia, respiratory effects, and even death in patients who had received BoNT injections.3 In a majority of cases, a direct relationship with BoNT was never established, and in most incidents reported, there were significant comorbidities that could have contributed to the adverse event.3 These events appear to be related to higher doses of BoNT, as well as possible incorrect injection placement.3
Knowledge of anatomy and correct placement of BoNT are vitally important, as they have a significant impact on the effectiveness of treatment and adverse events.3 In preventing adverse events, those administering BoNT need to be familiar with the BoNT brand being used, verify proper storage consistent with the manufacturer’s recommendations, and confirm correct dosages with proper reconstitution process.3
Continue to: BoNT is contraindicated
BoNT is contraindicated in those with a history of a previous anaphylactic reaction to BoNT. Patients with known hypersensitivity to BoNT, including those with neuromuscular junction diseases and anterior horn disorders, should be considered for other forms of treatment due to the risk of an exaggerated response. No adverse events have been recorded in regard to pregnancy and lactation, although these remain a potential contraindication.3,4,6
Taking a closer look at current indications
Headaches
Chronic migraine (CM) is defined by the International Headache Society as at least 15 days per month with headaches and 8 of those days with migraine features. BoNT has been FDA approved for treatment of CM since 2011. This was based on 2 large, double-blind, randomized, placebo-controlled trials that showed a significant reduction from baseline for headaches and migraine days, total time, and frequency of migraines.7,8
Subsequent studies have continued to show benefit for CM treatment. In a recent Cochrane systematic review and meta-analysis, it was determined that BoNT can decrease frequency of CM by 2 days per month, and it is recommended by several organizations as a treatment option for CM.9
Low-quality evidence has not shown benefit for tension-type headaches. However, further research is warranted, especially for chronic tension-type headache, which is defined as daily tension headaches.10
Spasticity
Spasticity is caused by an insult to the brain or spinal cord and can often occur after a stroke, brain or spinal cord injury, cerebral palsy, or other neurologic condition.11 BoNT was initially FDA approved in 2010 for treatment of upper limb spasticity in adults, although it had been used for treatment for spasticity for more than 20 years prior to that. It currently is approved for upper and lower spasticity in adults and recently was expanded to include pediatrics.12
Continue to: A small case series...
A small case series conducted soon after BoNT was introduced showed promising results, and subsequent meta-analyses and systematic reviews have shown positive results for use of BoNT for the management of spasticity.13 Studies have begun to focus on specific regions of the upper and lower limbs to identify optimal sites for injections.
Cervical dystonia
Cervical dystonia (CD) is the most common form of dystonia and is defined as impairment of activities of daily living due to abnormal postures of the head and neck. BoNT was approved for CD in 1999 after several pivotal randomized placebo-controlled double-blind studies showed improvement of symptoms.14 Several BoNT formulations have been given Level A classification, and can be considered a potential first-line treatment for CD.15,16 The most common adverse effects reported have been dry mouth, dysphagia, muscle weakness, and neck pain.14-16
BoNT is currently being used off-label for management of multiple types of dystonia with reported success, as research on its use for noncervical dystonia (including limb, laryngeal, oromandibular, and truncal) continues. Although there are case series and some randomized trials exploring BoNT for certain types of dystonia, most are lacking high-quality evidence from double-blind, randomized controlled trials.14-16
Exploring the evidence for emerging indications
There has been significant interest in using BoNT for management for both nociceptive and neuropathic pain symptoms.5
Nociceptive pain is the irritation and painful response to actual or potential tissue damage. It is a major component of chronic pain and is difficult to treat, with limited effective options.5,17
Continue to: Neuropathic pain
Neuropathic pain is related to abnormalities that disrupt the normal function of the nervous system. Abnormalities could be related to anatomic or structural changes that cause compression, trauma, scar tissue, or a number of other conditions that affect nerve function. These can be either central or peripheral and can be caused by multiple etiologies.
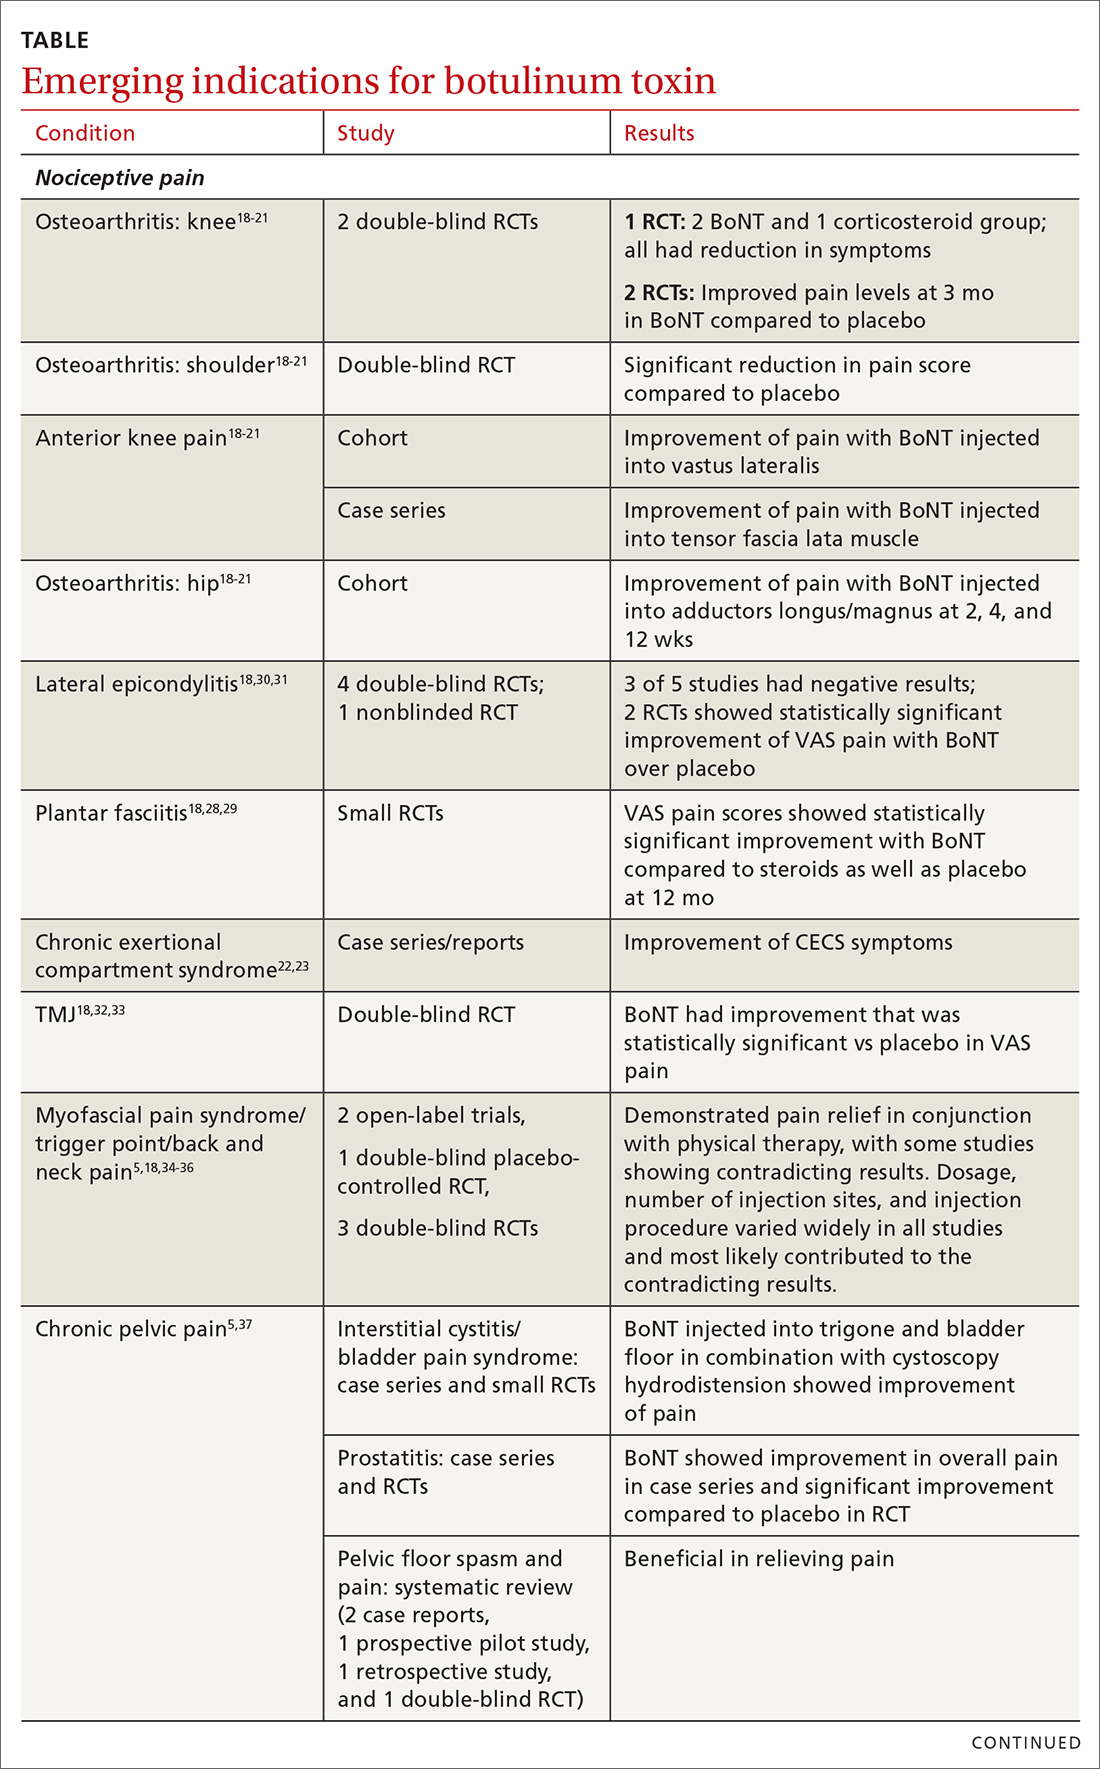
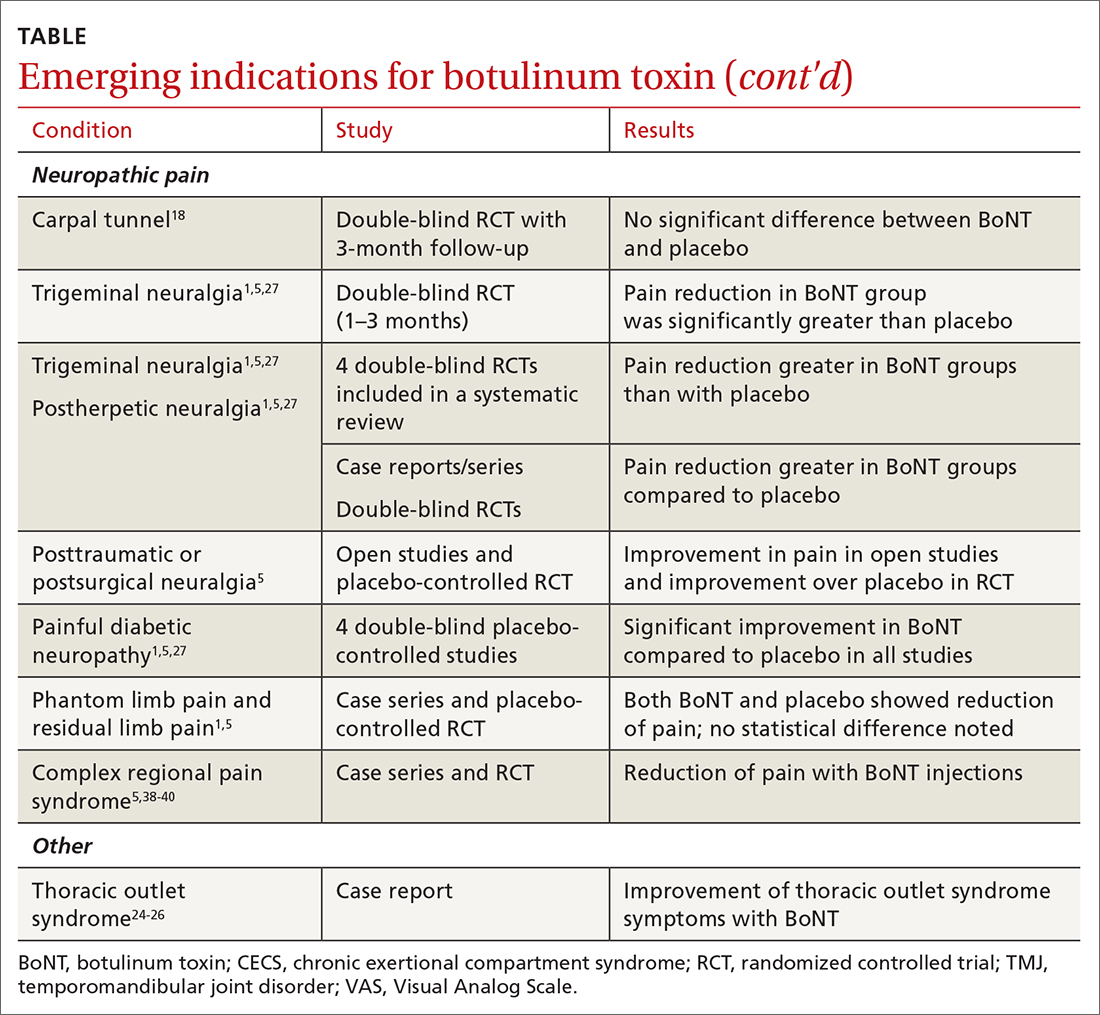
The following discussion explores the evidence for potential emerging indications for BoNT. The TABLE1,5,18-40 summarizes what we know to date.
Chronic joint pain
Refractory joint pain is difficult to treat and can be debilitating for patients. It can have multiple causes but is most commonly related to arthritic changes. Due to the difficulty with treatment, there have been attempts to use BoNT as an intra-articular treatment for refractory joint pain. Results vary and are related to several factors, including the initial degree of pain, the BoNT dosage, and the formulation used, as well as the joint injected.
There appears to be a potentially significant improvement in short-term pain with BoNT compared to conventional therapies, such as physical therapy, nonsteroidal anti-inflammatory drugs, corticosteroid injections, and hyaluronic acid injections. In studies evaluating long-term benefits, it was noted that after 6 months, there was no significant difference between BoNT and control groups.19-21
The knee joint has been the focus of most research, but BoNT has also been used for shoulder and ankle pain, with success. Recent meta-analyses evaluating knee and shoulder pain have shown BoNT is safe and effective for joint pain.20,21 There has been no significant difference noted in adverse events with BoNT compared to controls. Currently, more long-term data and research are needed, but BoNT is safe and a potentially effective treatment option for short-term relief of refractory joint pain.19-21
Continue to: Chronic exertional compartment sydrome
Chronic exertional compartment syndrome
Chronic exertional compartment syndrome (CECS) is defined subjectively as pain in a specific compartment that develops during exercise and resolves upon stopping, as well as objectively with an increase in intra-muscular pressure.22 It is most common in the lower leg and is a difficult condition to manage. Nonsurgical and surgical options are only successful at returning the patient to full activity 40% to 80% of the time.23
An initial study done in 2013 of BoNT injected into the anterior and lateral compartments of the lower extremity showed that symptoms resolved completely in 94% of patients treated.22 The actual mechanism of benefit is not clearly understood but is potentially related to muscle atrophy and loss of contractile tissue. However, it has not been reported that these changes have affected the strength or performance of patients who receive BoNT for CECS.23
Thoracic outlet syndrome
Thoracic outlet syndrome (TOS) is a compression of neurovascular structures within the thoracic outlet. There are several locations of potential compression, as well as possible neurogenic, vascular, or nonspecific manifestations.24 Compression can be from a structural variant, such as a cervical rib, or due to soft tissue from the scalene or pectoralis musculature. TOS is difficult to diagnose and treat. Physical therapy is the mainstay of treatment, but failure is common and treatment options are otherwise limited. Decompression surgery is an option if conservative management fails, but it has a high recurrence rate.24
In an effort to harness the therapeutic value of muscle atrophy, denervation, and relaxation afforded by BoNT, clinicians have injected the agent into the anterior and middle scalenes and the pectoralis minor to provide patients with relief from TOS.24 This treatment requires advanced imaging with either fluoroscopy or ultrasound guidance for correct placement and knowledge of surrounding anatomy. Small case reports and case series have demonstrated success, but a small double-blind randomized controlled study of 37 individuals with neurogenic TOS in 2011 did not show a reduction in symptoms.25 Multiple subsequent case reports and case series have continued to show positive results.24,25 A recent retrospective study showed that patients with TOS who had positive results with BoNT had better surgical outcomes.26
Trigeminal neuralgia and peripheral nerve pain
A meta-analysis in 2019 reviewed evidence for trigeminal neuralgia as well as other types of peripheral neuropathies, including diabetic neuropathy and postherpetic neuropathy. It showed that BoNT injections are safe, as well as effective, for short-term relief at 3 months. However, overall study sizes were small and long-term data are still lacking; larger high-quality studies are needed for further substantiation.27
Continue to: Plantar fascitis
Plantar fasciitis
BoNT has been used for treatment of plantar fasciitis. Small randomized controlled studies have compared BoNT to both placebo and corticosteroids, showing that BoNT has better long-term outcomes at 3, 6, and 12 months.28,29 BoNT is currently being used when standard treatments have failed; however, larger randomized controlled studies are still needed prior to BoNT being accepted as standard treatment.29
Lateral epicondylitis
A systematic review and meta-analysis done in 2017 showed that BoNT is superior to placebo at 16 weeks. No significant difference was noted between BoNT and corticosteroids at 8 weeks, although corticosteroids did demonstrate better improvement at the short-term interval of 2 to 4 weeks.30 As expected, BoNT was associated with grip-strength weakness compared to placebo and corticosteroids at 12 weeks. Subsequent small randomized controlled studies have continued to show benefit with BoNT, but all studies noted grip weakness (which resolved) and duration of effect was dose dependent.30,31
Temporomandibular joint pain
BoNT has been studied in the treatment of temporomandibular joint (TMJ) pain and dislocations since 1998, and was shown to improve quality of life.32 BoNT has been injected into the musculature surrounding the TMJ, as well as into the joint, and has proven to be effective in these areas.33 There are limited treatment options for TMJ pain and dislocations, and although research is still ongoing, BoNT is considered a potential treatment option.32,33
Myofascial, neck, and back chronic pain
Chronic back pain is common and can be due to multiple conditions. BoNT has been studied for treatment focusing on myofascial pain in the neck and back region. Case series have shown improvement with targeted BoNT injections.34 However, in randomized controlled double-blind studies comparing BoNT to placebo, local anesthetics, and steroids, there were no significant differences in pain scores.35,36 The majority of studies have been landmark based or used the site of maximal tenderness as guidance for injections, but there is some evidence that targeted injections focusing on specific muscle groups may improve benefit.5 This usually requires the use of imaging for guidance.
Chronic pelvic pain
Chronic pelvic pain is common and has been reported to affect 1 in 7 women.37 It is often difficult to diagnose the exact source of the pain, and it can be very difficult to treat. In a 2020 systematic review (including 12 observational studies and 5 randomized controlled trials) of BoNT for treatment of chronic pelvic pain, the quality of evidence varied widely.38 Observational studies showed good benefit, but only 1 randomized trial showed statistical difference with the use of BoNT for pelvic pain. No serious adverse events were reported in any of the studies.38 Chronic pelvic pain can be caused by a number of different conditions, and more high-quality research for BoNT is needed, focusing on specific causes.5,38
Continue to: Complex regional pain
Complex regional pain
Complex regional pain syndrome (CRPS) can be a debilitating condition that causes pain, sympathetic dysregulation, and central nervous system sensitization, often related to a traumatic event. Incidence is reported as 5 to 26 per 100,000, although it most likely is severely underdiagnosed.39 Treatment options are limited, and often patients continue to struggle with pain.
Due to the mechanism of action of BoNT, it has a high potential benefit for treatment of the allodynia and hyperalgesia associated with CRPS. BoNT injections have been used for the treatment of CRPS with limited success.40
There is currently limited evidence on BoNT for CRPS, and uncertainty regarding the best injection location remains. Studies have looked at lumbar sympathetic blocks, intra-articular, and grid-like BoNT injections over the area affected by CRPS.39-41 Case studies/series and observational studies have shown success with minimal adverse reactions, but larger high-quality, randomized controlled double-blind studies are still lacking.39-41
Concluding thoughts
Most chronic pain conditions have very limited treatment options, making the exploration of BoNT as a potential addition to those treatments an appealing possibility. Since it was first introduced in 1989, it has been proven to be safe, with limited adverse events, for the treatment of chronic pain.
However, providers need to be familiar with the type and formulation of BoNT product being used. Extensive knowledge of surrounding anatomy and ability to place BoNT in an exact location (which may require either fluoroscopy or ultrasound guidance) is essential.
Continue to: Adequate research and evidence...
Adequate research and evidence for most of the applications discussed in this article are still lacking; some limitations include small sample size, bias, lower quality, and poor methodology. There is also a lack of standardization, including which BoNT product is used, dosage, and location of BoNT placement. All of these issues will need to be addressed in further research.
CORRESPONDENCE
Caleb Dickison, DO, CAQSM, 36065 Darnall Loop, Fort Hood, TX 76544; [email protected]
1. Hehr JD, Schoenbrunner AR, Janis JE. The use of botulinum toxin in pain management: basic science and clinical applications. Plast Reconstr Surg. 2020;145:629e-636e. doi: 10.1097/PRS.0000000000006559
2. Dressler D. Therapeutically relevant features of botulinum toxin drugs. Toxicon. 2020;175:64-68. doi: 10.1016/j.toxicon.2019.12.005
3. Yiannakopoulou E. Serious and long-term adverse events associated with the therapeutic and cosmetic use of botulinum toxin. Pharmacology. 2015;95:65-69. doi: 10.1159/000370245
4. Wollina U, Konrad H. Managing adverse events associated with botulinum toxin type A. Am J Clin Dermatol. 2005;6:141-150. https://doi.org/10.2165/00128071-200506030-00001
5. Guzman S, Helander E, Elhassan A. Use of botulinum toxin for chronic pain management. Topics in Pain Management. 2016;31:1-8. doi: 10.1097/01.TPM.0000482997.94909.69
6. Coté TR, Mohan AK, Polder JA, et al. Botulinum toxin type A injections: adverse events reported to the US Food and Drug Administration in therapeutic and cosmetic cases. J Am Acad Dermatol. 2005;53:407‐415. doi: 10.1016/j.jaad.2005.06.011
7. Aurora SK, Dodick DW, Turkel CC, et al; PREEMPT 1 Chronic Migraine Study Group. OnabotulinumtoxinA for treatment of chronic migraine: results from the double-blind, randomized, placebo-controlled phase of the PREEMPT 1 trial. Cephalalgia. 2010;30:793-803. doi: 10.1177/0333102410364676
8. Diener HC, Dodick DW, Aurora SK, et al; PREEMPT 2 Chronic Migraine Study Group. OnabotulinumtoxinA for treatment of chronic migraine: results from the double-blind, randomized, placebo-controlled phase of the PREEMPT 2 trial. Cephalalgia. 2010Jul;30:804-814. doi: 10.1177/0333102410364677
9. Herd CP, Tomlinson CL, Rick C, et al. Cochrane systematic review and meta-analysis of botulinum toxin for the prevention of migraine. BMJ Open. 2019;9:e027953. doi: 10.1136/bmjopen-2018-027953
10. Freund B, Rao A. Efficacy of botulinum toxin in tension-type headaches: a systematic review of the literature. Pain Pract. 2019;19:541-551. doi: 10.1111/papr.12773
11. Ward A. Spasticity treatment with botulinum toxins. J Neural Transm. 2008;115:607-616. https://doi.org/10.1007/s00702-007-0833-2
12. Ipsen announces FDA approval of Dysport® (abobotulinumtoxinA) for the treatment of upper limb spasticity in children, excluding cerebral palsy [press release]. September 26, 2019. Accessed October 27, 2021. www.businesswire.com/news/home/20190926005480/en/Ipsen-Announces-FDA-Approval-Dysport%C2%AE-abobotulinumtoxinA-Treatment
13. Das TK, Park DM. Effect of treatment with botulinum toxin on spasticity. Postgrad Med J. 1989;65:208-210. doi: 10.1136/pgmj.65.762.208
14. Spiegel LL, Ostrem JL, Bledsoe IO. FDA approvals and consensus guidelines for botulinum toxins in the treatment of dystonia. Toxins (Basel). 2020;12:332. doi: 10.3390/toxins12050332
15. Castelão M, Marques RE, Duarte GS, et al. Botulinum toxin type A therapy for cervical dystonia. Cochrane Database Syst Rev. 2017;12:CD003633. doi: 10.1002/14651858.CD003633.pub3
16. Contarino MF, Van Den Dool J, Balash Y, et al. Clinical practice: evidence-based recommendations for the treatment of cervical dystonia with botulinum toxin. Front Neurol. 2017;8:35. doi: 10.3389/fneur.2017.00035
17. Kumar R. Therapeutic use of botulinum toxin in pain treatment. Neuronal Signal. 2018;2:NS20180058. https://doi.org/10.1042/NS20180058
18. Singh JA. Use of botulinum toxin in musculoskeletal pain. F1000Research. 2013;2:52. https://doi.org/10.12688/f1000research.2-52.v2
19. Blanshan N, Krug H. The use of botulinum toxin for the treatment of chronic joint pain: clinical and experimental evidence. Toxins (Basel). 2020;12:314. doi: 10.3390/toxins12050314
20. Hsu P-C, Wu W-T, Han D-S, et al. Comparative effectiveness of botulinum toxin injection for chronic shoulder pain: a meta-analysis of randomized controlled trials. Toxins (Basel). 2020;12:251. doi: 10.3390/toxins12040251
21. Zhai S, Huang B, Yu K. The efficacy and safety of botulinum toxin type A in painful knee osteoarthritis: a systematic review and meta-analysis. J Int Med Res. 2020;48:300060519895868. doi: 10.1177/0300060519895868
22. Isner-Horobeti ME, Dufour SP, Blaes C, et al. Intramuscular pressure before and after botulinum toxin in chronic exertional compartment syndrome of the leg: a preliminary study. Am J Sports Med. 2013;41:2558‐2566. doi: 10.1177/0363546513499183
23. Hutto WM, Schroeder PB, Leggit JC. Botulinum toxin as a novel treatment for chronic exertional compartment syndrome in the US Military. Mil Med. 2019;184:e458‐e461. doi: 10.1093/milmed/usy223
24. Rahman A, Hamid A, Inozemtsev K, et al. Thoracic outlet syndrome treated with injecting botulinum toxin into middle scalene muscle and pectoral muscle interfascial planes: a case report. A A Pract. 2019;12:235‐237. doi: 10.1213/XAA.0000000000000894
25. Finlayson HC, O’Connor RJ, Brasher PMA, et al. Botulinum toxin injection for management of thoracic outlet syndrome: a double-blind, randomized, controlled trial. Pain. 2011;152:2023-2028. doi: 10.1016/j.pain.2011.04.027
26. Donahue DM, Godoy IRB, Gupta R, et al. Sonographically guided botulinum toxin injections in patients with neurogenic thoracic outlet syndrome: correlation with surgical outcomes. Skeletal Radiol. 2020;49:715-722. https://doi.org/10.1007/s00256-019-03331-9
27. Wei J, Zhu X, Yang G, et al. The efficacy and safety of botulinum toxin type A in treatment of trigeminal neuralgia and peripheral neuropathic pain: a meta‐analysis of randomized controlled trials. Brain Behav. 2019;9:e01409. doi: 10.1002/brb3.1409
28. Samant PD, Kale SY, Ahmed S, et al. Randomized controlled study comparing clinical outcomes after injection botulinum toxin type A versus corticosteroids in chronic plantar fasciitis. Int J Res Orthop. 2018;4:672-675. http://dx.doi.org/10.18203/issn.2455-4510.IntJResOrthop20182744
29. Fry DA. Is botulinum toxin injection effective in reducing pain in patients diagnosed with plantar fasciitis? PCOM Physician Assistant Studies Student Scholarship. 2019;461. https://digitalcommons.pcom.edu/pa_systematic_reviews/461
30. Lin YC, Wu WT, Hsu YC, et al. Comparative effectiveness of botulinum toxin versus non-surgical treatments for treating lateral epicondylitis: a systematic review and meta-analysis. Clin Rehabil. 2018;32:131-145. doi: 10.1177/0269215517702517
31. Ruiz AG, Díaz GV, Fernández BR, et al. Effects of ultrasound-guided administration of botulinum toxin (incobotulinumtoxinA) in patients with lateral epicondylitis. Toxins (Basel). 2019;11:46. doi: 10.3390/toxins11010046
32. Villa S, Raoul G, Machuron F, et al. Improvement in quality of life after botulinum toxin injection for temporomandibular disorder. J Stomatol Oral Maxillofac Surg. 2019;120:2-6. doi: 10.1016/j.jormas.2018.10.00
33. Fu KY, Che, HM, Sun ZP, et al. Long-term efficacy of botulinum toxin type A for the treatment of habitual dislocation of the temporomandibular joint. Br J Oral Maxillofac Surg. 2010;48:281-284. doi: 10.1016/j.bjoms.2009.07.014
34. Machado D, Kumar A, Jabbari B. Abobotulinum toxin A in the treatment of chronic low back pain. Toxins (Basel). 2016;8:374. doi: 10.3390/toxins8120374
35. Cogné M, Petit H, Creuzé A, et al. Are paraspinous intramuscular injections of botulinum toxin a (BoNT-A) efficient in the treatment of chronic low-back pain? A randomised, double-blinded crossover trial. BMC Musculoskelet Disord. 2017;18:454. https://doi.org/10.1186/s12891-017-1816-6
36. Ahmed S, Subramaniam S, Sidhu K, et al. Effect of local anesthetic versus botulinum toxin-A injections for myofascial pain disorders. Clin J Pain. 2019;35:353-367. doi: 10.1097/AJP.0000000000000681
37. Mathias SD, Kuppermann M, Liberman RF, et al. Chronic pelvic pain: prevalence, health-related quality of life, and economic correlates. Obstet Gynecol. 1996;87:321-327. doi: 10.1016/0029-7844(95)00458-0
38. Luo FY, Nasr-Esfahani M, Jarrell J, et al. Botulinum toxin injection for chronic pelvic pain: a systematic review. Acta Obstet Gynecol Scand. 2020;99:1595-1602. https://doi.org/10.1111/aogs.13946
39. Lessard L, Bartow MJ, Lee J, et al. Botulinum toxin A: a novel therapeutic modality for upper extremity chronic regional pain syndrome. Plast Reconstr Surg Glob Open. 2018;6:e1847. doi: 10.1097/GOX.0000000000001847
40. Lee Y, Lee CJ, Choi E, et al. Lumbar sympathetic block with botulinum toxin type A and type B for the complex regional pain syndrome. Toxins (Basel). 2018;10:164. doi: 10.3390/toxins10040164
41. Kwak H, Koh DJ, Min K. Botulinum toxin treatment for intractable allodynia in a patient with complex regional pain syndrome: a case report. Neurology Asia. 2020;25:215-219.
Botulinum toxin (BoNT) was first approved by the US Food and Drug Administration (FDA) for the treatment of strabismus and blepharospasm in 1989. Since then, approved indications have expanded to include spasticity, cervical dystonia, severe axillary hyperhidrosis, bladder dysfunction, and chronic migraine headache, as well as multiple cosmetic uses.1,2 Over the course of 30 years of clinical use, BoNT has proven to be effective and safe.3,4 This has led to the expanded use of BoNT for additional medical conditions.1,2
In the review that follows, we will discuss the utility of BoNT in the treatment of headaches, spasticity, and cervical dystonia. We will then explore the evidence for emerging indications that include chronic joint pain, trigeminal neuralgia, and plantar fasciitis. But first, a brief word about how BoNT works and its safety profile.
Seven toxins, but only 2 are used for medical purposes
BoNT is naturally produced by Clostridium botulinum, an anaerobic, spore-forming bacteria.1 BoNT inhibits acetylcholine release from presynaptic vesicles at the neuromuscular junctions, which results in flaccid paralysis in peripheral skeletal musculature and autonomic nerve terminals.1,5 These effects from BoNT can last up to 3 to 6 months.1
Seven different toxins have been identified (A, B, C, D, E, F, and G), but only toxins A and B are currently used for medical purposes.5 Both have similar effects, although there are slight differences in mechanism of action. Toxin B injections are also reported to be slightly more painful. There are also differences in preparation, with some requiring reconstitution, which vary by brand. Certain types of BoNT require refrigeration, and an in-depth review of the manufacturer’s guidelines is recommended before use.
Safety and adverse effects
Although BoNT is 1 of the most lethal toxins known to humans, it has been used in clinical medicine for more than 30 years and has proven to be safe if used properly.3 Adverse effects are rare and are often location and dose dependent (200 U and higher). Immediate or acute adverse effects are usually mild and can include bruising, headache, allergic reactions, edema, skin conditions, infection, or pain at the injection site.4 Delayed adverse effects can include muscle weakness that persists throughout the 3 to 6 months of duration and is usually related to incorrect placement or unintentional spread.4
Serious adverse events are rare: there are reports of the development of botulism, generalized paralysis, dysphagia, respiratory effects, and even death in patients who had received BoNT injections.3 In a majority of cases, a direct relationship with BoNT was never established, and in most incidents reported, there were significant comorbidities that could have contributed to the adverse event.3 These events appear to be related to higher doses of BoNT, as well as possible incorrect injection placement.3
Knowledge of anatomy and correct placement of BoNT are vitally important, as they have a significant impact on the effectiveness of treatment and adverse events.3 In preventing adverse events, those administering BoNT need to be familiar with the BoNT brand being used, verify proper storage consistent with the manufacturer’s recommendations, and confirm correct dosages with proper reconstitution process.3
Continue to: BoNT is contraindicated
BoNT is contraindicated in those with a history of a previous anaphylactic reaction to BoNT. Patients with known hypersensitivity to BoNT, including those with neuromuscular junction diseases and anterior horn disorders, should be considered for other forms of treatment due to the risk of an exaggerated response. No adverse events have been recorded in regard to pregnancy and lactation, although these remain a potential contraindication.3,4,6
Taking a closer look at current indications
Headaches
Chronic migraine (CM) is defined by the International Headache Society as at least 15 days per month with headaches and 8 of those days with migraine features. BoNT has been FDA approved for treatment of CM since 2011. This was based on 2 large, double-blind, randomized, placebo-controlled trials that showed a significant reduction from baseline for headaches and migraine days, total time, and frequency of migraines.7,8
Subsequent studies have continued to show benefit for CM treatment. In a recent Cochrane systematic review and meta-analysis, it was determined that BoNT can decrease frequency of CM by 2 days per month, and it is recommended by several organizations as a treatment option for CM.9
Low-quality evidence has not shown benefit for tension-type headaches. However, further research is warranted, especially for chronic tension-type headache, which is defined as daily tension headaches.10
Spasticity
Spasticity is caused by an insult to the brain or spinal cord and can often occur after a stroke, brain or spinal cord injury, cerebral palsy, or other neurologic condition.11 BoNT was initially FDA approved in 2010 for treatment of upper limb spasticity in adults, although it had been used for treatment for spasticity for more than 20 years prior to that. It currently is approved for upper and lower spasticity in adults and recently was expanded to include pediatrics.12
Continue to: A small case series...
A small case series conducted soon after BoNT was introduced showed promising results, and subsequent meta-analyses and systematic reviews have shown positive results for use of BoNT for the management of spasticity.13 Studies have begun to focus on specific regions of the upper and lower limbs to identify optimal sites for injections.
Cervical dystonia
Cervical dystonia (CD) is the most common form of dystonia and is defined as impairment of activities of daily living due to abnormal postures of the head and neck. BoNT was approved for CD in 1999 after several pivotal randomized placebo-controlled double-blind studies showed improvement of symptoms.14 Several BoNT formulations have been given Level A classification, and can be considered a potential first-line treatment for CD.15,16 The most common adverse effects reported have been dry mouth, dysphagia, muscle weakness, and neck pain.14-16
BoNT is currently being used off-label for management of multiple types of dystonia with reported success, as research on its use for noncervical dystonia (including limb, laryngeal, oromandibular, and truncal) continues. Although there are case series and some randomized trials exploring BoNT for certain types of dystonia, most are lacking high-quality evidence from double-blind, randomized controlled trials.14-16
Exploring the evidence for emerging indications
There has been significant interest in using BoNT for management for both nociceptive and neuropathic pain symptoms.5
Nociceptive pain is the irritation and painful response to actual or potential tissue damage. It is a major component of chronic pain and is difficult to treat, with limited effective options.5,17
Continue to: Neuropathic pain
Neuropathic pain is related to abnormalities that disrupt the normal function of the nervous system. Abnormalities could be related to anatomic or structural changes that cause compression, trauma, scar tissue, or a number of other conditions that affect nerve function. These can be either central or peripheral and can be caused by multiple etiologies.
The following discussion explores the evidence for potential emerging indications for BoNT. The TABLE1,5,18-40 summarizes what we know to date.
Chronic joint pain
Refractory joint pain is difficult to treat and can be debilitating for patients. It can have multiple causes but is most commonly related to arthritic changes. Due to the difficulty with treatment, there have been attempts to use BoNT as an intra-articular treatment for refractory joint pain. Results vary and are related to several factors, including the initial degree of pain, the BoNT dosage, and the formulation used, as well as the joint injected.
There appears to be a potentially significant improvement in short-term pain with BoNT compared to conventional therapies, such as physical therapy, nonsteroidal anti-inflammatory drugs, corticosteroid injections, and hyaluronic acid injections. In studies evaluating long-term benefits, it was noted that after 6 months, there was no significant difference between BoNT and control groups.19-21
The knee joint has been the focus of most research, but BoNT has also been used for shoulder and ankle pain, with success. Recent meta-analyses evaluating knee and shoulder pain have shown BoNT is safe and effective for joint pain.20,21 There has been no significant difference noted in adverse events with BoNT compared to controls. Currently, more long-term data and research are needed, but BoNT is safe and a potentially effective treatment option for short-term relief of refractory joint pain.19-21
Continue to: Chronic exertional compartment sydrome
Chronic exertional compartment syndrome
Chronic exertional compartment syndrome (CECS) is defined subjectively as pain in a specific compartment that develops during exercise and resolves upon stopping, as well as objectively with an increase in intra-muscular pressure.22 It is most common in the lower leg and is a difficult condition to manage. Nonsurgical and surgical options are only successful at returning the patient to full activity 40% to 80% of the time.23
An initial study done in 2013 of BoNT injected into the anterior and lateral compartments of the lower extremity showed that symptoms resolved completely in 94% of patients treated.22 The actual mechanism of benefit is not clearly understood but is potentially related to muscle atrophy and loss of contractile tissue. However, it has not been reported that these changes have affected the strength or performance of patients who receive BoNT for CECS.23
Thoracic outlet syndrome
Thoracic outlet syndrome (TOS) is a compression of neurovascular structures within the thoracic outlet. There are several locations of potential compression, as well as possible neurogenic, vascular, or nonspecific manifestations.24 Compression can be from a structural variant, such as a cervical rib, or due to soft tissue from the scalene or pectoralis musculature. TOS is difficult to diagnose and treat. Physical therapy is the mainstay of treatment, but failure is common and treatment options are otherwise limited. Decompression surgery is an option if conservative management fails, but it has a high recurrence rate.24
In an effort to harness the therapeutic value of muscle atrophy, denervation, and relaxation afforded by BoNT, clinicians have injected the agent into the anterior and middle scalenes and the pectoralis minor to provide patients with relief from TOS.24 This treatment requires advanced imaging with either fluoroscopy or ultrasound guidance for correct placement and knowledge of surrounding anatomy. Small case reports and case series have demonstrated success, but a small double-blind randomized controlled study of 37 individuals with neurogenic TOS in 2011 did not show a reduction in symptoms.25 Multiple subsequent case reports and case series have continued to show positive results.24,25 A recent retrospective study showed that patients with TOS who had positive results with BoNT had better surgical outcomes.26
Trigeminal neuralgia and peripheral nerve pain
A meta-analysis in 2019 reviewed evidence for trigeminal neuralgia as well as other types of peripheral neuropathies, including diabetic neuropathy and postherpetic neuropathy. It showed that BoNT injections are safe, as well as effective, for short-term relief at 3 months. However, overall study sizes were small and long-term data are still lacking; larger high-quality studies are needed for further substantiation.27
Continue to: Plantar fascitis
Plantar fasciitis
BoNT has been used for treatment of plantar fasciitis. Small randomized controlled studies have compared BoNT to both placebo and corticosteroids, showing that BoNT has better long-term outcomes at 3, 6, and 12 months.28,29 BoNT is currently being used when standard treatments have failed; however, larger randomized controlled studies are still needed prior to BoNT being accepted as standard treatment.29
Lateral epicondylitis
A systematic review and meta-analysis done in 2017 showed that BoNT is superior to placebo at 16 weeks. No significant difference was noted between BoNT and corticosteroids at 8 weeks, although corticosteroids did demonstrate better improvement at the short-term interval of 2 to 4 weeks.30 As expected, BoNT was associated with grip-strength weakness compared to placebo and corticosteroids at 12 weeks. Subsequent small randomized controlled studies have continued to show benefit with BoNT, but all studies noted grip weakness (which resolved) and duration of effect was dose dependent.30,31
Temporomandibular joint pain
BoNT has been studied in the treatment of temporomandibular joint (TMJ) pain and dislocations since 1998, and was shown to improve quality of life.32 BoNT has been injected into the musculature surrounding the TMJ, as well as into the joint, and has proven to be effective in these areas.33 There are limited treatment options for TMJ pain and dislocations, and although research is still ongoing, BoNT is considered a potential treatment option.32,33
Myofascial, neck, and back chronic pain
Chronic back pain is common and can be due to multiple conditions. BoNT has been studied for treatment focusing on myofascial pain in the neck and back region. Case series have shown improvement with targeted BoNT injections.34 However, in randomized controlled double-blind studies comparing BoNT to placebo, local anesthetics, and steroids, there were no significant differences in pain scores.35,36 The majority of studies have been landmark based or used the site of maximal tenderness as guidance for injections, but there is some evidence that targeted injections focusing on specific muscle groups may improve benefit.5 This usually requires the use of imaging for guidance.
Chronic pelvic pain
Chronic pelvic pain is common and has been reported to affect 1 in 7 women.37 It is often difficult to diagnose the exact source of the pain, and it can be very difficult to treat. In a 2020 systematic review (including 12 observational studies and 5 randomized controlled trials) of BoNT for treatment of chronic pelvic pain, the quality of evidence varied widely.38 Observational studies showed good benefit, but only 1 randomized trial showed statistical difference with the use of BoNT for pelvic pain. No serious adverse events were reported in any of the studies.38 Chronic pelvic pain can be caused by a number of different conditions, and more high-quality research for BoNT is needed, focusing on specific causes.5,38
Continue to: Complex regional pain
Complex regional pain
Complex regional pain syndrome (CRPS) can be a debilitating condition that causes pain, sympathetic dysregulation, and central nervous system sensitization, often related to a traumatic event. Incidence is reported as 5 to 26 per 100,000, although it most likely is severely underdiagnosed.39 Treatment options are limited, and often patients continue to struggle with pain.
Due to the mechanism of action of BoNT, it has a high potential benefit for treatment of the allodynia and hyperalgesia associated with CRPS. BoNT injections have been used for the treatment of CRPS with limited success.40
There is currently limited evidence on BoNT for CRPS, and uncertainty regarding the best injection location remains. Studies have looked at lumbar sympathetic blocks, intra-articular, and grid-like BoNT injections over the area affected by CRPS.39-41 Case studies/series and observational studies have shown success with minimal adverse reactions, but larger high-quality, randomized controlled double-blind studies are still lacking.39-41
Concluding thoughts
Most chronic pain conditions have very limited treatment options, making the exploration of BoNT as a potential addition to those treatments an appealing possibility. Since it was first introduced in 1989, it has been proven to be safe, with limited adverse events, for the treatment of chronic pain.
However, providers need to be familiar with the type and formulation of BoNT product being used. Extensive knowledge of surrounding anatomy and ability to place BoNT in an exact location (which may require either fluoroscopy or ultrasound guidance) is essential.
Continue to: Adequate research and evidence...
Adequate research and evidence for most of the applications discussed in this article are still lacking; some limitations include small sample size, bias, lower quality, and poor methodology. There is also a lack of standardization, including which BoNT product is used, dosage, and location of BoNT placement. All of these issues will need to be addressed in further research.
CORRESPONDENCE
Caleb Dickison, DO, CAQSM, 36065 Darnall Loop, Fort Hood, TX 76544; [email protected]
1. Hehr JD, Schoenbrunner AR, Janis JE. The use of botulinum toxin in pain management: basic science and clinical applications. Plast Reconstr Surg. 2020;145:629e-636e. doi: 10.1097/PRS.0000000000006559
2. Dressler D. Therapeutically relevant features of botulinum toxin drugs. Toxicon. 2020;175:64-68. doi: 10.1016/j.toxicon.2019.12.005
3. Yiannakopoulou E. Serious and long-term adverse events associated with the therapeutic and cosmetic use of botulinum toxin. Pharmacology. 2015;95:65-69. doi: 10.1159/000370245
4. Wollina U, Konrad H. Managing adverse events associated with botulinum toxin type A. Am J Clin Dermatol. 2005;6:141-150. https://doi.org/10.2165/00128071-200506030-00001
5. Guzman S, Helander E, Elhassan A. Use of botulinum toxin for chronic pain management. Topics in Pain Management. 2016;31:1-8. doi: 10.1097/01.TPM.0000482997.94909.69
6. Coté TR, Mohan AK, Polder JA, et al. Botulinum toxin type A injections: adverse events reported to the US Food and Drug Administration in therapeutic and cosmetic cases. J Am Acad Dermatol. 2005;53:407‐415. doi: 10.1016/j.jaad.2005.06.011
7. Aurora SK, Dodick DW, Turkel CC, et al; PREEMPT 1 Chronic Migraine Study Group. OnabotulinumtoxinA for treatment of chronic migraine: results from the double-blind, randomized, placebo-controlled phase of the PREEMPT 1 trial. Cephalalgia. 2010;30:793-803. doi: 10.1177/0333102410364676
8. Diener HC, Dodick DW, Aurora SK, et al; PREEMPT 2 Chronic Migraine Study Group. OnabotulinumtoxinA for treatment of chronic migraine: results from the double-blind, randomized, placebo-controlled phase of the PREEMPT 2 trial. Cephalalgia. 2010Jul;30:804-814. doi: 10.1177/0333102410364677
9. Herd CP, Tomlinson CL, Rick C, et al. Cochrane systematic review and meta-analysis of botulinum toxin for the prevention of migraine. BMJ Open. 2019;9:e027953. doi: 10.1136/bmjopen-2018-027953
10. Freund B, Rao A. Efficacy of botulinum toxin in tension-type headaches: a systematic review of the literature. Pain Pract. 2019;19:541-551. doi: 10.1111/papr.12773
11. Ward A. Spasticity treatment with botulinum toxins. J Neural Transm. 2008;115:607-616. https://doi.org/10.1007/s00702-007-0833-2
12. Ipsen announces FDA approval of Dysport® (abobotulinumtoxinA) for the treatment of upper limb spasticity in children, excluding cerebral palsy [press release]. September 26, 2019. Accessed October 27, 2021. www.businesswire.com/news/home/20190926005480/en/Ipsen-Announces-FDA-Approval-Dysport%C2%AE-abobotulinumtoxinA-Treatment
13. Das TK, Park DM. Effect of treatment with botulinum toxin on spasticity. Postgrad Med J. 1989;65:208-210. doi: 10.1136/pgmj.65.762.208
14. Spiegel LL, Ostrem JL, Bledsoe IO. FDA approvals and consensus guidelines for botulinum toxins in the treatment of dystonia. Toxins (Basel). 2020;12:332. doi: 10.3390/toxins12050332
15. Castelão M, Marques RE, Duarte GS, et al. Botulinum toxin type A therapy for cervical dystonia. Cochrane Database Syst Rev. 2017;12:CD003633. doi: 10.1002/14651858.CD003633.pub3
16. Contarino MF, Van Den Dool J, Balash Y, et al. Clinical practice: evidence-based recommendations for the treatment of cervical dystonia with botulinum toxin. Front Neurol. 2017;8:35. doi: 10.3389/fneur.2017.00035
17. Kumar R. Therapeutic use of botulinum toxin in pain treatment. Neuronal Signal. 2018;2:NS20180058. https://doi.org/10.1042/NS20180058
18. Singh JA. Use of botulinum toxin in musculoskeletal pain. F1000Research. 2013;2:52. https://doi.org/10.12688/f1000research.2-52.v2
19. Blanshan N, Krug H. The use of botulinum toxin for the treatment of chronic joint pain: clinical and experimental evidence. Toxins (Basel). 2020;12:314. doi: 10.3390/toxins12050314
20. Hsu P-C, Wu W-T, Han D-S, et al. Comparative effectiveness of botulinum toxin injection for chronic shoulder pain: a meta-analysis of randomized controlled trials. Toxins (Basel). 2020;12:251. doi: 10.3390/toxins12040251
21. Zhai S, Huang B, Yu K. The efficacy and safety of botulinum toxin type A in painful knee osteoarthritis: a systematic review and meta-analysis. J Int Med Res. 2020;48:300060519895868. doi: 10.1177/0300060519895868
22. Isner-Horobeti ME, Dufour SP, Blaes C, et al. Intramuscular pressure before and after botulinum toxin in chronic exertional compartment syndrome of the leg: a preliminary study. Am J Sports Med. 2013;41:2558‐2566. doi: 10.1177/0363546513499183
23. Hutto WM, Schroeder PB, Leggit JC. Botulinum toxin as a novel treatment for chronic exertional compartment syndrome in the US Military. Mil Med. 2019;184:e458‐e461. doi: 10.1093/milmed/usy223
24. Rahman A, Hamid A, Inozemtsev K, et al. Thoracic outlet syndrome treated with injecting botulinum toxin into middle scalene muscle and pectoral muscle interfascial planes: a case report. A A Pract. 2019;12:235‐237. doi: 10.1213/XAA.0000000000000894
25. Finlayson HC, O’Connor RJ, Brasher PMA, et al. Botulinum toxin injection for management of thoracic outlet syndrome: a double-blind, randomized, controlled trial. Pain. 2011;152:2023-2028. doi: 10.1016/j.pain.2011.04.027
26. Donahue DM, Godoy IRB, Gupta R, et al. Sonographically guided botulinum toxin injections in patients with neurogenic thoracic outlet syndrome: correlation with surgical outcomes. Skeletal Radiol. 2020;49:715-722. https://doi.org/10.1007/s00256-019-03331-9
27. Wei J, Zhu X, Yang G, et al. The efficacy and safety of botulinum toxin type A in treatment of trigeminal neuralgia and peripheral neuropathic pain: a meta‐analysis of randomized controlled trials. Brain Behav. 2019;9:e01409. doi: 10.1002/brb3.1409
28. Samant PD, Kale SY, Ahmed S, et al. Randomized controlled study comparing clinical outcomes after injection botulinum toxin type A versus corticosteroids in chronic plantar fasciitis. Int J Res Orthop. 2018;4:672-675. http://dx.doi.org/10.18203/issn.2455-4510.IntJResOrthop20182744
29. Fry DA. Is botulinum toxin injection effective in reducing pain in patients diagnosed with plantar fasciitis? PCOM Physician Assistant Studies Student Scholarship. 2019;461. https://digitalcommons.pcom.edu/pa_systematic_reviews/461
30. Lin YC, Wu WT, Hsu YC, et al. Comparative effectiveness of botulinum toxin versus non-surgical treatments for treating lateral epicondylitis: a systematic review and meta-analysis. Clin Rehabil. 2018;32:131-145. doi: 10.1177/0269215517702517
31. Ruiz AG, Díaz GV, Fernández BR, et al. Effects of ultrasound-guided administration of botulinum toxin (incobotulinumtoxinA) in patients with lateral epicondylitis. Toxins (Basel). 2019;11:46. doi: 10.3390/toxins11010046
32. Villa S, Raoul G, Machuron F, et al. Improvement in quality of life after botulinum toxin injection for temporomandibular disorder. J Stomatol Oral Maxillofac Surg. 2019;120:2-6. doi: 10.1016/j.jormas.2018.10.00
33. Fu KY, Che, HM, Sun ZP, et al. Long-term efficacy of botulinum toxin type A for the treatment of habitual dislocation of the temporomandibular joint. Br J Oral Maxillofac Surg. 2010;48:281-284. doi: 10.1016/j.bjoms.2009.07.014
34. Machado D, Kumar A, Jabbari B. Abobotulinum toxin A in the treatment of chronic low back pain. Toxins (Basel). 2016;8:374. doi: 10.3390/toxins8120374
35. Cogné M, Petit H, Creuzé A, et al. Are paraspinous intramuscular injections of botulinum toxin a (BoNT-A) efficient in the treatment of chronic low-back pain? A randomised, double-blinded crossover trial. BMC Musculoskelet Disord. 2017;18:454. https://doi.org/10.1186/s12891-017-1816-6
36. Ahmed S, Subramaniam S, Sidhu K, et al. Effect of local anesthetic versus botulinum toxin-A injections for myofascial pain disorders. Clin J Pain. 2019;35:353-367. doi: 10.1097/AJP.0000000000000681
37. Mathias SD, Kuppermann M, Liberman RF, et al. Chronic pelvic pain: prevalence, health-related quality of life, and economic correlates. Obstet Gynecol. 1996;87:321-327. doi: 10.1016/0029-7844(95)00458-0
38. Luo FY, Nasr-Esfahani M, Jarrell J, et al. Botulinum toxin injection for chronic pelvic pain: a systematic review. Acta Obstet Gynecol Scand. 2020;99:1595-1602. https://doi.org/10.1111/aogs.13946
39. Lessard L, Bartow MJ, Lee J, et al. Botulinum toxin A: a novel therapeutic modality for upper extremity chronic regional pain syndrome. Plast Reconstr Surg Glob Open. 2018;6:e1847. doi: 10.1097/GOX.0000000000001847
40. Lee Y, Lee CJ, Choi E, et al. Lumbar sympathetic block with botulinum toxin type A and type B for the complex regional pain syndrome. Toxins (Basel). 2018;10:164. doi: 10.3390/toxins10040164
41. Kwak H, Koh DJ, Min K. Botulinum toxin treatment for intractable allodynia in a patient with complex regional pain syndrome: a case report. Neurology Asia. 2020;25:215-219.
PRACTICE RECOMMENDATIONS
› Consider botulinum toxin (BoNT) for patients with headache, spasticity, or cervical dystonia, as the FDA has approved BoNT for pain relief in these conditions. A
Strength of recommendation (SOR)
A Good-quality patient-oriented evidence
B Inconsistent or limited-quality patient-oriented evidence
C Consensus, usual practice, opinion, disease-oriented evidence, case series

AGA Clinical Care Pathway: Screening, diagnosis, and treatment of NAFLD and NASH
The American Gastroenterological Association recently published a Clinical Care Pathway for screening, diagnosis, and treatment of patients with nonalcoholic fatty liver disease (NAFLD).
Recommendations are intended for a spectrum of clinical settings, including primary care, obesity medicine, gastroenterology, hepatology, and endocrinology practices, reported lead author Fasiha Kanwal, MD, of Baylor College of Medicine, Houston, and colleagues.
“Most patients with NAFLD and NASH [nonalcoholic steatohepatitis] are seen in primary care or endocrine clinics,” the authors wrote in Gastroenterology. “Although not all patients with NAFLD/NASH require secondary (i.e., hepatology) care, not knowing which patients might benefit from such care and when to refer them results in inconsistent care processes and possibly poor outcomes. Clinical Care Pathways, with careful explication of each step in screening, diagnosis, and treatment, have been shown to improve the quality of health care delivery in other areas of medicine, [and] are crucial to addressing the often inconsistent care processes characterizing current approaches to NAFLD/NASH.”
The guidance was drafted by a group of 15 multidisciplinary experts from around the world representing the AGA, the American Diabetes Association, the American Osteopathic Association, the Obesity Society, and the Endocrine Society. Recommendations were based on available literature and clinical experience.
The authors recommended a four-step screening process for NAFLD/NASH: Check for risk factors predicting clinically relevant fibrosis (stage F2 or higher), review history and perform relevant laboratory tests, conduct noninvasive liver fibrosis testing, and measure liver stiffness.
Patients at greatest risk for clinically significant fibrosis include those with two or more metabolic risk factors, those with type 2 diabetes, and those with incidentally detected steatosis and/or elevated aminotransferases.
“A recent retrospective cohort study found that patients with hepatic steatosis and elevated alanine aminotransferase had a significantly higher risk of progression to cirrhosis or hepatocellular carcinoma than patients with hepatic steatosis and persistently normal alanine aminotransferase,” the authors noted.
When any of the above risk factors are present, the authors recommended checking the patient’s history for excessive alcohol intake, conducting a complete blood count and liver function tests, and screening for other hepatic and biliary diseases, such as chronic hepatitis C virus infection and liver mass lesions.
If other liver diseases have been ruled out, the first step in liver fibrosis risk stratification involves noninvasive testing, with the authors favoring the Fibrosis-4 (FIB-4) score “because it has been shown to have the best diagnostic accuracy for advanced fibrosis, compared with other noninvasive markers of fibrosis in patients with NAFLD.”
The next step in risk stratification involves liver stiffness measurement (LSM) with FibroScan (vibration controlled transient elastography [VCTE]), or newer modalities, such as bidimensional shear wave elastography or point shear wave elastography, which offer “diagnostic performances at least as good as VCTE.”
According to the publication, patients with NAFLD at low risk of advanced fibrosis (FIB-4 less than 1.3 or LSM less than 8 kPa or liver biopsy F0-F1) can be managed by one provider, such as a primary care provider or endocrinologist, whereas indeterminate-risk patients (FIB-4 of 1.3-2.67 and/or LSM 8-12 kPa and liver biopsy unavailable) and high-risk patients (FIB-4 greater than 2.67 or LSM greater than 12 kPa or liver biopsy F2-F4) should be managed by a multidisciplinary team led by a hepatologist.
Lifestyle intervention, weight loss (if overweight or obese), and cardiovascular disease risk reduction are advised for patients of all risk categories.
“There are no large, long-term behavioral modification or pharmacotherapy studies regarding weight loss in individuals with NAFLD,” the authors wrote. “However, weight loss of any magnitude should be encouraged as beneficial.”
For patients with indeterminate and high risk, NASH pharmacotherapy is recommended, and if needed, diabetes care should involve medications with efficacy in NASH, such as pioglitazone.
“Although we recognize that knowledge is continuing to evolve and that recommendations may change accordingly over time, we believe this Pathway provides accessible, standardized, evidence-based, timely, and testable recommendations that will allow clinicians to care for a rapidly growing population of patients, most of whom are managed in primary care or endocrine clinics,” the authors concluded.
The article was supported by the American Gastroenterological Association, Intercept Pharmaceuticals, Pfizer, and others. The authors disclosed relationships with Novo Nordisk, Eli Lilly, Sanofi, and others.
FROM GASTROENTEROLOGY
Stroke thrombectomy alone fails noninferiority to bridging tPA
In the prospective, multicenter trial, the rate of good functional outcome was 57% for patients who underwent direct thrombectomy and 65% among patients who received IV thrombolysis before undergoing thrombectomy. This result failed to demonstrate noninferiority of direct mechanical thrombectomy compared to combination therapy, the researchers conclude.
“Good outcome was high in both treatment arms, with the point estimate in favor of the bridging cohort,” said lead investigator Urs Fischer, MD, co-chair of the stroke center at Inselspital, Bern University Hospital, Switzerland, during his presentation. “Postinterventional reperfusion was very high in both treatment arms and higher in patients with bridging thrombolysis, compared to direct mechanical thrombectomy.”
The findings were presented at the 13th World Stroke Congress (WSC) 2021.
Two views of thrombolysis
The value of bridging thrombolysis for patients who undergo mechanical thrombectomy is a matter of debate. One argument is that, for patients with large-vessel occlusion, IV thrombolysis may improve reperfusion before and after thrombectomy and yield better clinical outcomes. The opposing argument is that bridging thrombolysis may increase the risk for distal emboli, delay mechanical thrombectomy, and increase the rate of hemorrhage.
The researchers conducted the SWIFT DIRECT trial to investigate this question. They enrolled patients with acute ischemic stroke due to occlusion of the internal carotid artery or the M1 segment of the middle cerebral artery.
The trial was conducted at 48 sites in seven European countries and Canada. The investigators randomly assigned patients to receive IV alteplase (0.9 mg/kg) plus mechanical thrombectomy with the Solitaire device or to receive direct mechanical thrombectomy with the same device. Treatment was open label, but the assessment of endpoints was blinded.
Investigators assigned 423 patients to treatment, and 408 were included in the full analysis set. Of this group, 201 participants received direct mechanical thrombectomy, and 207 received IV thrombolysis plus thrombectomy. There were three crossovers in each treatment arm.
The primary outcome was functional independence, defined as a Modified Rankin Scale (mRS) score of 0-2, at 90 days. Secondary outcomes included mortality at 90 days, mRS shift, change in National Institutes of Health Stroke Scale (NIHSS) score at 24 hours, successful reperfusion, and symptomatic and asymptomatic intracranial hemorrhage (ICH).
Noninferiority not demonstrated
At baseline, patient characteristics were well balanced between the treatment groups. The median age of the patients was 72 years, and about 50% of participants were women. The median NIHSS score was 17 in both arms.
Approximately 57% of patients who underwent direct thrombectomy and 65% of those who received IV thrombolysis plus thrombectomy were functionally independent at 90 days, the primary outcome.
In addition, the researchers found no difference in mRS shift, mortality at 90 days, or change in NIHSS score at 24 hours. Postinterventional reperfusion was very high in both arms and was higher in patients who received IV tissue plasminogen activator, compared with those who received direct mechanical thrombectomy, said Dr. Fischer.
The rate of successful postinterventional reperfusion, however, was higher among patients who received thrombolysis than among those who underwent direct thrombectomy. The rate of symptomatic ICH was 1.5% in the direct thrombectomy group and 4.9% in the thrombolysis-plus-thrombectomy group.
New endpoints needed?
The investigators used noninferiority margins of 12%. “This question about the noninferiority margins, that’s a very tricky and difficult one in randomized clinical trials,” said Dr. Fischer. The investigators defined their margin using the 2015 HERMES data because no trials had yet compared direct mechanical thrombectomy and bridging thrombolysis at the time.
The researchers are performing a pooled analysis of all the trials that compared bridging thrombolysis with direct mechanical thrombectomy. “We are therefore looking at several margins, and I think this is the way we should look at these noninferiority margins,” said Dr. Fischer. “There’s not a clear-cut level which you can define.”
Enrollment in the trial was well balanced with respect to gender, which is not always the case in stroke studies, said Kevin Sheth, MD, professor of neurology and neurosurgery at Yale School of Medicine, New Haven, Conn., who commented on the study for this news organization.
The findings indicate that the likelihood of there being a difference between groups on this question is low, said Dr. Sheth. Both groups had large-vessel occlusion, both received thrombectomy, and both achieved reperfusion. But the higher rate of successful reperfusion in the bridging cohort was not reflected in any of the clinical endpoints that the investigators examined.
Observing a difference in this context will require very large trials or different endpoints that are more responsive to the intervention, said Dr. Sheth. “This is going to be a challenge for not just this but for any neuroprotection trial in the future,” he said.
The study was supported by Medtronic. Dr. Fischer has served as a consultant for Medtronic, Stryker, and CSL Behring. Dr. Sheth has disclosed no relevant financial relationships.
A version of this article first appeared on Medscape.com.
FROM WSC 2021
Pandemic stresses harder on physician moms than physician dads: Study
COVID-19 has been difficult for parents trying to balance careers, home life, and keeping their loved ones safe. A new study indicates that, not only are physicians not immune to these stressors, but the long-term effects could be devastating for health care overall.

In a study published Nov. 11, 2021, in JAMA Network Open , researchers found that stresses to work/life balance and family life caused by the pandemic have differed among men and women physicians.
Physicians and other health care workers have been at the front lines of the COVID-19 pandemic, and their work lives have been the focus of a lot of attention in the media and by researchers. Their family lives, not so much. But physicians have families, and the pandemic has upended almost everything about their lives, particularly where work life and home life intersect. School and day care closures, working from home, working extra hours, or working less – all of these changes have consequences on family life and the mental health of parents who are also physicians.
Findings from a Medscape survey published in early 2021 indicate that more female physicians than male physicians were either “conflicted” or “very conflicted” as parents because of work demands (42% vs. 23%) nearly 6 months into the pandemic.
In the current study, researchers from the University of Michigan, Harvard University, and the Medical University of South Carolina teamed up to investigate gender differences in how work/family factors affected the mental health of early-career physician parents in the United States during the first year of the COVID-19 pandemic. The results suggest that the pandemic has increased gender disparity and added disproportionately to the burden of female physicians.
Managing the household falls mostly on moms
Participants were physicians enrolled in the Intern Health Study, a longitudinal study that regularly surveys medical interns in the United States to assess stress and mood. When researchers compared survey results from before the onset of the pandemic (2018) with later results (2020), they found a striking gender difference in how the pandemic has changed family and work duties for physicians.
The authors of the study pointed out that previous research had found that female physicians take on a greater share of household and childcare duties than male physicians. The current study found that their share had increased with the pandemic. Physician moms are now 30 times more likely to be in charge of these tasks than physician dads.
In families in which both parents were physicians, none of the men said they took the primary role in managing the extra demands caused by the pandemic. In addition, women were twice as likely as men to work primarily from home and to work reduced hours.
The extra stress seems to be taking a toll on women physicians. In the 2020 survey, physician mothers had higher scores for anxiety and depression symptoms, compared with men. Notably, the 2018 survey did not show a significant difference in depression scores between men and women. Nor were there significant differences in depression and anxiety scores between women and men who were not parents or in reports of work/family conflict before and after the pandemic.
In general, the results indicate that the pandemic has only widened the gender gap between women and men physicians when it comes to managing family life and dealing with the stresses of maintaining a suitable work-life balance.
‘Long-term repercussions’ for gender equity in medicine
Although these are serious problems for women physicians and their families, the effects go beyond the home and beyond individuals. Even before the pandemic, women in medicine struggled for parity in career advancement and opportunities as well as in pay, and this new setback could make those challenges even greater.
“Even short-term adjustments can have serious long-term repercussions as they may lead to lower earnings and negatively impact opportunities for promotion, further exacerbating gender inequalities in compensation and advancement,” the study’s authors wrote.
The potential damage extends to the entire profession and the health care system itself. The profession is already struggling to retain young female physicians, and this situation is likely to make that problem worse and have long-term consequences. Citing data showing that female physicians spend more time with patients and that their patients may have better outcomes, the authors wrote that the consequences of losing more early-career female physicians “could be devastating to the U.S. health care system, particularly in the context of a global pandemic and an impending physician shortage.”
The sample size was small (276 U.S. physicians), and the study relied on self-reported data. The findings suggest that more research on this topic is needed, especially research that includes other demographic factors, such as sexual orientation and ethnicity. The authors recommend that institutional and public policymakers take into account the effects of the pandemic on physician mothers to ensure that recent gains in gender equity for women physicians do not fall victim to COVID-19.
A version of this article first appeared on Medscape.com.
COVID-19 has been difficult for parents trying to balance careers, home life, and keeping their loved ones safe. A new study indicates that, not only are physicians not immune to these stressors, but the long-term effects could be devastating for health care overall.
In a study published Nov. 11, 2021, in JAMA Network Open , researchers found that stresses to work/life balance and family life caused by the pandemic have differed among men and women physicians.
Physicians and other health care workers have been at the front lines of the COVID-19 pandemic, and their work lives have been the focus of a lot of attention in the media and by researchers. Their family lives, not so much. But physicians have families, and the pandemic has upended almost everything about their lives, particularly where work life and home life intersect. School and day care closures, working from home, working extra hours, or working less – all of these changes have consequences on family life and the mental health of parents who are also physicians.
Findings from a Medscape survey published in early 2021 indicate that more female physicians than male physicians were either “conflicted” or “very conflicted” as parents because of work demands (42% vs. 23%) nearly 6 months into the pandemic.
In the current study, researchers from the University of Michigan, Harvard University, and the Medical University of South Carolina teamed up to investigate gender differences in how work/family factors affected the mental health of early-career physician parents in the United States during the first year of the COVID-19 pandemic. The results suggest that the pandemic has increased gender disparity and added disproportionately to the burden of female physicians.
Managing the household falls mostly on moms
Participants were physicians enrolled in the Intern Health Study, a longitudinal study that regularly surveys medical interns in the United States to assess stress and mood. When researchers compared survey results from before the onset of the pandemic (2018) with later results (2020), they found a striking gender difference in how the pandemic has changed family and work duties for physicians.
The authors of the study pointed out that previous research had found that female physicians take on a greater share of household and childcare duties than male physicians. The current study found that their share had increased with the pandemic. Physician moms are now 30 times more likely to be in charge of these tasks than physician dads.
In families in which both parents were physicians, none of the men said they took the primary role in managing the extra demands caused by the pandemic. In addition, women were twice as likely as men to work primarily from home and to work reduced hours.
The extra stress seems to be taking a toll on women physicians. In the 2020 survey, physician mothers had higher scores for anxiety and depression symptoms, compared with men. Notably, the 2018 survey did not show a significant difference in depression scores between men and women. Nor were there significant differences in depression and anxiety scores between women and men who were not parents or in reports of work/family conflict before and after the pandemic.
In general, the results indicate that the pandemic has only widened the gender gap between women and men physicians when it comes to managing family life and dealing with the stresses of maintaining a suitable work-life balance.
‘Long-term repercussions’ for gender equity in medicine
Although these are serious problems for women physicians and their families, the effects go beyond the home and beyond individuals. Even before the pandemic, women in medicine struggled for parity in career advancement and opportunities as well as in pay, and this new setback could make those challenges even greater.
“Even short-term adjustments can have serious long-term repercussions as they may lead to lower earnings and negatively impact opportunities for promotion, further exacerbating gender inequalities in compensation and advancement,” the study’s authors wrote.
The potential damage extends to the entire profession and the health care system itself. The profession is already struggling to retain young female physicians, and this situation is likely to make that problem worse and have long-term consequences. Citing data showing that female physicians spend more time with patients and that their patients may have better outcomes, the authors wrote that the consequences of losing more early-career female physicians “could be devastating to the U.S. health care system, particularly in the context of a global pandemic and an impending physician shortage.”
The sample size was small (276 U.S. physicians), and the study relied on self-reported data. The findings suggest that more research on this topic is needed, especially research that includes other demographic factors, such as sexual orientation and ethnicity. The authors recommend that institutional and public policymakers take into account the effects of the pandemic on physician mothers to ensure that recent gains in gender equity for women physicians do not fall victim to COVID-19.
A version of this article first appeared on Medscape.com.
Substantial declines in mortality for most cancers
according to a new analysis.
Researchers found that rates for all cancers combined declined by 27% overall between 1971 and 2019 and decreased significantly for 12 of the 15 top cancer sites analyzed.
The data revealed even greater mortality declines for certain cancers in particular years. For example, mortality from lung cancer was 44% lower in 2019, compared with its peak rate in 1993, whereas it was only 13% lower, compared with morality rates in 1971.
“The cancer mortality rate has reduced considerably since 1971 overall and for most cancer sites because of improvements in prevention, early detection, and treatment,” lead author Ahmedin Jemal, DVM, PhD, American Cancer Society, Kennesaw, Ga., and colleagues wrote.
Advances in surgery, radiotherapy, chemotherapy, precision medicine, and combinations therapies over the past 5 decades have contributed to these significant declines in mortality, Dr. Jemal and colleagues explained. The researchers also credit the “expanded investment” in the National Cancer Institute’s annual budget following the 1971 National Cancer Act, which increased the budget 25-fold from $227 million in 1971 to $6 billion in 2019.
The report, published online Nov. 11, 2021, in JAMA Oncology, analyzed mortality rates for all cancers as well as the top 15 sites using the National Center for Health Statistics.
The researchers found that, overall, deaths declined significantly for all cancers over the study period. Some of the biggest headway since 1971 occurred for stomach and cervical cancers – with 72% and 69% lower mortality rates, respectively – as well as colorectal cancer (56%), oral cavity and pharynx cancer (43%), and ovarian cancer (41%). Mortality rates of female breast cancer and prostate cancer also dropped considerably – both by 39%.
“The decline in mortality for female breast, cervical, colorectal, and prostate cancer in part reflects increased detection (and removal) of premalignant lesions and early-stage cancers,” Dr. Jemal and colleagues noted.
Data suggest that screening likely explains about half of the observed decline in mortality from colorectal cancer between 1975 and 2002. A 2018 study also found that the use of adjuvant chemotherapy was responsible for 63% of the decline in mortality from female breast cancer between 2000 and 2012.
In addition, the authors noted, “the decline in lung, oral cavity and bladder cancers largely reflects reductions in smoking because of enhanced public awareness of the health consequences, implementation of increased cigarette excise taxes, and comprehensive smoke-free laws.”
However, mortality did increase in a few categories. For instance, the mortality rate from pancreatic cancer increased by 3% between 1971 and 2019, and by 8% for both esophageal and brain cancers. Mortality rates from cancer were also greater for 29% of the U.S. counties included in the analysis, mostly those in the South.
The increase in mortality from pancreatic cancer likely reflects the growing rates of obesity in the United States, along with no real advances in pancreatic cancer prevention, early detection, or treatment, the authors suggested. In addition, lack of progress in regions of the south may be related to unequal access to improvements in treatment compared with other parts of the country.
“Improving equity through investment in the social determinants of health and implementation research is critical to furthering the national cancer-control agenda,” the authors concluded.
The authors disclosed no relevant financial relationships.
A version of this article first appeared on Medscape.com.
FROM JAMA ONCOLOGY
Multivitamins, but not cocoa, tied to slowed brain aging
, with the effects especially pronounced in patients with cardiovascular (CVD) disease, new research suggests.

In addition to testing the effect of a daily multivitamin on cognition, the COSMOS-Mind study examined the effect of cocoa flavanols, but showed no beneficial effect.
The findings “may have important public health implications, particularly for brain health, given the accessibility of multivitamins and minerals, and their low cost and safety,” said study investigator Laura D. Baker, PhD, professor, gerontology and geriatric medicine, Wake Forest University, Winston-Salem, N.C.
The findings were presented at the 14th Clinical Trials on Alzheimer’s Disease (CTAD) conference.
Placebo-controlled study
The study is a substudy of a large parent trial that compared the effects of cocoa extract (500 mg/day cocoa flavanols) and a standard multivitamin-mineral (MVM) to placebo on cardiovascular and cancer outcomes in more than 21,000 older participants.
COSMOS-Mind included 2,262 adults aged 65 and over without dementia who underwent cognitive testing at baseline and annually for 3 years. The mean age at baseline was 73 years, and 40.4% were men. Most participants (88.7%) were non-Hispanic White and almost half (49.2%) had some post-college education.
All study groups were balanced with respect to demographics, CVD history, diabetes, depression, smoking status, alcohol intake, chocolate intake, and prior multivitamin use. Baseline cognitive scores were similar between study groups. Researchers had complete data on 77% of study participants.
The primary endpoint was the effect of cocoa extract (CE) vs. placebo on Global Cognitive Function composite score. The secondary outcome was the effect of MVM vs. placebo on global cognitive function.
Additional outcomes included the impact of supplements on executive function and memory and the treatment effects for prespecified subgroups, including subjects with a history of CVD.
Using a graph of change over time, Dr. Baker showed there was no effect of cocoa on global cognitive function (effect: 0.03; 95% confidence interval, –0.02 to 0.08; P = .28). “We see the to-be-expected practice effects, but there’s no separation between the active and placebo groups,” she said.
It was a different story for MVM. Here, there was the same practice effect, but the graph showed the lines separated for global cognitive function composite score (effect: 0.07; 95% CI, 0.02-0.12; P = .007).
“We see a positive effect of multivitamins for the active group relative to placebo, peaking at 2 years and then remaining stable over time,” said Dr. Baker.
There were similar findings with MVM for the memory composite score, and the executive function composite score. “We have significance in all three, where the two lines do separate over and above the practice effects,” said Dr. Baker.
New evidence
Investigators found a baseline history of CVD, including transient ischemic attack, heart failure, coronary artery bypass graft, percutaneous transluminal coronary angioplasty, and stent, but not myocardial infarction or stroke as these were excluded in the parent trial because they affected the response to multivitamins.
As expected, those with CVD had lower cognitive scores at baseline. “But after an initial bump due to practice effect, at year 1, the cardiovascular disease history folks continue to benefit from multivitamins, whereas those who got placebo multivitamins continue to decline over time,” said Dr. Baker.
Based on information from a baseline scatter plot of cognitive function scores by age, the study’s modeling estimated the multivitamin treatment effect had a positive benefit of .028 standard deviations (SD) per year.
“Daily multivitamin-mineral supplementation appears to slow cognitive aging by 60% or by 1.8 years,” Dr. Baker added.
To date, the effect of MVM supplementation on cognition has been tested in only one large randomized clinical trial – the Physicians Health Study II. That study did not show an effect, but included only older male physicians – and cognitive testing began 2.5 years after randomization, said Dr. Baker.
“Our study provides new evidence that daily multivitamin supplementation may benefit cognitive function in older women and men, and the multivitamin effects may be more pronounced in participants with cardiovascular disease,” she noted.
For effects of multivitamins on Alzheimer’s disease prevalence and progression, “stay tuned,” Dr. Baker concluded.
Following the presentation, session cochair Suzanne Schindler, MD, PhD, instructor in the department of neurology at Washington University, St. Louis, said she and her colleagues “always check vitamin B12 levels” in patients with memory and cognitive difficulties and wondered if study subjects with a low level or deficiency of vitamin B12 benefited from the intervention.
“We are asking ourselves that as well,” said Dr. Baker.
“Some of this is a work in progress,” Dr. Baker added. “We still need to look at that more in-depth to understand whether it might be a mechanism for improvement. I think the results are still out on that topic.”
The study received support from the National Institute on Aging. Pfizer Consumer Healthcare (now GSK Consumer Healthcare) provided study pills and packaging. Dr. Baker has disclosed no relevant financial relationships.
A version of this article first appeared on Medscape.com.
, with the effects especially pronounced in patients with cardiovascular (CVD) disease, new research suggests.
In addition to testing the effect of a daily multivitamin on cognition, the COSMOS-Mind study examined the effect of cocoa flavanols, but showed no beneficial effect.
The findings “may have important public health implications, particularly for brain health, given the accessibility of multivitamins and minerals, and their low cost and safety,” said study investigator Laura D. Baker, PhD, professor, gerontology and geriatric medicine, Wake Forest University, Winston-Salem, N.C.
The findings were presented at the 14th Clinical Trials on Alzheimer’s Disease (CTAD) conference.
Placebo-controlled study
The study is a substudy of a large parent trial that compared the effects of cocoa extract (500 mg/day cocoa flavanols) and a standard multivitamin-mineral (MVM) to placebo on cardiovascular and cancer outcomes in more than 21,000 older participants.
COSMOS-Mind included 2,262 adults aged 65 and over without dementia who underwent cognitive testing at baseline and annually for 3 years. The mean age at baseline was 73 years, and 40.4% were men. Most participants (88.7%) were non-Hispanic White and almost half (49.2%) had some post-college education.
All study groups were balanced with respect to demographics, CVD history, diabetes, depression, smoking status, alcohol intake, chocolate intake, and prior multivitamin use. Baseline cognitive scores were similar between study groups. Researchers had complete data on 77% of study participants.
The primary endpoint was the effect of cocoa extract (CE) vs. placebo on Global Cognitive Function composite score. The secondary outcome was the effect of MVM vs. placebo on global cognitive function.
Additional outcomes included the impact of supplements on executive function and memory and the treatment effects for prespecified subgroups, including subjects with a history of CVD.
Using a graph of change over time, Dr. Baker showed there was no effect of cocoa on global cognitive function (effect: 0.03; 95% confidence interval, –0.02 to 0.08; P = .28). “We see the to-be-expected practice effects, but there’s no separation between the active and placebo groups,” she said.
It was a different story for MVM. Here, there was the same practice effect, but the graph showed the lines separated for global cognitive function composite score (effect: 0.07; 95% CI, 0.02-0.12; P = .007).
“We see a positive effect of multivitamins for the active group relative to placebo, peaking at 2 years and then remaining stable over time,” said Dr. Baker.
There were similar findings with MVM for the memory composite score, and the executive function composite score. “We have significance in all three, where the two lines do separate over and above the practice effects,” said Dr. Baker.
New evidence
Investigators found a baseline history of CVD, including transient ischemic attack, heart failure, coronary artery bypass graft, percutaneous transluminal coronary angioplasty, and stent, but not myocardial infarction or stroke as these were excluded in the parent trial because they affected the response to multivitamins.
As expected, those with CVD had lower cognitive scores at baseline. “But after an initial bump due to practice effect, at year 1, the cardiovascular disease history folks continue to benefit from multivitamins, whereas those who got placebo multivitamins continue to decline over time,” said Dr. Baker.
Based on information from a baseline scatter plot of cognitive function scores by age, the study’s modeling estimated the multivitamin treatment effect had a positive benefit of .028 standard deviations (SD) per year.
“Daily multivitamin-mineral supplementation appears to slow cognitive aging by 60% or by 1.8 years,” Dr. Baker added.
To date, the effect of MVM supplementation on cognition has been tested in only one large randomized clinical trial – the Physicians Health Study II. That study did not show an effect, but included only older male physicians – and cognitive testing began 2.5 years after randomization, said Dr. Baker.
“Our study provides new evidence that daily multivitamin supplementation may benefit cognitive function in older women and men, and the multivitamin effects may be more pronounced in participants with cardiovascular disease,” she noted.
For effects of multivitamins on Alzheimer’s disease prevalence and progression, “stay tuned,” Dr. Baker concluded.
Following the presentation, session cochair Suzanne Schindler, MD, PhD, instructor in the department of neurology at Washington University, St. Louis, said she and her colleagues “always check vitamin B12 levels” in patients with memory and cognitive difficulties and wondered if study subjects with a low level or deficiency of vitamin B12 benefited from the intervention.
“We are asking ourselves that as well,” said Dr. Baker.
“Some of this is a work in progress,” Dr. Baker added. “We still need to look at that more in-depth to understand whether it might be a mechanism for improvement. I think the results are still out on that topic.”
The study received support from the National Institute on Aging. Pfizer Consumer Healthcare (now GSK Consumer Healthcare) provided study pills and packaging. Dr. Baker has disclosed no relevant financial relationships.
A version of this article first appeared on Medscape.com.

More STEP data: Semaglutide cuts weight, cravings, beats liraglutide
The STEP 5 clinical trial extends favorable weight loss from 1 year out to 2 years for the glucagon-like peptide-1 (GLP-1) agonist semaglutide (Wegovy, Novo Nordisk), given as a once-weekly 2.4-mg subcutaneous injection, and some food cravings were improved in a subgroup analysis.
In another study, STEP 8, weight loss was greater at 68 weeks with semaglutide subcutaneous injection than with a 3-mg daily subcutaneous injection of another GLP-1 agonist, liraglutide (Saxenda, Novo Nordisk), approved earlier for weight loss.
Researchers presented these promising outcomes, with no new safety signals, at ObesityWeek® 2021.
However, there is more to learn about the drug class, researchers agree. Follow-up is still relatively short for a chronic disease and many patients have gastrointestinal side effects with semaglutide, one expert cautions.
The key findings were:
In STEP 5, combined with lifestyle intervention (a reduced-calorie meal plan and advice about physical activity), weekly injection of 2.4 mg semaglutide led to:
- 15.2% weight loss, compared with 2.6% weight loss with placebo at 2 years (P < .0001);
- 77% of patients losing at least 5% of their weight, compared with 34% of patients in the placebo group at 2 years (P < .0001);
- Significantly greater improvement in overall control of cravings, and craving for savory foods, in a subset of patients, versus placebo, but questionnaire scores for positive mood and craving for sweet foods were similar in both groups.
- In STEP 8, mean body weight at 68 weeks was 15.8% lower with 2.4 mg/week subcutaneous semaglutide plus lifestyle changes versus 6.4% lower with 3.0 mg/day subcutaneous liraglutide plus lifestyle changes (P < .001).
Can treat to a target weight-loss range
The undiminished weight loss efficacy in the 2-year data for STEP 5 “portends well,” said W. Timothy Garvey, MD, following his presentation of the results.

“I think this is a new era in obesity care,” said Dr. Garvey, director of the diabetes research center at the University of Alabama at Birmingham. Semaglutide “essentially doubles weight loss efficacy” compared to the other approved pharmacotherapies for obesity.
With this degree of potential weight loss, clinicians “can use weight as a biomarker and treat to a target [weight-loss] range,” he said.
Expounding on this in an interview, Dr. Garvey noted that, as stated in the 2016 American Association of Clinical Endocrinologists (AACE) and American College of Endocrinology (ACE) clinical practice guidelines for medical care of patients with obesity, of which he was lead author, “the objective of care in obesity is to increase health of patients and prevent or treat complications.”
Semaglutide “can treat to a range of weight loss of 10% to 20% in the majority of patients,” which is associated with improvements in cardiovascular and metabolic risk factors.
In STEP 5, of the 51% of patients in the semaglutide group who had prediabetes at enrollment, 80% had normal glycemia at 2 years; however, the trial was not powered nor designed to investigate this.
More data are needed to inform long-term care decisions. The ongoing SELECT cardiovascular outcomes trial of semaglutide, with expected primary study completion on Sept. 28, 2023, should provide more information.
Weight loss plus reduced cravings
In another presentation, Sean Wharton, MD, PharmD, said, “In adults with overweight or obesity, substantial weight loss with semaglutide 2.4 mg was accompanied by short- and long-term improvements in control of eating.”

“Most patients living with obesity who are attempting to decrease calories will have food cravings, based on the biological parameters of weight preservation,” Dr. Wharton, medical director at the Wharton Medical Clinic, in Hamilton, Ont., explained in an email.
The degree of craving varies from patient to patient, likely based on genetics, he added. Research in this field is still emerging.
“I believe that semaglutide 2.4 mg is a game-changer in the field of weight management, and it will change the dialogue for insurance plans and with policymakers regarding coverage for this medication,” said Dr. Wharton.
“The data from the STEP programs are very strong. I am certainly hoping for a change to bias against covering these medications that we have seen in the past,” he said.
Clinically meaningful weight loss
When presenting the STEP 8 findings, Domenica M. Rubino, MD, said: “Participants were significantly more likely to achieve clinically meaningful weight loss thresholds with semaglutide 2.4 mg versus liraglutide 3.0 mg, accompanied by greater improvements in cardiometabolic risk factors.”
For example, patients can have better mobility, which is important for quality of life, Dr. Rubino, director of the Washington Center for Weight Management and Research, Arlington, Virginia, noted.
A smaller percentage of patients respond to liraglutide, she added. Clinicians need to individualize treatment.
When asked, “How do you choose which medical therapy?” Dr. Rubino responded: “We sit and talk.” Finding the medical therapy that fits the patient depends on things such as the patient’s insurance coverage and ability to tolerate side effects such as dehydration, diarrhea, and nausea.
When asked, “How do you switch from liraglutide to semaglutide?” she noted that there are no current guidelines for this. “You have to be careful. Start on the lowest dose of Wegovy. Be cautious, conservative.”
Still early days, caveats remain
“The STEP trials as a group appear to be making the case that obesity may now be considered a medically manageable disease, based on the experience with semaglutide,” Julie R. Ingelfinger, MD, who was not involved with the research, commented in an email.

“STEP 5 and 8 may suggest that weight loss occurs and is sustainable in overweight persons without diabetes with one or more comorbidities or in obese persons without diabetes,” added Dr. Ingelfinger, professor of pediatrics, Harvard Medical School, consultant in pediatric nephrology, Massachusetts General Hospital, Boston, and deputy editor, The New England Journal of Medicine.
However, “even 2 years, in the case of STEP 5, and ~68 weeks in the case of STEP 8, may not be long enough to know whether semaglutide is as promising as these brief summaries (abstracts) suggest,” she cautioned.
“Obesity is a chronic condition, and very long-term therapy and management are required,” Dr. Ingelfinger continued.
“Further, it is hard to generalize when gastrointestinal adverse events are common in a study,” she said. For example, in STEP 8, they were just as common with semaglutide as with the comparator liraglutide, she noted.
“The racial and ethnic representativeness of these studies does not reflect population distributions in the U.S., limiting generalization,” she continued.
“So, there remain caveats in interpreting these data.”
STEP 5 weight loss efficacy and safety at 2 years
Garvey reported that STEP 5 was a phase 3b trial that randomized 304 adults in the United States, Canada, Hungary, Italy, and Spain, who were 18 years and older, with a body mass index (BMI) ≥27 kg/m2 with at least one weight-related comorbidity (hypertension, dyslipidemia, obstructive sleep apnea, or cardiovascular disease) or a BMI ≥30 kg/m2, without type 2 diabetes, to receive semaglutide or placebo plus lifestyle intervention.
Most participants were women (78%) and White (93%). On average, they were 47 years old, weighed 106 kg (223.7 pounds), had a BMI of 38.5 kg/m2, a waist circumference of 115.7 cm (45.6 inches), and an A1c of 5.7%.
A total of 87% of patients in the semaglutide group and 73% of patients in the placebo group completed the trial.
At 104 weeks, participants were more likely to lose ≥10%, ≥15%, and ≥20% of body weight with semaglutide versus placebo (61.8% vs. 13.3%, 52.1% vs. 7.0%, and 36.1% vs. 2.3%, respectively; P < .0001 for all).
Patients in the semaglutide group had greater health improvements in cardiovascular risk factors (waist circumference, systolic and diastolic blood pressure, and C-reactive protein) and metabolic risk factors (A1c, fasting plasma glucose, fasting serum insulin, and triglycerides) than those in the placebo group (P < .05 for all).
Safety and tolerability were consistent with adverse events seen with this drug class, with no new safety signals.
Control of eating questionnaire findings at 2 years in STEP 5
Dr. Wharton and colleagues assessed changes in responses to the Control of Eating questionnaire at baseline and at 20, 52, and 104 weeks in patients from the U.S. and Canada in the STEP 5 trial (88 patients in the semaglutide group and 86 patients in the placebo group).
The questionnaire consisted of 19 questions grouped into four categories: control of food cravings, craving for savory foods (salty and spicy, dairy, or starchy foods), craving for sweet foods (chocolate, sweet foods, or fruit/fruit juice), and positive mood.
At week 104, patients in the semaglutide group had significantly greater improvements in scores for craving for salty and spicy, dairy, and starchy foods, and resisting cravings.
Semaglutide versus liraglutide, 68-week efficacy and safety in STEP 8
STEP 8 randomized 338 U.S. adults without diabetes and a BMI of ≥27 kg/m2 plus one or more weight-related comorbidities or a BMI of ≥30 kg/m2 3:1 to semaglutide 2.4 mg once weekly (n = 126) or matching placebo, or 3:1 liraglutide 3.0 mg once daily (n = 127) or matching placebo, plus lifestyle intervention.
Most participants were women (78%) and were a mean age of 49, had a mean body weight of 104.5 kg, and had a mean BMI of 37.5 kg/m2.
In STEP 8, more participants achieved ≥10%, ≥15%, and ≥20% weight loss with semaglutide than with liraglutide (70.9% vs. 25.6%, 55.6% vs. 12.0%, and 38.5% vs. 6.0%, respectively; P < .001 for all odds ratios).
Semaglutide improved waist circumference, A1c, and C-reactive protein versus liraglutide (unadjusted P < .001 for all).
Gastrointestinal adverse events were reported by 84% and 83% of participants receiving semaglutide and liraglutide, respectively. Most events were mild/moderate and transient, with prevalence declining over time.
Fewer participants stopped treatment due to adverse events with semaglutide than liraglutide (3.2% vs. 12.6%).
Dr. Garvey has reported serving as a site principal investigator for multicentered clinical trials sponsored by his university and funded by Eli Lilly, Novo Nordisk, and Pfizer. Dr. Wharton has reported financial ties to Novo Nordisk, Bausch Health Canada, Eli Lily, and Boehringer Ingelheim Canada. Dr. Rubino has reported ties to Boehringer Ingelheim and AstraZeneca. Dr. Ingelfinger has reported no relevant financial relationships.
A version of this article first appeared on Medscape.com.
The STEP 5 clinical trial extends favorable weight loss from 1 year out to 2 years for the glucagon-like peptide-1 (GLP-1) agonist semaglutide (Wegovy, Novo Nordisk), given as a once-weekly 2.4-mg subcutaneous injection, and some food cravings were improved in a subgroup analysis.
In another study, STEP 8, weight loss was greater at 68 weeks with semaglutide subcutaneous injection than with a 3-mg daily subcutaneous injection of another GLP-1 agonist, liraglutide (Saxenda, Novo Nordisk), approved earlier for weight loss.
Researchers presented these promising outcomes, with no new safety signals, at ObesityWeek® 2021.
However, there is more to learn about the drug class, researchers agree. Follow-up is still relatively short for a chronic disease and many patients have gastrointestinal side effects with semaglutide, one expert cautions.
The key findings were:
In STEP 5, combined with lifestyle intervention (a reduced-calorie meal plan and advice about physical activity), weekly injection of 2.4 mg semaglutide led to:
- 15.2% weight loss, compared with 2.6% weight loss with placebo at 2 years (P < .0001);
- 77% of patients losing at least 5% of their weight, compared with 34% of patients in the placebo group at 2 years (P < .0001);
- Significantly greater improvement in overall control of cravings, and craving for savory foods, in a subset of patients, versus placebo, but questionnaire scores for positive mood and craving for sweet foods were similar in both groups.
- In STEP 8, mean body weight at 68 weeks was 15.8% lower with 2.4 mg/week subcutaneous semaglutide plus lifestyle changes versus 6.4% lower with 3.0 mg/day subcutaneous liraglutide plus lifestyle changes (P < .001).
Can treat to a target weight-loss range
The undiminished weight loss efficacy in the 2-year data for STEP 5 “portends well,” said W. Timothy Garvey, MD, following his presentation of the results.
“I think this is a new era in obesity care,” said Dr. Garvey, director of the diabetes research center at the University of Alabama at Birmingham. Semaglutide “essentially doubles weight loss efficacy” compared to the other approved pharmacotherapies for obesity.
With this degree of potential weight loss, clinicians “can use weight as a biomarker and treat to a target [weight-loss] range,” he said.
Expounding on this in an interview, Dr. Garvey noted that, as stated in the 2016 American Association of Clinical Endocrinologists (AACE) and American College of Endocrinology (ACE) clinical practice guidelines for medical care of patients with obesity, of which he was lead author, “the objective of care in obesity is to increase health of patients and prevent or treat complications.”
Semaglutide “can treat to a range of weight loss of 10% to 20% in the majority of patients,” which is associated with improvements in cardiovascular and metabolic risk factors.
In STEP 5, of the 51% of patients in the semaglutide group who had prediabetes at enrollment, 80% had normal glycemia at 2 years; however, the trial was not powered nor designed to investigate this.
More data are needed to inform long-term care decisions. The ongoing SELECT cardiovascular outcomes trial of semaglutide, with expected primary study completion on Sept. 28, 2023, should provide more information.
Weight loss plus reduced cravings
In another presentation, Sean Wharton, MD, PharmD, said, “In adults with overweight or obesity, substantial weight loss with semaglutide 2.4 mg was accompanied by short- and long-term improvements in control of eating.”
“Most patients living with obesity who are attempting to decrease calories will have food cravings, based on the biological parameters of weight preservation,” Dr. Wharton, medical director at the Wharton Medical Clinic, in Hamilton, Ont., explained in an email.
The degree of craving varies from patient to patient, likely based on genetics, he added. Research in this field is still emerging.
“I believe that semaglutide 2.4 mg is a game-changer in the field of weight management, and it will change the dialogue for insurance plans and with policymakers regarding coverage for this medication,” said Dr. Wharton.
“The data from the STEP programs are very strong. I am certainly hoping for a change to bias against covering these medications that we have seen in the past,” he said.
Clinically meaningful weight loss
When presenting the STEP 8 findings, Domenica M. Rubino, MD, said: “Participants were significantly more likely to achieve clinically meaningful weight loss thresholds with semaglutide 2.4 mg versus liraglutide 3.0 mg, accompanied by greater improvements in cardiometabolic risk factors.”
For example, patients can have better mobility, which is important for quality of life, Dr. Rubino, director of the Washington Center for Weight Management and Research, Arlington, Virginia, noted.
A smaller percentage of patients respond to liraglutide, she added. Clinicians need to individualize treatment.
When asked, “How do you choose which medical therapy?” Dr. Rubino responded: “We sit and talk.” Finding the medical therapy that fits the patient depends on things such as the patient’s insurance coverage and ability to tolerate side effects such as dehydration, diarrhea, and nausea.
When asked, “How do you switch from liraglutide to semaglutide?” she noted that there are no current guidelines for this. “You have to be careful. Start on the lowest dose of Wegovy. Be cautious, conservative.”
Still early days, caveats remain
“The STEP trials as a group appear to be making the case that obesity may now be considered a medically manageable disease, based on the experience with semaglutide,” Julie R. Ingelfinger, MD, who was not involved with the research, commented in an email.
“STEP 5 and 8 may suggest that weight loss occurs and is sustainable in overweight persons without diabetes with one or more comorbidities or in obese persons without diabetes,” added Dr. Ingelfinger, professor of pediatrics, Harvard Medical School, consultant in pediatric nephrology, Massachusetts General Hospital, Boston, and deputy editor, The New England Journal of Medicine.
However, “even 2 years, in the case of STEP 5, and ~68 weeks in the case of STEP 8, may not be long enough to know whether semaglutide is as promising as these brief summaries (abstracts) suggest,” she cautioned.
“Obesity is a chronic condition, and very long-term therapy and management are required,” Dr. Ingelfinger continued.
“Further, it is hard to generalize when gastrointestinal adverse events are common in a study,” she said. For example, in STEP 8, they were just as common with semaglutide as with the comparator liraglutide, she noted.
“The racial and ethnic representativeness of these studies does not reflect population distributions in the U.S., limiting generalization,” she continued.
“So, there remain caveats in interpreting these data.”
STEP 5 weight loss efficacy and safety at 2 years
Garvey reported that STEP 5 was a phase 3b trial that randomized 304 adults in the United States, Canada, Hungary, Italy, and Spain, who were 18 years and older, with a body mass index (BMI) ≥27 kg/m2 with at least one weight-related comorbidity (hypertension, dyslipidemia, obstructive sleep apnea, or cardiovascular disease) or a BMI ≥30 kg/m2, without type 2 diabetes, to receive semaglutide or placebo plus lifestyle intervention.
Most participants were women (78%) and White (93%). On average, they were 47 years old, weighed 106 kg (223.7 pounds), had a BMI of 38.5 kg/m2, a waist circumference of 115.7 cm (45.6 inches), and an A1c of 5.7%.
A total of 87% of patients in the semaglutide group and 73% of patients in the placebo group completed the trial.
At 104 weeks, participants were more likely to lose ≥10%, ≥15%, and ≥20% of body weight with semaglutide versus placebo (61.8% vs. 13.3%, 52.1% vs. 7.0%, and 36.1% vs. 2.3%, respectively; P < .0001 for all).
Patients in the semaglutide group had greater health improvements in cardiovascular risk factors (waist circumference, systolic and diastolic blood pressure, and C-reactive protein) and metabolic risk factors (A1c, fasting plasma glucose, fasting serum insulin, and triglycerides) than those in the placebo group (P < .05 for all).
Safety and tolerability were consistent with adverse events seen with this drug class, with no new safety signals.
Control of eating questionnaire findings at 2 years in STEP 5
Dr. Wharton and colleagues assessed changes in responses to the Control of Eating questionnaire at baseline and at 20, 52, and 104 weeks in patients from the U.S. and Canada in the STEP 5 trial (88 patients in the semaglutide group and 86 patients in the placebo group).
The questionnaire consisted of 19 questions grouped into four categories: control of food cravings, craving for savory foods (salty and spicy, dairy, or starchy foods), craving for sweet foods (chocolate, sweet foods, or fruit/fruit juice), and positive mood.
At week 104, patients in the semaglutide group had significantly greater improvements in scores for craving for salty and spicy, dairy, and starchy foods, and resisting cravings.
Semaglutide versus liraglutide, 68-week efficacy and safety in STEP 8
STEP 8 randomized 338 U.S. adults without diabetes and a BMI of ≥27 kg/m2 plus one or more weight-related comorbidities or a BMI of ≥30 kg/m2 3:1 to semaglutide 2.4 mg once weekly (n = 126) or matching placebo, or 3:1 liraglutide 3.0 mg once daily (n = 127) or matching placebo, plus lifestyle intervention.
Most participants were women (78%) and were a mean age of 49, had a mean body weight of 104.5 kg, and had a mean BMI of 37.5 kg/m2.
In STEP 8, more participants achieved ≥10%, ≥15%, and ≥20% weight loss with semaglutide than with liraglutide (70.9% vs. 25.6%, 55.6% vs. 12.0%, and 38.5% vs. 6.0%, respectively; P < .001 for all odds ratios).
Semaglutide improved waist circumference, A1c, and C-reactive protein versus liraglutide (unadjusted P < .001 for all).
Gastrointestinal adverse events were reported by 84% and 83% of participants receiving semaglutide and liraglutide, respectively. Most events were mild/moderate and transient, with prevalence declining over time.
Fewer participants stopped treatment due to adverse events with semaglutide than liraglutide (3.2% vs. 12.6%).
Dr. Garvey has reported serving as a site principal investigator for multicentered clinical trials sponsored by his university and funded by Eli Lilly, Novo Nordisk, and Pfizer. Dr. Wharton has reported financial ties to Novo Nordisk, Bausch Health Canada, Eli Lily, and Boehringer Ingelheim Canada. Dr. Rubino has reported ties to Boehringer Ingelheim and AstraZeneca. Dr. Ingelfinger has reported no relevant financial relationships.
A version of this article first appeared on Medscape.com.

New Mexico oncologist faces legal woes once again
A New Mexico oncologist has once again found himself at odds with the law.
Mohamed Aswad, MD, was still under probation for a past misdemeanor involving misbranded cancer drugs when he allegedly underdosed chemotherapy in a patient with colon cancer. The patient later died.
In a wrongful death case, a jury has awarded $2.3 million in damages to the patient’s wife. The patient, James Hoag, was diagnosed with stage IIIB colon cancer in 2015. He underwent surgery and then went for chemotherapy to Dr. Aswad, who was the only oncologist in the area.
Mr. Hoag’s attorneys alleged that
“It was statistically likely that James would beat his cancer with proper treatment,” said his lawyers during the trial, according to a report in the Albuquerque Journal.
The jury deliberated for only 4 hours, and found that negligence by Dr. Aswad was a proximate cause of the patient’s “lost chance to avoid the loss of his life and resulting damages,” and the jury further described Dr. Aswad’s actions as “wanton,” according to a verdict form filed in the case.
The form also shows that the jury decided Dr. Aswad had obtained Mr. Hoag’s informed consent as to the treatment, but still felt that negligence was a cause of Mr. Hoag’s injury and damages. The original judgment of $2.9 million in damages was subsequently reduced to $2.3 million as the jury found Mr. Hoag was 30% responsible for his injuries.
Dr. Aswad could not be reached for comment. The Albuquerque Journal reports that he plans to appeal the verdict.
Only oncologist in the county
The patient had lived in the rural community of Deming, N.M. following his retirement from a career in law enforcement in Michigan. He was diagnosed with colon cancer in 2015, underwent surgical resection, and then went to Dr. Aswad for follow-up chemotherapy.
Dr. Aswad was the only oncologist in the area. Like many other rural communities throughout the United States, this region has a severe shortage of medical specialists.
Sheila Hoag, the patient’s widow, testified during the trial that following her husband’s surgery in August 2015, which removed the tumor, his “prognosis was very good because they had caught it before it spread.” He had an estimated 5-year survival of about 69%.
However, even though Dr. Aswad followed the National Comprehensive Cancer Network (NCCN) guidelines for adjuvant chemotherapy, he did not use the proper dosing. According to trial testimony, he administered “woefully lower doses” than are recommended, and also exceeded the recommended 6-month duration of chemotherapy by more than double. In addition, Dr. Aswad also failed to adequately monitor the disease during treatment, said Hoag’s lawyers.
Aswad has denied the charges and says that he prescribed a modified regimen spread out over a longer period of time because his patient had requested it. He said that Mr. Hoag did not want to undergo chemotherapy that could cause significant side effects, and this was the reason for the altered treatment plan.
However, the chemotherapy failed to slow the cancer’s progression, and Mr. Hoag never returned to see him after November 2016.
By December 2017, Mr. Hoag had been hospitalized and was being treated by another oncologist, located in Las Cruces, 62 miles away from his home. The new oncologist administered the standard treatment, but by then his cancer had metastasized. Mr. Hoag died in 2020 at age 59.
Previous misdemeanor with misbranded drugs
At the time he was treating Mr. Hoag, Dr. Aswad was on federal probation after pleading guilty in 2014 to one misdemeanor count of the unlawful introduction of misbranded drugs into interstate commerce.
Dr. Aswad had treated cancer patients with a “misbranded” drug imported from abroad and not approved by the U.S. Food and Drug Administration (FDA). Altuzan is a form of bevacizumab that is approved for use in Turkey but not the United States. Between July 2010 and April 2012, Dr. Aswad ordered prescription cancer drugs, including Altuzan, from a Canadian company and then administered the “misbranded” drugs to his patients.
A prescription drug is considered to be “misbranded” if it is manufactured in a facility that has not been registered with the FDA for commercial distribution within the United States.
According to various media reports, Dr. Aswad paid significantly less for these drugs than he would have if had he purchased the U.S.-approved product bearing the same brand or generic name, and then billed federal programs such as Medicare for the full price. He has admitted to making just under $1.3 million in profits.
Under the terms of the plea agreement, he was sentenced to three years of probation, required to pay just under $1.3 million in restitution to Medicare and Tricare, the victims of his criminal conduct, and also to forfeit $750,000, which represented part of his net criminal proceeds, to the United States.
At the trial, Dr. Aswad denied that there was any profit motive in extending Mr. Hoag’s treatment, and in a 2019 deposition, he also denied he was under financial pressure to increase his billings because of the $2 million debt that he owed because of the misbranded drugs fine.
Allowed to resume practice
In late 2015, Dr. Aswad was essentially barred by the federal government from accepting any reimbursement from Medicaid or Medicare for a minimum of 13 years. But because of the urgent need for medical specialists, the New Mexico Human Services Department requested a waiver that would permit him to continuing treating cancer patients since he is the only oncologist in Luna County.
He is currently allowed to treat Medicaid and Medicare patients in four other medically underserved New Mexico counties.
Dr. Aswad, a graduate of the University of Aleppo, in Syria, had an internal medicine residency at Our Lady of Mercy Hospital in New York City, where he also had a fellowship in oncology and hematology. He then settled in Deming and has been licensed in New Mexico since 2003.
With the onset of the COVID-19 pandemic, which caused major disruption to healthcare services, Medicare & Medicaid Services officials requested that Dr. Aswad also be allowed to provide internal medicine services for Medicare patients in Catron and Hildalgo counties for the “duration of the Coronavirus Disease 2019 public health emergency declared by the federal government in January 2020.”
A version of this article first appeared on Medscape.com.
What to do about pandemic PTSD
When the COVID-19 pandemic engulfed the nation well over a year ago, Rebecca Hendrickson, MD, PhD, immersed herself in the shell-shocking revelations that clinicians began posting on social media. The accounts offered just a snapshot of the pandemic’s heavy psychological toll, and Dr. Hendrickson, a psychiatrist at the University of Washington in Seattle and an expert in posttraumatic stress disorder (PTSD), wanted to know more.

She and her colleagues devised a survey to assess the impact of several pandemic-related factors, including increased work hours, social distancing restrictions, and lack of adequate personal protective equipment.
What began as a survey of health care workers soon expanded in scope. Of the more than 600 survey respondents to date, health care workers account for about 60%, while the rest are first responders – police officers, firefighters, paramedics, and emergency medical technicians – and nonclinical personnel, such as security guards and office staff, in health care settings. The respondents range in age from 19 to 72, and hail from all regions of the country.
“Our findings were really striking,” Dr. Hendrickson said, “including very high rates of thoughts of suicide and thoughts of leaving one’s current field, which were both strongly linked to COVID-19–related occupational stress exposure.”
The distress stemmed from a multitude of factors. Among the most demoralizing: witnessing patients die in isolation and being stretched thin to provide optimal care for all patients amid an unrelenting onslaught of COVID-19 cases, she said. For some health care workers, living in the garage or basement – to avoid infecting family members with the virus – also wore on their psyches.
Of all health care workers in the study, more than three-quarters reported symptoms that fell within the clinical range for depression (76%) and anxiety (78%). More than 25% noted that they had lost a family member or close colleague to the virus.
Dr. Hendrickson, who works with military veterans at the VA Puget Sound Hospital System’s Mental Illness Research, Education, and Clinical Center and its PTSD outpatient clinic, hadn’t expected the experience of loss to be so pervasive. She said the sheer number of people who “crossed the threshold” into despair concerned her deeply.
Signs and symptoms of PTSD
PTSD’s prevalence among health care workers has always been variable, said Jessica Gold, MD, assistant professor and director of wellness, engagement, and outreach in the department of psychiatry at Washington University in St. Louis.

As a psychiatrist who sees health care workers in her clinical practice, Dr. Gold has noted poor baseline mental health, including depression and trauma. Significant data have pointed to a relatively higher suicide rate among physicians than among the general population. These problems have been compounded by COVID-19.
“It has been an unrelenting series of new stressors,” she said, citing lack of resources; a feeling of being unable to help; and the high frequency of risk of death to patients, family and friends, and the caregivers themselves as just as few examples. “It is very likely going to increase our baseline trauma, and honestly, I don’t know that we can predict how. To me, ”
PTSD can manifest itself in health care workers in several different ways. A few commonalities Dr. Gold has observed are sleep disruption (including insomnia and nightmares), work avoidance by taking disability or quitting, irritability or other changes in mood, trouble concentrating, and hypervigilance.
She said she has seen physical manifestations of trauma – such as body pain, stomachaches, and teeth grinding, which “you might not realize are at all related to trauma but ultimately are.” Sometimes, she added, “people have panic attacks on the way to work or right when they get to work, or are thinking about work.”
Dr. Gold noted that different types of treatment, such as cognitive-behavioral therapy and eye movement desensitization and reprocessing (EMDR), can be effective for PTSD. Medication is often necessary because of comorbid anxiety, depression, or eating disorders, said Dr. Gold, who is conducting a study on the pandemic’s effects on medical students.
The difficulties in isolating COVID-19 as a contributor
Not all researchers are convinced that a causal relationship has been established between the pandemic and worsening mental health among those in the health care sector.
With provider burnout being a long-standing concern in medicine, Ankur A. Butala, MD, assistant professor of neurology, psychiatry, and behavioral sciences at the Johns Hopkins University, Baltimore, said he remains a bit skeptical that acute stressors during the pandemic amounted to a uniquely potent driving force that can be extrapolated and quantified in a study.
“It’s hard to interpret a chronic, rolling, ongoing trauma like COVID-19 against tools or scales developed to investigate symptoms from a singular and acute trauma, like a school shooting or a [military] firefight,” Dr. Butala said.
In addition, he noted a reluctance to generalizing results from a study in which participants were recruited via social media as opposed to research methods involving more rigorous selection protocols.
Although Dr. Hendrickson acknowledged the study’s limitations, she said her team nonetheless found strong correlations between COVID-19-related stressors and self-reported struggles in completing work-related tasks, as well as increasing thoughts of leaving one’s current field. They adjusted for previous lifetime trauma exposure, age, gender, and a personal history of contracting COVID-19.
The underlying premise of the study could be confirmed with repeated surveys over time, Dr. Butala said, as the COVID-19 pandemic evolves and the vaccination effort unfolds.
Follow-up surveys are being sent to participants every 2 weeks and every 3 months to gauge their mood, for a total follow-up period of 9 months per individual. New participants are still welcome. “We will continue to enroll as long as it seems relevant,” Dr. Hendrickson said.
Carol S. North, MD, MPE, who has added to the growing research on the pandemic’s toll on mental health, noted that because symptom scales do not provide psychiatric diagnoses, it is difficult to attribute the prevalence of psychiatric disorders to the pandemic. Dr. North is chair and professor of crisis psychiatry at UT Southwestern Medical Center in Dallas, and director of the program in trauma and disaster at VA North Texas Health Care System.
The DSM-5 criteria exclude naturally occurring illness, such as a virus (even during a pandemic) as a qualifying trauma for the diagnosis of PTSD. According to current criteria by the American Psychiatric Association, COVID-19 and the pandemic are not defined as trauma, Dr. North said, while noting that “just because it’s not trauma or PTSD does not mean that the pandemic should be discounted as not stressful; people are finding it very stressful.”
Identifying the exact source of distress would still be difficult, Dr. North said, as the pandemic has produced severe economic consequences and prolonged social isolation, as well as occurring alongside nationwide protests over racial and ethnic divisions. Studies to date haven’t effectively separated out for these stressors, making it impossible to weigh their relative impact.
Furthermore, “most of us face many other stressors in our daily lives, such as grief, losses, broken relationships, and personal failures,” she said. “All of these may contribute to psychological distress, and research is needed to determine how much was a product of the virus, other aspects of the pandemic, or unrelated life stressors.”
A rallying cry for new interventions
Despite such doubts, a growing number of studies are reporting that health care workers and first responders are experiencing intensified PTSD, depression, anxiety, and insomnia as a result of the pandemic, said Hrayr Pierre Attarian, MD, professor of neurology at Northwestern University, Chicago. These results should act as a rallying cry for implementing more policies tailored to prevent burnout, he said.
“What we are seeing during this terrible pandemic is burnout on steroids,” said Dr. Attarian, medical director of Northwestern’s Center for Sleep Disorders. There are already high burnout rates, “so this should be doubly important.”
Rooting out this problem starts at the institutional level, but merely advising providers to “be well” wouldn’t make inroads. “There needs to be fluid dialogue between health care workers and the leadership,” he said.
Among his proposed remedies: Access to confidential and free mental health resources, increased administrative support, flexible hours, respect for work-life balance, and forgiveness for occasional errors that don’t result in harm.
“Sometimes even the perception that a mistake has been made is taken as proof of guilt,” Dr. Attarian said. “It is not conducive to wellness. Extra income does not replace a nurturing work environment.”
Furthermore, “as a profession, we must stop glorifying ‘overwork.’ We must stop wearing ‘lack of sleep’ as badge of honor,” he said. “Sleep is a biological imperative like self-preservation, hunger, and thirst. When we don’t sleep anxiety, pain, and depression get amplified. Our perception of distress is off, as is our judgment.”
The Federation of State Physician Health Programs provides a directory that physicians can use for referrals to confidential consultation or treatment.
Christopher Bundy, MD, MPH, executive medical director of Washington Physicians Health Program in Seattle, has been following Dr. Hendrickson’s longitudinal study with keen interest. As president of the Federation of State Physician Health Programs, he hopes to translate the findings into practice.
“Obviously, the COVID-19 pandemic has been a ‘black swan’ in terms of workforce sustainability issues,” Dr. Bundy said, citing “high rates of burnout, disillusionment, and dissatisfaction.” He sees some similarities with his former role in treating war veterans.
“The invisible wounds of combat, the psychological scars don’t really become apparent until after you’re out of the war zone,” said Dr. Bundy, clinical associate professor of psychiatry at the University of Washington.
Likewise, he expects the “emotional chickens will come home to roost as the pandemic subsides.” Until then, “people are just focused on survival, and in doing their jobs and protecting their patients.” Eventually, “their own wounds inside the pandemic will take hold.”
A version of this article first appeared on Medscape.com.
When the COVID-19 pandemic engulfed the nation well over a year ago, Rebecca Hendrickson, MD, PhD, immersed herself in the shell-shocking revelations that clinicians began posting on social media. The accounts offered just a snapshot of the pandemic’s heavy psychological toll, and Dr. Hendrickson, a psychiatrist at the University of Washington in Seattle and an expert in posttraumatic stress disorder (PTSD), wanted to know more.
She and her colleagues devised a survey to assess the impact of several pandemic-related factors, including increased work hours, social distancing restrictions, and lack of adequate personal protective equipment.
What began as a survey of health care workers soon expanded in scope. Of the more than 600 survey respondents to date, health care workers account for about 60%, while the rest are first responders – police officers, firefighters, paramedics, and emergency medical technicians – and nonclinical personnel, such as security guards and office staff, in health care settings. The respondents range in age from 19 to 72, and hail from all regions of the country.
“Our findings were really striking,” Dr. Hendrickson said, “including very high rates of thoughts of suicide and thoughts of leaving one’s current field, which were both strongly linked to COVID-19–related occupational stress exposure.”
The distress stemmed from a multitude of factors. Among the most demoralizing: witnessing patients die in isolation and being stretched thin to provide optimal care for all patients amid an unrelenting onslaught of COVID-19 cases, she said. For some health care workers, living in the garage or basement – to avoid infecting family members with the virus – also wore on their psyches.
Of all health care workers in the study, more than three-quarters reported symptoms that fell within the clinical range for depression (76%) and anxiety (78%). More than 25% noted that they had lost a family member or close colleague to the virus.
Dr. Hendrickson, who works with military veterans at the VA Puget Sound Hospital System’s Mental Illness Research, Education, and Clinical Center and its PTSD outpatient clinic, hadn’t expected the experience of loss to be so pervasive. She said the sheer number of people who “crossed the threshold” into despair concerned her deeply.
Signs and symptoms of PTSD
PTSD’s prevalence among health care workers has always been variable, said Jessica Gold, MD, assistant professor and director of wellness, engagement, and outreach in the department of psychiatry at Washington University in St. Louis.
As a psychiatrist who sees health care workers in her clinical practice, Dr. Gold has noted poor baseline mental health, including depression and trauma. Significant data have pointed to a relatively higher suicide rate among physicians than among the general population. These problems have been compounded by COVID-19.
“It has been an unrelenting series of new stressors,” she said, citing lack of resources; a feeling of being unable to help; and the high frequency of risk of death to patients, family and friends, and the caregivers themselves as just as few examples. “It is very likely going to increase our baseline trauma, and honestly, I don’t know that we can predict how. To me, ”
PTSD can manifest itself in health care workers in several different ways. A few commonalities Dr. Gold has observed are sleep disruption (including insomnia and nightmares), work avoidance by taking disability or quitting, irritability or other changes in mood, trouble concentrating, and hypervigilance.
She said she has seen physical manifestations of trauma – such as body pain, stomachaches, and teeth grinding, which “you might not realize are at all related to trauma but ultimately are.” Sometimes, she added, “people have panic attacks on the way to work or right when they get to work, or are thinking about work.”
Dr. Gold noted that different types of treatment, such as cognitive-behavioral therapy and eye movement desensitization and reprocessing (EMDR), can be effective for PTSD. Medication is often necessary because of comorbid anxiety, depression, or eating disorders, said Dr. Gold, who is conducting a study on the pandemic’s effects on medical students.
The difficulties in isolating COVID-19 as a contributor
Not all researchers are convinced that a causal relationship has been established between the pandemic and worsening mental health among those in the health care sector.
With provider burnout being a long-standing concern in medicine, Ankur A. Butala, MD, assistant professor of neurology, psychiatry, and behavioral sciences at the Johns Hopkins University, Baltimore, said he remains a bit skeptical that acute stressors during the pandemic amounted to a uniquely potent driving force that can be extrapolated and quantified in a study.
“It’s hard to interpret a chronic, rolling, ongoing trauma like COVID-19 against tools or scales developed to investigate symptoms from a singular and acute trauma, like a school shooting or a [military] firefight,” Dr. Butala said.
In addition, he noted a reluctance to generalizing results from a study in which participants were recruited via social media as opposed to research methods involving more rigorous selection protocols.
Although Dr. Hendrickson acknowledged the study’s limitations, she said her team nonetheless found strong correlations between COVID-19-related stressors and self-reported struggles in completing work-related tasks, as well as increasing thoughts of leaving one’s current field. They adjusted for previous lifetime trauma exposure, age, gender, and a personal history of contracting COVID-19.
The underlying premise of the study could be confirmed with repeated surveys over time, Dr. Butala said, as the COVID-19 pandemic evolves and the vaccination effort unfolds.
Follow-up surveys are being sent to participants every 2 weeks and every 3 months to gauge their mood, for a total follow-up period of 9 months per individual. New participants are still welcome. “We will continue to enroll as long as it seems relevant,” Dr. Hendrickson said.
Carol S. North, MD, MPE, who has added to the growing research on the pandemic’s toll on mental health, noted that because symptom scales do not provide psychiatric diagnoses, it is difficult to attribute the prevalence of psychiatric disorders to the pandemic. Dr. North is chair and professor of crisis psychiatry at UT Southwestern Medical Center in Dallas, and director of the program in trauma and disaster at VA North Texas Health Care System.
The DSM-5 criteria exclude naturally occurring illness, such as a virus (even during a pandemic) as a qualifying trauma for the diagnosis of PTSD. According to current criteria by the American Psychiatric Association, COVID-19 and the pandemic are not defined as trauma, Dr. North said, while noting that “just because it’s not trauma or PTSD does not mean that the pandemic should be discounted as not stressful; people are finding it very stressful.”
Identifying the exact source of distress would still be difficult, Dr. North said, as the pandemic has produced severe economic consequences and prolonged social isolation, as well as occurring alongside nationwide protests over racial and ethnic divisions. Studies to date haven’t effectively separated out for these stressors, making it impossible to weigh their relative impact.
Furthermore, “most of us face many other stressors in our daily lives, such as grief, losses, broken relationships, and personal failures,” she said. “All of these may contribute to psychological distress, and research is needed to determine how much was a product of the virus, other aspects of the pandemic, or unrelated life stressors.”
A rallying cry for new interventions
Despite such doubts, a growing number of studies are reporting that health care workers and first responders are experiencing intensified PTSD, depression, anxiety, and insomnia as a result of the pandemic, said Hrayr Pierre Attarian, MD, professor of neurology at Northwestern University, Chicago. These results should act as a rallying cry for implementing more policies tailored to prevent burnout, he said.
“What we are seeing during this terrible pandemic is burnout on steroids,” said Dr. Attarian, medical director of Northwestern’s Center for Sleep Disorders. There are already high burnout rates, “so this should be doubly important.”
Rooting out this problem starts at the institutional level, but merely advising providers to “be well” wouldn’t make inroads. “There needs to be fluid dialogue between health care workers and the leadership,” he said.
Among his proposed remedies: Access to confidential and free mental health resources, increased administrative support, flexible hours, respect for work-life balance, and forgiveness for occasional errors that don’t result in harm.
“Sometimes even the perception that a mistake has been made is taken as proof of guilt,” Dr. Attarian said. “It is not conducive to wellness. Extra income does not replace a nurturing work environment.”
Furthermore, “as a profession, we must stop glorifying ‘overwork.’ We must stop wearing ‘lack of sleep’ as badge of honor,” he said. “Sleep is a biological imperative like self-preservation, hunger, and thirst. When we don’t sleep anxiety, pain, and depression get amplified. Our perception of distress is off, as is our judgment.”
The Federation of State Physician Health Programs provides a directory that physicians can use for referrals to confidential consultation or treatment.
Christopher Bundy, MD, MPH, executive medical director of Washington Physicians Health Program in Seattle, has been following Dr. Hendrickson’s longitudinal study with keen interest. As president of the Federation of State Physician Health Programs, he hopes to translate the findings into practice.
“Obviously, the COVID-19 pandemic has been a ‘black swan’ in terms of workforce sustainability issues,” Dr. Bundy said, citing “high rates of burnout, disillusionment, and dissatisfaction.” He sees some similarities with his former role in treating war veterans.
“The invisible wounds of combat, the psychological scars don’t really become apparent until after you’re out of the war zone,” said Dr. Bundy, clinical associate professor of psychiatry at the University of Washington.
Likewise, he expects the “emotional chickens will come home to roost as the pandemic subsides.” Until then, “people are just focused on survival, and in doing their jobs and protecting their patients.” Eventually, “their own wounds inside the pandemic will take hold.”
A version of this article first appeared on Medscape.com.
How to meet the challenges of managing patients with IBS
Irritable bowel syndrome (IBS) continues to pose a diagnostic and therapeutic challenge to clinicians and patients—a challenge that arises from the varying manifestations of the condition, its complex pathophysiology, lack of effective treatment, and psychological consequences for patients. In this article, I explore new findings related to the pathophysiology, diagnosis, and management of IBS subtypes.
Start with the Rome IV classification of IBS
The Rome Foundation published its latest IBS classification and diagnostic criteria (known as Rome IV) in 2016.1 IBS is defined as abdominal pain that (1) has recurred, on average, ≥ 1 time per week during the past 3 months and (2) is associated with ≥ 2 of these criteria1:
- related to defecation
- associated with a change in stool frequency
- associated with a change in the appearance of stool.
Onset of symptoms should be present for 6 months before a diagnosis of IBS is made.1
IBS subtypes—constipation-predominant (IBS-C), diarrhea-predominant (IBS-D), mixed (IBS-M), and unclassified (IBS-U) (TABLE 1)1—are based on the frequency of specific stool forms, as described and illustrated in the Bristol Stool Scale (www.webmd.com/digestive-disorders/poop-chart-bristol-stool-scale).2
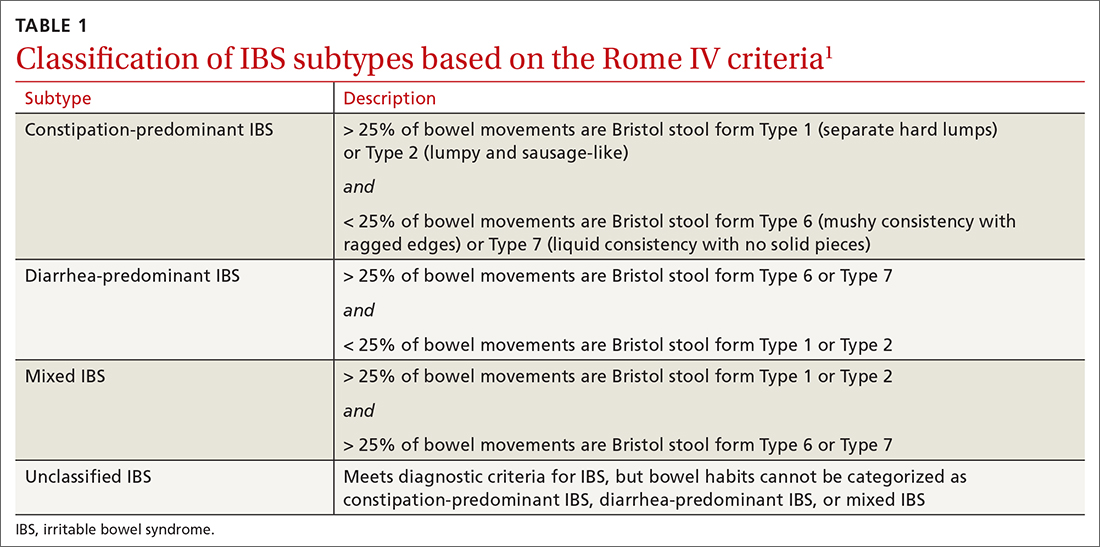
A widespread, costly, potentially debilitating disorder
IBS affects 10% to 12% of adults worldwide. The condition is more common among women and people younger than 50 years.1,3 Women with IBS tend to have more constipation symptoms (IBS-C); men with IBS, more diarrhea symptoms (IBS-D).4
The financial burden of IBS on the health care system and patients is significant. In a 2013 appraisal of 35 studies, the authors note that estimates of the direct cost of IBS care in the United States vary considerably—from $1562 to $7547 for a patient annually.5
A recent study found that almost 25% of IBS patients report absenteeism from work due to IBS symptoms.6 A Danish study that followed 7278 patients for 5 years found that IBS patients utilized more health care, sick days, and disability pension benefits than non-IBS patients, and had increased utilization of medical resources because of psychiatric conditions.7
Continue to: IBS patients also have comorbidities
IBS patients also have comorbidities:
- More than 20% of IBS patients have functional dyspepsia, gastroesophageal reflux disease, incontinence, or pelvic floor dyssynergia.4
- The frequency of fibromyalgia syndrome in IBS patients is reported to be 20% to 65%.8
- 14% of IBS patients meet criteria for chronic fatigue syndrome.8
- Interstitial cystitis and dyspareunia are common among IBS patients.9
Pathophysiology is complex
Models describing the pathophysiology of IBS have evolved through the years. Recent models describe it as a combination of altered gastrointestinal motility, visceral hyperalgesia, increased intestinal permeability, immune activation, altered intestinal microbiota, and dysfunction in the brain–gut axis. Certain environmental and psychological variables (eg, previous gastroenteritis, food intolerance, chronic stress, diverticulitis, and surgery) increase the risk of IBS.1,10,11
In the past several years, considerable attention has been paid to the roles played by the immune system, brain–gut axis function, and intestinal microbiota in IBS manifestations. Research focus in these areas might assist in the development of specific treatment modalities targeting IBS subtypes.
Immune system. A recent meta-analysis of the records of 706 IBS patients found an increased number of mast cells and CD3 T cells in biopsy specimens from the rectosigmoid and descending colon of IBS patients.12 Another study found a significant increase in mast cells in the ileum of IBS patients13; this increase is evident not only on intestinal biopsy but also at the serologic level. IBS-D patients have a higher plasma interleukin (IL)-6 level than the general population.14 Another meta-analysis found an imbalance in the serum level of tumor necrosis factor-α and IL-10 in IBS patients.15
Brain–gut axis. A 2016 meta-analysis showed that patients with anxiety and depression have a 2-fold increased risk of IBS.16 A more recent study, using data from the National Health Insurance Research Database that included 22,356 patients with IBS, found a 3.6-fold increased risk of psychiatric disorders in IBS.17 These findings reflect the complex interaction between the brain and the intestinal tract in IBS.
Continue to: Intestinal microbiota
Intestinal microbiota. Research evaluating the role of altered intestinal microbiota in IBS has yielded mixed results. A meta-analysis of 777 IBS patients showed an increase in Firmicutes spp, a decrease in Bacteroidetes spp, and an increase in the ratio of Firmicutes spp to Bacteroidetes spp in subjects’ fecal specimens.18 Another study, of 1340 patients, found no difference in Bacteroides spp and Enterococcus spp between healthy controls and IBS patients, but did find (1) lower fecal counts of Lactobacillus spp and Bifidobacterium spp and (2) higher fecal counts of Escherichia coli and Enterobacter spp in IBS patients.19
Postinfectious IBS. The Rome Foundation introduced the diagnosis of postinfectious IBS (PI-IBS) in 2019. PI-IBS develops in 10% of patients who have had infectious enteritis. Female gender, younger age, psychological distress during or before the enteritis episode, and severity of the acute episode are risk factors for this IBS variant.20 A study of 21,421 enteritis patients found that 42% with protozoal or parasitic infection and 14% with bacterial infection developed IBS.
Patients with nonviral enteritis often have a more severe course of enteritis, typically requiring antibiotics. It is believed that the resulting irregularities in the intestinal microbiota make these patients more likely to develop PI-IBS.21 PI-IBS patients are likely to improve or fully recover over time. Symptoms of PI-IBS are managed in a manner similar to how non-PI-IBS patients are managed.20
Challenges in making the IBS diagnosis
Historically, the diagnosis of IBS has been made clinically after excluding red flags (ie, signs or symptoms that might reflect other underlying medical problems) in the clinical presentation. For this reason, obtain a thorough clinical history that includes the course of symptoms, triggers, and alleviating factors. Any of the following are considered red flags1,22,23:
- age > 50 years at onset of symptoms
- new-onset constipation in the elderly
- rectal bleeding
- unexplained weight loss or anemia
- family history of organic gastrointestinal disease
- palpable abdominal or rectal mass
- nocturnal symptoms.
New studies demonstrate that several inflammatory markers can help exclude inflammatory bowel disease from the differential diagnosis in patients in whom IBS is suspected and being investigated.24 In 2019, the American Gastroenterological Association published a clinical practice guideline updating the laboratory evaluation of functional diarrhea and IBS-D in adults,25 and made several recommendations:
- Obtain the level of fecal calprotectin (normal level, ≤ 50 mcg/g) or fecal lactoferrin (≤ 4.0-7.25 mcg/g); if these tests are not available or results are not accessible, the C-reactive protein level is a reasonable option.
- Do not routinely use the erythrocyte sedimentation rate or C-reactive protein level to screen for inflammatory bowel disease.
- Test for Giardia lamblia with an antigen or polymerase chain reaction test.
- Do not test for ova and parasites (other than Giardia) in patients who do not have a history of travel or who have not emigrated from a high-risk area recently.
- Obtain testing for celiac disease with immunoglobulin A (IgA) tissue transglutaminase and with a second test, of immunoglobulin G (IgG) tissue transglutaminase and IgG or IgA deaminated gliadin peptides, to detect celiac disease in IgA-deficient patients.
- Order testing for bile-acid diarrhea with selenium homotaurocholic acid nuclear medicine scanning (if available in your region; the test is available in Europe); measurement of bile acid from a 48-hour stool collection; or an assay of fibroblast growth factor 19, which measures defective feedback of bile-acid synthesis. If these tests are unavailable, consider an empiric trial of a bile-acid binder.
- Do not use available serologic IBS testing.
Continue to: Continue to obtain a...
Continue to obtain a complete blood count for the evaluation of anemia. Endoscopic procedures are indicated in patients with a red flag.1
Treat based on subtype
The first step in the treatment of all IBS patients (TABLE 21,3,4,9,26,27) is for you to develop a strong relationship with the patient: You must acknowledge the disease and empower the patient to manage their symptoms. A strong physician–patient relationship leads to more effective outcomes.4
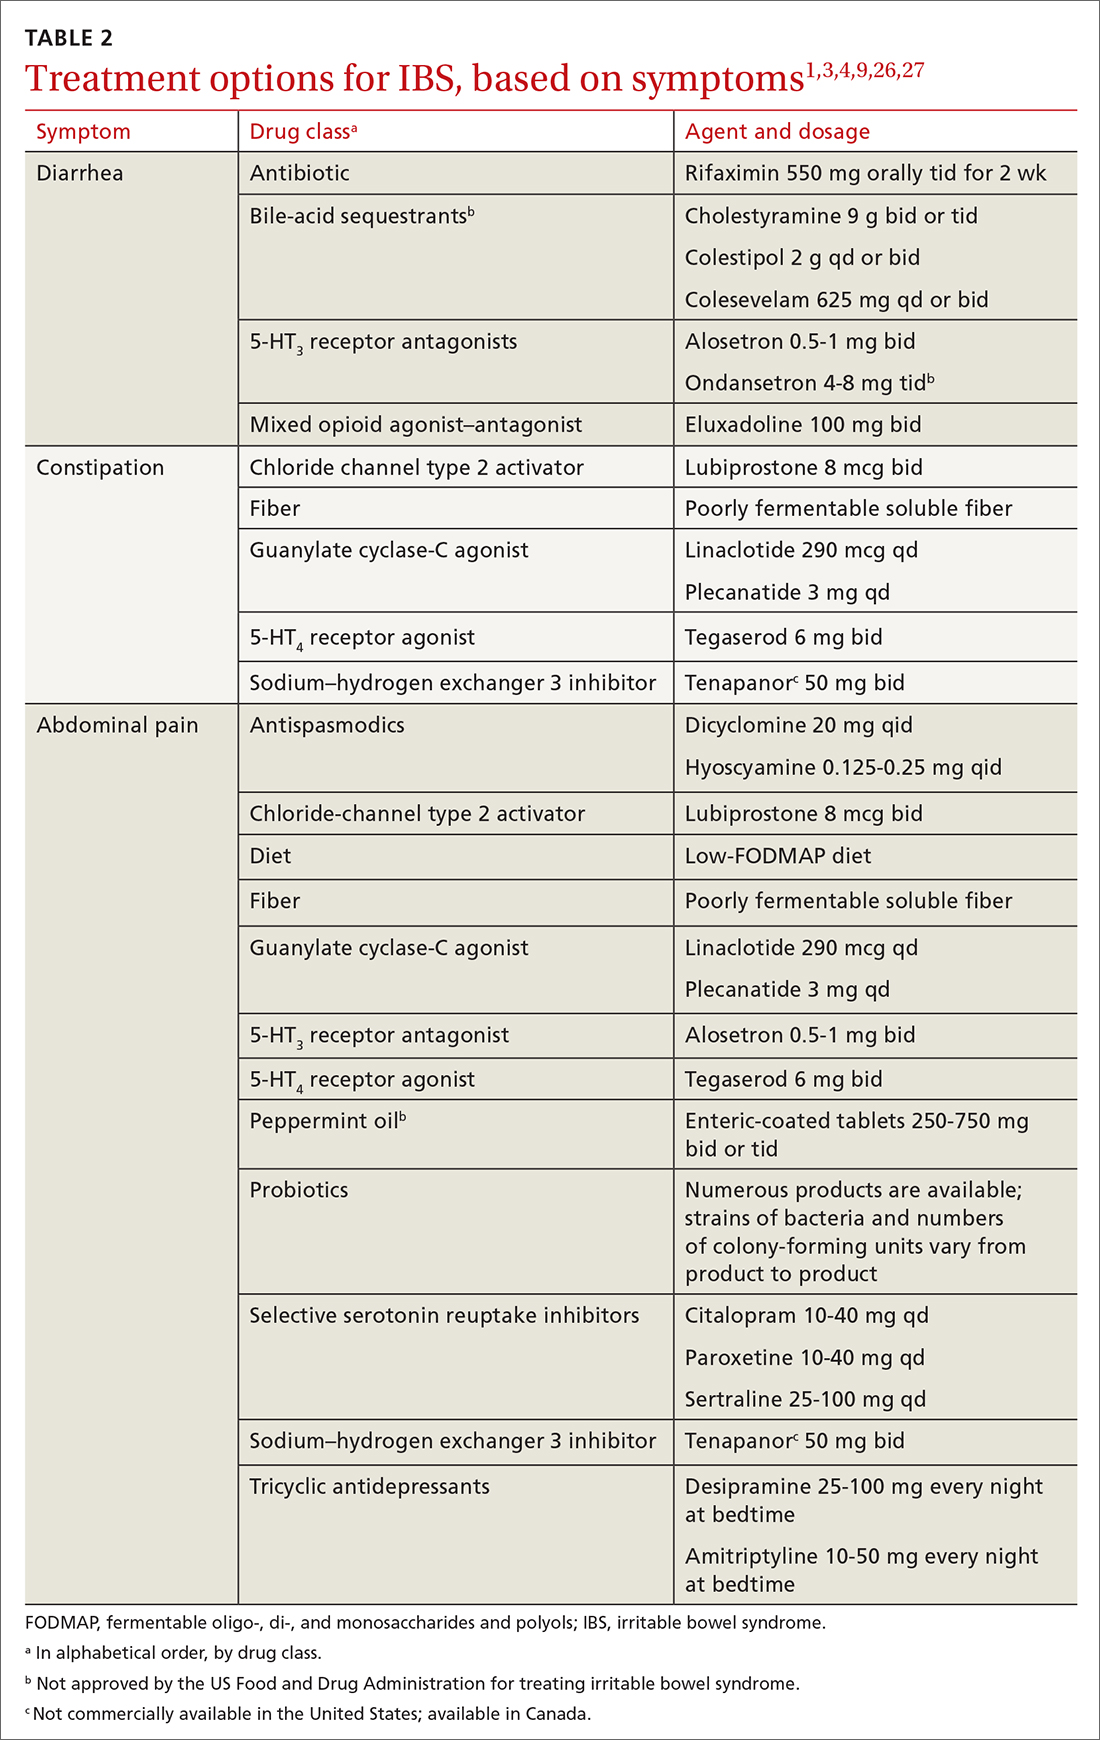
IBS treatment modalities target abdominal pain, bloating, abdominal distention, and altered bowel function—described in the literature as global symptoms. IBS-M patients should direct their treatment to the predominant symptom (constipation or diarrhea). The following sections describe available treatment options. The FIGURE1,3,4,9,25 shows a treatment workflow based on IBS subtype and symptom severity.
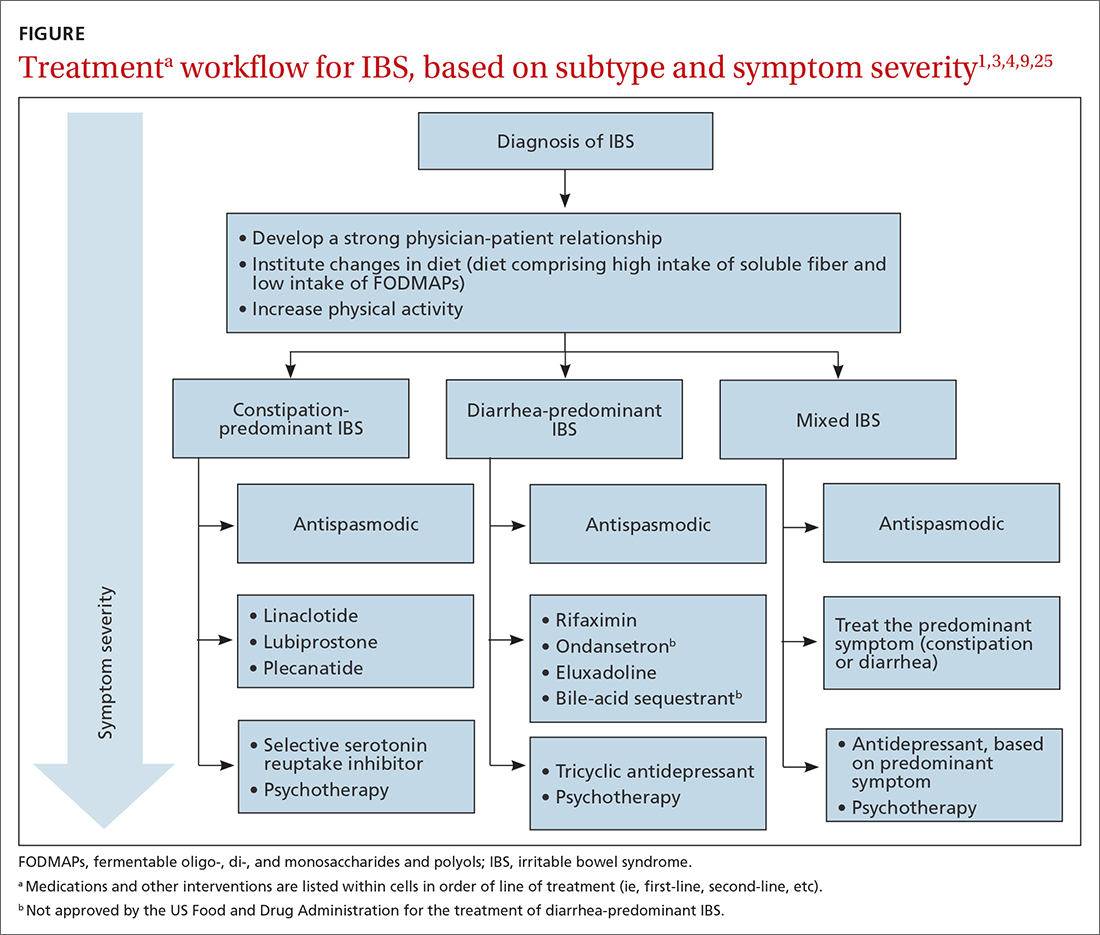
Treatments for all IBS subtypes
Lifestyle modification. Exercise provides overall positive health benefits. With such a variety of exercise forms, however, it is difficult to identify specific exercises that are better for IBS patients.28 A study of 305 IBS patients found that exercise alleviated constipation but not other IBS symptoms, and did not improve quality of life.3 Based on low cost and low risk of adverse effects, exercise should be recommended to all IBS patients.
Dietary restriction therapies have become an area of focus for patients, clinicians, and researchers. Modification of the diet is thought to improve global symptoms and intestinal health through modification of gut microbiota, immune activation, and a decrease in levels of fecal short-chain fatty acids.29
Continue to: The 2 main diets...
The 2 main diets studied for the treatment of IBS are a diet low in fermentable oligo-, di- and monosaccharides and polyols—the so-called low-FODMAP diet (TABLE 330)—and a gluten-free diet. Evidence behind the benefits of both diets conflicts; trials of the low-FODMAP diet are more favorable.
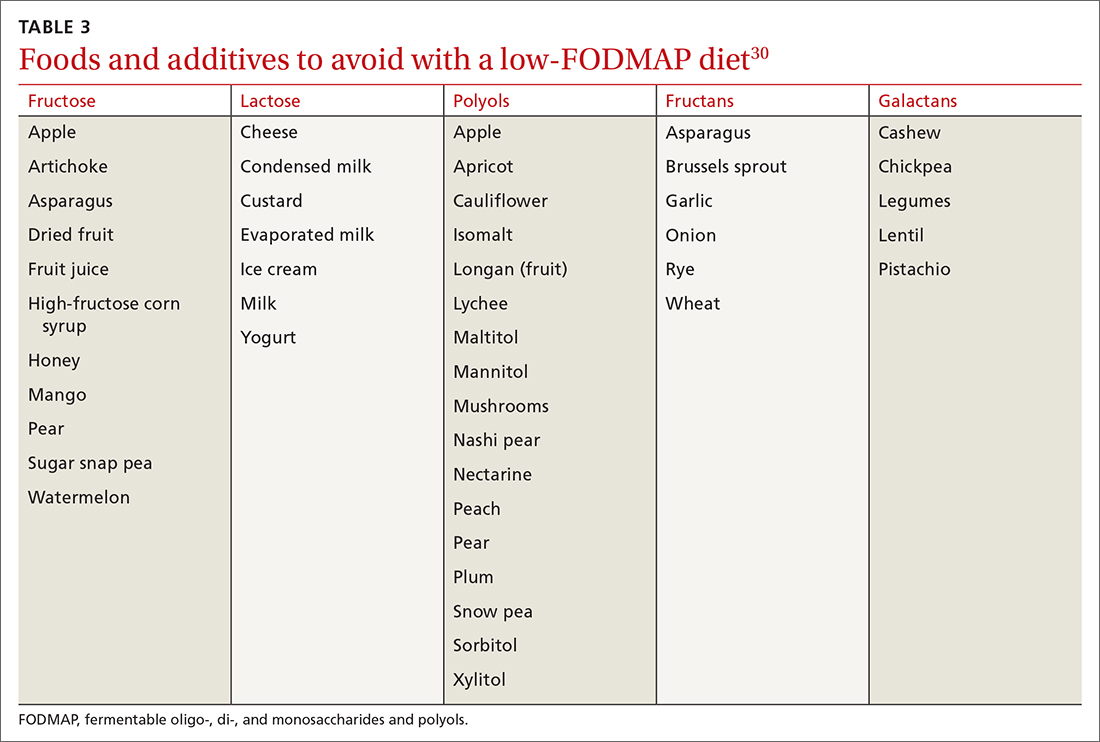
A small study with 20 patients with IBS-D and IBS-M who followed a low-FODMAP diet found improvement in IBS symptoms and a reduction in serum levels of proinflammatory cytokines, fecal bacteria, and total fecal short-chain fatty acid levels.29 Several meta-analyses have shown improvement in overall IBS symptoms for patients who follow a low-FODMAP diet. Because of the heterogeneity of the studies, however, the quality of the data is low.31-34
Data supporting the use of a gluten-free diet for IBS patients are insufficient.31
The American College of Gastroenterology (ACG) gave a weak recommendation for the low-FODMAP diet and recommended against the gluten-free diet in IBS patients.3 More data are needed regarding the safety profile of using a low-FODMAP diet for an extended period: There is concern about the risk of nutritional deficiencies associated with long-term use of this diet.3
Supplementation with poorly fermentable soluble fiber has been shown to alleviate global IBS symptoms; insoluble fiber does not yield improvement of symptoms. Psyllium fiber is recommended over wheat bran.3,35
Continue to: Consider a low-FODMAP diet...
Consider a low-FODMAP diet and soluble fiber as initial treatment for all IBS patients.
Modification of intestinal microbiota. Understanding the difference between prebiotics and probiotics is important when considering treatment for IBS. Prebiotics are foods or dietary supplements that generate changes in the composition and activity of intestinal microbiota. Probiotics are live microorganisms that can improve intestinal health.3
A meta-analysis of 729 IBS patients found that prebiotics do not reduce gastrointestinal symptoms or improve the quality of life of IBS patients.36 Evidence supporting the benefit of probiotics is favorable; however, data in these studies have significant heterogeneity. Several meta-analyses studied the benefits of Lactobacillus spp and Bifidobacterium spp in alleviating IBS symptoms. The studies found improvement in abdominal pain, bloating and distention, and flatulence.3,37-40 Consider recommending probiotics for all IBS patients; for some, however, the high cost of some of these products might be an obstacle.
Researchers are also studying the use of fecal microbiota transplantation (FMT) to treat IBS. Studies have evaluated the delivery of FMT orally (as capsules) and endoscopically. Evidence does not show improvement in global IBS symptoms with FMT. More studies, with larger sample populations, are needed.41-43
Antispasmodic medications and peppermint oil. Antispasmodic medications have been considered a mainstay therapy for IBS because of their effect on intestinal dysmotility. Hyoscine and dicyclomine are commonly used. Meta-analyses have shown improvement in global symptoms and abdominal pain, but effects were modest.3,44 Use this class of drugs as first-line treatment for mild IBS symptoms.
Continue to: Peppermint oil has been...
Peppermint oil has been found useful in improving IBS global symptoms and abdominal pain in several studies.44-46 A common adverse effect of peppermint oil is heartburn, resulting from relaxation of esophageal muscle.3 Peppermint oil can be considered an adjuvant agent in treating IBS.
Antidepressants. Tricyclic antidepressants (TCAs) and selective serotonin reuptake inhibitors (SSRIs) have been studied for the treatment of IBS. Meta-analyses show that both are effective in reducing pain and overall IBS symptoms.1,3,47 The number needed to treat (NNT) for TCAs is 4.5; for SSRIs, 5.47 Data do not show that either drug class is superior to the other for IBS. Based on the adverse effect profile, TCAs are more suitable for IBS-D patients; SSRIs are better for IBS-C patients.47
New data show that serotonin-norepinephrine reuptake inhibitors, such as duloxetine and milnacipran, can alleviate IBS symptoms through their pain-modifying properties.47
Based on the adverse effect profile and stigma associated with antidepressant medications, patients might be less likely to take them for IBS symptoms than for these drugs’ primary indications. Clinicians should still consider this drug class if other first-line treatments do not provide full resolution of symptoms.
Psychotherapy. Several psychotherapeutic modalities have been evaluated for efficacy in reducing global IBS symptoms. The approaches studied most often were provider-directed cognitive behavioral therapy, relaxation therapy, hypnotherapy, and multicomponent psychological therapy. The NNT for these modalities is 4, but studies had significant heterogeneity.3 Consider referring patients for psychotherapeutic intervention if they have not responded to medical therapy after 12 months.4
Continue to Treatment of IBS-C
Treatment of IBS-C
Prosecretory agents. Linaclotide and plecanatide are amino-acid peptides that act as a guanylate cyclase C agonist. Both increase gastrointestinal transit rate by increasing electrolyte and fluid transport into the intestinal lumen. They also decrease the activity of pain-sensing nerves by increasing extracellular cyclic guanosine-3'5'-monophosphate levels.3,48 In a recent meta-analysis, both treatments produced improvement in global symptoms. However, linaclotide showed superior improvement in abdominal pain and global symptoms compared to other secretory agents.48,49 Diarrhea was the most common adverse effect of linaclotide and plecanatide, although less so with plecanatide.49
Lubiprostone activates the intestinal chloride channel type 2 on the small intestine, leading to an increase in chloride and water efflux into the intestinal lumen, in turn accelerating gastrointestinal transit.3 A meta-analysis with 1468 IBS patients found that lubiprostone improved constipation, stool consistency, abdominal pain, degree of straining, and abdominal bloating.50 Diarrhea and nausea are commonly reported adverse effects of lubiprostone.49,50
Linaclotide, plecanatide, and lubiprostone should be considered first-line therapies for patients with IBS-C. High cost is still a roadblock to the use of these agents.
The US Food and Drug Administration (FDA) approved tenapanor in September 2019; however, the drug is not commercially available in the United States (it is available in Canada). Tenapanor is a sodium–hydrogen exchanger 3 inhibitor that reduces sodium absorption from the intestine and colon. The drug increases water secretion into the intestinal lumen, thus accelerating gut transit time. It also inhibits active absorption of phosphate in the intestine.
Tenapanor was approved for treating both IBS-C and hyperphosphatemia in patients with chronic kidney disease on dialysis or end-stage renal disease.26 In a recent meta-analysis, the drug showed benefit in alleviating global IBS symptoms, and ranked first in reducing bloating.49 It is too soon to know if tenapanor will perform clinically better than other prosecretory agents.
Continue to: Serotonergic agents
Serotonergic agents. Serotonin (5-hydroxytryptamine [5-HT]) modulates gastrointestinal secretions, gut motility, and visceral sensation. Researchers have developed IBS treatments that target receptors involved in these functions.
Tegaserod is a partial, selective 5-HT4 agonist indicated for the treatment of IBS-C in women. A study with 661 women with IBS-M and IBS-C showed that tegaserod increased the number of bowel movement episodes. Patients also reported higher stool consistency scores and fewer days with straining compared to placebo.27 The medication was removed from the market in 2007 because of its potential for cardiovascular adverse effects3; however, it was reintroduced in 2019 for women < 65 years of age with IBS-C. Consider prescribing tegaserod if other treatment options fail to alleviate symptoms.
Treatment of IBS-D
Antibiotics. The nonabsorbable antibiotic rifaximin is approved by the FDA for IBS-D at a dosage of 550 mg tid for 2 weeks.1 Several studies show improvement in IBS global symptoms with the recommended treatment course51-53; benefit persisted for the 10-week follow-up study period.1 A meta-analysis found that the NNT for rifaximin is 8-11.54 Preliminary data indicate that the rates of Clostridioides difficile infection and microbial resistance among rifaximin users are low.3 Consider using rifaximin as a first-line treatment option for patients with IBS-D. Retreatment might be necessary because the drug’s effect gradually disappears.9
Antidiarrheals. Eluxadoline is a µ-opioid and κ-opioid receptor agonist and δ-opioid receptor antagonist with effects on the intestinal nervous system.3 Several meta-analyses demonstrated that eluxadoline improves abdominal pain scores and daily stool consistency in IBS-D patients.53,54 Eluxadoline should be considered early in the management of IBS-D patients. The most common adverse effect is constipation.
The FDA issued a safety warning in 2017 regarding an increased risk of pancreatitis in patients taking eluxadoline who do not have a gallbladder. In addition, eluxadoline should be avoided in patients with a history of sphincter of Oddi dysfunction, alcohol abuse, or severe liver problems.3,54
Continue to: The high cost of...
The high cost of eluxadoline can be a significant barrier to use.
Serotonergic agents. Alosetron is a selective
Ondansetron has also been used to treat IBS-D. In a meta-analysis with 294 patients, ondansetron showed improvement in stool consistency.55 Ondansetron does not improve abdominal pain.4 It can be used in patients who have mild-to-moderate symptoms.9 Ondansetron is not FDA approved for the treatment of IBS-D.
Bile-acid sequestrants. Traditionally, bile-acid sequestrants have been used to treat bile-acid diarrhea. A meta-analysis of 6 studies of 908 patients with IBS-D found that 28.1% were affected by bile-acid malabsorption. Two small studies that evaluated the benefits of colesevelam for IBS-D found significant improvement in stool consistency.54 Another study, which evaluated the benefits of cholestyramine, found improvement in stool consistency, but findings were not significant.54 Many patients taking a bile-acid sequestrant stop taking the medication because of considerable adverse effects (constipation, nausea, bloating, flatulence, and abdominal pain).54 For that reason, this class of medication is not recommended as first-line treatment for IBS-D and is not FDA approved for IBS-D.
SIDEBAR
KEY POINTS The challenge of, and a needed framework for, managing IBS
- IBS is a complex, chronic condition affecting a considerable number of people worldwide.
- Because of the substantial disease burden associated with IBS, patients are at higher risk of mental health disorders.
- Physicians who care for IBS patients must build a strong physician–patient relationship; their mutual trust will ensure development of an effective treatment plan.
- Family physicians and other primary care providers are equipped to help IBS patients navigate the complex health care system and the IBS disease process. They can help coordinate care with specialists and behavioral health clinicians, which will help patients improve quality of life and manage symptoms appropriately.
A role for complementaryand integrative medicine?
Recently, complementary and integrative modalities for treating IBS have sparked the interest of researchers.
Continue to: Acupuncture
Acupuncture. In a meta-analysis with 3440 patients, acupuncture was more effective than Western medicine in alleviating IBS symptoms for as long as 3 months. The authors concluded that acupuncture could be used in combination with other therapies to reduce the severity of IBS symptoms.56
Concomitant acupuncture and Chinese herbal medicine. In a systematic review and meta-analysis comprising 21 randomized controlled trials, researchers reported that acupuncture combined with Chinese herbal medicine improved IBS symptoms, compared to what was noted in matched controls who were treated with Western medicine or with Western medicine combined with Chinese herbal medicine. The authors were cautious about the results of the meta-analysis, however, because the studies examined were small and of low quality, and presented a high risk of bias.57
Agents not to be used routinely for IBS
Loperamide. This peripheral µ-opioid receptor agonist controls diarrhea. However, recent studies showed no significant benefit to loperamide over placebo in IBS-M and IBS-D. In 2018, the FDA issued a safety alert regarding an elevated risk of serious cardiac adverse effects in patients taking loperamide. The ACG recommends against using loperamide to treat IBS symptoms.3,54
Polyethylene glycol. An osmotic laxative that is not absorbed in the intestinal lumen, polyethylene glycol is highly efficacious for alleviating constipation, but it does not reduce pain or other IBS symptoms. For that reason, the ACG recommends against its use.3
CORRESPONDENCE
Jose M. Villalon-Gomez, MD, MPH, Emory Healthcare Family Medicine, 4500 North Shallowford Road, Dunwoody, GA 30338; [email protected]
1. Lacy BE, Mearin F, Chang L, et al. Bowel disorders. Gastroenterology. 2016;150:1393-1407.e5. doi:10.1053/j.gastro.2016.02.031
2. What kind of poop do I have? WebMD. January 16, 2020. Accessed September 20, 2021. www.webmd.com/digestive-disorders/poop-chart-bristol-stool-scale
3. Ford AC, Moayyedi P, Chey WD, et al; . American College of Gastroenterology monograph on management of irritable bowel syndrome. Am J Gastroenterol. 2018;113(suppl 2):1-18. doi:10.1038/s41395-018-0084-x
4. Ferreira AI, Garrido M, Castro-Poças F. Irritable bowel syndrome: news from an old disorder. GE Port J Gastroenterol. 2020;27:255-268. doi:10.1159/000503757
5. Black CJ, Ford AC. Global burden of irritable bowel syndrome: trends, predictions and risk factors. Nat Rev Gastroenterol Hepatol. 2020;17:473-486. doi: 10.1038/s41575-020-0286-8
6. Frändemark Å, Törnblom H, Jakobsson S, et al. Work productivity and activity impairment in irritable bowel syndrome (IBS): a multifaceted problem: Am J Gastroenterol. 2018;113:1540-1549. doi:10.1038/s41395-018-0262-x
7. Poulsen CH, Eplov LF, Hjorthøj C, et al. Irritable bowel symptoms, use of healthcare, costs, sickness and disability pension benefits: a long-term population-based study. Scand J Public Health. 2019;47:867-875. doi:10.1177/1403494818776168
8. Hausteiner-Wiehle C, Henningsen P. Irritable bowel syndrome: relations with functional, mental, and somatoform disorders. World J Gastroenterol. 2014;20:6024-6030. doi:10.3748/wjg.v20.i20.6024
9. Moayyedi P, Mearin F, Azpiroz F, et al. Irritable bowel syndrome diagnosis and management: a simplified algorithm for clinical practice. United European Gastroenterol J. 2017;5:773-788. doi:10.1177/2050640617731968
10. Zhu S, Wang B, Jia Q, et al. Candidate single nucleotide polymorphisms of irritable bowel syndrome: a [systematic] review and meta-analysis. BMC Gastroenterology. 2019;19:165. doi:10.1186/s12876-019-1084-z
11. Simrén M, Törnblom H, Palsson OS, et al. Visceral hypersensitivity is associated with GI symptom severity in functional GI disorders: consistent findings from five different patient cohorts. Gut. 2018;67:255-262. doi:10.1136/gutjnl-2016-312361
12. Bashashati M, Moossavi S, Cremon C, et al. Colonic immune cells in irritable bowel syndrome: a systematic review and meta-analysis. Neurogastroenterol Motil. 2018;30:e13192. doi:10.1111/nmo.13192
13. Robles A, Ingles DP, Myneedu K, et al. Mast cells are increased in the small intestinal mucosa of patients with irritable bowel syndrome: a systematic review and meta-analysis. Neurogastroenterol Motil. 2019;31:e13718. doi:10.1111/nmo.13718
14. Bashashati M, Moradi M, Sarosiek I. Interleukin-6 in irritable bowel syndrome: A systematic review and meta-analysis of IL-6 (-G174C) and circulating IL-6 levels. Cytokine. 2017;99:132-138. doi:10.1016/j.cyto.2017.08.017
15. Bashashati M, Rezaei N, Shafieyoun A, et al. Cytokine imbalance in irritable bowel syndrome: a systematic review and meta-analysis. Neurogastroenterol Motil. 2014;26:1036-1048. doi:10.1111/nmo.12358
16. Sibelli A, Chalder T, Everitt H, et al. A systematic review with meta-analysis of the role of anxiety and depression in irritable bowel syndrome onset. Psychol Med. 2016;46:3065-3080. doi:10.1017/S0033291716001987
17. Yeh H-W, Chien W-C, Chung C-H, et al. Risk of psychiatric disorders in irritable bowel syndrome—a nationwide, population-based, cohort study. Int J Clin Pract. 2018;72:e13212. doi:10.1111/ijcp.13212
18. Duan R, Zhu S, Wang B, et al. Alterations of gut microbiota in patients with irritable bowel syndrome based on 16S rRNA-targeted sequencing: a systematic review. Clin Transl Gastroenterol. 2019;10:e00012. doi:10.14309/ctg.0000000000000012
19. Wang L, Alammar N, Singh R, et al. Gut microbial dysbiosis in the irritable bowel syndrome: a systematic review and meta-analysis of case-controlled studies. J Acad Nutr Diet. 2020;120:565-586. doi:10.1016/j.jand.2019.05.015
20. Barbara G, Grover M, Bercik P, et al. Rome Foundation working team report on post-infection irritable bowel syndrome. Gastroenterology. 2019;156:46-58.e7. doi:10.1053/j.gastro.2018.07.011
21. Klem F, Wadhwa A, Prokop LJ, et al. Prevalence, risk factors, and outcomes of irritable bowel syndrome after infectious enteritis: a systematic review and meta-analysis. Gastroenterology. 2017;152:1042-1054.e1. doi:10.1053/j.gastro.2016.12.039
22. Heidelbaugh JJ. These 3 tools can help you streamline management of IBS. J Fam Pract. 2017;66:346-353.
23. American College of Gastroenterology Task Force on Irritable Bowel Syndrome; Brandt LJ, Chey WD, Foxx-Orenstein AE, et al. An evidence-based position statement on the management of irritable bowel syndrome. Am J Gastroenterol. 2009;104(suppl 1):S1-S35. doi:10.1038/ajg.2008.122
24. Menees SB, Powell C, Kurlander J, et al. A meta-analysis of the utility of C-reactive protein, erythrocyte sedimentation rate, fecal calprotectin, and fecal lactoferrin to exclude inflammatory bowel disease in adults with IBS. Am J Gastroenterol. 2015;110:444-454. doi:10.1038/ajg.2015.6
25. Smalley W, Falck-Ytter C, Carrasco-Labra A, et al. AGA clinical practice guidelines on the laboratory evaluation of functional diarrhea and diarrhea-predominant irritable bowel syndrome in adults (IBS-D). Gastroenterology. 2019;157:851-854. doi:10.1053/j.gastro.2019.07.004
26. Markham A. Tenapanor: first approval. Drugs. 2019;79:1897-1903. doi:10.1007/s40265-019-01215-9
27. Chey WD, Paré P, Viegas A, et al. Tegaserod for female patients suffering from IBS with mixed bowel habits or constipation: a randomized controlled trial. Am J Gastroenterol. 2008;103:1217-1225. doi:10.1111/j.1572-0241.2008.01808.x
28. Zhou C, Zhao E, Li Y, et al. Exercise therapy of patients with irritable bowel syndrome: a systematic review of randomized controlled trials. Neurogastroenterol Motil. 2019;31:e13461. doi:10.1111/nmo.13461
29. Hustoft TN, Hausken T, Ystad SO, et al. Effects of varying dietary content of fermentable short-chain carbohydrates on symptoms, fecal microenvironment, and cytokine profiles in patients with irritable bowel syndrome. Neurogastroenterol Motil. 2017;29:e12969. doi:10.1111/nmo.12969
30. Zegarac JP. The low-FODMAP diet for IBS: what you need to know. Medscape. August 13, 2019. Accessed September 20, 2021. www.medscape.com/viewarticle/917069
31. Dionne J, Ford AC, Yuan Y, et al. A systematic review and meta-analysis evaluating the efficacy of a gluten-free diet and a low
32. Su H, Li Y-T, Heitkemper MM, et al. Effects of low-FODMAPS diet on irritable bowel syndrome symptoms and gut microbiome: Gastroenterol Nurs. 2019;42:150-158. doi:10.1097/SGA.0000000000000428
33. Nawawi KNM, Belov M, Goulding C. Low FODMAP diet significantly improves IBS symptoms: an Irish retrospective cohort study. Eur J Nutr. 2020;59:2237-2248. doi: 10.1007/s00394-019-02074-6
34. Altobelli E, Del Negro V, Angeletti PM, et al. Low-FODMAP diet improves irritable bowel syndrome symptoms: a meta-analysis. Nutrients. 2017;9:940. doi:10.3390/nu9090940
35. Nagarajan N, Morden A, Bischof D, et al. The role of fiber supplementation in the treatment of irritable bowel syndrome: a systematic review and meta-analysis. Eur J Gastroenterol Hepatol. 2015;27:1002-1010. doi:10.1097/MEG.0000000000000425
36. Wilson B, Rossi M, Dimidi E, et al. Prebiotics in irritable bowel syndrome and other functional bowel disorders in adults: a systematic review and meta-analysis of randomized controlled trials. Am J Clin Nutr. 2019;109:1098-1111. doi:10.1093/ajcn/nqy376
37. Yuan F, Ni H, Asche CV, et al. Efficacy of Bifidobacterium infantis 35624 in patients with irritable bowel syndrome: a meta-analysis. Curr Med Res Opin. 2017;33:1191-1197. doi:10.1080/03007995.2017.1292230
38. Liang D, Longgui N, Guoqiang X. Efficacy of different probiotic protocols in irritable bowel syndrome: a network meta-analysis. Medicine (Baltimore). 2019;98:16068. doi:10.1097/MD.0000000000016068
39. Dale HF, Rasmussen SH, Asiller ÖÖ, et al. Probiotics in irritable bowel syndrome: an up-to-date systematic review. Nutrients. 2019;11:2048. doi:10.3390/nu11092048
40. Pratt C, Campbell MD. The effect of Bifidobacterium on reducing symptomatic abdominal pain in patients with irritable bowel syndrome: a systematic review. Probiotics Antimicrob Proteins. 2020;12:834-839. doi:10.1007/s12602-019-09609-7
41. Ianiro G, Eusebi LH, Black CJ, et al. Systematic review with meta-analysis: efficacy of faecal microbiota transplantation for the treatment of irritable bowel syndrome. Aliment Pharmacol Ther. 2019;50:240-248. doi:10.1111/apt.15330
42. Myneedu K, Deoker A, Schmulson MJ, et al. Fecal microbiota transplantation in irritable bowel syndrome: a systematic review and meta-analysis. United European Gastroenterol J. 2019;7:1033-1041. doi:10.1177/2050640619866990
43. Xu D, Chen VL, Steiner CA, et al. Efficacy of fecal microbiota transplantation in irritable bowel syndrome: a systematic review and meta-analysis. Am J Gastroenterol. 2019;114:1043-1050. doi:10.14309/ajg.0000000000000198
44. Black CJ, Yuan Y, Selinger CP, et al. Efficacy of soluble fibre, antispasmodic drugs, and gut–brain neuromodulators in irritable bowel syndrome: a systematic review and network meta-analysis. Lancet Gastroenterol Hepatol. 2020;5:117-131. doi:10.1016/S2468-1253(19)30324-3
45. Khanna R, MacDonald JK, Levesque BG. Peppermint oil for the treatment of irritable bowel syndrome: a systematic review and meta-analysis. J Clin Gastroenterol. 2014;48:505-512. doi:10.1097/MCG.0b013e3182a88357
46. Alammar N, Wang L, Saberi B, et al. The impact of peppermint oil on the irritable bowel syndrome: a meta-analysis of the pooled clinical data. BMC Complement Altern Med. 2019;19:21. doi:10.1186/s12906-018-2409-0
47. Ford AC, Lacy BE, Harris LA, et al. Effect of antidepressants and psychological therapies in irritable bowel syndrome: an updated systematic review and meta-analysis. Am J Gastroenterol. 2019;114:21-39. doi: 10.1038/s41395-018-0222-5
48. Shah ED, Kim HM, Schoenfeld P. Efficacy and tolerability of guanylate cyclase-c agonists for irritable bowel syndrome with constipation and chronic idiopathic constipation: a systematic review and meta-analysis. Am J Gastroenterol. 2018;113:329-338. doi:10.1038/ajg.2017.495
49. Black CJ, Burr NE, Quigley EMM, et al. Efficacy of secretagogues in patients with irritable bowel syndrome with constipation: systematic review and network meta-analysis. Gastroenterology. 2018;155:1753-1763. doi:10.1053/j.gastro.2018.08.021
50. Li F, Fu T, Tong W-D, et al. Lubiprostone is effective in the treatment of chronic idiopathic constipation and irritable bowel syndrome: a systematic review and meta-analysis of randomized controlled trials. Mayo Clin Proc. 2016;91:456-468. doi:10.1016/j.mayocp.2016.01.015
51. Ford AC, Harris LA, Lacy BE, et al. Systematic review with meta-analysis: the efficacy of prebiotics, probiotics, synbiotics and antibiotics in irritable bowel syndrome. Aliment Pharmacol Ther. 2018;48:1044-1060. doi:10.1111/apt.15001
52. Yoon K, Kim N, Lee JY, et al. Clinical response of rifaximin treatment in patients with abdominal bloating. Korean J Gastroenterol. 2018;72:121-127. doi:10.4166/kjg.2018.72.3.121
53. Black CJ, Burr NE, Camilleri M, et al. Efficacy of pharmacological therapies in patients with IBS with diarrhoea or mixed stool pattern: systematic review and network meta-analysis. Gut. 2020;69:74-82. doi:10.1136/gutjnl-2018-318160
54. Lacy BE. Review article: an analysis of safety profiles of treatments for diarrhoea-predominant irritable bowel syndrome. Aliment Pharmacol Ther. 2018;48:817-830. doi:10.1111/apt.14948
55. Zheng Y, Yu T, Tang Y, et al. Efficacy and safety of 5-hydroxytryptamine 3 receptor antagonists in irritable bowel syndrome: a systematic review and meta-analysis of randomized controlled trials. PLOS ONE. 2017;12:e0172846. doi:10.1371/journal.pone.0172846
56. Zheng H, Chen R, Zhao X, et al. Comparison between the effects of acupuncture relative to other controls on irritable bowel syndrome: a meta-analysis. Pain Research and Management. 2019;2019:1-13. doi:https://doi.org/10.1155/2019/2871505
57. Yan J, Miao Z-W, Lu J, et al. Acupuncture plus Chinese herbal medicine for irritable bowel syndrome with diarrhea: a systematic review and meta-analysis. Evid Based Complement Alternat Med. 2019;2019:1-16. https://doi.org/10.1155/2019/7680963
Irritable bowel syndrome (IBS) continues to pose a diagnostic and therapeutic challenge to clinicians and patients—a challenge that arises from the varying manifestations of the condition, its complex pathophysiology, lack of effective treatment, and psychological consequences for patients. In this article, I explore new findings related to the pathophysiology, diagnosis, and management of IBS subtypes.
Start with the Rome IV classification of IBS
The Rome Foundation published its latest IBS classification and diagnostic criteria (known as Rome IV) in 2016.1 IBS is defined as abdominal pain that (1) has recurred, on average, ≥ 1 time per week during the past 3 months and (2) is associated with ≥ 2 of these criteria1:
- related to defecation
- associated with a change in stool frequency
- associated with a change in the appearance of stool.
Onset of symptoms should be present for 6 months before a diagnosis of IBS is made.1
IBS subtypes—constipation-predominant (IBS-C), diarrhea-predominant (IBS-D), mixed (IBS-M), and unclassified (IBS-U) (TABLE 1)1—are based on the frequency of specific stool forms, as described and illustrated in the Bristol Stool Scale (www.webmd.com/digestive-disorders/poop-chart-bristol-stool-scale).2
A widespread, costly, potentially debilitating disorder
IBS affects 10% to 12% of adults worldwide. The condition is more common among women and people younger than 50 years.1,3 Women with IBS tend to have more constipation symptoms (IBS-C); men with IBS, more diarrhea symptoms (IBS-D).4
The financial burden of IBS on the health care system and patients is significant. In a 2013 appraisal of 35 studies, the authors note that estimates of the direct cost of IBS care in the United States vary considerably—from $1562 to $7547 for a patient annually.5
A recent study found that almost 25% of IBS patients report absenteeism from work due to IBS symptoms.6 A Danish study that followed 7278 patients for 5 years found that IBS patients utilized more health care, sick days, and disability pension benefits than non-IBS patients, and had increased utilization of medical resources because of psychiatric conditions.7
Continue to: IBS patients also have comorbidities
IBS patients also have comorbidities:
- More than 20% of IBS patients have functional dyspepsia, gastroesophageal reflux disease, incontinence, or pelvic floor dyssynergia.4
- The frequency of fibromyalgia syndrome in IBS patients is reported to be 20% to 65%.8
- 14% of IBS patients meet criteria for chronic fatigue syndrome.8
- Interstitial cystitis and dyspareunia are common among IBS patients.9
Pathophysiology is complex
Models describing the pathophysiology of IBS have evolved through the years. Recent models describe it as a combination of altered gastrointestinal motility, visceral hyperalgesia, increased intestinal permeability, immune activation, altered intestinal microbiota, and dysfunction in the brain–gut axis. Certain environmental and psychological variables (eg, previous gastroenteritis, food intolerance, chronic stress, diverticulitis, and surgery) increase the risk of IBS.1,10,11
In the past several years, considerable attention has been paid to the roles played by the immune system, brain–gut axis function, and intestinal microbiota in IBS manifestations. Research focus in these areas might assist in the development of specific treatment modalities targeting IBS subtypes.
Immune system. A recent meta-analysis of the records of 706 IBS patients found an increased number of mast cells and CD3 T cells in biopsy specimens from the rectosigmoid and descending colon of IBS patients.12 Another study found a significant increase in mast cells in the ileum of IBS patients13; this increase is evident not only on intestinal biopsy but also at the serologic level. IBS-D patients have a higher plasma interleukin (IL)-6 level than the general population.14 Another meta-analysis found an imbalance in the serum level of tumor necrosis factor-α and IL-10 in IBS patients.15
Brain–gut axis. A 2016 meta-analysis showed that patients with anxiety and depression have a 2-fold increased risk of IBS.16 A more recent study, using data from the National Health Insurance Research Database that included 22,356 patients with IBS, found a 3.6-fold increased risk of psychiatric disorders in IBS.17 These findings reflect the complex interaction between the brain and the intestinal tract in IBS.
Continue to: Intestinal microbiota
Intestinal microbiota. Research evaluating the role of altered intestinal microbiota in IBS has yielded mixed results. A meta-analysis of 777 IBS patients showed an increase in Firmicutes spp, a decrease in Bacteroidetes spp, and an increase in the ratio of Firmicutes spp to Bacteroidetes spp in subjects’ fecal specimens.18 Another study, of 1340 patients, found no difference in Bacteroides spp and Enterococcus spp between healthy controls and IBS patients, but did find (1) lower fecal counts of Lactobacillus spp and Bifidobacterium spp and (2) higher fecal counts of Escherichia coli and Enterobacter spp in IBS patients.19
Postinfectious IBS. The Rome Foundation introduced the diagnosis of postinfectious IBS (PI-IBS) in 2019. PI-IBS develops in 10% of patients who have had infectious enteritis. Female gender, younger age, psychological distress during or before the enteritis episode, and severity of the acute episode are risk factors for this IBS variant.20 A study of 21,421 enteritis patients found that 42% with protozoal or parasitic infection and 14% with bacterial infection developed IBS.
Patients with nonviral enteritis often have a more severe course of enteritis, typically requiring antibiotics. It is believed that the resulting irregularities in the intestinal microbiota make these patients more likely to develop PI-IBS.21 PI-IBS patients are likely to improve or fully recover over time. Symptoms of PI-IBS are managed in a manner similar to how non-PI-IBS patients are managed.20
Challenges in making the IBS diagnosis
Historically, the diagnosis of IBS has been made clinically after excluding red flags (ie, signs or symptoms that might reflect other underlying medical problems) in the clinical presentation. For this reason, obtain a thorough clinical history that includes the course of symptoms, triggers, and alleviating factors. Any of the following are considered red flags1,22,23:
- age > 50 years at onset of symptoms
- new-onset constipation in the elderly
- rectal bleeding
- unexplained weight loss or anemia
- family history of organic gastrointestinal disease
- palpable abdominal or rectal mass
- nocturnal symptoms.
New studies demonstrate that several inflammatory markers can help exclude inflammatory bowel disease from the differential diagnosis in patients in whom IBS is suspected and being investigated.24 In 2019, the American Gastroenterological Association published a clinical practice guideline updating the laboratory evaluation of functional diarrhea and IBS-D in adults,25 and made several recommendations:
- Obtain the level of fecal calprotectin (normal level, ≤ 50 mcg/g) or fecal lactoferrin (≤ 4.0-7.25 mcg/g); if these tests are not available or results are not accessible, the C-reactive protein level is a reasonable option.
- Do not routinely use the erythrocyte sedimentation rate or C-reactive protein level to screen for inflammatory bowel disease.
- Test for Giardia lamblia with an antigen or polymerase chain reaction test.
- Do not test for ova and parasites (other than Giardia) in patients who do not have a history of travel or who have not emigrated from a high-risk area recently.
- Obtain testing for celiac disease with immunoglobulin A (IgA) tissue transglutaminase and with a second test, of immunoglobulin G (IgG) tissue transglutaminase and IgG or IgA deaminated gliadin peptides, to detect celiac disease in IgA-deficient patients.
- Order testing for bile-acid diarrhea with selenium homotaurocholic acid nuclear medicine scanning (if available in your region; the test is available in Europe); measurement of bile acid from a 48-hour stool collection; or an assay of fibroblast growth factor 19, which measures defective feedback of bile-acid synthesis. If these tests are unavailable, consider an empiric trial of a bile-acid binder.
- Do not use available serologic IBS testing.
Continue to: Continue to obtain a...
Continue to obtain a complete blood count for the evaluation of anemia. Endoscopic procedures are indicated in patients with a red flag.1
Treat based on subtype
The first step in the treatment of all IBS patients (TABLE 21,3,4,9,26,27) is for you to develop a strong relationship with the patient: You must acknowledge the disease and empower the patient to manage their symptoms. A strong physician–patient relationship leads to more effective outcomes.4
IBS treatment modalities target abdominal pain, bloating, abdominal distention, and altered bowel function—described in the literature as global symptoms. IBS-M patients should direct their treatment to the predominant symptom (constipation or diarrhea). The following sections describe available treatment options. The FIGURE1,3,4,9,25 shows a treatment workflow based on IBS subtype and symptom severity.
Treatments for all IBS subtypes
Lifestyle modification. Exercise provides overall positive health benefits. With such a variety of exercise forms, however, it is difficult to identify specific exercises that are better for IBS patients.28 A study of 305 IBS patients found that exercise alleviated constipation but not other IBS symptoms, and did not improve quality of life.3 Based on low cost and low risk of adverse effects, exercise should be recommended to all IBS patients.
Dietary restriction therapies have become an area of focus for patients, clinicians, and researchers. Modification of the diet is thought to improve global symptoms and intestinal health through modification of gut microbiota, immune activation, and a decrease in levels of fecal short-chain fatty acids.29
Continue to: The 2 main diets...
The 2 main diets studied for the treatment of IBS are a diet low in fermentable oligo-, di- and monosaccharides and polyols—the so-called low-FODMAP diet (TABLE 330)—and a gluten-free diet. Evidence behind the benefits of both diets conflicts; trials of the low-FODMAP diet are more favorable.
A small study with 20 patients with IBS-D and IBS-M who followed a low-FODMAP diet found improvement in IBS symptoms and a reduction in serum levels of proinflammatory cytokines, fecal bacteria, and total fecal short-chain fatty acid levels.29 Several meta-analyses have shown improvement in overall IBS symptoms for patients who follow a low-FODMAP diet. Because of the heterogeneity of the studies, however, the quality of the data is low.31-34
Data supporting the use of a gluten-free diet for IBS patients are insufficient.31
The American College of Gastroenterology (ACG) gave a weak recommendation for the low-FODMAP diet and recommended against the gluten-free diet in IBS patients.3 More data are needed regarding the safety profile of using a low-FODMAP diet for an extended period: There is concern about the risk of nutritional deficiencies associated with long-term use of this diet.3
Supplementation with poorly fermentable soluble fiber has been shown to alleviate global IBS symptoms; insoluble fiber does not yield improvement of symptoms. Psyllium fiber is recommended over wheat bran.3,35
Continue to: Consider a low-FODMAP diet...
Consider a low-FODMAP diet and soluble fiber as initial treatment for all IBS patients.
Modification of intestinal microbiota. Understanding the difference between prebiotics and probiotics is important when considering treatment for IBS. Prebiotics are foods or dietary supplements that generate changes in the composition and activity of intestinal microbiota. Probiotics are live microorganisms that can improve intestinal health.3
A meta-analysis of 729 IBS patients found that prebiotics do not reduce gastrointestinal symptoms or improve the quality of life of IBS patients.36 Evidence supporting the benefit of probiotics is favorable; however, data in these studies have significant heterogeneity. Several meta-analyses studied the benefits of Lactobacillus spp and Bifidobacterium spp in alleviating IBS symptoms. The studies found improvement in abdominal pain, bloating and distention, and flatulence.3,37-40 Consider recommending probiotics for all IBS patients; for some, however, the high cost of some of these products might be an obstacle.
Researchers are also studying the use of fecal microbiota transplantation (FMT) to treat IBS. Studies have evaluated the delivery of FMT orally (as capsules) and endoscopically. Evidence does not show improvement in global IBS symptoms with FMT. More studies, with larger sample populations, are needed.41-43
Antispasmodic medications and peppermint oil. Antispasmodic medications have been considered a mainstay therapy for IBS because of their effect on intestinal dysmotility. Hyoscine and dicyclomine are commonly used. Meta-analyses have shown improvement in global symptoms and abdominal pain, but effects were modest.3,44 Use this class of drugs as first-line treatment for mild IBS symptoms.
Continue to: Peppermint oil has been...
Peppermint oil has been found useful in improving IBS global symptoms and abdominal pain in several studies.44-46 A common adverse effect of peppermint oil is heartburn, resulting from relaxation of esophageal muscle.3 Peppermint oil can be considered an adjuvant agent in treating IBS.
Antidepressants. Tricyclic antidepressants (TCAs) and selective serotonin reuptake inhibitors (SSRIs) have been studied for the treatment of IBS. Meta-analyses show that both are effective in reducing pain and overall IBS symptoms.1,3,47 The number needed to treat (NNT) for TCAs is 4.5; for SSRIs, 5.47 Data do not show that either drug class is superior to the other for IBS. Based on the adverse effect profile, TCAs are more suitable for IBS-D patients; SSRIs are better for IBS-C patients.47
New data show that serotonin-norepinephrine reuptake inhibitors, such as duloxetine and milnacipran, can alleviate IBS symptoms through their pain-modifying properties.47
Based on the adverse effect profile and stigma associated with antidepressant medications, patients might be less likely to take them for IBS symptoms than for these drugs’ primary indications. Clinicians should still consider this drug class if other first-line treatments do not provide full resolution of symptoms.
Psychotherapy. Several psychotherapeutic modalities have been evaluated for efficacy in reducing global IBS symptoms. The approaches studied most often were provider-directed cognitive behavioral therapy, relaxation therapy, hypnotherapy, and multicomponent psychological therapy. The NNT for these modalities is 4, but studies had significant heterogeneity.3 Consider referring patients for psychotherapeutic intervention if they have not responded to medical therapy after 12 months.4
Continue to Treatment of IBS-C
Treatment of IBS-C
Prosecretory agents. Linaclotide and plecanatide are amino-acid peptides that act as a guanylate cyclase C agonist. Both increase gastrointestinal transit rate by increasing electrolyte and fluid transport into the intestinal lumen. They also decrease the activity of pain-sensing nerves by increasing extracellular cyclic guanosine-3'5'-monophosphate levels.3,48 In a recent meta-analysis, both treatments produced improvement in global symptoms. However, linaclotide showed superior improvement in abdominal pain and global symptoms compared to other secretory agents.48,49 Diarrhea was the most common adverse effect of linaclotide and plecanatide, although less so with plecanatide.49
Lubiprostone activates the intestinal chloride channel type 2 on the small intestine, leading to an increase in chloride and water efflux into the intestinal lumen, in turn accelerating gastrointestinal transit.3 A meta-analysis with 1468 IBS patients found that lubiprostone improved constipation, stool consistency, abdominal pain, degree of straining, and abdominal bloating.50 Diarrhea and nausea are commonly reported adverse effects of lubiprostone.49,50
Linaclotide, plecanatide, and lubiprostone should be considered first-line therapies for patients with IBS-C. High cost is still a roadblock to the use of these agents.
The US Food and Drug Administration (FDA) approved tenapanor in September 2019; however, the drug is not commercially available in the United States (it is available in Canada). Tenapanor is a sodium–hydrogen exchanger 3 inhibitor that reduces sodium absorption from the intestine and colon. The drug increases water secretion into the intestinal lumen, thus accelerating gut transit time. It also inhibits active absorption of phosphate in the intestine.
Tenapanor was approved for treating both IBS-C and hyperphosphatemia in patients with chronic kidney disease on dialysis or end-stage renal disease.26 In a recent meta-analysis, the drug showed benefit in alleviating global IBS symptoms, and ranked first in reducing bloating.49 It is too soon to know if tenapanor will perform clinically better than other prosecretory agents.
Continue to: Serotonergic agents
Serotonergic agents. Serotonin (5-hydroxytryptamine [5-HT]) modulates gastrointestinal secretions, gut motility, and visceral sensation. Researchers have developed IBS treatments that target receptors involved in these functions.
Tegaserod is a partial, selective 5-HT4 agonist indicated for the treatment of IBS-C in women. A study with 661 women with IBS-M and IBS-C showed that tegaserod increased the number of bowel movement episodes. Patients also reported higher stool consistency scores and fewer days with straining compared to placebo.27 The medication was removed from the market in 2007 because of its potential for cardiovascular adverse effects3; however, it was reintroduced in 2019 for women < 65 years of age with IBS-C. Consider prescribing tegaserod if other treatment options fail to alleviate symptoms.
Treatment of IBS-D
Antibiotics. The nonabsorbable antibiotic rifaximin is approved by the FDA for IBS-D at a dosage of 550 mg tid for 2 weeks.1 Several studies show improvement in IBS global symptoms with the recommended treatment course51-53; benefit persisted for the 10-week follow-up study period.1 A meta-analysis found that the NNT for rifaximin is 8-11.54 Preliminary data indicate that the rates of Clostridioides difficile infection and microbial resistance among rifaximin users are low.3 Consider using rifaximin as a first-line treatment option for patients with IBS-D. Retreatment might be necessary because the drug’s effect gradually disappears.9
Antidiarrheals. Eluxadoline is a µ-opioid and κ-opioid receptor agonist and δ-opioid receptor antagonist with effects on the intestinal nervous system.3 Several meta-analyses demonstrated that eluxadoline improves abdominal pain scores and daily stool consistency in IBS-D patients.53,54 Eluxadoline should be considered early in the management of IBS-D patients. The most common adverse effect is constipation.
The FDA issued a safety warning in 2017 regarding an increased risk of pancreatitis in patients taking eluxadoline who do not have a gallbladder. In addition, eluxadoline should be avoided in patients with a history of sphincter of Oddi dysfunction, alcohol abuse, or severe liver problems.3,54
Continue to: The high cost of...
The high cost of eluxadoline can be a significant barrier to use.
Serotonergic agents. Alosetron is a selective
Ondansetron has also been used to treat IBS-D. In a meta-analysis with 294 patients, ondansetron showed improvement in stool consistency.55 Ondansetron does not improve abdominal pain.4 It can be used in patients who have mild-to-moderate symptoms.9 Ondansetron is not FDA approved for the treatment of IBS-D.
Bile-acid sequestrants. Traditionally, bile-acid sequestrants have been used to treat bile-acid diarrhea. A meta-analysis of 6 studies of 908 patients with IBS-D found that 28.1% were affected by bile-acid malabsorption. Two small studies that evaluated the benefits of colesevelam for IBS-D found significant improvement in stool consistency.54 Another study, which evaluated the benefits of cholestyramine, found improvement in stool consistency, but findings were not significant.54 Many patients taking a bile-acid sequestrant stop taking the medication because of considerable adverse effects (constipation, nausea, bloating, flatulence, and abdominal pain).54 For that reason, this class of medication is not recommended as first-line treatment for IBS-D and is not FDA approved for IBS-D.
SIDEBAR
KEY POINTS The challenge of, and a needed framework for, managing IBS
- IBS is a complex, chronic condition affecting a considerable number of people worldwide.
- Because of the substantial disease burden associated with IBS, patients are at higher risk of mental health disorders.
- Physicians who care for IBS patients must build a strong physician–patient relationship; their mutual trust will ensure development of an effective treatment plan.
- Family physicians and other primary care providers are equipped to help IBS patients navigate the complex health care system and the IBS disease process. They can help coordinate care with specialists and behavioral health clinicians, which will help patients improve quality of life and manage symptoms appropriately.
A role for complementaryand integrative medicine?
Recently, complementary and integrative modalities for treating IBS have sparked the interest of researchers.
Continue to: Acupuncture
Acupuncture. In a meta-analysis with 3440 patients, acupuncture was more effective than Western medicine in alleviating IBS symptoms for as long as 3 months. The authors concluded that acupuncture could be used in combination with other therapies to reduce the severity of IBS symptoms.56
Concomitant acupuncture and Chinese herbal medicine. In a systematic review and meta-analysis comprising 21 randomized controlled trials, researchers reported that acupuncture combined with Chinese herbal medicine improved IBS symptoms, compared to what was noted in matched controls who were treated with Western medicine or with Western medicine combined with Chinese herbal medicine. The authors were cautious about the results of the meta-analysis, however, because the studies examined were small and of low quality, and presented a high risk of bias.57
Agents not to be used routinely for IBS
Loperamide. This peripheral µ-opioid receptor agonist controls diarrhea. However, recent studies showed no significant benefit to loperamide over placebo in IBS-M and IBS-D. In 2018, the FDA issued a safety alert regarding an elevated risk of serious cardiac adverse effects in patients taking loperamide. The ACG recommends against using loperamide to treat IBS symptoms.3,54
Polyethylene glycol. An osmotic laxative that is not absorbed in the intestinal lumen, polyethylene glycol is highly efficacious for alleviating constipation, but it does not reduce pain or other IBS symptoms. For that reason, the ACG recommends against its use.3
CORRESPONDENCE
Jose M. Villalon-Gomez, MD, MPH, Emory Healthcare Family Medicine, 4500 North Shallowford Road, Dunwoody, GA 30338; [email protected]
1. Lacy BE, Mearin F, Chang L, et al. Bowel disorders. Gastroenterology. 2016;150:1393-1407.e5. doi:10.1053/j.gastro.2016.02.031
2. What kind of poop do I have? WebMD. January 16, 2020. Accessed September 20, 2021. www.webmd.com/digestive-disorders/poop-chart-bristol-stool-scale
3. Ford AC, Moayyedi P, Chey WD, et al; . American College of Gastroenterology monograph on management of irritable bowel syndrome. Am J Gastroenterol. 2018;113(suppl 2):1-18. doi:10.1038/s41395-018-0084-x
4. Ferreira AI, Garrido M, Castro-Poças F. Irritable bowel syndrome: news from an old disorder. GE Port J Gastroenterol. 2020;27:255-268. doi:10.1159/000503757
5. Black CJ, Ford AC. Global burden of irritable bowel syndrome: trends, predictions and risk factors. Nat Rev Gastroenterol Hepatol. 2020;17:473-486. doi: 10.1038/s41575-020-0286-8
6. Frändemark Å, Törnblom H, Jakobsson S, et al. Work productivity and activity impairment in irritable bowel syndrome (IBS): a multifaceted problem: Am J Gastroenterol. 2018;113:1540-1549. doi:10.1038/s41395-018-0262-x
7. Poulsen CH, Eplov LF, Hjorthøj C, et al. Irritable bowel symptoms, use of healthcare, costs, sickness and disability pension benefits: a long-term population-based study. Scand J Public Health. 2019;47:867-875. doi:10.1177/1403494818776168
8. Hausteiner-Wiehle C, Henningsen P. Irritable bowel syndrome: relations with functional, mental, and somatoform disorders. World J Gastroenterol. 2014;20:6024-6030. doi:10.3748/wjg.v20.i20.6024
9. Moayyedi P, Mearin F, Azpiroz F, et al. Irritable bowel syndrome diagnosis and management: a simplified algorithm for clinical practice. United European Gastroenterol J. 2017;5:773-788. doi:10.1177/2050640617731968
10. Zhu S, Wang B, Jia Q, et al. Candidate single nucleotide polymorphisms of irritable bowel syndrome: a [systematic] review and meta-analysis. BMC Gastroenterology. 2019;19:165. doi:10.1186/s12876-019-1084-z
11. Simrén M, Törnblom H, Palsson OS, et al. Visceral hypersensitivity is associated with GI symptom severity in functional GI disorders: consistent findings from five different patient cohorts. Gut. 2018;67:255-262. doi:10.1136/gutjnl-2016-312361
12. Bashashati M, Moossavi S, Cremon C, et al. Colonic immune cells in irritable bowel syndrome: a systematic review and meta-analysis. Neurogastroenterol Motil. 2018;30:e13192. doi:10.1111/nmo.13192
13. Robles A, Ingles DP, Myneedu K, et al. Mast cells are increased in the small intestinal mucosa of patients with irritable bowel syndrome: a systematic review and meta-analysis. Neurogastroenterol Motil. 2019;31:e13718. doi:10.1111/nmo.13718
14. Bashashati M, Moradi M, Sarosiek I. Interleukin-6 in irritable bowel syndrome: A systematic review and meta-analysis of IL-6 (-G174C) and circulating IL-6 levels. Cytokine. 2017;99:132-138. doi:10.1016/j.cyto.2017.08.017
15. Bashashati M, Rezaei N, Shafieyoun A, et al. Cytokine imbalance in irritable bowel syndrome: a systematic review and meta-analysis. Neurogastroenterol Motil. 2014;26:1036-1048. doi:10.1111/nmo.12358
16. Sibelli A, Chalder T, Everitt H, et al. A systematic review with meta-analysis of the role of anxiety and depression in irritable bowel syndrome onset. Psychol Med. 2016;46:3065-3080. doi:10.1017/S0033291716001987
17. Yeh H-W, Chien W-C, Chung C-H, et al. Risk of psychiatric disorders in irritable bowel syndrome—a nationwide, population-based, cohort study. Int J Clin Pract. 2018;72:e13212. doi:10.1111/ijcp.13212
18. Duan R, Zhu S, Wang B, et al. Alterations of gut microbiota in patients with irritable bowel syndrome based on 16S rRNA-targeted sequencing: a systematic review. Clin Transl Gastroenterol. 2019;10:e00012. doi:10.14309/ctg.0000000000000012
19. Wang L, Alammar N, Singh R, et al. Gut microbial dysbiosis in the irritable bowel syndrome: a systematic review and meta-analysis of case-controlled studies. J Acad Nutr Diet. 2020;120:565-586. doi:10.1016/j.jand.2019.05.015
20. Barbara G, Grover M, Bercik P, et al. Rome Foundation working team report on post-infection irritable bowel syndrome. Gastroenterology. 2019;156:46-58.e7. doi:10.1053/j.gastro.2018.07.011
21. Klem F, Wadhwa A, Prokop LJ, et al. Prevalence, risk factors, and outcomes of irritable bowel syndrome after infectious enteritis: a systematic review and meta-analysis. Gastroenterology. 2017;152:1042-1054.e1. doi:10.1053/j.gastro.2016.12.039
22. Heidelbaugh JJ. These 3 tools can help you streamline management of IBS. J Fam Pract. 2017;66:346-353.
23. American College of Gastroenterology Task Force on Irritable Bowel Syndrome; Brandt LJ, Chey WD, Foxx-Orenstein AE, et al. An evidence-based position statement on the management of irritable bowel syndrome. Am J Gastroenterol. 2009;104(suppl 1):S1-S35. doi:10.1038/ajg.2008.122
24. Menees SB, Powell C, Kurlander J, et al. A meta-analysis of the utility of C-reactive protein, erythrocyte sedimentation rate, fecal calprotectin, and fecal lactoferrin to exclude inflammatory bowel disease in adults with IBS. Am J Gastroenterol. 2015;110:444-454. doi:10.1038/ajg.2015.6
25. Smalley W, Falck-Ytter C, Carrasco-Labra A, et al. AGA clinical practice guidelines on the laboratory evaluation of functional diarrhea and diarrhea-predominant irritable bowel syndrome in adults (IBS-D). Gastroenterology. 2019;157:851-854. doi:10.1053/j.gastro.2019.07.004
26. Markham A. Tenapanor: first approval. Drugs. 2019;79:1897-1903. doi:10.1007/s40265-019-01215-9
27. Chey WD, Paré P, Viegas A, et al. Tegaserod for female patients suffering from IBS with mixed bowel habits or constipation: a randomized controlled trial. Am J Gastroenterol. 2008;103:1217-1225. doi:10.1111/j.1572-0241.2008.01808.x
28. Zhou C, Zhao E, Li Y, et al. Exercise therapy of patients with irritable bowel syndrome: a systematic review of randomized controlled trials. Neurogastroenterol Motil. 2019;31:e13461. doi:10.1111/nmo.13461
29. Hustoft TN, Hausken T, Ystad SO, et al. Effects of varying dietary content of fermentable short-chain carbohydrates on symptoms, fecal microenvironment, and cytokine profiles in patients with irritable bowel syndrome. Neurogastroenterol Motil. 2017;29:e12969. doi:10.1111/nmo.12969
30. Zegarac JP. The low-FODMAP diet for IBS: what you need to know. Medscape. August 13, 2019. Accessed September 20, 2021. www.medscape.com/viewarticle/917069
31. Dionne J, Ford AC, Yuan Y, et al. A systematic review and meta-analysis evaluating the efficacy of a gluten-free diet and a low
32. Su H, Li Y-T, Heitkemper MM, et al. Effects of low-FODMAPS diet on irritable bowel syndrome symptoms and gut microbiome: Gastroenterol Nurs. 2019;42:150-158. doi:10.1097/SGA.0000000000000428
33. Nawawi KNM, Belov M, Goulding C. Low FODMAP diet significantly improves IBS symptoms: an Irish retrospective cohort study. Eur J Nutr. 2020;59:2237-2248. doi: 10.1007/s00394-019-02074-6
34. Altobelli E, Del Negro V, Angeletti PM, et al. Low-FODMAP diet improves irritable bowel syndrome symptoms: a meta-analysis. Nutrients. 2017;9:940. doi:10.3390/nu9090940
35. Nagarajan N, Morden A, Bischof D, et al. The role of fiber supplementation in the treatment of irritable bowel syndrome: a systematic review and meta-analysis. Eur J Gastroenterol Hepatol. 2015;27:1002-1010. doi:10.1097/MEG.0000000000000425
36. Wilson B, Rossi M, Dimidi E, et al. Prebiotics in irritable bowel syndrome and other functional bowel disorders in adults: a systematic review and meta-analysis of randomized controlled trials. Am J Clin Nutr. 2019;109:1098-1111. doi:10.1093/ajcn/nqy376
37. Yuan F, Ni H, Asche CV, et al. Efficacy of Bifidobacterium infantis 35624 in patients with irritable bowel syndrome: a meta-analysis. Curr Med Res Opin. 2017;33:1191-1197. doi:10.1080/03007995.2017.1292230
38. Liang D, Longgui N, Guoqiang X. Efficacy of different probiotic protocols in irritable bowel syndrome: a network meta-analysis. Medicine (Baltimore). 2019;98:16068. doi:10.1097/MD.0000000000016068
39. Dale HF, Rasmussen SH, Asiller ÖÖ, et al. Probiotics in irritable bowel syndrome: an up-to-date systematic review. Nutrients. 2019;11:2048. doi:10.3390/nu11092048
40. Pratt C, Campbell MD. The effect of Bifidobacterium on reducing symptomatic abdominal pain in patients with irritable bowel syndrome: a systematic review. Probiotics Antimicrob Proteins. 2020;12:834-839. doi:10.1007/s12602-019-09609-7
41. Ianiro G, Eusebi LH, Black CJ, et al. Systematic review with meta-analysis: efficacy of faecal microbiota transplantation for the treatment of irritable bowel syndrome. Aliment Pharmacol Ther. 2019;50:240-248. doi:10.1111/apt.15330
42. Myneedu K, Deoker A, Schmulson MJ, et al. Fecal microbiota transplantation in irritable bowel syndrome: a systematic review and meta-analysis. United European Gastroenterol J. 2019;7:1033-1041. doi:10.1177/2050640619866990
43. Xu D, Chen VL, Steiner CA, et al. Efficacy of fecal microbiota transplantation in irritable bowel syndrome: a systematic review and meta-analysis. Am J Gastroenterol. 2019;114:1043-1050. doi:10.14309/ajg.0000000000000198
44. Black CJ, Yuan Y, Selinger CP, et al. Efficacy of soluble fibre, antispasmodic drugs, and gut–brain neuromodulators in irritable bowel syndrome: a systematic review and network meta-analysis. Lancet Gastroenterol Hepatol. 2020;5:117-131. doi:10.1016/S2468-1253(19)30324-3
45. Khanna R, MacDonald JK, Levesque BG. Peppermint oil for the treatment of irritable bowel syndrome: a systematic review and meta-analysis. J Clin Gastroenterol. 2014;48:505-512. doi:10.1097/MCG.0b013e3182a88357
46. Alammar N, Wang L, Saberi B, et al. The impact of peppermint oil on the irritable bowel syndrome: a meta-analysis of the pooled clinical data. BMC Complement Altern Med. 2019;19:21. doi:10.1186/s12906-018-2409-0
47. Ford AC, Lacy BE, Harris LA, et al. Effect of antidepressants and psychological therapies in irritable bowel syndrome: an updated systematic review and meta-analysis. Am J Gastroenterol. 2019;114:21-39. doi: 10.1038/s41395-018-0222-5
48. Shah ED, Kim HM, Schoenfeld P. Efficacy and tolerability of guanylate cyclase-c agonists for irritable bowel syndrome with constipation and chronic idiopathic constipation: a systematic review and meta-analysis. Am J Gastroenterol. 2018;113:329-338. doi:10.1038/ajg.2017.495
49. Black CJ, Burr NE, Quigley EMM, et al. Efficacy of secretagogues in patients with irritable bowel syndrome with constipation: systematic review and network meta-analysis. Gastroenterology. 2018;155:1753-1763. doi:10.1053/j.gastro.2018.08.021
50. Li F, Fu T, Tong W-D, et al. Lubiprostone is effective in the treatment of chronic idiopathic constipation and irritable bowel syndrome: a systematic review and meta-analysis of randomized controlled trials. Mayo Clin Proc. 2016;91:456-468. doi:10.1016/j.mayocp.2016.01.015
51. Ford AC, Harris LA, Lacy BE, et al. Systematic review with meta-analysis: the efficacy of prebiotics, probiotics, synbiotics and antibiotics in irritable bowel syndrome. Aliment Pharmacol Ther. 2018;48:1044-1060. doi:10.1111/apt.15001
52. Yoon K, Kim N, Lee JY, et al. Clinical response of rifaximin treatment in patients with abdominal bloating. Korean J Gastroenterol. 2018;72:121-127. doi:10.4166/kjg.2018.72.3.121
53. Black CJ, Burr NE, Camilleri M, et al. Efficacy of pharmacological therapies in patients with IBS with diarrhoea or mixed stool pattern: systematic review and network meta-analysis. Gut. 2020;69:74-82. doi:10.1136/gutjnl-2018-318160
54. Lacy BE. Review article: an analysis of safety profiles of treatments for diarrhoea-predominant irritable bowel syndrome. Aliment Pharmacol Ther. 2018;48:817-830. doi:10.1111/apt.14948
55. Zheng Y, Yu T, Tang Y, et al. Efficacy and safety of 5-hydroxytryptamine 3 receptor antagonists in irritable bowel syndrome: a systematic review and meta-analysis of randomized controlled trials. PLOS ONE. 2017;12:e0172846. doi:10.1371/journal.pone.0172846
56. Zheng H, Chen R, Zhao X, et al. Comparison between the effects of acupuncture relative to other controls on irritable bowel syndrome: a meta-analysis. Pain Research and Management. 2019;2019:1-13. doi:https://doi.org/10.1155/2019/2871505
57. Yan J, Miao Z-W, Lu J, et al. Acupuncture plus Chinese herbal medicine for irritable bowel syndrome with diarrhea: a systematic review and meta-analysis. Evid Based Complement Alternat Med. 2019;2019:1-16. https://doi.org/10.1155/2019/7680963
PRACTICE RECOMMENDATIONS
› Make the diagnosis of irritable bowel syndrome (IBS) based on clinical findings, after excluding red flags in the presentation. C
› Screen patients with diarrhea-predominant IBS with fecal and serologic studies to rule out inflammatory bowel disease and celiac disease. B
› Counsel all IBS patients to increase their intake of soluble fiber, follow a low-FODMAP (fermentable oligo-, di-, and monosaccharide, and polyol) diet, and increase physical activity. B
› Prescribe an antispasmodic to treat mild IBS of all subtypes. B
Strength of recommendation (SOR)
A Good-quality patient-oriented evidence
B Inconsistent or limited-quality patient-oriented evidence
C Consensus, usual practice, opinion, disease-oriented evidence, case series