User login
UCLA/SVS Vascular Review Course Set
The Third Annual "UCLA / SVS Symposium: A Comprehensive Review and Update of What's New in Vascular and Endovascular Surgery," is set for Aug. 25 to 27 in California. This course is offered by the Division of Vascular and Endovascular Surgery at UCLA and the Society for Vascular Surgery. It provides an in-depth review of our specialty for those preparing to take the vascular board examinations as well as providing the basic didactic education for vascular residents and fellows in training.
The Third Annual "UCLA / SVS Symposium: A Comprehensive Review and Update of What's New in Vascular and Endovascular Surgery," is set for Aug. 25 to 27 in California. This course is offered by the Division of Vascular and Endovascular Surgery at UCLA and the Society for Vascular Surgery. It provides an in-depth review of our specialty for those preparing to take the vascular board examinations as well as providing the basic didactic education for vascular residents and fellows in training.
The Third Annual "UCLA / SVS Symposium: A Comprehensive Review and Update of What's New in Vascular and Endovascular Surgery," is set for Aug. 25 to 27 in California. This course is offered by the Division of Vascular and Endovascular Surgery at UCLA and the Society for Vascular Surgery. It provides an in-depth review of our specialty for those preparing to take the vascular board examinations as well as providing the basic didactic education for vascular residents and fellows in training.
Hope and hype: Inside the push for wearable diabetes technology
Want to make a billion dollars? Here’s a hot tip: Invent wearable technology that detects diabetes, measures glucose levels, and determines how much insulin is needed – all without the need for a single drop of blood.
If you accept this mission, there’s a catch: You’ll have a whole bunch of company. When it comes to using technology to free patients with diabetes from the dreaded finger stick, “hope springs eternal in the hearts of scientists, entrepreneurs, opportunists, and charlatans alike,” writes electrochemical specialist and consultant John L. Smith, PhD, in his book “The Pursuit of Noninvasive Glucose.”
Google and Apple have been in the hunt, along with countless makers of devices and software. A noninvasive glucose monitoring system is the prime target, but there’s also plenty of interest in software that puts data from such devices as heartbeat sensors to work.

For the moment, however, results are elusive, and the name of the game is hype.
Early failure has a lasting impact
In the beginning, there was Glucowatch. And it was not good.
The GlucoWatch G2 Biographer product received approval from the Food and Drug Administration back in 2001 and touted as a high-tech tool to monitor glucose levels via interstitial concentrations every 10 minutes. The device promised to draw glucose to the skin surface for measurement via electric shocks, and alarms were to go off when hypoglycemia or hyperglycemia was detected.
But numerous problems cropped up. There was a time lag, with the device estimating glucose levels that actually occurred 15-20 minutes earlier. Some patients couldn’t tolerate wearing the watch, and some were burned by the electric current.
And perhaps worst of all, the measurements often weren’t accurate, with one study finding that more than half of 240 nighttime alarms incorrectly warned children with diabetes of dangerously high or low glucose. (Diabetes Technol Ther. 2005 June; 7[3]:440-7).
As a result of the Glucowatch debacle, the FDA “become a little gun shy about approving anything. It made it even harder to approve something,” said Mark J. Rice, MD, of Vanderbilt University, Nashville, Tenn., who has tried to develop glucose-measuring technology.

“If a device were to be commercialized, it would be hugely disruptive to the industry,” according to Dr. Baers, who said that she expects a device eventually will lead to higher levels of diabetes control and fewer side effects. “This would result in billion-dollar savings for the health care industry and reduced complications,” she said.
On tech front, promises and more promises
So far, there have been more promises than actual products.
If you don’t look too closely at the website of a device called GlucoWise, you might assume a noninvasive glucose monitor already exists. Under a photo of a smiling woman, the site promises a “100% pain-free device that makes traditional blood sampling a thing of the past.”
The “simple yet highly reliable” device, which looks a bit like a large clip for a potato chip bag, promises to measure glucose through high-frequency radio waves that penetrate thin body tissue in the earlobe or the area between the thumb and forefinger.
But the GlucoWise device is neither approved nor available, and the company’s predictions that it would take preorders by late 2016 didn’t come true.
Another product called SugarBEAT missed its planned 2016 release and now hopes to be available in the Britain later this year. It promises to measure glucose levels every 5 minutes via a small disposable patch that draws interstitial fluid from the skin.
Meanwhile, Apple has enlisted biomedical engineers to work on a secret project to measure glucose continuously and noninvasively, CNBC reported last year. And Google announced in 2014 that it was working on a glucose-detecting contact lens that could alert patients via tiny LED lights – yes, apparently in the lenses themselves – if levels go too high or low. But neither of these technologies is ready for prime time.
Sneaky glucose molecules elude scientists
According to Dr. Rice, no truly noninvasive glucose-measuring technique has worked so far.
The challenge, he said, is that it’s difficult to measure tiny glucose molecules, which have no color and share many characteristics with H2O.
“The real problem is trying to measure a colorless molecule in a sea of water,” Dr. Rice said.
Glucose lab tests rely on indicators from reactions with other substances, he said, “but you can’t do that in the body.” Measuring glucose in tears or urine is one possibility, he said, but the scarcity in those liquids poses a challenge: “Your body doesn’t want to spill glucose and lose energy.”
Dr. Rice himself explored a glucose-measuring technique that aimed to correlate glucose levels to the speed of the retina’s reaction to light. The idea was that patients would wear special glasses that would shine a light in the eye at the press of a button. The project ultimately failed.
There are other challenges, said Dr. Baers, the technology adviser. “Glucose concentrations in sweat or tears are not reflective of blood glucose concentrations. To make things even more challenging, glucose levels in these fluids are orders of magnitude smaller than that found in blood.”
And, she said, there’s a time lag between glucose levels in blood and in other body fluids. “This means that a sweat glucose level is really giving information from an hour previous, which can be dangerous if you’re operating machinery or driving.”
Wearable diabetes tech targets more than glucose
There’s more to wearable, noninvasive diabetes technology than glucose-monitoring. One of the new frontiers is diagnostics.
Earlier this year, researchers from the University of California at San Francisco and the digital startup Cardiogram reported that they were able to use data from digital heart rate sensors (like those found in Apple Watches, Fitbits and other devices) to correctly detect diabetes in patients.
In a study presented at the 2018 meeting of the Association for the Advancement of Artificial Intelligence, the researchers said they detected diabetes in 85% of 462 participants (out of a pool of 14,011) who’d previously been diagnosed with the condition (AAAAI abstract arXiv:1802.02511v1 [cs.LG]).

The next step is to test whether the data analysis can detect undiagnosed diabetes, Mr. Ballinger said.
As tech advances, questions remain
San Diego’s Scripps Whittier Diabetes Institute is another player in the diabetes/digital health world. It’s currently working on several clinical trials of diabetes technology, including a study into whether older adults with type 1 diabetes will benefit from a continuous glucose monitoring device with a wireless connection.

Devices that measure glucose can also suffer from errors in transmission, she said. And the existing continuous glucose monitors have trouble with accuracy at the very highest and lowest glucose levels, she said, although they are improving.
There are other questions about future wearable technology for diabetes: Will the devices cost more than continuous glucose monitoring systems (CGM), which are already pricey? How will private health information be protected? (As Mr. Ballinger noted, “wearable data itself is out of the scope of HIPAA.”) And will patients actually take action when their devices diagnose diabetes or warn them that their glucose levels are out of whack?
CGM systems provide insight into the latter issue. Repeated alarms about highs and lows can drive patients crazy, Dr. Philis-Tsimikas said. “You might end up with alarm fatigue and annoyance. They might hit a 250, but they won’t want the alarm to go off, and they don’t want to be reminded of it,” she said. “And they might go down to 60-80 at night, but they don’t want to be woken up because they’re used to that range.”
Even if patients do pay attention to their diabetes devices, they may not take the proper action. Dr. Philis-Tsimikas pointed to a 2016 study that found adding an exercise-tracking device to traditional weight-loss intervention didn’t lead to more weight loss. In fact, those who used the device actually loss less weight. (JAMA. 2016;316[11]:1161-71)
The lesson? “There has to be a combination of some education together with the physiologic information,” she said. For now, the good news is that “we still have other options,” Dr. Philis-Tsimikas said. The newly released CGM system known as the Freestyle Libre, she said, is one alternative.
And she mentioned another technique that’s still around. You could call it Old Faithful: the low-tech, high-hassle but highly accurate finger stick.
Dr. Baers and Dr. Rice report no disclosures. Dr. Philis-Tsimikas has no disclosures but notes that Scripps Whittier Diabetes Institute receives grants and funding in the diabetes field and works with a number of drug makers and device makers. Mr. Ballinger discloses salary and equity from Cardiogram.
Want to make a billion dollars? Here’s a hot tip: Invent wearable technology that detects diabetes, measures glucose levels, and determines how much insulin is needed – all without the need for a single drop of blood.
If you accept this mission, there’s a catch: You’ll have a whole bunch of company. When it comes to using technology to free patients with diabetes from the dreaded finger stick, “hope springs eternal in the hearts of scientists, entrepreneurs, opportunists, and charlatans alike,” writes electrochemical specialist and consultant John L. Smith, PhD, in his book “The Pursuit of Noninvasive Glucose.”
Google and Apple have been in the hunt, along with countless makers of devices and software. A noninvasive glucose monitoring system is the prime target, but there’s also plenty of interest in software that puts data from such devices as heartbeat sensors to work.
For the moment, however, results are elusive, and the name of the game is hype.
Early failure has a lasting impact
In the beginning, there was Glucowatch. And it was not good.
The GlucoWatch G2 Biographer product received approval from the Food and Drug Administration back in 2001 and touted as a high-tech tool to monitor glucose levels via interstitial concentrations every 10 minutes. The device promised to draw glucose to the skin surface for measurement via electric shocks, and alarms were to go off when hypoglycemia or hyperglycemia was detected.
But numerous problems cropped up. There was a time lag, with the device estimating glucose levels that actually occurred 15-20 minutes earlier. Some patients couldn’t tolerate wearing the watch, and some were burned by the electric current.
And perhaps worst of all, the measurements often weren’t accurate, with one study finding that more than half of 240 nighttime alarms incorrectly warned children with diabetes of dangerously high or low glucose. (Diabetes Technol Ther. 2005 June; 7[3]:440-7).
As a result of the Glucowatch debacle, the FDA “become a little gun shy about approving anything. It made it even harder to approve something,” said Mark J. Rice, MD, of Vanderbilt University, Nashville, Tenn., who has tried to develop glucose-measuring technology.
“If a device were to be commercialized, it would be hugely disruptive to the industry,” according to Dr. Baers, who said that she expects a device eventually will lead to higher levels of diabetes control and fewer side effects. “This would result in billion-dollar savings for the health care industry and reduced complications,” she said.
On tech front, promises and more promises
So far, there have been more promises than actual products.
If you don’t look too closely at the website of a device called GlucoWise, you might assume a noninvasive glucose monitor already exists. Under a photo of a smiling woman, the site promises a “100% pain-free device that makes traditional blood sampling a thing of the past.”
The “simple yet highly reliable” device, which looks a bit like a large clip for a potato chip bag, promises to measure glucose through high-frequency radio waves that penetrate thin body tissue in the earlobe or the area between the thumb and forefinger.
But the GlucoWise device is neither approved nor available, and the company’s predictions that it would take preorders by late 2016 didn’t come true.
Another product called SugarBEAT missed its planned 2016 release and now hopes to be available in the Britain later this year. It promises to measure glucose levels every 5 minutes via a small disposable patch that draws interstitial fluid from the skin.
Meanwhile, Apple has enlisted biomedical engineers to work on a secret project to measure glucose continuously and noninvasively, CNBC reported last year. And Google announced in 2014 that it was working on a glucose-detecting contact lens that could alert patients via tiny LED lights – yes, apparently in the lenses themselves – if levels go too high or low. But neither of these technologies is ready for prime time.
Sneaky glucose molecules elude scientists
According to Dr. Rice, no truly noninvasive glucose-measuring technique has worked so far.
The challenge, he said, is that it’s difficult to measure tiny glucose molecules, which have no color and share many characteristics with H2O.
“The real problem is trying to measure a colorless molecule in a sea of water,” Dr. Rice said.
Glucose lab tests rely on indicators from reactions with other substances, he said, “but you can’t do that in the body.” Measuring glucose in tears or urine is one possibility, he said, but the scarcity in those liquids poses a challenge: “Your body doesn’t want to spill glucose and lose energy.”
Dr. Rice himself explored a glucose-measuring technique that aimed to correlate glucose levels to the speed of the retina’s reaction to light. The idea was that patients would wear special glasses that would shine a light in the eye at the press of a button. The project ultimately failed.
There are other challenges, said Dr. Baers, the technology adviser. “Glucose concentrations in sweat or tears are not reflective of blood glucose concentrations. To make things even more challenging, glucose levels in these fluids are orders of magnitude smaller than that found in blood.”
And, she said, there’s a time lag between glucose levels in blood and in other body fluids. “This means that a sweat glucose level is really giving information from an hour previous, which can be dangerous if you’re operating machinery or driving.”
Wearable diabetes tech targets more than glucose
There’s more to wearable, noninvasive diabetes technology than glucose-monitoring. One of the new frontiers is diagnostics.
Earlier this year, researchers from the University of California at San Francisco and the digital startup Cardiogram reported that they were able to use data from digital heart rate sensors (like those found in Apple Watches, Fitbits and other devices) to correctly detect diabetes in patients.
In a study presented at the 2018 meeting of the Association for the Advancement of Artificial Intelligence, the researchers said they detected diabetes in 85% of 462 participants (out of a pool of 14,011) who’d previously been diagnosed with the condition (AAAAI abstract arXiv:1802.02511v1 [cs.LG]).
The next step is to test whether the data analysis can detect undiagnosed diabetes, Mr. Ballinger said.
As tech advances, questions remain
San Diego’s Scripps Whittier Diabetes Institute is another player in the diabetes/digital health world. It’s currently working on several clinical trials of diabetes technology, including a study into whether older adults with type 1 diabetes will benefit from a continuous glucose monitoring device with a wireless connection.
Devices that measure glucose can also suffer from errors in transmission, she said. And the existing continuous glucose monitors have trouble with accuracy at the very highest and lowest glucose levels, she said, although they are improving.
There are other questions about future wearable technology for diabetes: Will the devices cost more than continuous glucose monitoring systems (CGM), which are already pricey? How will private health information be protected? (As Mr. Ballinger noted, “wearable data itself is out of the scope of HIPAA.”) And will patients actually take action when their devices diagnose diabetes or warn them that their glucose levels are out of whack?
CGM systems provide insight into the latter issue. Repeated alarms about highs and lows can drive patients crazy, Dr. Philis-Tsimikas said. “You might end up with alarm fatigue and annoyance. They might hit a 250, but they won’t want the alarm to go off, and they don’t want to be reminded of it,” she said. “And they might go down to 60-80 at night, but they don’t want to be woken up because they’re used to that range.”
Even if patients do pay attention to their diabetes devices, they may not take the proper action. Dr. Philis-Tsimikas pointed to a 2016 study that found adding an exercise-tracking device to traditional weight-loss intervention didn’t lead to more weight loss. In fact, those who used the device actually loss less weight. (JAMA. 2016;316[11]:1161-71)
The lesson? “There has to be a combination of some education together with the physiologic information,” she said. For now, the good news is that “we still have other options,” Dr. Philis-Tsimikas said. The newly released CGM system known as the Freestyle Libre, she said, is one alternative.
And she mentioned another technique that’s still around. You could call it Old Faithful: the low-tech, high-hassle but highly accurate finger stick.
Dr. Baers and Dr. Rice report no disclosures. Dr. Philis-Tsimikas has no disclosures but notes that Scripps Whittier Diabetes Institute receives grants and funding in the diabetes field and works with a number of drug makers and device makers. Mr. Ballinger discloses salary and equity from Cardiogram.
SVS Seeks Medical Editor for ‘Vascular Specialist’
SVS is accepting applications for Medical Editor of "Vascular Specialist," the monthly news periodical produced by SVS. The editor can expect to spend approximately 10-20 hours each month in the three weeks leading up to publication. A modest annual honorarium is provided. Previous editorial experience will be helpful. Please send letters of interest by April 15 to Kenneth M. Slaw, Ph.D., at [email protected]. He will forward your interest to the SVS Publications Committee for consideration. More information is in the March 29 issue of Pulse.
SVS is accepting applications for Medical Editor of "Vascular Specialist," the monthly news periodical produced by SVS. The editor can expect to spend approximately 10-20 hours each month in the three weeks leading up to publication. A modest annual honorarium is provided. Previous editorial experience will be helpful. Please send letters of interest by April 15 to Kenneth M. Slaw, Ph.D., at [email protected]. He will forward your interest to the SVS Publications Committee for consideration. More information is in the March 29 issue of Pulse.
SVS is accepting applications for Medical Editor of "Vascular Specialist," the monthly news periodical produced by SVS. The editor can expect to spend approximately 10-20 hours each month in the three weeks leading up to publication. A modest annual honorarium is provided. Previous editorial experience will be helpful. Please send letters of interest by April 15 to Kenneth M. Slaw, Ph.D., at [email protected]. He will forward your interest to the SVS Publications Committee for consideration. More information is in the March 29 issue of Pulse.
Metformin reduces preterm births, late miscarriages in PCOS
CHICAGO – , preterm births and late miscarriages were reduced, but researchers saw no effect on blood glucose levels or other diabetes-related maternal outcomes.
A Nordic study of pregnant women, dubbed PregMet 2, followed the course of 487 women with PCOS who were randomized to take 2,000 mg of metformin or placebo daily during pregnancy.

Among the entire study population, those with PCOS who took placebo had a 9.6% incidence of late miscarriage or preterm birth. For those taking metformin, the figure was 5%, similar to the 5.2% risk seen in the population-wide Norwegian Birth Registry, said Dr. Løvvik, of the Norwegian University of Science and Technology, Trondheim.
This analysis yielded a number needed to treat (NNT) for benefit of metformin of 22, she said.
However, Dr. Løvvik said that “the elephant in the room” is the lack of benefit of metformin for rates of gestational diabetes, hypertension in pregnancy, or preeclampsia in PregMet 2.
Of the various endpoint analyses, “the most surprising and striking one is the absolute lack of effect on gestational diabetes in this high-risk population,” said Dr. Løvvik. “There’s not even a tendency towards effect. … Metformin had no effect on prevention, treatment, or the need for additional insulin, indicating it was actually as effective as placebo.”
Considering that “metformin is now a part of the standard treatment for gestational diabetes, according to many national guidelines, we think that it’s questionable that it’s never, ever been tested against placebo for this diagnosis,” said Dr. Løvvik.
Pregnant women with PCOS have an increased risk of complications, and metformin is often prescribed off label to attempt to address some of these complications. Some previous work had shown metformin to be helpful, but previous studies have been underpowered, said Dr. Løvvik.
PregMet 2’s protocol attempted to address the literature gap; over 3 years, it called for enrollment of 1,000 women in the first trimester of pregnancy, randomized 1:1 to receive metformin or placebo in pregnancy.
At that enrollment level, the study would aim to show a 50% reduction in late miscarriages and preterm birth, with a power of 85%. Two predetermined analysis were planned at the end of the 3-year study, one for the intent-to-treat population and one for the per-protocol group.
In the end, however, just 487 patients were enrolled and randomized over a period of 5 years, despite recruitment at 14 centers in Iceland, Norway, and Sweden.
Richard Legro, MD, an ob.gyn. from Pennsylvania State University, Hershey, was in attendance. While praising the overall high quality of the study, he commented, “The primary concern is that you stopped the study when you hadn’t even achieved half your sample size.”
Dr. Løvvik said that a variety of factors contributed to the low study enrollment. One primary issue was that participation required additional visits on the part of participants; the study was not part of routine prenatal care, she said. Also, the placebo used in the study expired before enrollment was completed, complicating execution of the study.
She also noted that nearly a quarter of patients had a history of depression, and one in five had a history of migraine. More than half of patients overall had at least one previous or ongoing chronic medical condition.
A small number of patients in each group were excluded for protocol violations, pregnancy termination, intrauterine fetal demise, or loss to follow-up. The final intent-to-treat population included 238 in the metformin group and 240 who received placebo.
The per-protocol analysis was conducted two ways: In the first analysis, only those who dropped out were excluded, leaving 209 in the metformin group and 223 in the placebo group. The second analysis included those whose adherence to taking the study medication was assessed at 90% or better. For this second per-protocol analysis, just 142 metformin takers and 156 in the placebo group remained.
In the intent-to-treat population, the primary endpoint – a composite outcome of late miscarriage and preterm delivery – yielded an odds ratio of 1.99 favoring metformin over placebo, a figure that fell short of statistical significance (95% confidence interval, 0.93-4.51; P = .08).
However, there was significantly less weight gain in those taking metformin in this population (8.7 vs. 11.48 kg; P less than .0001). And newborns had significantly larger head circumferences if their mothers with PCOS took metformin (35.4 vs. 35.0 cm; P = .006).
Dr. Løvvik and her colleagues subsequently performed the same analysis on the first per-protocol group, one that excluded the 46 patients who were early dropouts after randomization. Here, the odds ratio favoring metformin for the composite primary outcome measure was a significant 2.55 (n = 432; 95% CI, 1.10-6.42; P = .03). Results for the final per-protocol analysis that excluded dropouts and those with less than 90% adherence to study medication were similar, with an odds ratio of 2.76 in favor of metformin use during pregnancy (n = 298; 95% CI, 1.0-8.82; P = .05).
In response to an audience question, Dr. Løvvik said that, though a per-protocol analysis of some sort had been predetermined, the decision to perform the narrower analysis on the highly adherent group was made later. However, compared to thresholds for adherence in other studies, “ours was way higher – so it’s too strict,” she acknowledged.
At baseline, the median age overall was about 30 years, and the median body mass index was about 28 kg/m2. Patients were at a median 74 days gestational age of pregnancy at randomization, and 53%-61% of patients were on metformin at the time of conception, with no significant difference between the metformin and placebo group.
A little less than half (40%-46%) of participants had a spontaneous conception, and most participants (56%-59%) had no prior term deliveries. Participants were overwhelmingly (91%-97%) white and Nordic.
There were no serious maternal, fetal, or neonatal safety signals in either study group.
The study followed the earlier PregMet study, which also tracked use of metformin in pregnancy for women with PCOS.
CHICAGO – , preterm births and late miscarriages were reduced, but researchers saw no effect on blood glucose levels or other diabetes-related maternal outcomes.
A Nordic study of pregnant women, dubbed PregMet 2, followed the course of 487 women with PCOS who were randomized to take 2,000 mg of metformin or placebo daily during pregnancy.
Among the entire study population, those with PCOS who took placebo had a 9.6% incidence of late miscarriage or preterm birth. For those taking metformin, the figure was 5%, similar to the 5.2% risk seen in the population-wide Norwegian Birth Registry, said Dr. Løvvik, of the Norwegian University of Science and Technology, Trondheim.
This analysis yielded a number needed to treat (NNT) for benefit of metformin of 22, she said.
However, Dr. Løvvik said that “the elephant in the room” is the lack of benefit of metformin for rates of gestational diabetes, hypertension in pregnancy, or preeclampsia in PregMet 2.
Of the various endpoint analyses, “the most surprising and striking one is the absolute lack of effect on gestational diabetes in this high-risk population,” said Dr. Løvvik. “There’s not even a tendency towards effect. … Metformin had no effect on prevention, treatment, or the need for additional insulin, indicating it was actually as effective as placebo.”
Considering that “metformin is now a part of the standard treatment for gestational diabetes, according to many national guidelines, we think that it’s questionable that it’s never, ever been tested against placebo for this diagnosis,” said Dr. Løvvik.
Pregnant women with PCOS have an increased risk of complications, and metformin is often prescribed off label to attempt to address some of these complications. Some previous work had shown metformin to be helpful, but previous studies have been underpowered, said Dr. Løvvik.
PregMet 2’s protocol attempted to address the literature gap; over 3 years, it called for enrollment of 1,000 women in the first trimester of pregnancy, randomized 1:1 to receive metformin or placebo in pregnancy.
At that enrollment level, the study would aim to show a 50% reduction in late miscarriages and preterm birth, with a power of 85%. Two predetermined analysis were planned at the end of the 3-year study, one for the intent-to-treat population and one for the per-protocol group.
In the end, however, just 487 patients were enrolled and randomized over a period of 5 years, despite recruitment at 14 centers in Iceland, Norway, and Sweden.
Richard Legro, MD, an ob.gyn. from Pennsylvania State University, Hershey, was in attendance. While praising the overall high quality of the study, he commented, “The primary concern is that you stopped the study when you hadn’t even achieved half your sample size.”
Dr. Løvvik said that a variety of factors contributed to the low study enrollment. One primary issue was that participation required additional visits on the part of participants; the study was not part of routine prenatal care, she said. Also, the placebo used in the study expired before enrollment was completed, complicating execution of the study.
She also noted that nearly a quarter of patients had a history of depression, and one in five had a history of migraine. More than half of patients overall had at least one previous or ongoing chronic medical condition.
A small number of patients in each group were excluded for protocol violations, pregnancy termination, intrauterine fetal demise, or loss to follow-up. The final intent-to-treat population included 238 in the metformin group and 240 who received placebo.
The per-protocol analysis was conducted two ways: In the first analysis, only those who dropped out were excluded, leaving 209 in the metformin group and 223 in the placebo group. The second analysis included those whose adherence to taking the study medication was assessed at 90% or better. For this second per-protocol analysis, just 142 metformin takers and 156 in the placebo group remained.
In the intent-to-treat population, the primary endpoint – a composite outcome of late miscarriage and preterm delivery – yielded an odds ratio of 1.99 favoring metformin over placebo, a figure that fell short of statistical significance (95% confidence interval, 0.93-4.51; P = .08).
However, there was significantly less weight gain in those taking metformin in this population (8.7 vs. 11.48 kg; P less than .0001). And newborns had significantly larger head circumferences if their mothers with PCOS took metformin (35.4 vs. 35.0 cm; P = .006).
Dr. Løvvik and her colleagues subsequently performed the same analysis on the first per-protocol group, one that excluded the 46 patients who were early dropouts after randomization. Here, the odds ratio favoring metformin for the composite primary outcome measure was a significant 2.55 (n = 432; 95% CI, 1.10-6.42; P = .03). Results for the final per-protocol analysis that excluded dropouts and those with less than 90% adherence to study medication were similar, with an odds ratio of 2.76 in favor of metformin use during pregnancy (n = 298; 95% CI, 1.0-8.82; P = .05).
In response to an audience question, Dr. Løvvik said that, though a per-protocol analysis of some sort had been predetermined, the decision to perform the narrower analysis on the highly adherent group was made later. However, compared to thresholds for adherence in other studies, “ours was way higher – so it’s too strict,” she acknowledged.
At baseline, the median age overall was about 30 years, and the median body mass index was about 28 kg/m2. Patients were at a median 74 days gestational age of pregnancy at randomization, and 53%-61% of patients were on metformin at the time of conception, with no significant difference between the metformin and placebo group.
A little less than half (40%-46%) of participants had a spontaneous conception, and most participants (56%-59%) had no prior term deliveries. Participants were overwhelmingly (91%-97%) white and Nordic.
There were no serious maternal, fetal, or neonatal safety signals in either study group.
The study followed the earlier PregMet study, which also tracked use of metformin in pregnancy for women with PCOS.
REPORTING FROM ENDO 2018
Key clinical point: Metformin reduced the rate of late preterm births and miscarriages in pregnant women with PCOS.
Major finding: The rate of the composite outcome was 5% for those on metformin, with a NNT of 22.
Study details: Randomized placebo-controlled trial of 487 pregnant women.
Disclosures: None of the study authors reported conflicts of interest.
Source: Løvvik T et al. ENDO 2018, Abstract 33-4.
A SNF-based enhanced care program may help reduce 30-day readmissions
Background: The acuity of many patients recently discharged from an acute care facility is high. Some of these patients are being transferred to a SNF upon hospital discharge. Currently existing SNF care systems may not be prepared sufficiently for the challenges that arise with the admission of such patients to the SNFs after hospital discharge, resulting in readmissions.
Study design: Observational, retrospective cohort analysis.
Setting: Collaborative effort among a large, urban, acute care center, interdisciplinary clinical team, 124 community physicians, and eight SNFs.
Synopsis: In addition to standard care, the Enhanced Care Program (ECP) included a team of nurse practitioners participating in the care of SNF patients, a pharmacist-driven medication reconciliation at the time of transfer, and educational in-services for SNF nursing staff. Following introduction of the three ECP interventions, 30-day readmission rates were compared for both ECP and non-ECP patient groups. After adjustment for sociodemographic and clinical characteristics, ECP patients had 29% lower odds of being readmitted within 30 days (P less than .001). Multivariate analyses confirmed similar results. Major caveats include that this was a single-hospital study and that selection of the enrolled patients was not random, but rather, was determined by their primary care providers, potentially leading to some confounding.
Bottom line: For patients discharged to SNFs, an interdisciplinary care approach may reduce 30-day hospital readmissions.
Citation: Rosen BT et al. The Enhanced Care Program: Impact of a care transition program on 30-day hospital readmissions for patients discharged from an acute care facility to skilled nursing facilities. J Hosp Med. 2017 Oct 4:E1-E7. doi: 10.12788/jhm.2852

Dr. Burklin is assistant professor of medicine in the division of hospital medicine, Emory University, Atlanta.
Background: The acuity of many patients recently discharged from an acute care facility is high. Some of these patients are being transferred to a SNF upon hospital discharge. Currently existing SNF care systems may not be prepared sufficiently for the challenges that arise with the admission of such patients to the SNFs after hospital discharge, resulting in readmissions.
Study design: Observational, retrospective cohort analysis.
Setting: Collaborative effort among a large, urban, acute care center, interdisciplinary clinical team, 124 community physicians, and eight SNFs.
Synopsis: In addition to standard care, the Enhanced Care Program (ECP) included a team of nurse practitioners participating in the care of SNF patients, a pharmacist-driven medication reconciliation at the time of transfer, and educational in-services for SNF nursing staff. Following introduction of the three ECP interventions, 30-day readmission rates were compared for both ECP and non-ECP patient groups. After adjustment for sociodemographic and clinical characteristics, ECP patients had 29% lower odds of being readmitted within 30 days (P less than .001). Multivariate analyses confirmed similar results. Major caveats include that this was a single-hospital study and that selection of the enrolled patients was not random, but rather, was determined by their primary care providers, potentially leading to some confounding.
Bottom line: For patients discharged to SNFs, an interdisciplinary care approach may reduce 30-day hospital readmissions.
Citation: Rosen BT et al. The Enhanced Care Program: Impact of a care transition program on 30-day hospital readmissions for patients discharged from an acute care facility to skilled nursing facilities. J Hosp Med. 2017 Oct 4:E1-E7. doi: 10.12788/jhm.2852
Dr. Burklin is assistant professor of medicine in the division of hospital medicine, Emory University, Atlanta.
Gallstones: Watch and wait, or intervene?
The prevalence of gallstones is approximately 10% to 15% of the adult US population.1,2 Most cases are asymptomatic, as gallstones are usually discovered incidentally during routine imaging for other abdominal conditions, and only about 20% of patients with asymptomatic gallstones develop clinically significant complications.2,3
Nevertheless, gallstones carry significant healthcare costs. In 2004, the median inpatient cost for any gallstone-related disease was $11,584, with an overall annual cost of $6.2 billion.4,5
Laparoscopic cholecystectomy is the standard treatment for symptomatic cholelithiasis. For asymptomatic cholelithasis, the usual approach is expectant management (“watch and wait”), but prophylactic cholecystectomy may be an option in certain patients at high risk.
CHEMICAL COMPOSITION
Gallstones can be classified into 2 main categories based on their predominant chemical composition: cholesterol or pigment.
Cholesterol gallstones
About 75% of gallstones are composed of cholesterol.3,4 In the past, this type of stone was thought to be caused by gallbladder inflammation, bile stasis, and absorption of bile salts from damaged mucosa. However, it is now known that cholesterol gallstones are the result of biliary supersaturation caused by cholesterol hypersecretion into the gallbladder, gallbladder hypomotility, accelerated cholesterol nucleation and crystallization, and mucin gel accumulation.
Pigment gallstones
Black pigment gallstones account for 10% to 15% of all gallstones.6 They are caused by chronic hemolysis in association with supersaturation of bile with calcium hydrogen bilirubinate, along with deposition of calcium carbonate, phosphate, and inorganic salts.7
Brown pigment stones, accounting for 5% to 10% of all gallstones,6 are caused by infection in the obstructed bile ducts, where bacteria that produce beta-glucuronidase, phospholipase, and slime contribute to formation of the stone.8,9
RISK FACTORS FOR GALLSTONES

Age. After age 40, the risk increases dramatically, with an incidence 4 times higher for those ages 40 to 69 than in younger people.10
Female sex. Women of reproductive age are 4 times more likely to develop gallstones than men, but this gap narrows after menopause.11 The higher risk is attributed to female sex hormones, pregnancy, and oral contraceptive use. Estrogen decreases secretion of bile salts and increases secretion of cholesterol into the gallbladder, which leads to cholesterol supersaturation. Progesterone acts synergistically by causing hypomobility of the gallbladder, which in turn leads to bile stasis.12,13
Ethnicity. The risk is higher in Mexican Americans and Native Americans than in other ethnic groups.14
Rapid weight loss, such as after bariatric surgery, occurs from decreased caloric intake and promotes bile stasis, while lipolysis increases cholesterol mobilization and secretion into the gallbladder. This creates an environment conducive to bile supersaturation with cholesterol, leading to gallstone formation.
Chronic hemolytic disorders carry an increased risk of developing calcium bilirubinate stones due to increased excretion of bilirubin during hemolysis.
Obesity and diabetes mellitus are both attributed to insulin resistance. Obesity also increases bile stasis and cholesterol saturation.
CLINICAL PRESENTATION OF GALLSTONES (CHOLELITHIASIS)
Most patients with gallstones (cholelithiasis) experience no symptoms. Their gallstones are often discovered incidentally during imaging tests for unrelated or unexplained abdominal symptoms. Most patients with asymptomatic gallstones remain symptom-free, while about 20% develop gallstone-related symptoms.2,3
Abdominal pain is the most common symptom. The phrase biliary colic—suggesting pain that is fluctuating in nature—appears ubiquitously in the medical literature, but it does not correctly characterize the pain associated with gallstones.
Most patients with gallstone symptoms describe a constant and often severe pain in the right upper abdomen, epigastrium, or both, often persisting for 30 to 120 minutes. Symptoms are frequently reported in the epigastrium when only visceral pain fibers are stimulated due to gallbladder distention. This is usually called midline pain; however, pain occurs in the back and right shoulder in up to 60% of patients, with involvement of somatic fibers.15,16 Gallstone pain is not relieved by change of position or passage of stool or gas.
Onset of symptoms more than an hour after eating or in the late evening or at night also very strongly suggests biliary pain. Patients with a history of biliary pain are more likely to experience it again, with a 69% chance of developing recurrent pain within 2 years.17
GALLSTONE-RELATED COMPLICATIONS

Acute gallbladder inflammation (cholecystitis)
Gallbladder inflammation (cholecystitis) is the most common complication, occurring in up to 10% of symptomatic cases. Many patients with acute cholecystitis present with right upper quadrant pain that may be accompanied by anorexia, nausea, or vomiting. Inspiratory arrest on deep palpation of the right upper quadrant (Murphy sign) has a specificity of 79% to 96% for acute cholecystitis.20 Markers of systemic inflammation such as fever, elevated white blood cell count, and elevated C-reactive protein are highly suggestive of acute cholecystitis.20,21
Bile duct stones (choledocholithiasis)
Bile duct stones (choledocholithiasis) are detected in 3.4% to 12% of patients with gallstones.22,23 Most stones in the common bile duct migrate there from the gallbladder via the cystic duct. Less commonly, primary duct stones form in the duct due to biliary stasis. Removing the gallbladder does not completely eliminate the risk of bile duct stones, as stones can remain or recur after surgery.
Bile duct stones can obstruct the common bile duct, which disrupts normal bile flow and leads to jaundice. Other symptoms may include pruritus, right upper quadrant pain, nausea, and vomiting. Serum levels of bilirubin, aspartate aminotransferase, alanine aminotransferase (ALT), and alkaline phosphatase are usually high.24
Acute bacterial infection (cholangitis)
Acute bacterial infection of the biliary system (cholangitis) is usually associated with obstruction of the common bile duct. Common symptoms of acute cholangitis include right upper quadrant pain, fever, and jaundice (Charcot triad), and these are present in about 50% to 75% of cases.21 In severe cases, patients can develop altered mental status and septicemic shock in addition to the Charcot triad, a condition called the Reynold pentad. White blood cell counts and serum levels of C-reactive protein, bilirubin, aminotransferases, and alkaline phosphatase are usually elevated.21
Pancreatitis
Approximately 4% to 8% of patients with gallstones develop inflammation of the pancreas (pancreatitis).25 The diagnosis of acute pancreatitis requires at least 2 of the following:26,27
- Abdominal pain (typically epigastric, often radiating to the back)
- Amylase or lipase levels at least 3 times above the normal limit
- Imaging findings that suggest acute pancreatitis.
Gallstone-related pancreatitis should be considered if the ALT level is greater than 150 U/mL, which has a 97% specificity for gallstone-related pancreatitis.28
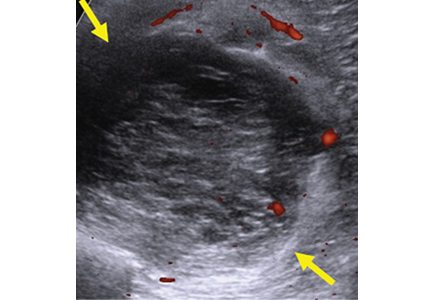
ABDOMINAL ULTRASONOGRAPHY FOR DIAGNOSIS
Transabdominal ultrasonography, with a sensitivity of 84% to 89% and a specificity of up to 99%, is the test of choice for detecting gallstones.29 The characteristic findings of acute cholecystitis on ultrasonography include enlargement of the gallbladder, thickening of the gallbladder wall, presence of pericholecystic fluid, and tenderness elicited by the ultrasound probe over the gallbladder (sonographic Murphy sign).
Scintigraphy as a second test
Acute cholecystitis is primarily a clinical diagnosis and typically does not require additional imaging beyond ultrasonography. When there is discordance between clinical and ultrasonographic findings, the most accurate second imaging test is scintigraphy of the biliary tract, usually performed with technetium-labeled hydroxy iminodiacetic acid. Given intravenously, the radionuclide is rapidly taken up by the liver and then secreted into the bile. In acute cholecystitis, the cystic duct is functionally occluded and the isotope does not enter the gallbladder, creating an imaging void compared with a normal appearance.
Scintigraphy is more sensitive than abdominal ultrasonography, with a sensitivity of up to 97% vs 81% to 88%, respectively.29,30 The tests have about equal specificity.
Even though scintigraphy is more sensitive, abdominal ultrasonography is often the initial test for patients with suspected acute cholecystitis because it is more widely available, takes less time, does not involve radiation exposure, and can assess for the presence or absence of gallstones and dilation of the intra- and extrahepatic bile ducts.
Looking for stones in the common bile duct
When acute cholangitis due to choledocholithiasis is suspected, abdominal ultrasonography is a prudent initial test to look for gallstones or biliary dilation suggesting obstruction by stones in the common bile duct. Abdominal ultrasonography has only a 22% to 55% sensitivity for visualizing stones in the common bile duct, but it has a 77% to 87% sensitivity for detecting common bile duct dilation, a surrogate marker of stones.31
The normal bile duct diameter ranges from 3 to 6 mm, although mild dilation is often seen in older patients or after cholecystectomy or Roux-en-Y gastric bypass surgery.32,33 Bile duct dilation of up to 10 mm can be considered normal in patients after cholecystectomy.34 A normal-appearing bile duct on ultrasonography has a negative predictive value of 95% for excluding common bile duct stones.31
Endoscopic ultrasonography (EUS), magnetic resonance cholangiopancreatography (MRCP), and endoscopic retrograde cholangiopancreatography (ERCP) have similar sensitivity (89%–94%, 85%–92%, and 89%–93%, respectively) and specificity (94%–95%, 93%–97%, and 100%, respectively) for detecting common bile duct stones.35–37 EUS is superior to MRCP in detecting stones smaller than 6 mm.38
ERCP should be reserved for managing rather than diagnosing common bile duct stones because of the risk of pancreatitis and perforation. Patients undergoing cholecystectomy who are suspected of having choledocholithiasis may undergo intraoperative cholangiography or laparoscopic common bile duct ultrasonography.
WATCH AND WAIT, OR INTERVENE?
Asymptomatic gallstones

Standard treatment for these patients is expectant management. Cholecystectomy is not recommended for patients with asymptomatic gallstones.47 Nevertheless, some patients may benefit from prophylactic cholecystectomy. We and others48 suggest considering cholecystectomy in the following patients.
Patients with chronic hemolytic anemia (including children with sickle cell anemia and spherocytosis). These patients have a higher risk of developing calcium bilirubinate stones, and cholecystectomy has improved outcomes.49 It should be noted that most of these data come from pediatric populations and have been extrapolated to adults.
Native Americans, who have a higher risk of gallbladder cancer if they have gallstones.2,50
Conversely, calcification of the gallbladder wall (“porcelain gallbladder”) is no longer considered an absolute indication for cholecystectomy. This condition was thought to be associated with a high rate of gallbladder carcinoma, but analyses of larger, more recent data sets found much smaller risks.51,52 Further, cholecystectomy in these patients was found to be associated with high rates of postoperative complications. Thus, prophylactic cholecystectomy is no longer recommended in asymptomatic cases of porcelain gallbladder.
In addition, concomitant cholecystectomy in patients undergoing bariatric surgery is no longer considered the therapeutic standard. Historically, cholecystectomy was performed in these patients because of the increased risk of gallstones associated with rapid weight loss after surgery. However, research now weighs against concomitant cholecystectomy with bariatric surgery and most other abdominal surgeries for asymptomatic gallstones.53
Laparoscopic surgery for symptomatic gallstones

For patients experiencing acute cholecystitis, laparoscopic cholecystectomy within 72 hours is recommended.48 There were safety concerns regarding higher rates of morbidity and conversion from laparoscopic to open cholecystectomy in patients who underwent surgery before the acute cholecystitis episode had settled. However, a large meta-analysis found no significant difference between early and delayed laparoscopic cholecystectomy in bile duct injury or conversion rates.54 Further, early cholecystectomy—defined as within 1 week of symptom onset—has been found to reduce gallstone-related complications, shorten hospital stays, and lower costs.55–57 If the patient cannot undergo surgery, percutaneous cholecystotomy or novel endoscopic gallbladder drainage interventions can be used.
.")
Several variables predict the presence of bile duct stones in patients who have symptoms (Table 4). Based on these predictors, the ASGE classifies the probabilities as low (< 10%), intermediate (10% to 50%), and high (> 50%)31:

- High-risk patients should undergo preoperative ERCP and stone extraction if needed
- Intermediate-risk patients should undergo preoperative imaging with EUS or MRCP or intraoperative bile duct evaluation, depending on the availability, costs, and local expertise.

Patients with associated cholangitis should be given intravenous fluids and broad-spectrum antibiotics. Biliary decompression should be done as early as possible to decrease the risk of morbidity and mortality. For acute cholangitis, ERCP is the treatment of choice.25
Patients with acute gallstone pancreatitis should receive conservative management with intravenous isotonic solutions and pain control, followed by laparoscopic cholecystectomy.48
The timing of laparoscopic cholecystectomy in acute gallstone pancreatitis has been debated. Studies conducted during the era of open cholecystectomy reported similar or worse outcomes if cholecystectomy was done sooner rather than later.
However, in 1999, Uhl et al58 reported that 48 of 77 patients admitted with acute gallstone pancreatitis were able to undergo laparoscopic cholecystectomy during the same admission. Success rates were 85% (30 of 35 patients) in those with mild disease and 62% (8 of 13 patients) in those with severe disease. They concluded laparoscopic cholecystectomy could be safely performed within 7 days in patients with mild disease, whereas in severe disease at least 3 weeks should elapse because of the risk of infection.
In a randomized trial published in 2010, Aboulian et al59 reported that hospital length of stay (the primary end point) was shorter in 25 patients who underwent laparoscopic cholecystectomy early (within 48 hours of admission) than in 25 patients who underwent surgery after abdominal pain had resolved and laboratory enzymes showed a normalizing trend, 3.5 vs 5.8 days (P = .0016). Rates of perioperative complications and need for conversion to open surgery were similar between the 2 groups.
If there is associated cholangitis, patients should also be given broad-spectrum antibiotics and should undergo ERCP within 24 hours of admission.25–27
SUMMARY
Gallstones are common in US adults. Abdominal ultrasonography is the diagnostic imaging test of choice to detect gallbladder stones and assess for findings suggestive of acute cholecystitis and dilation of the common bile duct. Fortunately, most gallstones are asymptomatic and can usually be managed expectantly. In patients who have symptoms or have gallstone complications, laparoscopic cholecystectomy is the standard of care.
- Schirmer BD, Winters KL, Edlich RF. Cholelithiasis and cholecystitis. J Long Term Eff Med Implants 2005; 15(3):329–338. doi:10.1615/JLongTermEffMedImplants.v15.i3.90
- Stinton LM, Shaffer EA. Epidemiology of gallbladder disease: cholelithiasis and cancer. Gut Liver 2012; 6(2):172–187. doi:10.5009/gnl.2012.6.2.172
- Lee JY, Keane MG, Pereira S. Diagnosis and treatment of gallstone disease. Practitioner 2015; 259(1783):15–19.
- Russo MW, Wei JT, Thiny MT, et al. Digestive and liver diseases statistics, 2004. Gastroenterology 2004; 126(5):1448–1453. doi:10.1053/j.gastro.2004.01.025
- Everhart JE, Ruhl CE. Burden of digestive diseases in the United States part I: overall and upper gastrointestinal diseases. Gastroenterology 2009; 136(2):376–386. doi:10.1053/j.gastro.2008.12.015
- Cariati A. Gallstone classification in Western countries. Indian J Surg 2015; 77(suppl 2):376–380. doi.org/10.1007/s12262-013-0847-y
- Carey MC. Pathogenesis of gallstones. Am J Surg 1993; 165(4):410–419. doi:10.1016/S0002-9610(05)80932-8
- Lammert F, Gurusamy K, Ko CW, et al. Gallstones. Nat Rev Dis Primers 2016; 2:16024. doi:10.1038/nrdp.2016.24
- Stewart L, Oesterle AL, Erdan I, Griffiss JM, Way LW. Pathogenesis of pigment gallstones in Western societies: the central role of bacteria. J Gastrointest Surg 2002; 6(6):891–904.
- Barbara L, Sama C, Morselli Labate AM, et al. A population study on the prevalence of gallstone disease: the Sirmione Study. Hepatology 1987; 7(5):913–917. doi:10.1002/hep.1840070520
- Sood S, Winn T, Ibrahim S, et al. Natural history of asymptomatic gallstones: differential behaviour in male and female subjects. Med J Malaysia 2015; 70(6):341–345.
- Maringhini A, Ciambra M, Baccelliere P, et al. Biliary sludge and gallstones in pregnancy: incidence, risk factors, and natural history. Ann Intern Med 1993; 119(2):116–120. doi:10.7326/0003-4819-119-2-199307150-00004
- Etminan M, Delaney JA, Bressler B, Brophy JM. Oral contraceptives and the risk of gallbladder disease: a comparative safety study. CMAJ 2011; 183(8):899–904. doi:10.1503/cmaj.110161
- Everhart JE, Khare M, Hill M, Maurer KR. Prevalence and ethnic differences in gallbladder disease in the United States. Gastroenterology 1999; 117(3):632–639.
- Festi D, Sottili S, Colecchia A, et al. Clinical manifestations of gallstone disease: evidence from the multicenter Italian study on cholelithiasis (MICOL). Hepatology 1999; 30(4):839–846. doi:10.1002/hep.510300401
- Berhane T, Vetrhus M, Hausken T, Olafsson S, Sondenaa K. Pain attacks in non-complicated and complicated gallstone disease have a characteristic pattern and are accompanied by dyspepsia in most patients: the results of a prospective study. Scand J Gastroenterol 2006; 41(1):93–101. doi:10.1080/00365520510023990
- Thistle JL, Cleary PA, Lachin JM, Tyor MP, Hersh T. The natural history of cholelithiasis: the National Cooperative Gallstone Study. Ann Intern Med 1984; 101(2):171–175. doi:10.7326/0003-4819-101-2-171
- Friedman GD. Natural history of asymptomatic and symptomatic gallstones. Am J Surg 1993; 165(4):399–404. doi:0.1016/S0002-9610(05)80930-4
- Friedman GD, Raviola CA, Fireman B. Prognosis of gallstones with mild or no symptoms: 25 years of follow-up in a health maintenance organization. J Clin Epidemiol 1989; 42(2):127–136. doi:10.1016/0895-4356(89)90086-3
- Hirota M, Takada T, Kawarada Y, et al. Diagnostic criteria and severity assessment of acute cholecystitis: Tokyo guidelines. J Hepatobiliary Pancreat Surg 2007; 14(1):78–82. doi:10.1007/s00534-006-1159-4
- Miura F, Takada T, Kawarada Y, et al. Flowcharts for the diagnosis and treatment of acute cholangitis and cholecystitis: Tokyo guidelines. J Hepatobiliary Pancreat Surg 2007; 14(1):27–34. doi:10.1007/s00534-006-1153-x
- Koo KP, Traverso LW. Do preoperative indicators predict the presence of common bile duct stones during laparoscopic cholecystectomy? Am J Surg 1996; 171(5):495–499. doi:10.1016/S0002-9610(97)89611-0
- Collins C, Maguire D, Ireland A, Fitzgerald E, O’Sullivan GC. A prospective study of common bile duct calculi in patients undergoing laparoscopic cholecystectomy: natural history of choledocholithiasis revisited. Ann Surg 2004; 239(1):28–33. doi:10.1097/01.sla.0000103069.00170.9c
- Costi R, Gnocchi A, Di Mario F, Sarli L. Diagnosis and management of choledocholithiasis in the golden age of imaging, endoscopy and laparoscopy. World J Gastroenterol 2014; 20(37):13382–13401. doi:10.3748/wjg.v20.i37.13382
- European Association for the Study of the Liver (EASL). EASL Clinical Practice Guidelines on the prevention, diagnosis and treatment of gallstones. J Hepatol 2016; 65(1):146–181. doi:10.1016/j.jhep.2016.03.005
- Greenberg JA, Hsu J, Bawazeer M, et al. Clinical practice guideline: management of acute pancreatitis. Can J Surg 2016; 59 (2):128–140. doi:10.1503/cjs.015015
- Tenner S, Baillie J, DeWitt J, Vege SS; American College of Gastroenterology. American College of Gastroenterology guideline: management of acute pancreatitis. Am J Gastroenterol 2013; 108(9):1400–1416. doi:10.1038/ajg.2013.218
- Moolla Z, Anderson F, Thomson SR. Use of amylase and alanine transaminase to predict acute gallstone pancreatitis in a population with high HIV prevalence. World J Surg 2013; 37(1):156–161. doi:10.1007/s00268-012-1801-z
- Shea JA, Berlin JA, Escarce JJ, et al. Revised estimates of diagnostic test sensitivity and specificity in suspected biliary tract disease. Arch Intern Med 1994; 154(22):2573–2581. doi:10.1001/archinte.1994.00420220069008
- Kiewiet JJ, Leeuwenburgh MM, Bipat S, et al. A systematic review and meta-analysis of diagnostic performance of imaging in acute cholecystitis. Radiology 2012; 264(3):708–720. doi:10.1148/radiol.12111561
- ASGE Standards of Practice Committee; Maple JT, Ben-Menachem T, Anderson MA, et al. The role of endoscopy in the evaluation of suspected choledocholithiasis. Gastrointest Endosc 2010; 71(1):1–9. doi:10.1016/j.gie.2009.09.041
- Bachar GN, Cohen M, Belenky A, Atar E, Gideon S. Effect of aging on the adult extrahepatic bile duct: a sonographic study. J Ultrasound Med 2003; 22(9):879–885. doi:10.7863/jum.2003.22.9.879
- El-Hayek K, Timratana P, Meranda J, Shimizu H, Eldar S, Chand B. Post Roux-en-Y gastric bypass biliary dilation: natural process or significant entity? J Gastrointest Surg 2012; 16(12):2185–2189. doi:10.1007/s11605-012-2058-4
- Park SM, Kim WS, Bae IH, et al. Common bile duct dilatation after cholecystectomy: a one-year prospective study. J Korean Surg Soc 2012; 83(2):97–101. doi:10.4174/jkss.2012.83.2.97
- Tse F, Liu L, Barkun AN, Armstrong D, Moayyedi P. EUS: a meta-analysis of test performance in suspected choledocholithiasis. Gastrointest Endosc 2008; 67(2):235–244. doi:10.1016/j.gie.2007.09.047
- Verma D, Kapadia A, Eisen GM, Adler DG. EUS vs MRCP for detection of choledocholithiasis. Gastrointest Endosc 2006; 64(2):248–254. doi:10.1016/j.gie.2005.12.038
- Tseng LJ, Jao YT, Mo LR, Lin RC. Over-the-wire US catheter probe as an adjunct to ERCP in the detection of choledocholithiasis. Gastrointest Endosc 2001; 54(6):720–723. doi:10.1067/mge.2001.119255
- Kondo S, Isayama H, Akahane M, et al. Detection of common bile duct stones: comparison between endoscopic ultrasonography, magnetic resonance cholangiography, and helical-computed-tomographic cholangiography. Eur J Radiol 2005; 54(2):271–275. doi:10.1016/j.ejrad.2004.07.007
- Attili AF, De Santis A, Capri R, Repice AM, Maselli S. The natural history of gallstones: the GREPCO experience. The GREPCO Group. Hepatology 1995; 21(3):656–660. doi:10.1016/0270-9139(95)90514-6
- Sakorafas GH, Milingos D, Peros G. Asymptomatic cholelithiasis: is cholecystectomy really needed? A critical reappraisal 15 years after the introduction of laparoscopic cholecystectomy. Dig Dis Sci 2007; 52(5):1313–1325. doi:10.1007/s10620-006-9107-3
- Gracie WA, Ransohoff DF. The natural history of silent gallstones: the innocent gallstone is not a myth. N Engl J Med 1982; 307(13):798–800. doi:10.1056/NEJM198209233071305
- McSherry CK, Ferstenberg H, Calhoun WF, Lahman E, Virshup M. The natural history of diagnosed gallstone disease in symptomatic and asymptomatic patients. Ann Surg 1985; 202(1):59–63. doi:10.1097/00000658-198507000-00009
- Wada K, Wada K, Imamura T. Natural course of asymptomatic gallstone disease. Nihon Rinsho 1993; 51(7):1737–1743. Japanese.
- Halldestam I, Enell EL, Kullman E, Borch K. Development of symptoms and complications in individuals with asymptomatic gallstones. Br J Surg 2004; 91(6):734–738. doi:10.1002/bjs.4547
- Festi D, Reggiani ML, Attili AF, et al. Natural history of gallstone disease: expectant management or active treatment? Results from a population-based cohort study. J Gastroenterol Hepatol 2010; 25(4):719–724. doi:10.1111/j.1440-1746.2009.06146.x
- Shabanzadeh DM, Sorensen LT, Jorgensen T. A prediction rule for risk stratification of incidentally discovered gallstones: results from a large cohort study. Gastroenterology 2016; 150(1):156–167e1. doi:10.1053/j.gastro.2015.09.002
- Overby DW, Apelgren KN, Richardson W, Fanelli R; Society of American Gastrointestinal and Endoscopic Surgeons. SAGES guidelines for the clinical application of laparoscopic biliary tract surgery. Surg Endosc 2010; 24(10):2368–2386. doi:10.1007/s00464-010-1268-7
- Abraham S, Rivero HG, Erlikh IV, Griffith LF, Kondamudi VK. Surgical and nonsurgical management of gallstones. Am Fam Physician 2014; 89(10):795–802.
- Currò G,, Iapichino G, Lorenzini C, Palmeri R, Cucinotta E. Laparoscopic cholecystectomy in children with chronic hemolytic anemia. Is the outcome related to the timing of the procedure? Surg Endosc 2006; 20(2):252–255. doi:10.1007/s00464-005-0318-z
- Hundal R, Shaffer EA. Gallbladder cancer: epidemiology and outcome. Clin Epidemiol 2014; 6:99–109. doi:10.2147/CLEP.S37357
- Chen GL, Akmal Y, DiFronzo AL, Vuong B, O’Connor V. Porcelain gallbladder: no longer an indication for prophylactic cholecystectomy. Am Surg 2015; 81(10):936–940.
- Schnelldorfer T. Porcelain gallbladder: a benign process or concern for malignancy? J Gastrointest Surg 2013; 17(6):1161–1168. doi:10.1007/s11605-013-2170-0
- Warschkow R, Tarantino I, Ukegjini K, et al. Concomitant cholecystectomy during laparoscopic Roux-en-Y gastric bypass in obese patients is not justified: a meta-analysis. Obes Surg 2013; 23(3)3979–408. doi:10.1007/s11695-012-0852-4
- Gurusamy K, Samraj K, Gluud C, Wilson E, Davidson BR. Meta-analysis of randomized controlled trials on the safety and effectiveness of early versus delayed laparoscopic cholecystectomy for acute cholecystitis. Br J Surg 2010; 97(2):141–150. doi:10.1002/bjs.6870
- Papi C, Catarci M, D’Ambrosio L, et al. Timing of cholecystectomy for acute calculous cholecystitis: a meta-analysis. Am J Gastroenterol 2004; 99(1):147–155. doi:10.1046/j.1572-0241.2003.04002.x
- Gurusamy KS, Davidson C, Gluud C, Davidson BR. Early versus delayed laparoscopic cholecystectomy for people with acute cholecystitis. Cochrane Database Syst Rev 2013; 6:CD005440. doi:10.1002/14651858
- Menahem B, Mulliri A, Fohlen A, Guittet L, Alves A, Lubrano J. Delayed laparoscopic cholecystectomy increases the total hospital stay compared to an early laparoscopic cholecystectomy after acute cholecystitis: an updated meta-analysis of randomized controlled trials. HPB (Oxford) 2015; 17(10):857–862. doi:10.1111/hpb.12449
- Uhl W, Müller CA, Krähenbühl L, Schmid SW, Schölzel S, Büchler MW. Acute gallstone pancreatitis: timing of laparoscopic cholecystectomy in mild and severe disease. Surg Endosc 1999; 13(11):1070–1076. doi:10.1007/s004649901175
- Aboulian A, Chan T, Yaghoubian A, et al. Early cholecystectomy safely decreases hospital stay in patients with mild gallstone pancreatitis: a randomized prospective study. Ann Surg 2010(4): 251:615–619. doi:10.1097/SLA.0b013e3181c38f1f
The prevalence of gallstones is approximately 10% to 15% of the adult US population.1,2 Most cases are asymptomatic, as gallstones are usually discovered incidentally during routine imaging for other abdominal conditions, and only about 20% of patients with asymptomatic gallstones develop clinically significant complications.2,3
Nevertheless, gallstones carry significant healthcare costs. In 2004, the median inpatient cost for any gallstone-related disease was $11,584, with an overall annual cost of $6.2 billion.4,5
Laparoscopic cholecystectomy is the standard treatment for symptomatic cholelithiasis. For asymptomatic cholelithasis, the usual approach is expectant management (“watch and wait”), but prophylactic cholecystectomy may be an option in certain patients at high risk.
CHEMICAL COMPOSITION
Gallstones can be classified into 2 main categories based on their predominant chemical composition: cholesterol or pigment.
Cholesterol gallstones
About 75% of gallstones are composed of cholesterol.3,4 In the past, this type of stone was thought to be caused by gallbladder inflammation, bile stasis, and absorption of bile salts from damaged mucosa. However, it is now known that cholesterol gallstones are the result of biliary supersaturation caused by cholesterol hypersecretion into the gallbladder, gallbladder hypomotility, accelerated cholesterol nucleation and crystallization, and mucin gel accumulation.
Pigment gallstones
Black pigment gallstones account for 10% to 15% of all gallstones.6 They are caused by chronic hemolysis in association with supersaturation of bile with calcium hydrogen bilirubinate, along with deposition of calcium carbonate, phosphate, and inorganic salts.7
Brown pigment stones, accounting for 5% to 10% of all gallstones,6 are caused by infection in the obstructed bile ducts, where bacteria that produce beta-glucuronidase, phospholipase, and slime contribute to formation of the stone.8,9
RISK FACTORS FOR GALLSTONES
Age. After age 40, the risk increases dramatically, with an incidence 4 times higher for those ages 40 to 69 than in younger people.10
Female sex. Women of reproductive age are 4 times more likely to develop gallstones than men, but this gap narrows after menopause.11 The higher risk is attributed to female sex hormones, pregnancy, and oral contraceptive use. Estrogen decreases secretion of bile salts and increases secretion of cholesterol into the gallbladder, which leads to cholesterol supersaturation. Progesterone acts synergistically by causing hypomobility of the gallbladder, which in turn leads to bile stasis.12,13
Ethnicity. The risk is higher in Mexican Americans and Native Americans than in other ethnic groups.14
Rapid weight loss, such as after bariatric surgery, occurs from decreased caloric intake and promotes bile stasis, while lipolysis increases cholesterol mobilization and secretion into the gallbladder. This creates an environment conducive to bile supersaturation with cholesterol, leading to gallstone formation.
Chronic hemolytic disorders carry an increased risk of developing calcium bilirubinate stones due to increased excretion of bilirubin during hemolysis.
Obesity and diabetes mellitus are both attributed to insulin resistance. Obesity also increases bile stasis and cholesterol saturation.
CLINICAL PRESENTATION OF GALLSTONES (CHOLELITHIASIS)
Most patients with gallstones (cholelithiasis) experience no symptoms. Their gallstones are often discovered incidentally during imaging tests for unrelated or unexplained abdominal symptoms. Most patients with asymptomatic gallstones remain symptom-free, while about 20% develop gallstone-related symptoms.2,3
Abdominal pain is the most common symptom. The phrase biliary colic—suggesting pain that is fluctuating in nature—appears ubiquitously in the medical literature, but it does not correctly characterize the pain associated with gallstones.
Most patients with gallstone symptoms describe a constant and often severe pain in the right upper abdomen, epigastrium, or both, often persisting for 30 to 120 minutes. Symptoms are frequently reported in the epigastrium when only visceral pain fibers are stimulated due to gallbladder distention. This is usually called midline pain; however, pain occurs in the back and right shoulder in up to 60% of patients, with involvement of somatic fibers.15,16 Gallstone pain is not relieved by change of position or passage of stool or gas.
Onset of symptoms more than an hour after eating or in the late evening or at night also very strongly suggests biliary pain. Patients with a history of biliary pain are more likely to experience it again, with a 69% chance of developing recurrent pain within 2 years.17
GALLSTONE-RELATED COMPLICATIONS
Acute gallbladder inflammation (cholecystitis)
Gallbladder inflammation (cholecystitis) is the most common complication, occurring in up to 10% of symptomatic cases. Many patients with acute cholecystitis present with right upper quadrant pain that may be accompanied by anorexia, nausea, or vomiting. Inspiratory arrest on deep palpation of the right upper quadrant (Murphy sign) has a specificity of 79% to 96% for acute cholecystitis.20 Markers of systemic inflammation such as fever, elevated white blood cell count, and elevated C-reactive protein are highly suggestive of acute cholecystitis.20,21
Bile duct stones (choledocholithiasis)
Bile duct stones (choledocholithiasis) are detected in 3.4% to 12% of patients with gallstones.22,23 Most stones in the common bile duct migrate there from the gallbladder via the cystic duct. Less commonly, primary duct stones form in the duct due to biliary stasis. Removing the gallbladder does not completely eliminate the risk of bile duct stones, as stones can remain or recur after surgery.
Bile duct stones can obstruct the common bile duct, which disrupts normal bile flow and leads to jaundice. Other symptoms may include pruritus, right upper quadrant pain, nausea, and vomiting. Serum levels of bilirubin, aspartate aminotransferase, alanine aminotransferase (ALT), and alkaline phosphatase are usually high.24
Acute bacterial infection (cholangitis)
Acute bacterial infection of the biliary system (cholangitis) is usually associated with obstruction of the common bile duct. Common symptoms of acute cholangitis include right upper quadrant pain, fever, and jaundice (Charcot triad), and these are present in about 50% to 75% of cases.21 In severe cases, patients can develop altered mental status and septicemic shock in addition to the Charcot triad, a condition called the Reynold pentad. White blood cell counts and serum levels of C-reactive protein, bilirubin, aminotransferases, and alkaline phosphatase are usually elevated.21
Pancreatitis
Approximately 4% to 8% of patients with gallstones develop inflammation of the pancreas (pancreatitis).25 The diagnosis of acute pancreatitis requires at least 2 of the following:26,27
- Abdominal pain (typically epigastric, often radiating to the back)
- Amylase or lipase levels at least 3 times above the normal limit
- Imaging findings that suggest acute pancreatitis.
Gallstone-related pancreatitis should be considered if the ALT level is greater than 150 U/mL, which has a 97% specificity for gallstone-related pancreatitis.28
ABDOMINAL ULTRASONOGRAPHY FOR DIAGNOSIS
Transabdominal ultrasonography, with a sensitivity of 84% to 89% and a specificity of up to 99%, is the test of choice for detecting gallstones.29 The characteristic findings of acute cholecystitis on ultrasonography include enlargement of the gallbladder, thickening of the gallbladder wall, presence of pericholecystic fluid, and tenderness elicited by the ultrasound probe over the gallbladder (sonographic Murphy sign).
Scintigraphy as a second test
Acute cholecystitis is primarily a clinical diagnosis and typically does not require additional imaging beyond ultrasonography. When there is discordance between clinical and ultrasonographic findings, the most accurate second imaging test is scintigraphy of the biliary tract, usually performed with technetium-labeled hydroxy iminodiacetic acid. Given intravenously, the radionuclide is rapidly taken up by the liver and then secreted into the bile. In acute cholecystitis, the cystic duct is functionally occluded and the isotope does not enter the gallbladder, creating an imaging void compared with a normal appearance.
Scintigraphy is more sensitive than abdominal ultrasonography, with a sensitivity of up to 97% vs 81% to 88%, respectively.29,30 The tests have about equal specificity.
Even though scintigraphy is more sensitive, abdominal ultrasonography is often the initial test for patients with suspected acute cholecystitis because it is more widely available, takes less time, does not involve radiation exposure, and can assess for the presence or absence of gallstones and dilation of the intra- and extrahepatic bile ducts.
Looking for stones in the common bile duct
When acute cholangitis due to choledocholithiasis is suspected, abdominal ultrasonography is a prudent initial test to look for gallstones or biliary dilation suggesting obstruction by stones in the common bile duct. Abdominal ultrasonography has only a 22% to 55% sensitivity for visualizing stones in the common bile duct, but it has a 77% to 87% sensitivity for detecting common bile duct dilation, a surrogate marker of stones.31
The normal bile duct diameter ranges from 3 to 6 mm, although mild dilation is often seen in older patients or after cholecystectomy or Roux-en-Y gastric bypass surgery.32,33 Bile duct dilation of up to 10 mm can be considered normal in patients after cholecystectomy.34 A normal-appearing bile duct on ultrasonography has a negative predictive value of 95% for excluding common bile duct stones.31
Endoscopic ultrasonography (EUS), magnetic resonance cholangiopancreatography (MRCP), and endoscopic retrograde cholangiopancreatography (ERCP) have similar sensitivity (89%–94%, 85%–92%, and 89%–93%, respectively) and specificity (94%–95%, 93%–97%, and 100%, respectively) for detecting common bile duct stones.35–37 EUS is superior to MRCP in detecting stones smaller than 6 mm.38
ERCP should be reserved for managing rather than diagnosing common bile duct stones because of the risk of pancreatitis and perforation. Patients undergoing cholecystectomy who are suspected of having choledocholithiasis may undergo intraoperative cholangiography or laparoscopic common bile duct ultrasonography.
WATCH AND WAIT, OR INTERVENE?
Asymptomatic gallstones
Standard treatment for these patients is expectant management. Cholecystectomy is not recommended for patients with asymptomatic gallstones.47 Nevertheless, some patients may benefit from prophylactic cholecystectomy. We and others48 suggest considering cholecystectomy in the following patients.
Patients with chronic hemolytic anemia (including children with sickle cell anemia and spherocytosis). These patients have a higher risk of developing calcium bilirubinate stones, and cholecystectomy has improved outcomes.49 It should be noted that most of these data come from pediatric populations and have been extrapolated to adults.
Native Americans, who have a higher risk of gallbladder cancer if they have gallstones.2,50
Conversely, calcification of the gallbladder wall (“porcelain gallbladder”) is no longer considered an absolute indication for cholecystectomy. This condition was thought to be associated with a high rate of gallbladder carcinoma, but analyses of larger, more recent data sets found much smaller risks.51,52 Further, cholecystectomy in these patients was found to be associated with high rates of postoperative complications. Thus, prophylactic cholecystectomy is no longer recommended in asymptomatic cases of porcelain gallbladder.
In addition, concomitant cholecystectomy in patients undergoing bariatric surgery is no longer considered the therapeutic standard. Historically, cholecystectomy was performed in these patients because of the increased risk of gallstones associated with rapid weight loss after surgery. However, research now weighs against concomitant cholecystectomy with bariatric surgery and most other abdominal surgeries for asymptomatic gallstones.53
Laparoscopic surgery for symptomatic gallstones
For patients experiencing acute cholecystitis, laparoscopic cholecystectomy within 72 hours is recommended.48 There were safety concerns regarding higher rates of morbidity and conversion from laparoscopic to open cholecystectomy in patients who underwent surgery before the acute cholecystitis episode had settled. However, a large meta-analysis found no significant difference between early and delayed laparoscopic cholecystectomy in bile duct injury or conversion rates.54 Further, early cholecystectomy—defined as within 1 week of symptom onset—has been found to reduce gallstone-related complications, shorten hospital stays, and lower costs.55–57 If the patient cannot undergo surgery, percutaneous cholecystotomy or novel endoscopic gallbladder drainage interventions can be used.
Several variables predict the presence of bile duct stones in patients who have symptoms (Table 4). Based on these predictors, the ASGE classifies the probabilities as low (< 10%), intermediate (10% to 50%), and high (> 50%)31:
- High-risk patients should undergo preoperative ERCP and stone extraction if needed
- Intermediate-risk patients should undergo preoperative imaging with EUS or MRCP or intraoperative bile duct evaluation, depending on the availability, costs, and local expertise.
Patients with associated cholangitis should be given intravenous fluids and broad-spectrum antibiotics. Biliary decompression should be done as early as possible to decrease the risk of morbidity and mortality. For acute cholangitis, ERCP is the treatment of choice.25
Patients with acute gallstone pancreatitis should receive conservative management with intravenous isotonic solutions and pain control, followed by laparoscopic cholecystectomy.48
The timing of laparoscopic cholecystectomy in acute gallstone pancreatitis has been debated. Studies conducted during the era of open cholecystectomy reported similar or worse outcomes if cholecystectomy was done sooner rather than later.
However, in 1999, Uhl et al58 reported that 48 of 77 patients admitted with acute gallstone pancreatitis were able to undergo laparoscopic cholecystectomy during the same admission. Success rates were 85% (30 of 35 patients) in those with mild disease and 62% (8 of 13 patients) in those with severe disease. They concluded laparoscopic cholecystectomy could be safely performed within 7 days in patients with mild disease, whereas in severe disease at least 3 weeks should elapse because of the risk of infection.
In a randomized trial published in 2010, Aboulian et al59 reported that hospital length of stay (the primary end point) was shorter in 25 patients who underwent laparoscopic cholecystectomy early (within 48 hours of admission) than in 25 patients who underwent surgery after abdominal pain had resolved and laboratory enzymes showed a normalizing trend, 3.5 vs 5.8 days (P = .0016). Rates of perioperative complications and need for conversion to open surgery were similar between the 2 groups.
If there is associated cholangitis, patients should also be given broad-spectrum antibiotics and should undergo ERCP within 24 hours of admission.25–27
SUMMARY
Gallstones are common in US adults. Abdominal ultrasonography is the diagnostic imaging test of choice to detect gallbladder stones and assess for findings suggestive of acute cholecystitis and dilation of the common bile duct. Fortunately, most gallstones are asymptomatic and can usually be managed expectantly. In patients who have symptoms or have gallstone complications, laparoscopic cholecystectomy is the standard of care.
- Schirmer BD, Winters KL, Edlich RF. Cholelithiasis and cholecystitis. J Long Term Eff Med Implants 2005; 15(3):329–338. doi:10.1615/JLongTermEffMedImplants.v15.i3.90
- Stinton LM, Shaffer EA. Epidemiology of gallbladder disease: cholelithiasis and cancer. Gut Liver 2012; 6(2):172–187. doi:10.5009/gnl.2012.6.2.172
- Lee JY, Keane MG, Pereira S. Diagnosis and treatment of gallstone disease. Practitioner 2015; 259(1783):15–19.
- Russo MW, Wei JT, Thiny MT, et al. Digestive and liver diseases statistics, 2004. Gastroenterology 2004; 126(5):1448–1453. doi:10.1053/j.gastro.2004.01.025
- Everhart JE, Ruhl CE. Burden of digestive diseases in the United States part I: overall and upper gastrointestinal diseases. Gastroenterology 2009; 136(2):376–386. doi:10.1053/j.gastro.2008.12.015
- Cariati A. Gallstone classification in Western countries. Indian J Surg 2015; 77(suppl 2):376–380. doi.org/10.1007/s12262-013-0847-y
- Carey MC. Pathogenesis of gallstones. Am J Surg 1993; 165(4):410–419. doi:10.1016/S0002-9610(05)80932-8
- Lammert F, Gurusamy K, Ko CW, et al. Gallstones. Nat Rev Dis Primers 2016; 2:16024. doi:10.1038/nrdp.2016.24
- Stewart L, Oesterle AL, Erdan I, Griffiss JM, Way LW. Pathogenesis of pigment gallstones in Western societies: the central role of bacteria. J Gastrointest Surg 2002; 6(6):891–904.
- Barbara L, Sama C, Morselli Labate AM, et al. A population study on the prevalence of gallstone disease: the Sirmione Study. Hepatology 1987; 7(5):913–917. doi:10.1002/hep.1840070520
- Sood S, Winn T, Ibrahim S, et al. Natural history of asymptomatic gallstones: differential behaviour in male and female subjects. Med J Malaysia 2015; 70(6):341–345.
- Maringhini A, Ciambra M, Baccelliere P, et al. Biliary sludge and gallstones in pregnancy: incidence, risk factors, and natural history. Ann Intern Med 1993; 119(2):116–120. doi:10.7326/0003-4819-119-2-199307150-00004
- Etminan M, Delaney JA, Bressler B, Brophy JM. Oral contraceptives and the risk of gallbladder disease: a comparative safety study. CMAJ 2011; 183(8):899–904. doi:10.1503/cmaj.110161
- Everhart JE, Khare M, Hill M, Maurer KR. Prevalence and ethnic differences in gallbladder disease in the United States. Gastroenterology 1999; 117(3):632–639.
- Festi D, Sottili S, Colecchia A, et al. Clinical manifestations of gallstone disease: evidence from the multicenter Italian study on cholelithiasis (MICOL). Hepatology 1999; 30(4):839–846. doi:10.1002/hep.510300401
- Berhane T, Vetrhus M, Hausken T, Olafsson S, Sondenaa K. Pain attacks in non-complicated and complicated gallstone disease have a characteristic pattern and are accompanied by dyspepsia in most patients: the results of a prospective study. Scand J Gastroenterol 2006; 41(1):93–101. doi:10.1080/00365520510023990
- Thistle JL, Cleary PA, Lachin JM, Tyor MP, Hersh T. The natural history of cholelithiasis: the National Cooperative Gallstone Study. Ann Intern Med 1984; 101(2):171–175. doi:10.7326/0003-4819-101-2-171
- Friedman GD. Natural history of asymptomatic and symptomatic gallstones. Am J Surg 1993; 165(4):399–404. doi:0.1016/S0002-9610(05)80930-4
- Friedman GD, Raviola CA, Fireman B. Prognosis of gallstones with mild or no symptoms: 25 years of follow-up in a health maintenance organization. J Clin Epidemiol 1989; 42(2):127–136. doi:10.1016/0895-4356(89)90086-3
- Hirota M, Takada T, Kawarada Y, et al. Diagnostic criteria and severity assessment of acute cholecystitis: Tokyo guidelines. J Hepatobiliary Pancreat Surg 2007; 14(1):78–82. doi:10.1007/s00534-006-1159-4
- Miura F, Takada T, Kawarada Y, et al. Flowcharts for the diagnosis and treatment of acute cholangitis and cholecystitis: Tokyo guidelines. J Hepatobiliary Pancreat Surg 2007; 14(1):27–34. doi:10.1007/s00534-006-1153-x
- Koo KP, Traverso LW. Do preoperative indicators predict the presence of common bile duct stones during laparoscopic cholecystectomy? Am J Surg 1996; 171(5):495–499. doi:10.1016/S0002-9610(97)89611-0
- Collins C, Maguire D, Ireland A, Fitzgerald E, O’Sullivan GC. A prospective study of common bile duct calculi in patients undergoing laparoscopic cholecystectomy: natural history of choledocholithiasis revisited. Ann Surg 2004; 239(1):28–33. doi:10.1097/01.sla.0000103069.00170.9c
- Costi R, Gnocchi A, Di Mario F, Sarli L. Diagnosis and management of choledocholithiasis in the golden age of imaging, endoscopy and laparoscopy. World J Gastroenterol 2014; 20(37):13382–13401. doi:10.3748/wjg.v20.i37.13382
- European Association for the Study of the Liver (EASL). EASL Clinical Practice Guidelines on the prevention, diagnosis and treatment of gallstones. J Hepatol 2016; 65(1):146–181. doi:10.1016/j.jhep.2016.03.005
- Greenberg JA, Hsu J, Bawazeer M, et al. Clinical practice guideline: management of acute pancreatitis. Can J Surg 2016; 59 (2):128–140. doi:10.1503/cjs.015015
- Tenner S, Baillie J, DeWitt J, Vege SS; American College of Gastroenterology. American College of Gastroenterology guideline: management of acute pancreatitis. Am J Gastroenterol 2013; 108(9):1400–1416. doi:10.1038/ajg.2013.218
- Moolla Z, Anderson F, Thomson SR. Use of amylase and alanine transaminase to predict acute gallstone pancreatitis in a population with high HIV prevalence. World J Surg 2013; 37(1):156–161. doi:10.1007/s00268-012-1801-z
- Shea JA, Berlin JA, Escarce JJ, et al. Revised estimates of diagnostic test sensitivity and specificity in suspected biliary tract disease. Arch Intern Med 1994; 154(22):2573–2581. doi:10.1001/archinte.1994.00420220069008
- Kiewiet JJ, Leeuwenburgh MM, Bipat S, et al. A systematic review and meta-analysis of diagnostic performance of imaging in acute cholecystitis. Radiology 2012; 264(3):708–720. doi:10.1148/radiol.12111561
- ASGE Standards of Practice Committee; Maple JT, Ben-Menachem T, Anderson MA, et al. The role of endoscopy in the evaluation of suspected choledocholithiasis. Gastrointest Endosc 2010; 71(1):1–9. doi:10.1016/j.gie.2009.09.041
- Bachar GN, Cohen M, Belenky A, Atar E, Gideon S. Effect of aging on the adult extrahepatic bile duct: a sonographic study. J Ultrasound Med 2003; 22(9):879–885. doi:10.7863/jum.2003.22.9.879
- El-Hayek K, Timratana P, Meranda J, Shimizu H, Eldar S, Chand B. Post Roux-en-Y gastric bypass biliary dilation: natural process or significant entity? J Gastrointest Surg 2012; 16(12):2185–2189. doi:10.1007/s11605-012-2058-4
- Park SM, Kim WS, Bae IH, et al. Common bile duct dilatation after cholecystectomy: a one-year prospective study. J Korean Surg Soc 2012; 83(2):97–101. doi:10.4174/jkss.2012.83.2.97
- Tse F, Liu L, Barkun AN, Armstrong D, Moayyedi P. EUS: a meta-analysis of test performance in suspected choledocholithiasis. Gastrointest Endosc 2008; 67(2):235–244. doi:10.1016/j.gie.2007.09.047
- Verma D, Kapadia A, Eisen GM, Adler DG. EUS vs MRCP for detection of choledocholithiasis. Gastrointest Endosc 2006; 64(2):248–254. doi:10.1016/j.gie.2005.12.038
- Tseng LJ, Jao YT, Mo LR, Lin RC. Over-the-wire US catheter probe as an adjunct to ERCP in the detection of choledocholithiasis. Gastrointest Endosc 2001; 54(6):720–723. doi:10.1067/mge.2001.119255
- Kondo S, Isayama H, Akahane M, et al. Detection of common bile duct stones: comparison between endoscopic ultrasonography, magnetic resonance cholangiography, and helical-computed-tomographic cholangiography. Eur J Radiol 2005; 54(2):271–275. doi:10.1016/j.ejrad.2004.07.007
- Attili AF, De Santis A, Capri R, Repice AM, Maselli S. The natural history of gallstones: the GREPCO experience. The GREPCO Group. Hepatology 1995; 21(3):656–660. doi:10.1016/0270-9139(95)90514-6
- Sakorafas GH, Milingos D, Peros G. Asymptomatic cholelithiasis: is cholecystectomy really needed? A critical reappraisal 15 years after the introduction of laparoscopic cholecystectomy. Dig Dis Sci 2007; 52(5):1313–1325. doi:10.1007/s10620-006-9107-3
- Gracie WA, Ransohoff DF. The natural history of silent gallstones: the innocent gallstone is not a myth. N Engl J Med 1982; 307(13):798–800. doi:10.1056/NEJM198209233071305
- McSherry CK, Ferstenberg H, Calhoun WF, Lahman E, Virshup M. The natural history of diagnosed gallstone disease in symptomatic and asymptomatic patients. Ann Surg 1985; 202(1):59–63. doi:10.1097/00000658-198507000-00009
- Wada K, Wada K, Imamura T. Natural course of asymptomatic gallstone disease. Nihon Rinsho 1993; 51(7):1737–1743. Japanese.
- Halldestam I, Enell EL, Kullman E, Borch K. Development of symptoms and complications in individuals with asymptomatic gallstones. Br J Surg 2004; 91(6):734–738. doi:10.1002/bjs.4547
- Festi D, Reggiani ML, Attili AF, et al. Natural history of gallstone disease: expectant management or active treatment? Results from a population-based cohort study. J Gastroenterol Hepatol 2010; 25(4):719–724. doi:10.1111/j.1440-1746.2009.06146.x
- Shabanzadeh DM, Sorensen LT, Jorgensen T. A prediction rule for risk stratification of incidentally discovered gallstones: results from a large cohort study. Gastroenterology 2016; 150(1):156–167e1. doi:10.1053/j.gastro.2015.09.002
- Overby DW, Apelgren KN, Richardson W, Fanelli R; Society of American Gastrointestinal and Endoscopic Surgeons. SAGES guidelines for the clinical application of laparoscopic biliary tract surgery. Surg Endosc 2010; 24(10):2368–2386. doi:10.1007/s00464-010-1268-7
- Abraham S, Rivero HG, Erlikh IV, Griffith LF, Kondamudi VK. Surgical and nonsurgical management of gallstones. Am Fam Physician 2014; 89(10):795–802.
- Currò G,, Iapichino G, Lorenzini C, Palmeri R, Cucinotta E. Laparoscopic cholecystectomy in children with chronic hemolytic anemia. Is the outcome related to the timing of the procedure? Surg Endosc 2006; 20(2):252–255. doi:10.1007/s00464-005-0318-z
- Hundal R, Shaffer EA. Gallbladder cancer: epidemiology and outcome. Clin Epidemiol 2014; 6:99–109. doi:10.2147/CLEP.S37357
- Chen GL, Akmal Y, DiFronzo AL, Vuong B, O’Connor V. Porcelain gallbladder: no longer an indication for prophylactic cholecystectomy. Am Surg 2015; 81(10):936–940.
- Schnelldorfer T. Porcelain gallbladder: a benign process or concern for malignancy? J Gastrointest Surg 2013; 17(6):1161–1168. doi:10.1007/s11605-013-2170-0
- Warschkow R, Tarantino I, Ukegjini K, et al. Concomitant cholecystectomy during laparoscopic Roux-en-Y gastric bypass in obese patients is not justified: a meta-analysis. Obes Surg 2013; 23(3)3979–408. doi:10.1007/s11695-012-0852-4
- Gurusamy K, Samraj K, Gluud C, Wilson E, Davidson BR. Meta-analysis of randomized controlled trials on the safety and effectiveness of early versus delayed laparoscopic cholecystectomy for acute cholecystitis. Br J Surg 2010; 97(2):141–150. doi:10.1002/bjs.6870
- Papi C, Catarci M, D’Ambrosio L, et al. Timing of cholecystectomy for acute calculous cholecystitis: a meta-analysis. Am J Gastroenterol 2004; 99(1):147–155. doi:10.1046/j.1572-0241.2003.04002.x
- Gurusamy KS, Davidson C, Gluud C, Davidson BR. Early versus delayed laparoscopic cholecystectomy for people with acute cholecystitis. Cochrane Database Syst Rev 2013; 6:CD005440. doi:10.1002/14651858
- Menahem B, Mulliri A, Fohlen A, Guittet L, Alves A, Lubrano J. Delayed laparoscopic cholecystectomy increases the total hospital stay compared to an early laparoscopic cholecystectomy after acute cholecystitis: an updated meta-analysis of randomized controlled trials. HPB (Oxford) 2015; 17(10):857–862. doi:10.1111/hpb.12449
- Uhl W, Müller CA, Krähenbühl L, Schmid SW, Schölzel S, Büchler MW. Acute gallstone pancreatitis: timing of laparoscopic cholecystectomy in mild and severe disease. Surg Endosc 1999; 13(11):1070–1076. doi:10.1007/s004649901175
- Aboulian A, Chan T, Yaghoubian A, et al. Early cholecystectomy safely decreases hospital stay in patients with mild gallstone pancreatitis: a randomized prospective study. Ann Surg 2010(4): 251:615–619. doi:10.1097/SLA.0b013e3181c38f1f
KEY POINTS
- Abdominal pain is the primary symptom associated with gallstones.
- Abdominal ultrasonography is the diagnostic test of choice to detect gallstones and assess for findings suggestive of acute cholecystitis and dilation of the common bile duct.
- First-line therapy for asymptomatic gallstones is expectant management.
- First-line therapy for symptomatic gallstones is cholecystectomy.
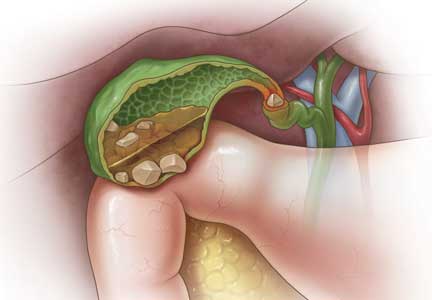
Are serum troponin levels elevated in conditions other than acute coronary syndrome?
Yes. Sepsis, stroke, chronic kidney disease, pulmonary disease, chemotherapy, heart failure, and stress cardiomyopathy can all raise serum troponin concentrations, and in some cases the elevations are prognostically important. Careful clinical assessment, serial monitoring of troponin levels, and other supportive tests are usually necessary to tell whether troponin elevations are due to acute coronary syndrome or to these other causes.
NOT ONLY A MARKER OF MYOCARDIAL DAMAGE
Troponin, an intracellular protein found in skeletal and cardiac muscle cells, is essential for muscle contraction. Troponin T and troponin I are clinically equivalent, and both are biomarkers of myocardial damage.
A troponin assay is ordered when patients present with sudden onset of symptoms of acute coronary syndrome such as chest pain, dyspnea, diaphoresis, and electrocardiographic abnormalities. The assay is positive when the manufacturer-specified threshold corresponding to a concentration above the 99th percentile is detected.
Serial testing of serum biomarkers of acute myocardial damage is essential to confirm the diagnosis of myocardial infarction. Because of their higher sensitivity and specificity compared with creatine kinase-MB and other markers, troponins are the preferred biomarker in diagnosing acute coronary syndrome.
In 1984, Piper et al1 reported that free cytosolic pools of cardiac enzymes could be released after reversible myocardial injury as a result of temporary disruption of the cell membrane. This upended the previous assumption that troponin was released only after irreversible myocardial necrosis, and it provided an explanation for troponin elevations observed in conditions with no evidence of epicardial coronary artery disease or permanent myocardial damage.1
SEPSIS
Studies of patients with sepsis, severe sepsis, and septic shock have shown troponin elevations with no evidence of acute coronary syndrome.2 In sepsis, troponin elevations are presumed to be caused by a combination of events. Renal dysfunction leads to decreased clearance of troponin fragments by the kidneys. The massive inflammatory response in septic shock results in cytokine-induced cardiac damage, and increased levels of endogenous and exogenous catecholamines damage cardiac myocytes.3
Studies of the prognostic value of these elevations have produced mixed and contradictory results. But a 2013 meta-analysis4 showed that patients with a troponin elevation at the time of diagnosis of sepsis had a risk of death almost twice that of patients without a troponin elevation (relative risk 1.91, 95% confidence interval [CI] 1.63–2.24).
STROKE
Acute ischemic stroke can trigger troponin elevations in several ways. Since the risk factors for acute ischemic stroke and coronary stenosis are similar, patients who have an ischemic stroke have a higher risk of coronary atherosclerosis and coronary stenosis than the general population.5
Stroke can cause a variety of cardiovascular and respiratory responses (eg, tachyarrhythmia, hypertensive crisis, respiratory failure) that increase the stress on the myocardium. In patients with stroke and concurrent coronary artery stenosis, the increased metabolic demand can exceed the oxygen supply capacity, resulting in myocardial ischemia, which can manifest as increased levels of serum troponin.5
Stroke can also cause troponin elevation through neurogenic myocardial damage. Ischemic stroke and intracranial hemorrhage can trigger alterations in autonomic control. Sometimes this results in increased sympathetic activity with concomitant catecholamine surge, leading to contraction band necrosis and other forms of myocardial damage and, as a result, troponin elevation.5,6 This may explain troponin elevation in patients with acute ischemic stroke in the absence of concomitant coronary artery disease. Recent evidence suggests that patients with acute ischemic stroke and elevated troponin had significantly less angiographic evidence of coronary artery disease than matched patients with non-ST-elevation myocardial infarction.7
CHRONIC KIDNEY DISEASE
Cardiac troponins may be elevated in chronic kidney disease. Explanations for this include the theory that troponin is broken down into fragments that are cleared by the kidney.8 Therefore, decreased renal function leads to an increase in troponin fragments measured with troponin assays. Other explanations are chronic volume overload, chronic elevation of proinflammatory cytokines, and associated comorbidities such as hypertension.
Troponin elevations can have prognostic significance in chronic kidney disease. In a meta-analysis of 98 studies of patients with chronic kidney disease and no symptoms of acute coronary syndrome, troponin elevation was associated with 2- to 4-fold higher rates of all-cause mortality, cardiovascular mortality, and major acute coronary events in both dialysis-dependent and nondialysis patients.8 Thus, troponin is a unique factor in risk-stratification in patients with chronic kidney disease and could affect how it is managed in the future.
To determine if an acute coronary syndrome is taking place when evaluating patients with chronic kidney disease and elevated troponins, physicians must use other evidence—for example, serial measurements of troponin levels showing continued troponin elevation, elevations in troponin from the patient’s baseline, elevated creatine kinase-MB levels, electrocardiographic changes, and clinical symptoms.
PULMONARY DISEASE
Troponin elevation can signify right heart strain in a variety of pulmonary diseases.
Pulmonary embolism. Troponin elevation is a marker of right ventricular dysfunction in patients with moderate to large pulmonary embolism.
In a study of normotensive patients with acute pulmonary embolism, 52% had elevated serum troponin, and they had a higher risk of an adverse outcome (death, recurrent pulmonary embolism, or major bleeding) within 30 days (odds ratio 4.97, 95% CI 1.71–14.43) and a lower probability of 6-month survival.9 Troponin elevation in pulmonary embolism is not helpful in confirming the diagnosis but is primarily useful in prognosis.
Pulmonary arterial hypertension. Cardiac troponin elevations can also indicate severe disease and poor outcomes in patients with pulmonary arterial hypertension. A study by Heresi et al10 confirmed this, even in patients with only slight elevations in troponin levels. Troponin was detected in 17 (25%) of 68 patients with pulmonary arterial hypertension diagnostic category 1. Further, patients with detectable troponin had more advanced functional class symptoms, a shorter 6-minute walk distance, more pericardial effusions, larger right atrial area, and higher B-type natriuretic peptide and C-reactive protein levels.10
Measuring troponins in the setting of pulmonary hypertension allows clinicians to identify high-risk patients and may help guide the management of these patients.
Chronic obstructive pulmonary disease. Elevation of serum troponins is also reported in patients with acute exacerbation of chronic obstructive pulmonary disease and has been correlated with increased all-cause mortality rates in these patients.11
CHEMOTHERAPY
Chemotherapy-induced cardiotoxicity may result in troponin elevations. Chemotherapy causes cardiac toxicity by several mechanisms, including production of oxygen free radicals, disturbance of mitochondrial energy metabolism, intracellular calcium overload, and increased lipid peroxidation. Chemotherapeutic agents associated with cardiotoxicity include anthracyclines, trastuzumab, chlormethine, and mitomycin.
Chemotherapy-induced left ventricular deterioration is often irreversible. Monitoring troponin levels can help identify problems before cardiac dysfunction becomes clinically evident during the weeks and months after the start of high-dose chemotherapy.
Cardinale et al12 found marked myocardial depression 7 months after the start of high-dose chemotherapy. They reported a close relationship between short-term troponin elevation and the greatest reduction in left-ventricular ejection fraction (r = −0.87; P < .0001). Normal troponin values after high-dose chemotherapy also seemed to identify patients at lower risk, with either no cardiac damage or only transient subclinical left-ventricular dysfunction.12
HEART FAILURE
Heart failure leads to release of cardiac troponins through myocardial strain and myocardial death. Volume and pressure overload of the ventricles causes excessive wall tension, resulting in myofibrillar damage. Measuring troponins is an effective way to detect cardiac myolysis in heart failure, independent of the presence of coronary artery disease.
In heart failure, elevated troponins correlate with adverse outcome in both hospitalized and stable patients. In addition, elevation of both troponins and B-type natriuretic peptide is associated with worse heart failure outcomes than elevation of either marker alone.
A prospective study13 of patients with New York Heart Association class III or IV heart failure showed that an increase in troponin concentration from normal baseline was associated with a risk of death, cardiac transplant, or hospitalization that was 3.4 to 5.09 times higher. Further elevations in B-type natriuretic peptide during the study period were associated with a poor outcome (hazard ratio 5.09; P < .001). Combined elevations of troponin and B-type natriuretic peptide defined the group at highest risk (hazard ratio 8.58; P < .001).
Increased myocardial wall stress may lead to decreased subendocardial perfusion, with resulting troponin elevation and decline in left ventricular systolic function. Further, in vitro experiments with myocytes established a link between myocardial wall stretch and programmed cell death, which may contribute to troponin elevations.14
STRESS CARDIOMYOPATHY
Profound reversible myocardial depression and troponin elevation are seen after sudden emotional stress, a condition called stress-induced or takotsubo cardiomyopathy. While the exact mechanism of stress-induced cardiomyopathy remains unclear, it is thought to be due to sudden supraphysiologic elevation of catecholamines and related neuropeptides. Although vasospasm in the epicardial and microvascular circulation has been suggested as the possible mechanism of left ventricular systolic dysfunction and troponin elevation, cardiac myocyte injury from catecholamine- induced cyclic AMP-mediated calcium overload and oxygen-derived free radicals appears to be a more likely mechanism.15
PSEUDOELEVATIONS OF TROPONIN
In rare cases, endogenous antibodies (eg, heterophilic antibodies) in the blood specimen can interfere with the processing of the troponin immunoassay in the laboratory, causing a false-positive assay. This can occur with samples from patients with a viral infection or autoimmune condition as well as with samples from patients treated with intravenous immunoglobulin (Ig). Heterophilic antibodies can bind to the Fc region of the test antibodies in certain troponin assays, leading to false-positive elevations.16 Macrotroponin, a molecule found in patients with autoantibodies against troponin I, is composed of troponin I fragments and IgG antibodies and can also cause a false-positive troponin immunoassay.16
In patients with seropositive rheumatoid arthritis, a false-positive troponin I assay was associated with a high concentration of IgM rheumatoid factor with the use of certain immunoassay techniques.17 In patients with acute skeletal muscle injury, the first-generation troponin T assay was found to be falsely positive due to the nonspecific binding of skeletal muscle troponin T to the walls of the test tube used for the assay. When the second-generation troponin T assay was used, troponin T levels were found to be slightly more positive than troponin I levels (1.7 vs 1.5 times the upper limit of normal), especially in patients with renal failure.18
Troponin may also be falsely elevated in hemolyzed blood samples. This has to be taken into consideration in interpreting the results of troponin testing in severely hemolyzed blood samples. However, Puelacher et al19 suggested that the presence of hemolysis did not appear to interfere with clinical value of the test.
- Piper HM, Schwartz P, Spahr R, Hütter J, Spieckermann P. Early enzyme release from myocardial cells is not due to irreversible cell damage. J Mol Cell Cardiol 1984; 16(4):385–388. doi:10.1016/S0022-2828(84)80609-4
- Ammann P, Fehr T, Minder EI, Günter C, Bertel O. Elevation of troponin I in sepsis and septic shock. Intensive Care Med 2001; 27(6):965–969.
- Landesberg G, Jaffe AS, Gilon D, et al. Troponin elevation in severe sepsis and septic shock. Crit Care Med 2014; 42(4):790–800. doi:10.1097/CCM.0000000000000107
- Bessière F, Khenifer S, Dubourg J, Durieu I, Lega JC. Prognostic value of troponins in sepsis: a meta-analysis. Intensive Care Med 2013; 39(7):1181–1189. doi:10.1007/s00134-013-2902-3
- Scheitz JF, Nolte CH, Laufs U, Endres M. Application and interpretation of high-sensitivity cardiac troponin assays in patients with acute ischemic stroke. Stroke 2015; 46(4):1132–1140. doi:10.1161/STROKEAHA.114.007858
- Naidech AM, Kreiter KT, Janjua N, et al. Cardiac troponin elevation, cardiovascular morbidity, and outcome after subarachnoid hemorrhage. Circulation 2005; 112(18):2851–2656. doi:10.1161/CIRCULATIONAHA.105.533620
- Mochmann HC, Scheitz JF, Petzold GC, et al; TRELAS Study Group. Coronary angiographic findings in acute ischemic stroke patients with elevated cardiac troponin: the Troponin Elevation in Acute Ischemic Stroke (TRELAS) Study. Circulation 2016; 133(13):1264–1271. doi:10.1161/CIRCULATIONAHA.115.018547
- Michos ED, Wilson LM, Yeh HC, et al. Prognostic value of cardiac troponin in patients with chronic kidney disease without suspected acute coronary syndrome. Ann Intern Med 2014; 161(7):491–501. doi:10.7326/M14-0743
- Lankeit M, Jiménez D, Kostrubiec M, et al. Predictive value of the high-sensitivity troponin T assay and the simplified pulmonary embolism severity index in hemodynamically stable patients with acute pulmonary embolism: a prospective validation study. Circulation 2011; 124(24):2716–2724. doi:10.1161/CIRCULATIONAHA.111.051177
- Heresi GA, Tang WH, Aytekin M, Hammel J, Hazen SL, Dweik RA. Sensitive cardiac troponin I predicts poor outcomes in pulmonary arterial hypertension. Eur Respir J 2012; 39(4)939–944. doi:10.1183/09031936.00067011
- Pavasini R, d’Ascenzo F, Campo G, et al. Cardiac troponin elevation predicts all-cause mortality in patients with acute exacerbation of chronic obstructive pulmonary disease: systematic review and meta-analysis. Int J Cardiol 2015; 191:187–193. doi:10.1016/j.ijcard.2015.05.006
- Cardinale D, Sandri MT, Martinoni A, et al. Left ventricular dysfunction predicted by early troponin I release after high-dose chemotherapy. J Am Coll Cardiol 2000; 36(2):517–522.
- Miller WL, Hartman KA, Burritt MF, et al. Serial biomarker measurements in ambulatory patients with chronic heart failure: the importance of change over time. Circulation 2007; 116(3):249–257. doi:10.1161/CIRCULATIONAHA.107.694562
- Logeart D, Beyne P, Cusson C, et al. Evidence of cardiac myolysis in severe nonischemic heart failure and the potential role of increased wall strain. Am Heart J 2001; 141(2):247–253. doi:10.1067/mhj.2001.111767
- Whittstein IS, Thiemann DR, Lima JA, et al. Neurohumoral features of myocardial stunning due to sudden emotional stress. N Engl J Med 2005; 352(6):539–548. doi:10.1056/NEJMoa043046
- McClennen S, Halamka JD, Horowitz GL, Kannam JP, Ho KK. Clinical prevalence and ramifications of false-positive cardiac troponin I elevations from the Abbott AxSYM Analyzer. Am J Cardiol 2003; 91(9):1125–1127.
- Bradham WS, Bian A, Oeser A, et al. High-sensitivity cardiac troponin-I is elevated in patients with rheumatoid arthritis, independent of cardiovascular risk factors and inflammation. PLoS One 2012; 7(6):e38930. doi:10.1371/journal.pone.0038930
- Li SF, Zapata J, Tillem E. The prevalence of false-positive cardiac troponin I in ED patients with rhabdomyolysis. Am J Emerg Med 2005; 23(7):860–863. doi:10.1016/j.ajem.2005.05.008
- Puelacher C, Twerenbold R, Mosimann T, et al. Effects of hemolysis on the diagnostic accuracy of cardiac troponin I for the diagnosis of myocardial infarction. Int J Cardiol 2015; 187:313–315. doi:10.1016/j.ijcard.2015.03.378
Yes. Sepsis, stroke, chronic kidney disease, pulmonary disease, chemotherapy, heart failure, and stress cardiomyopathy can all raise serum troponin concentrations, and in some cases the elevations are prognostically important. Careful clinical assessment, serial monitoring of troponin levels, and other supportive tests are usually necessary to tell whether troponin elevations are due to acute coronary syndrome or to these other causes.
NOT ONLY A MARKER OF MYOCARDIAL DAMAGE
Troponin, an intracellular protein found in skeletal and cardiac muscle cells, is essential for muscle contraction. Troponin T and troponin I are clinically equivalent, and both are biomarkers of myocardial damage.
A troponin assay is ordered when patients present with sudden onset of symptoms of acute coronary syndrome such as chest pain, dyspnea, diaphoresis, and electrocardiographic abnormalities. The assay is positive when the manufacturer-specified threshold corresponding to a concentration above the 99th percentile is detected.
Serial testing of serum biomarkers of acute myocardial damage is essential to confirm the diagnosis of myocardial infarction. Because of their higher sensitivity and specificity compared with creatine kinase-MB and other markers, troponins are the preferred biomarker in diagnosing acute coronary syndrome.
In 1984, Piper et al1 reported that free cytosolic pools of cardiac enzymes could be released after reversible myocardial injury as a result of temporary disruption of the cell membrane. This upended the previous assumption that troponin was released only after irreversible myocardial necrosis, and it provided an explanation for troponin elevations observed in conditions with no evidence of epicardial coronary artery disease or permanent myocardial damage.1
SEPSIS
Studies of patients with sepsis, severe sepsis, and septic shock have shown troponin elevations with no evidence of acute coronary syndrome.2 In sepsis, troponin elevations are presumed to be caused by a combination of events. Renal dysfunction leads to decreased clearance of troponin fragments by the kidneys. The massive inflammatory response in septic shock results in cytokine-induced cardiac damage, and increased levels of endogenous and exogenous catecholamines damage cardiac myocytes.3
Studies of the prognostic value of these elevations have produced mixed and contradictory results. But a 2013 meta-analysis4 showed that patients with a troponin elevation at the time of diagnosis of sepsis had a risk of death almost twice that of patients without a troponin elevation (relative risk 1.91, 95% confidence interval [CI] 1.63–2.24).
STROKE
Acute ischemic stroke can trigger troponin elevations in several ways. Since the risk factors for acute ischemic stroke and coronary stenosis are similar, patients who have an ischemic stroke have a higher risk of coronary atherosclerosis and coronary stenosis than the general population.5
Stroke can cause a variety of cardiovascular and respiratory responses (eg, tachyarrhythmia, hypertensive crisis, respiratory failure) that increase the stress on the myocardium. In patients with stroke and concurrent coronary artery stenosis, the increased metabolic demand can exceed the oxygen supply capacity, resulting in myocardial ischemia, which can manifest as increased levels of serum troponin.5
Stroke can also cause troponin elevation through neurogenic myocardial damage. Ischemic stroke and intracranial hemorrhage can trigger alterations in autonomic control. Sometimes this results in increased sympathetic activity with concomitant catecholamine surge, leading to contraction band necrosis and other forms of myocardial damage and, as a result, troponin elevation.5,6 This may explain troponin elevation in patients with acute ischemic stroke in the absence of concomitant coronary artery disease. Recent evidence suggests that patients with acute ischemic stroke and elevated troponin had significantly less angiographic evidence of coronary artery disease than matched patients with non-ST-elevation myocardial infarction.7
CHRONIC KIDNEY DISEASE
Cardiac troponins may be elevated in chronic kidney disease. Explanations for this include the theory that troponin is broken down into fragments that are cleared by the kidney.8 Therefore, decreased renal function leads to an increase in troponin fragments measured with troponin assays. Other explanations are chronic volume overload, chronic elevation of proinflammatory cytokines, and associated comorbidities such as hypertension.
Troponin elevations can have prognostic significance in chronic kidney disease. In a meta-analysis of 98 studies of patients with chronic kidney disease and no symptoms of acute coronary syndrome, troponin elevation was associated with 2- to 4-fold higher rates of all-cause mortality, cardiovascular mortality, and major acute coronary events in both dialysis-dependent and nondialysis patients.8 Thus, troponin is a unique factor in risk-stratification in patients with chronic kidney disease and could affect how it is managed in the future.
To determine if an acute coronary syndrome is taking place when evaluating patients with chronic kidney disease and elevated troponins, physicians must use other evidence—for example, serial measurements of troponin levels showing continued troponin elevation, elevations in troponin from the patient’s baseline, elevated creatine kinase-MB levels, electrocardiographic changes, and clinical symptoms.
PULMONARY DISEASE
Troponin elevation can signify right heart strain in a variety of pulmonary diseases.
Pulmonary embolism. Troponin elevation is a marker of right ventricular dysfunction in patients with moderate to large pulmonary embolism.
In a study of normotensive patients with acute pulmonary embolism, 52% had elevated serum troponin, and they had a higher risk of an adverse outcome (death, recurrent pulmonary embolism, or major bleeding) within 30 days (odds ratio 4.97, 95% CI 1.71–14.43) and a lower probability of 6-month survival.9 Troponin elevation in pulmonary embolism is not helpful in confirming the diagnosis but is primarily useful in prognosis.
Pulmonary arterial hypertension. Cardiac troponin elevations can also indicate severe disease and poor outcomes in patients with pulmonary arterial hypertension. A study by Heresi et al10 confirmed this, even in patients with only slight elevations in troponin levels. Troponin was detected in 17 (25%) of 68 patients with pulmonary arterial hypertension diagnostic category 1. Further, patients with detectable troponin had more advanced functional class symptoms, a shorter 6-minute walk distance, more pericardial effusions, larger right atrial area, and higher B-type natriuretic peptide and C-reactive protein levels.10
Measuring troponins in the setting of pulmonary hypertension allows clinicians to identify high-risk patients and may help guide the management of these patients.
Chronic obstructive pulmonary disease. Elevation of serum troponins is also reported in patients with acute exacerbation of chronic obstructive pulmonary disease and has been correlated with increased all-cause mortality rates in these patients.11
CHEMOTHERAPY
Chemotherapy-induced cardiotoxicity may result in troponin elevations. Chemotherapy causes cardiac toxicity by several mechanisms, including production of oxygen free radicals, disturbance of mitochondrial energy metabolism, intracellular calcium overload, and increased lipid peroxidation. Chemotherapeutic agents associated with cardiotoxicity include anthracyclines, trastuzumab, chlormethine, and mitomycin.
Chemotherapy-induced left ventricular deterioration is often irreversible. Monitoring troponin levels can help identify problems before cardiac dysfunction becomes clinically evident during the weeks and months after the start of high-dose chemotherapy.
Cardinale et al12 found marked myocardial depression 7 months after the start of high-dose chemotherapy. They reported a close relationship between short-term troponin elevation and the greatest reduction in left-ventricular ejection fraction (r = −0.87; P < .0001). Normal troponin values after high-dose chemotherapy also seemed to identify patients at lower risk, with either no cardiac damage or only transient subclinical left-ventricular dysfunction.12
HEART FAILURE
Heart failure leads to release of cardiac troponins through myocardial strain and myocardial death. Volume and pressure overload of the ventricles causes excessive wall tension, resulting in myofibrillar damage. Measuring troponins is an effective way to detect cardiac myolysis in heart failure, independent of the presence of coronary artery disease.
In heart failure, elevated troponins correlate with adverse outcome in both hospitalized and stable patients. In addition, elevation of both troponins and B-type natriuretic peptide is associated with worse heart failure outcomes than elevation of either marker alone.
A prospective study13 of patients with New York Heart Association class III or IV heart failure showed that an increase in troponin concentration from normal baseline was associated with a risk of death, cardiac transplant, or hospitalization that was 3.4 to 5.09 times higher. Further elevations in B-type natriuretic peptide during the study period were associated with a poor outcome (hazard ratio 5.09; P < .001). Combined elevations of troponin and B-type natriuretic peptide defined the group at highest risk (hazard ratio 8.58; P < .001).
Increased myocardial wall stress may lead to decreased subendocardial perfusion, with resulting troponin elevation and decline in left ventricular systolic function. Further, in vitro experiments with myocytes established a link between myocardial wall stretch and programmed cell death, which may contribute to troponin elevations.14
STRESS CARDIOMYOPATHY
Profound reversible myocardial depression and troponin elevation are seen after sudden emotional stress, a condition called stress-induced or takotsubo cardiomyopathy. While the exact mechanism of stress-induced cardiomyopathy remains unclear, it is thought to be due to sudden supraphysiologic elevation of catecholamines and related neuropeptides. Although vasospasm in the epicardial and microvascular circulation has been suggested as the possible mechanism of left ventricular systolic dysfunction and troponin elevation, cardiac myocyte injury from catecholamine- induced cyclic AMP-mediated calcium overload and oxygen-derived free radicals appears to be a more likely mechanism.15
PSEUDOELEVATIONS OF TROPONIN
In rare cases, endogenous antibodies (eg, heterophilic antibodies) in the blood specimen can interfere with the processing of the troponin immunoassay in the laboratory, causing a false-positive assay. This can occur with samples from patients with a viral infection or autoimmune condition as well as with samples from patients treated with intravenous immunoglobulin (Ig). Heterophilic antibodies can bind to the Fc region of the test antibodies in certain troponin assays, leading to false-positive elevations.16 Macrotroponin, a molecule found in patients with autoantibodies against troponin I, is composed of troponin I fragments and IgG antibodies and can also cause a false-positive troponin immunoassay.16
In patients with seropositive rheumatoid arthritis, a false-positive troponin I assay was associated with a high concentration of IgM rheumatoid factor with the use of certain immunoassay techniques.17 In patients with acute skeletal muscle injury, the first-generation troponin T assay was found to be falsely positive due to the nonspecific binding of skeletal muscle troponin T to the walls of the test tube used for the assay. When the second-generation troponin T assay was used, troponin T levels were found to be slightly more positive than troponin I levels (1.7 vs 1.5 times the upper limit of normal), especially in patients with renal failure.18
Troponin may also be falsely elevated in hemolyzed blood samples. This has to be taken into consideration in interpreting the results of troponin testing in severely hemolyzed blood samples. However, Puelacher et al19 suggested that the presence of hemolysis did not appear to interfere with clinical value of the test.
- Piper HM, Schwartz P, Spahr R, Hütter J, Spieckermann P. Early enzyme release from myocardial cells is not due to irreversible cell damage. J Mol Cell Cardiol 1984; 16(4):385–388. doi:10.1016/S0022-2828(84)80609-4
- Ammann P, Fehr T, Minder EI, Günter C, Bertel O. Elevation of troponin I in sepsis and septic shock. Intensive Care Med 2001; 27(6):965–969.
- Landesberg G, Jaffe AS, Gilon D, et al. Troponin elevation in severe sepsis and septic shock. Crit Care Med 2014; 42(4):790–800. doi:10.1097/CCM.0000000000000107
- Bessière F, Khenifer S, Dubourg J, Durieu I, Lega JC. Prognostic value of troponins in sepsis: a meta-analysis. Intensive Care Med 2013; 39(7):1181–1189. doi:10.1007/s00134-013-2902-3
- Scheitz JF, Nolte CH, Laufs U, Endres M. Application and interpretation of high-sensitivity cardiac troponin assays in patients with acute ischemic stroke. Stroke 2015; 46(4):1132–1140. doi:10.1161/STROKEAHA.114.007858
- Naidech AM, Kreiter KT, Janjua N, et al. Cardiac troponin elevation, cardiovascular morbidity, and outcome after subarachnoid hemorrhage. Circulation 2005; 112(18):2851–2656. doi:10.1161/CIRCULATIONAHA.105.533620
- Mochmann HC, Scheitz JF, Petzold GC, et al; TRELAS Study Group. Coronary angiographic findings in acute ischemic stroke patients with elevated cardiac troponin: the Troponin Elevation in Acute Ischemic Stroke (TRELAS) Study. Circulation 2016; 133(13):1264–1271. doi:10.1161/CIRCULATIONAHA.115.018547
- Michos ED, Wilson LM, Yeh HC, et al. Prognostic value of cardiac troponin in patients with chronic kidney disease without suspected acute coronary syndrome. Ann Intern Med 2014; 161(7):491–501. doi:10.7326/M14-0743
- Lankeit M, Jiménez D, Kostrubiec M, et al. Predictive value of the high-sensitivity troponin T assay and the simplified pulmonary embolism severity index in hemodynamically stable patients with acute pulmonary embolism: a prospective validation study. Circulation 2011; 124(24):2716–2724. doi:10.1161/CIRCULATIONAHA.111.051177
- Heresi GA, Tang WH, Aytekin M, Hammel J, Hazen SL, Dweik RA. Sensitive cardiac troponin I predicts poor outcomes in pulmonary arterial hypertension. Eur Respir J 2012; 39(4)939–944. doi:10.1183/09031936.00067011
- Pavasini R, d’Ascenzo F, Campo G, et al. Cardiac troponin elevation predicts all-cause mortality in patients with acute exacerbation of chronic obstructive pulmonary disease: systematic review and meta-analysis. Int J Cardiol 2015; 191:187–193. doi:10.1016/j.ijcard.2015.05.006
- Cardinale D, Sandri MT, Martinoni A, et al. Left ventricular dysfunction predicted by early troponin I release after high-dose chemotherapy. J Am Coll Cardiol 2000; 36(2):517–522.
- Miller WL, Hartman KA, Burritt MF, et al. Serial biomarker measurements in ambulatory patients with chronic heart failure: the importance of change over time. Circulation 2007; 116(3):249–257. doi:10.1161/CIRCULATIONAHA.107.694562
- Logeart D, Beyne P, Cusson C, et al. Evidence of cardiac myolysis in severe nonischemic heart failure and the potential role of increased wall strain. Am Heart J 2001; 141(2):247–253. doi:10.1067/mhj.2001.111767
- Whittstein IS, Thiemann DR, Lima JA, et al. Neurohumoral features of myocardial stunning due to sudden emotional stress. N Engl J Med 2005; 352(6):539–548. doi:10.1056/NEJMoa043046
- McClennen S, Halamka JD, Horowitz GL, Kannam JP, Ho KK. Clinical prevalence and ramifications of false-positive cardiac troponin I elevations from the Abbott AxSYM Analyzer. Am J Cardiol 2003; 91(9):1125–1127.
- Bradham WS, Bian A, Oeser A, et al. High-sensitivity cardiac troponin-I is elevated in patients with rheumatoid arthritis, independent of cardiovascular risk factors and inflammation. PLoS One 2012; 7(6):e38930. doi:10.1371/journal.pone.0038930
- Li SF, Zapata J, Tillem E. The prevalence of false-positive cardiac troponin I in ED patients with rhabdomyolysis. Am J Emerg Med 2005; 23(7):860–863. doi:10.1016/j.ajem.2005.05.008
- Puelacher C, Twerenbold R, Mosimann T, et al. Effects of hemolysis on the diagnostic accuracy of cardiac troponin I for the diagnosis of myocardial infarction. Int J Cardiol 2015; 187:313–315. doi:10.1016/j.ijcard.2015.03.378

Understanding the tests we order: Comments and an invitation
New laboratory tests seem to go through a life cycle. At first, some are used mainly by subspecialists, who became aware of them through early clinical trials or studies presented at specialty meetings. The general medical community adopts their use after noting that they are being ordered by consultants or were used in important published studies.
Sometimes, a new test is significantly better than the older ones, and clinical pathologists and subspecialists encourage us to use it. Sometimes, a new test may represent a breakthrough in the understanding of the pathophysiology of a disease, and its use is promoted by clinicians with special interest in that disease. Testing for serum troponin, as discussed by Sebastian et al in this issue of the Journal, is an example primarily of the first situation, while testing for antineutrophil cytoplasmic antibodies (ANCA) and immunoglobulin G4 are two of many examples of the second.
Once a test comes into widespread use, its accuracy and reproducibility can be problematic. The assay itself may have inherent weaknesses, or techniques may not be standardized among different laboratories; think about diagnosis of the antiphospholipid antibody syndrome. Standardization of laboratory techniques can often be achieved. For troponin, this remains a problem, though small, for patients whose serum is tested in different laboratories or for clinicians trying to directly compare different clinical trial results; but it doesn’t affect clinical decision-making when longitudinally following a specific patient through a single hospitalization.
In its mature years, as a useful novel test becomes widely used, it may alter how we view the management and pathophysiology of a disease. For example, in the days when postoperative myocardial infarction (MI) was diagnosed by electrocardiographic changes and then by elevations in creatine kinase (CK) and alterations in the ratio of aspartate aminotransferase (AST) to alanine aminotransferase (ALT), the peak in MI incidence was thought to occur several days after surgery. With the advent of CK isoenzymes and then cardiac myocyte-derived troponin, it became apparent that perioperative myocardial injury occurs more in a time frame of hours after surgery. Laboratory data dovetailed with pathologic and angiographic data indicating that the mechanism of MI in the perioperative setting for many patients is different than in “native” MI. As newer, highly sensitive troponin assays are introduced, they may further our understanding of mechanisms of cardiac myocyte membrane injury and tissue necrosis, and may further clarify (or blur) the distinction between the two.
Often, a widely used test is ordered in clinical situations that were not specifically evaluated during initial studies of the test and early use by specialists. Case reports of unexpected results then appear in the literature. Intrinsic test performance may occasionally be influenced in unanticipated ways (eg, rheumatoid factor can affect test results of some troponin and cryptococcal antigen assays), but more frequently it is the definition of “normal” and interpretation of the test results in specific clinical conditions that are affected. For example, troponin levels are higher in patients with chronic kidney disease and severe sepsis. These elevations may be explained by decreased renal clearance of detected fragments of troponin but may also reflect subclinical myocardial injury related to circulating cytokines or other factors. Elevation of troponins in patients with these and other conditions has correlated with poorer outcomes. Thus, in some settings, elevated circulating troponin has greater prognostic than diagnostic significance.
Recognizing imperfect test specificity (false-positive results) is critical when using a test in complex clinical situations. This can be especially challenging when using indirect serologic tests: consider the many reasons for “false-positive” antinuclear antibody, ANCA, and rheumatoid factor test results. But it can also be a challenge when trying to use a targeted test like troponin to distinguish between MI, sepsis, and pulmonary embolism as the cause of acute hypotension.
Many routinely ordered tests require more nuanced interpretation than simply checking the value against the defined laboratory “normal.” These nuances may be well known to those who order the test often or to specialists, but not to all. Familiarity with tests can also result in a subliminal assumption that we fully understand their characteristics and can lead to misinterpretation of results. There are forgotten critical concepts about tests that are ordered extremely commonly: eg, AST and ALT do not come only from the liver and do not reflect “liver function.” Liver biopsy is unlikely to provide the explanation for a myositis patient’s sense of weakness, even if the aminotransferase levels are elevated in the several-hundred range.
A CALL FOR MANUSCRIPTS
I invite you to draw on your personal experience and the literature and submit short manuscripts that address the nuanced interpretation, limitations, and cost of specific laboratory tests. As with all submissions, these will undergo peer review for content accuracy, as well as relevancy and utility for our core readership before being considered for publication.

Hidden lesion easily missed on chest radiography
A 46-year-old man with poorly controlled hypertension presented with the sudden onset of chest pain and shortness of breath. His blood pressure was 158/96 mm Hg and his left ventricular ejection fraction was less than 20%. He was admitted to the hospital for newly diagnosed heart failure.
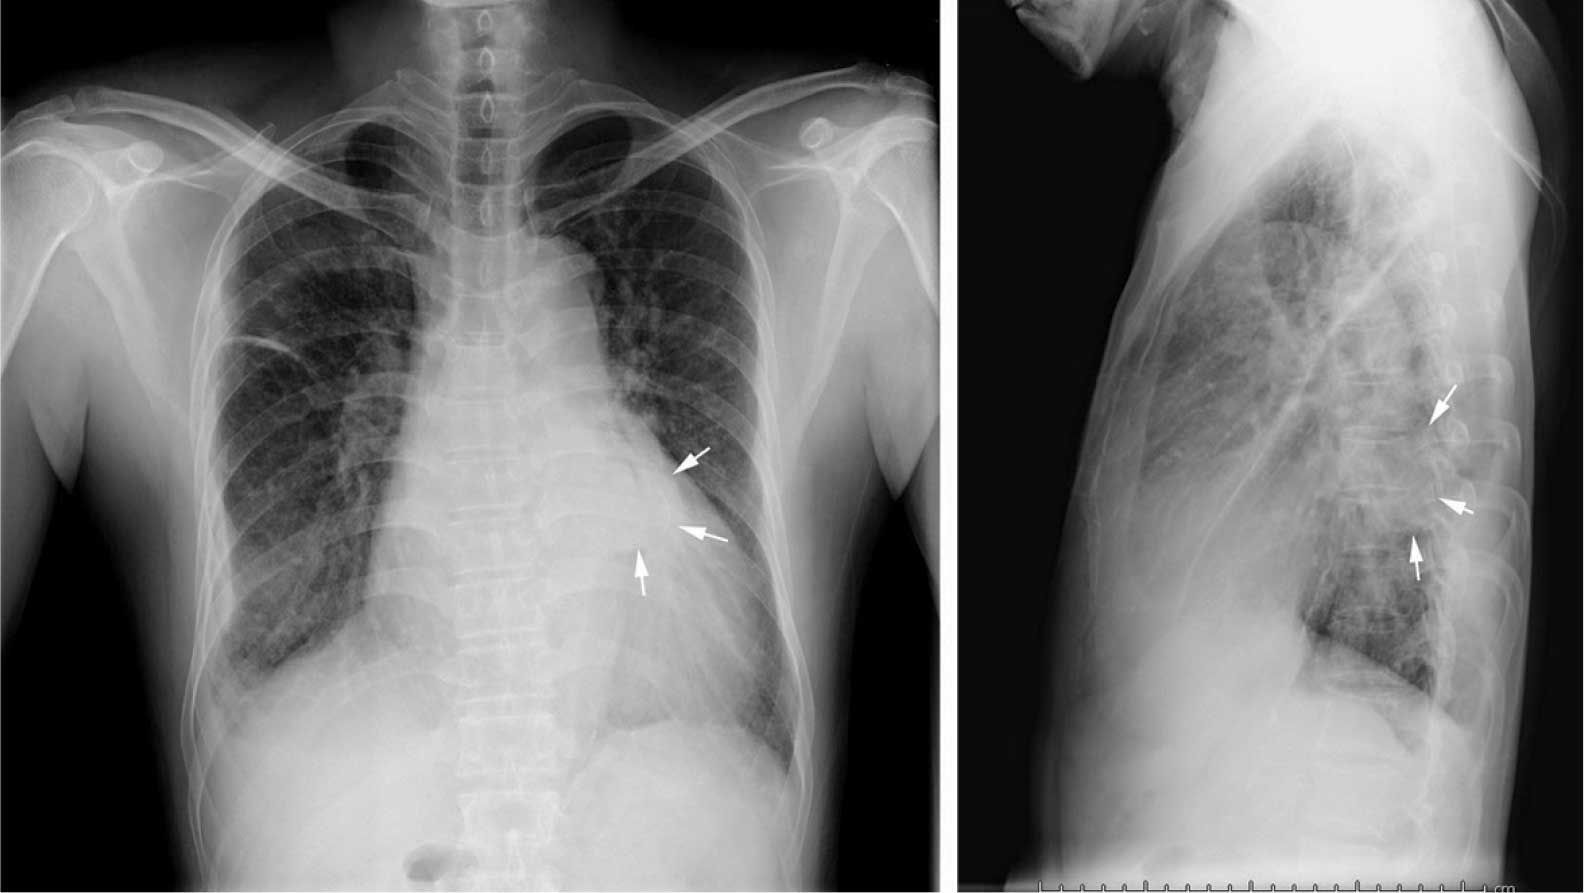
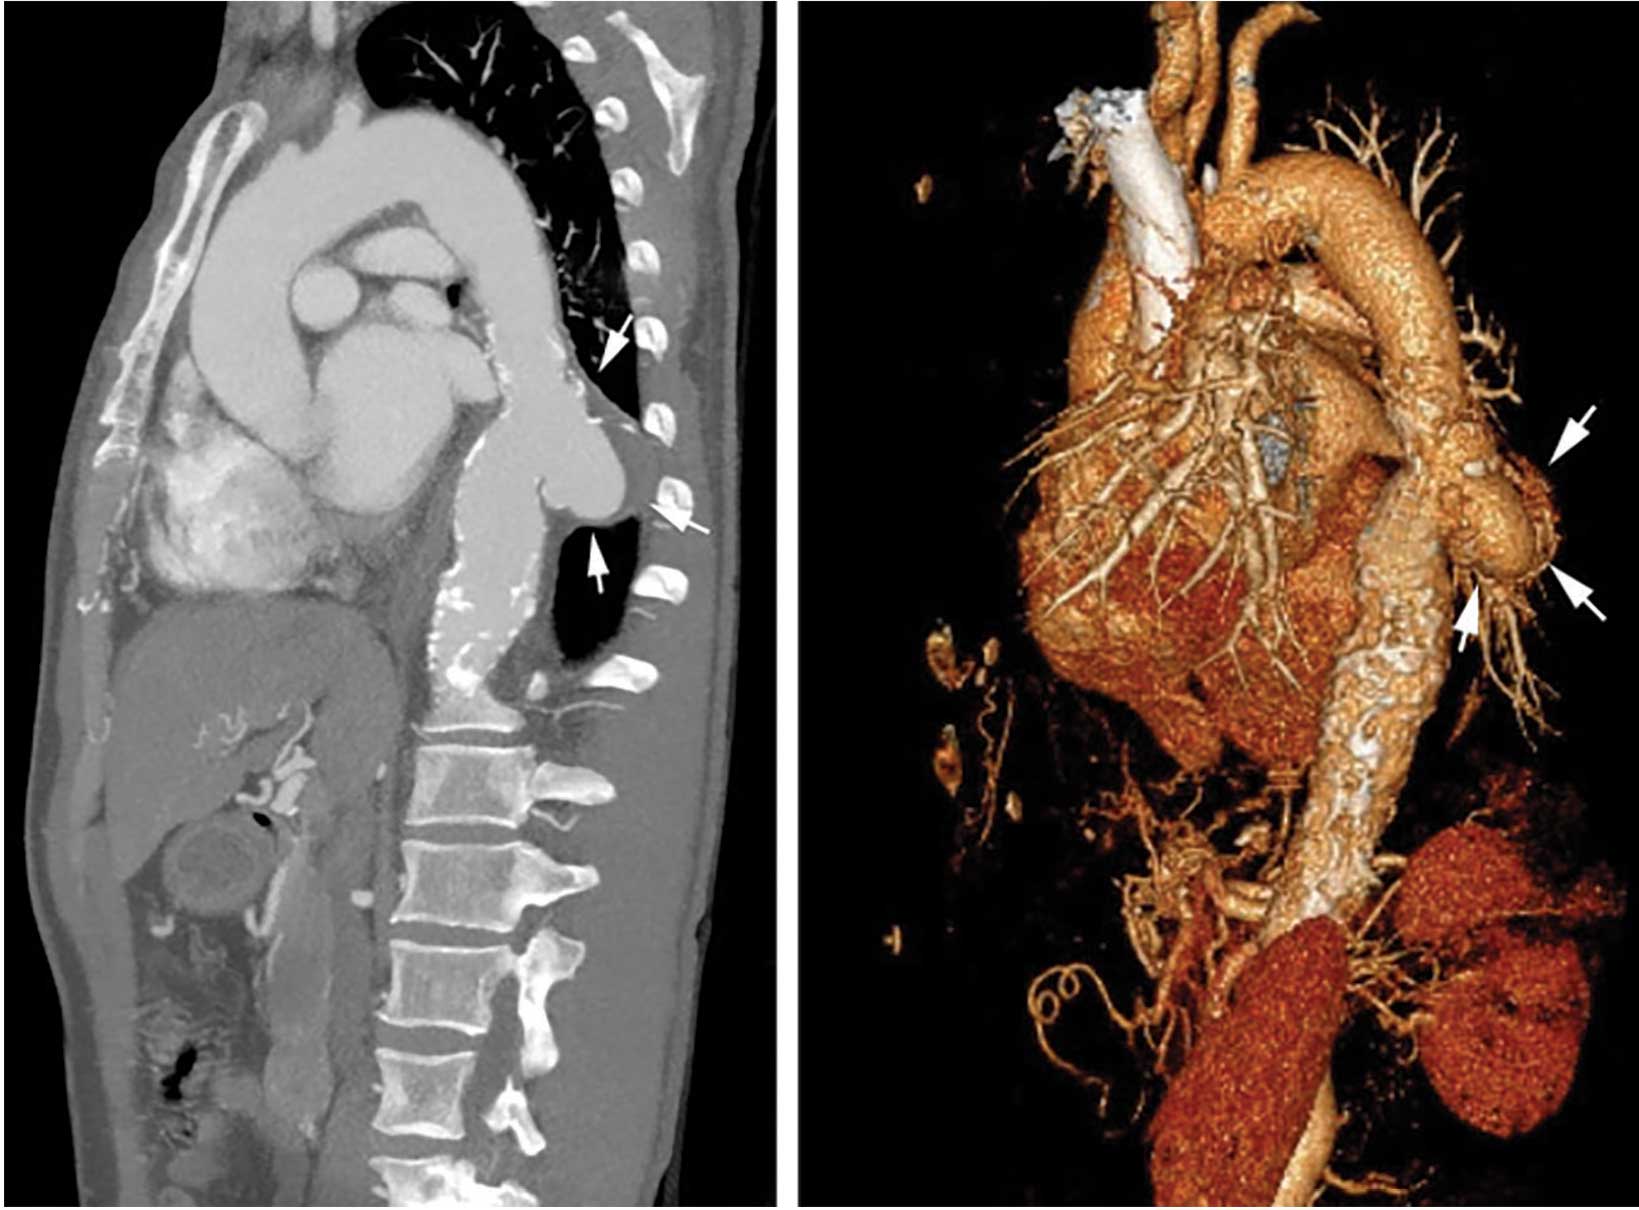
SACCULAR AORTIC ANEURYSMS
This case shows the value of carefully examining the chest radiograph, especially behind the heart.
Saccular aneurysms of the descending thoracic aorta are rare and can be easily missed if asymptomatic. They are less common than fusiform aneurysms and may be more prone to rupture. Shang et al1 identified atherosclerosis as the most frequent cause of saccular aneurysms of the thoracic aorta. However, they can be caused by other inflammatory conditions and infections.1
Without surgical repair, thoracic aortic aneurysms larger than 6 cm have higher rates of expansion and rupture (a 20% 6-year cumulative risk) than smaller ones.2 Mid-descending aortic aneurysms expand faster than those of the ascending aorta.3
Indications for surgery include rupture, severe chest pain, compressive symptoms, large size (eg, ≥ 5.5 cm for asymptomatic descending thoracic aneurysms), and rapid growth rate (≥ 10 mm per year), all of which are associated with a higher mortality rate.4
Endovascular grafting should be strongly considered in patients who have significant comorbidities, but this approach may have poorer long-term outcomes compared with open surgery. Blood pressure should be lowered as far as the patient can tolerate without adverse effects, usually with a beta-blocker along with either an angiotensin-converting enzyme inhibitor or an angiotensin receptor blocker.4
Statin therapy to lower the low-density lipoprotein cholesterol level to less than 70 mg/dL is also needed to reduce the risk of complications and cardiovascular disease.
All patients with saccular aortic aneurysm should be followed closely and be evaluated for surgery.
- Shang EK, Nathan DP, Boonn WW, et al. A modern experience with saccular aortic aneurysms. J Vasc Surg 2013; 57(1):84–88. doi:10.1016/j.jvs.2012.07.002
- Dapunt OE, Galla JD, Sadeghi AM, et al. The natural history of thoracic aortic aneurysms. J Thorac Cardiovasc Surg 1994; 107(5):1323–1333.
- Bonser RS, Pagano D, Lewis ME, et al. Clinical and patho-anatomical factors affecting expansion of thoracic aortic aneurysms. Heart 2000; 84(3):277–283.
- Hiratzka LF, Bakris GL, Beckman JA, et al. 2010 ACCF/AHA/AATS/ACR/ASA/SCA/SCAI/SIR/STS/SVM guidelines for the diagnosis and management of patients with thoracic aortic disease. Circulation 2010; 121(13):e266–e369. doi:10.1161/CIR.0b013e3181d4739e
Jessica Stempe
A 46-year-old man with poorly controlled hypertension presented with the sudden onset of chest pain and shortness of breath. His blood pressure was 158/96 mm Hg and his left ventricular ejection fraction was less than 20%. He was admitted to the hospital for newly diagnosed heart failure.
SACCULAR AORTIC ANEURYSMS
This case shows the value of carefully examining the chest radiograph, especially behind the heart.
Saccular aneurysms of the descending thoracic aorta are rare and can be easily missed if asymptomatic. They are less common than fusiform aneurysms and may be more prone to rupture. Shang et al1 identified atherosclerosis as the most frequent cause of saccular aneurysms of the thoracic aorta. However, they can be caused by other inflammatory conditions and infections.1
Without surgical repair, thoracic aortic aneurysms larger than 6 cm have higher rates of expansion and rupture (a 20% 6-year cumulative risk) than smaller ones.2 Mid-descending aortic aneurysms expand faster than those of the ascending aorta.3
Indications for surgery include rupture, severe chest pain, compressive symptoms, large size (eg, ≥ 5.5 cm for asymptomatic descending thoracic aneurysms), and rapid growth rate (≥ 10 mm per year), all of which are associated with a higher mortality rate.4
Endovascular grafting should be strongly considered in patients who have significant comorbidities, but this approach may have poorer long-term outcomes compared with open surgery. Blood pressure should be lowered as far as the patient can tolerate without adverse effects, usually with a beta-blocker along with either an angiotensin-converting enzyme inhibitor or an angiotensin receptor blocker.4
Statin therapy to lower the low-density lipoprotein cholesterol level to less than 70 mg/dL is also needed to reduce the risk of complications and cardiovascular disease.
All patients with saccular aortic aneurysm should be followed closely and be evaluated for surgery.
- Shang EK, Nathan DP, Boonn WW, et al. A modern experience with saccular aortic aneurysms. J Vasc Surg 2013; 57(1):84–88. doi:10.1016/j.jvs.2012.07.002
- Dapunt OE, Galla JD, Sadeghi AM, et al. The natural history of thoracic aortic aneurysms. J Thorac Cardiovasc Surg 1994; 107(5):1323–1333.
- Bonser RS, Pagano D, Lewis ME, et al. Clinical and patho-anatomical factors affecting expansion of thoracic aortic aneurysms. Heart 2000; 84(3):277–283.
- Hiratzka LF, Bakris GL, Beckman JA, et al. 2010 ACCF/AHA/AATS/ACR/ASA/SCA/SCAI/SIR/STS/SVM guidelines for the diagnosis and management of patients with thoracic aortic disease. Circulation 2010; 121(13):e266–e369. doi:10.1161/CIR.0b013e3181d4739e
Jessica Stempe
Jessica Stempe
Musculoskeletal ultrasonography basics
Ultrasonography has been used to evaluate musculoskeletal problems for decades but has only recently become more widely available in the United States. Advances in technology and physician familiarity are increasing its role in orthopedic imaging.
No single imaging method can yield all musculoskeletal diagnoses. Like any imaging technique, ultrasonography has strengths and weaknesses specific to orthopedics. Radiography, computed tomography (CT), and magnetic resonance imaging (MRI) play important roles for investigating musculoskeletal problems and are complementary to each other and to ultrasonography.
To help clinicians make informed decisions about ordering musculoskeletal ultrasonography, this article reviews the basic physics underlying ultrasonography, its advantages and disadvantages compared with other imaging methods, and common clinical applications.
CLASSIC TECHNOLOGY MAKING A RESURGENCE
The first reports of the use of musculoskeletal ultrasonography appeared in the 1970s for investigating the rotator cuff,1–3 actually preceding reports of its use in obstetrics and gynecology.4 In the 1980s, reports emerged for evaluating the Achilles tendon.5,6 After that, its popularity in the United States plateaued, likely because of the advent of MRI, lower reimbursement and greater variability in interpretation compared with MRI, as well as a lack of physicians and sonographers trained in its use.7,8
Musculoskeletal ultrasonography is currently experiencing a resurgence. Although it remains a specialized service more commonly available in large hospitals, its use is increasing rapidly, and it will likely become more widely available.
SPECIAL TRAINING REQUIRED
Musculoskeletal ultrasonography is simply an ultrasonographic examination of part of the musculoskeletal system. But because not all ultrasonographic transducers offer sufficient resolution for musculoskeletal evaluation and not all sonographers and imaging physicians are familiar with the specialized techniques, musculoskeletal ultrasonography often has a separate designation (eg, “MSKUS,” “MSUS”). At Cleveland Clinic, it is offered through the department of musculoskeletal imaging by subspecialty-trained musculoskeletal radiologists and specially trained musculoskeletal ultrasonographers with 4 to 5 years of training in the technique.
Musculoskeletal ultrasonography is also performed by physician groups with specialized training, including sports medicine physicians, rheumatologists, physiatrists, neurologists, and orthopedic surgeons. The American Institute of Ultrasound in Medicine offers voluntary accreditation for practice groups using musculoskeletal ultrasonography. Certification in musculoskeletal radiology is offered to sonographers through the American Registry for Diagnostic Medical Sonography.
SONOGRAPHY HAS UNIQUE QUALITIES
Ultrasonography uses high-frequency sound waves to generate images. The transducer (or probe) emits sound from the many piezoelectric elements at its surface, and the sound waves travel through and react with tissues. Sound reflected by tissues is detected by the transducer and converted to an image. Objects that reflect sound appear hyperechoic (brighter), whereas tissues that reflect little or no sound appear hypoechoic.
High-resolution imaging of superficial structures

(B, arrow).
Ultrasonography involves a fundamental trade-off between image resolution and imaging depth. Higher-frequency sound waves do not penetrate far into tissues but generate a higher-resolution image; lower-frequency sound waves can penetrate much further but yield a lower-resolution image. Although high-resolution imaging of deep structures with ultrasonography is not possible (Figure 1), many musculoskeletal structures are located superficially and are amenable to ultrasonographic evaluation.
Be aware of artifacts

Some materials attenuate sound very little, such as simple fluid. Low attenuation results in artifacts on ultrasonography, making tissues behind the simple fluid appear brighter than neighboring tissues. These artifacts may be reported as “increased through transmission” or “posterior acoustic enhancement.” Conversely, metal and bone reflect all sound waves that reach them, rendering any structures beyond them invisible. This “shadowing” creates a problem for imaging of structures in or near bone. Subcutaneous fat also attenuates sound waves, limiting the use of ultrasonography for patients with obesity (Figure 2).

High-frequency linear transducer sharpens images
High-frequency linear transducers reduce anisotropy because their flat surface keeps sound waves more uniformly perpendicular to the structure of interest.4,7 Their development has allowed imaging of superficial structures that is superior to that of MRI. A high-frequency linear transducer offers more than twice the spatial resolution of a typical 1.5T MRI examination of superficial tissue.12,13
Operator experience is critical
Ultrasonography examinations, more than other imaging tests, are dependent on operator experience. A solid understanding of musculoskeletal anatomy is imperative. Because the probe images only a thin section of tissue (about the thickness of a credit card), referencing adjacent structures for orientation is more difficult with ultrasonography than with CT or MRI.
The accuracy of ultrasonography is highly dependent on acquiring and interpreting images, whereas the accuracy of MRI is dependent primarily on image interpretation.7 Interpreting physicians must check that sonographers capture relevant targets.
STRENGTHS OF MUSCULOSKELETAL ULTRASONOGRAPHY
Ultrasonography has multiple advantages:
No ionizing radiation exposure.
Portability. Unlike CT or MRI, ultrasonography equipment is portable.
Increased patient comfort. Patient positioning for an ultrasonography examination is more flexible than for MRI or CT,14 and the examination does not induce claustrophobia.8
High-resolution imaging. Ultrasonography provides very-high-resolution imaging of superficial soft tissues—in some cases, higher than MRI or CT.
Real-time dynamic examinations are possible with ultrasonography, unlike with CT or MRI, and may increase test sensitivity.4,15–18
Implanted hardware is less of a problem. Although ultrasonography cannot image beyond implanted orthopedic metallic hardware, the hardware does not obscure surrounding soft tissues as it does on CT and MRI.6,19,20 Also, ultrasonography is safe for patients with a pacemaker.8
WEAKNESSES

The main disadvantages of musculoskeletal ultrasonography are inherent to its limited field of view, making it inappropriate for a survey examination (eg, for ankle pain, knee pain, hip pain).4 Unlike CT and MRI, ultrasonography does not provide a “bird’s-eye view,” and important abnormalities can be missed during evaluation of large areas (Figure 4).
Ultrasonography also cannot evaluate bone or intra-articular structures such as cartilage, bone marrow, labrum, and intra-articular ligaments; MRI is the standard for evaluating these structures.21
Ultrasonography is time-consuming. To perform a detailed examination of the anterior, posterior, medial, and lateral aspects of the hip, knee, or ankle would require 1.5 to 2 hours of scanning time and an additional 10 to 25 minutes of image checking and interpretation.
CURRENT CLINICAL INDICATIONS
Musculoskeletal ultrasonography is best used for clinical questions regarding limited, superficial musculoskeletal problems.
Fluid collections
Ultrasonography can help evaluate small fluid collections in soft tissue. As is true for a lung opacity on chest radiography, soft-tissue fluid detected on ultrasonography is nonspecific, and results must be correlated with the clinical picture to narrow the differential diagnosis.
Fluid collections can be classified as loculated or nonloculated.
Nonloculated fluid involves more fluid than is simply interposed between tissue planes and has no wall or defined margins. It can be simple or complex in appearance: simple fluid is anechoic, and complex fluid appears more heterogeneous and may contain septations or debris.
Subcutaneous edema, which may occur postoperatively or from trauma, venous insufficiency, or inflammatory or infectious processes, appears on ultrasonography as nonloculated fluid interspersed between subcutaneous fat lobules.
Loculated fluid collections have well-defined margins or a discrete wall that does not follow normal tissue planes. They can also be simple or complex and can be caused by hematoma, abscess, or ganglion. Less commonly, neoplasms can mimic a loculated fluid collection (Figure 4).
A ganglion is a specific type of loculated fluid collection containing synovial fluid arising from a joint or tendon sheath. It tends to occur in specific locations, most commonly around the wrist, most often arising from the dorsal scapholunate ligament and volar wrist between the radial artery and flexor carpi radialis.22 On MRI, it can be difficult to distinguish between small vascular structures and a small ganglion, especially in the hands and feet.23
Ultrasonography can also help identify a Baker cyst, a specific fluid collection arising from the semimembranosus bursa between the medial head of the gastrocnemius tendon and the semimembranosus tendon. Ultrasonography can also detect inflammation, rupture, or leaking associated with a Baker cyst.24
Power Doppler is an ultrasonographic examination that can detect increased blood flow surrounding a fluid collection and determine the likelihood of an acute inflammatory or infectious cause.25
Joint effusion and synovitis
Musculoskeletal ultrasonography can help evaluate joints for effusion and synovitis. It is highly sensitive (94%) and specific (95%) for synovitis, making it superior to contrast-enhanced MRI.26,27 The area of concern should be limited to 1 quadrant of a joint (anterior, posterior, medial, or lateral); for problems beyond that, MRI should be considered.
A joint effusion appears as a distended joint capsule containing hypoechoic (complex) or anechoic (simple) joint fluid.
Complex joint fluid may contain debris and occurs with hemarthrosis, infection, and inflammation.23 Hypertrophied synovium is hypoechoic and can mimic complex joint fluid.
Power Doppler evaluation can help distinguish synovitis from joint fluid by demonstrating blood flow, a feature of synovitis but not of simple joint fluid. Power Doppler is the most sensitive means of detecting blood flow, although it does not show direction of flow.28
Using ultrasonography can help to improve disease control and minimize disabling changes by monitoring synovitis therapy. In addition, subclinical synovitis and enthesitis (inflammation of insertion sites of tendons or ligaments into bone) detected by ultrasonography may predict future disease and disease flares.29–31
Ultrasonographic guidance for a wide range of procedures is increasing rapidly.32–36 Multiple studies have shown the advantage of ultrasonography-guided aspiration and injection compared with techniques without imaging guidance.37,38
Soft-tissue masses
Accurately diagnosing soft-tissue masses can be difficult. A mass may remain indeterminate even after multiple imaging studies, requiring biopsy or surgical referral. However, for a few specific masses, ultrasonography is highly accurate and can eliminate the need for further imaging.

Ultrasonography can help evaluate soft- tissue masses no larger than 5 cm in diameter and no deeper than superficial muscular fascia. If the mass is larger or deeper than that, ultrasonography is less reliable for showing the margins of the mass and its relationship to adjacent structures (Figure 5). Further imaging by MRI may be recommended in such cases.
Fortunately, many of the most common soft-tissue masses can be accurately diagnosed with ultrasonography, including lipomas, ganglion cysts, foreign bodies, and simple fluid collections.4,39 Nerve-sheath tumors can also be diagnosed with ultrasonography if the lesion clearly arises from a nerve. Other soft-tissue masses are likely to be indeterminate with ultrasonography, requiring follow-up with MRI with contrast.
Tendons
Musculoskeletal ultrasonography can be effective for evaluating tendons around joints, especially 1 or a small number of nearby superficial tendons. Tendons particularly well suited for ultrasonographic examination include:
- Upper-extremity tendons located in the rotator cuff or around the elbow, and flexor and extensor tendons of the hands; ultrasonographic evaluation of the rotator cuff is highly accurate, equivalent to that of MRI for partial-thickness and full-thickness tearing40–43
- Lower-extremity tendons of the extensor mechanism of the knee, distal hamstring tendons, tendons around the ankle,44–46 and flexor and extensor tendons of the foot.

Ultrasonography can help diagnose a variety of tendon abnormalities (Table 1),48,49 including tearing, for which a dynamic examination can be performed.
Many tendons have a tendon sheath containing tenosynovium, while others have surrounding peritenon only; either can become thickened and inflamed. Tenosynovitis is a nonspecific finding and may be inflammatory, infectious, or posttraumatic. The presence of tendon sheath fluid alone on ultrasonography can be a normal finding, and some tendon sheaths that communicate with adjacent joints (eg, the long head biceps tendon, the flexor hallucis longus tendon) commonly contain simple fluid.6 A dynamic examination with ultrasonography can help diagnose snapping related to abnormal tendon movement, for example, in the case of intra-sheath and extra-sheath subluxation of the peroneal tendons.45,50,51
Ligaments
Ultrasonography can detect abnormalities in many superficial ligaments (Table 1).
Ankle. Ankle ligaments are superficial and can be clearly visualized. The diagnostic accuracy of ultrasonography for tearing of the anterior talofibular ligament may be as high as 100%.50,52,53
Elbow and thumb. The larger of the collateral ligaments of the elbow, especially the ulnar collateral ligament, and the ulnar collateral ligament of the thumb can be effectively evaluated with ultrasonography.54,55
Knee. The collateral ligaments of the knee can be seen with ultrasonography, but injuries of the external ligaments of the knee are often associated with intrinsic derangements that cannot be evaluated with ultrasonography.56,57 Intra-articular ligaments such as the anterior cruciate ligament are also not amenable to ultrasonography.
Dynamic examination of a ligament with ultrasonography can help determine the grade of the injury.
Deeply located ligaments (eg, around the hip) and ligaments surrounded by bone, such as the Lisfranc ligament, cannot be completely seen on ultrasonography.
Muscle
Musculoskeletal ultrasonography is useful for small areas of concern within a muscle (Table 1). It can detect muscle strains and tears, intramuscular collections or lesions, and fascial scarring or fascial injuries such as superficial muscle herniation. Although ultrasonography may yield a definitive diagnosis for a muscle problem, further imaging may be needed.
Nerves
Ultrasonography is useful for peripheral nerve investigation but requires a steep learning curve for sonographers and interpreting physicians.58,59 It is best suited for directed questions regarding focal abnormal nerve findings on physical examination.
Ultrasonography can help identify areas of nerve entrapment caused by a mass or dynamic compression. It can detect neuritis (Table 1), lesions of peripheral nerves (eg, nerve-sheath tumors), and neuromas (eg, Morton neuroma of the intermetatarsal space). In a large meta-analysis, ultrasonography and MRI were found to be equally accurate for detecting Morton neuroma.60 Even for nerve-sheath tumors located deep to the muscular fascia, ultrasonography can confirm the diagnosis because of the characteristic appearance of the nerves. Ultrasonography can also demonstrate a large extent of the course of superficial peripheral nerves while keeping the imaging plane appropriately oriented to the nerves.
Acknowledgment: We would like to sincerely thank Megan Griffiths, MA, for her help in the preparation and submission of this manuscript.
- Hamilton JV, Flinn G Jr, Haynie CC, Cefalo RC. Diagnosis of rectus sheath hematoma by B-mode ultrasound: a case report. Am J Obstet Gynecol 1976; 125(4):562–565. doi:10.1016/0002-9378(76)90379-3
- Zweymüller VK, Kratochwil A. Ultrasound diagnosis of bone and soft tissue tumours. Wien Klin Wochenschr 1975; 87(12):397–398. German.
- Mayer V. Ultrasonography of the rotator cuff. J Ultrasound Med 1985; 4(11):608, 607. doi:10.7863/jum.1985.4.11.608
- McNally EG. The development and clinical applications of musculoskeletal ultrasound. Skeletal Radiol 2011; 40(9):1223–1231. doi:10.1007/s00256-011-1220-5
- Ignashin NS, Girshin SG, Tsypin IS. Ultrasonic scanning in subcutaneous rupture of the Achilles tendon. Vestn Khir Im I I Grek 1981; 127(9):82–85. Russian.
- Robinson P. Sonography of common tendon injuries. AJR Am J Roentgenol 2009; 193(3):607–618. doi:10.2214/AJR.09.2808
- Jacobson JA. Musculoskeletal ultrasound: focused impact on MRI. AJR Am J Roentgenol 2009; 193(3):619–627. doi:10.2214/AJR.09.2841
- Nazarian LN. The top 10 reasons musculoskeletal sonography is an important complementary or alternative technique to MRI. AJR Am J Roentgenol 2008; 190(6):1621–1626. doi:10.2214/AJR.07.3385
- AIUM technical bulletin. Transducer manipulation. American Institute of Ultrasound in Medicine. J Ultrasound Med 1999; 18(2):169–175. doi:10.7863/jum.1999.18.2.169
- Connolly DJ, Berman L, McNally EG. The use of beam angulation to overcome anisotropy when viewing human tendon with high frequency linear array ultrasound. Br J Radiol 2001; 74 (878):183–185. doi:10.1259/bjr.74.878.740183
- Crass JR, van de Vegte GL, Harkavy LA. Tendon echogenicity: ex vivo study. Radiology 1988; 167(2):499–501. doi:10.1148/radiology.167.2.3282264
- Erickson SJ. High-resolution imaging of the musculoskeletal system. Radiology 1997; 205(3):593–618. doi:10.1148/radiology.205.3.9393511
- Link TM, Majumdar S, Peterfy C, et al. High resolution MRI of small joints: impact of spatial resolution on diagnostic performance and SNR. Magn Reson Imaging 1998; 16(2):147–155. doi:10.1016/S0730-725X(97)00244-0
- Middleton WD, Payne WT, Teefey SA, Hildebolt CF, Rubin DA, Yamaguchi K. Sonography and MRI of the shoulder: comparison of patient satisfaction. AJR Am J Roentgenol 2004; 183(5):1449–1452. doi:10.2214/ajr.183.5.1831449
- Khoury V, Cardinal E, Bureau NJ. Musculoskeletal sonography: a dynamic tool for usual and unusual disorders. AJR Am J Roentgenol 2007; 188(1):W63–W73. doi:10.2214/AJR.06.0579
- Farin PU, Jaroma H, Harju A, Soimakallio S. Medial displacement of the biceps brachii tendon: evaluation with dynamic sonography during maximal external shoulder rotation. Radiology 1995; 195(3):845–848. doi:10.1148/radiology.195.3.7754019
- Miller TT, Adler RS, Friedman L. Sonography of injury of the ulnar collateral ligament of the elbow-initial experience. Skeletal Radiol 2004; 33(7):386–391. doi:10.1007/s00256-004-0788-4
- Nazarian LN, McShane JM, Ciccotti MG, O’Kane PL, Harwood MI. Dynamic US of the anterior band of the ulnar collateral ligament of the elbow in asymptomatic major league baseball pitchers. Radiology 2003; 227(1):149–154. doi:10.1148/radiol.2271020288
- Jacobson JA, Lax MJ. Musculoskeletal sonography of the postoperative orthopedic patient. Semin Musculoskelet Radiol 2002; 6(1):67–77. doi:10.1055/s-2002-23165
- Sofka CM, Adler RS. Original report. Sonographic evaluation of shoulder arthroplasty. AJR Am J Roentgenol 2003; 180(4):1117–1120. doi:10.2214/ajr.180.4.1801117
- Silvestri E, Martinoli C, Derchi LE, Bertolotto M, Chiaramondia M, Rosenberg I. Echotexture of peripheral nerves: correlation between US and histologic findings and criteria to differentiate tendons. Radiology 1995; 197(1):291–296. doi:10.1148/radiology.197.1.7568840
- Cardinal E, Buckwalter KA, Braunstein EM, Mih AD. Occult dorsal carpal ganglion: comparison of US and MR imaging. Radiology 1994; 193(1):259–262. doi:10.1148/radiology.193.1.8090903
- Jacobson JA. Musculoskeletal ultrasound and MRI: which do I choose? Semin Musculoskelet Radiol 2005; 9(2):135–149. doi:10.1055/s-2005-872339
- Ward EE, Jacobson JA, Fessell DP, Hayes CW, van Holsbeeck M. Sonographic detection of Baker’s cysts: comparison with MR imaging. AJR Am J Roentgenol 2001; 176(2):373–380. doi:10.2214/ajr.176.2.1760373
- Bhasin S, Cheung PP. The role of power Doppler ultrasonography as disease activity marker in rheumatoid arthritis. Dis Markers 2015; 2015:325909. doi:10.1155/2015/325909
- Fukuba E, Yoshizako T, Kitagaki H, Murakawa Y, Kondo M, Uchida N. Power Doppler ultrasonography for assessment of rheumatoid synovitis: comparison with dynamic magnetic resonance imaging. Clin Imaging 2013; 37(1):134–137. doi:10.1016/j.clinimag.2012.02.008
- Takase-Minegishi K, Horita N, Kobayashi K, et al. Diagnostic test accuracy of ultrasound for synovitis in rheumatoid arthritis: systematic review and meta-analysis. Rheumatology (Oxford) 2018; 57(1):49–58. doi:10.1093/rheumatology/kex036
- Klareskog L, Catrina AI, Paget S. Rheumatoid arthritis. Lancet 2009; 373(9664):659–672. doi:10.1016/S0140-6736(09)60008-8
- Ash ZR, Tinazzi I, Gallego CC, et al. Psoriasis patients with nail disease have a greater magnitude of underlying systemic subclinical enthesopathy than those with normal nails. Ann Rheum Dis 2012; 71(4):553–556. doi:10.1136/annrheumdis-2011-200478
- Han J, Geng Y, Deng X, Zhang Z. Subclinical synovitis assessed by ultrasound predicts flare and progressive bone erosion in rheumatoid arthritis patients with clinical remission: a systematic review and metaanalysis. J Rheumatol 2016; 43(11):2010–2018. doi.org/10.3899/jrheum.160193
- Iagnocco A, Finucci A, Ceccarelli F, Perricone C, Iorgoveanu V, Valesini G. Power Doppler ultrasound monitoring of response to anti-tumour necrosis factor alpha treatment in patients with rheumatoid arthritis. Rheumatology (Oxford) 2015; 54(10):1890–1896. doi:10.1093/rheumatology/kev211
- Henning PT. Ultrasound-guided foot and ankle procedures. Phys Med Rehabil Clin N Am 2016; 27(3):649–671. doi:10.1016/j.pmr.2016.04.005
- Lueders DR, Smith J, Sellon JL. Ultrasound-guided knee procedures. Phys Med Rehabil Clin North Am 2016; 27(3):631–648. doi:10.1016/j.pmr.2016.04.010
- Payne JM. Ultrasound-guided hip procedures. Phys Med Rehabil Clin North Am 2016; 27(3):607–629. doi:10.1016/j.pmr.2016.04.004
- Strakowski JA. Ultrasound-guided peripheral nerve procedures. Phys Med Rehabil Clin North Am 2016; 27(3):687–715. doi:10.1016/j.pmr.2016.04.006
- Sussman WI, Williams CJ, Mautner K. Ultrasound-guided elbow procedures. Phys Med Rehabil Clin North Am 2016; 27(3):573–587. doi:10.1016/j.pmr.2016.04.002
- Finnoff JT. The evolution of diagnostic and interventional ultrasound in sports medicine. PM R 2016; 8(suppl 3):S133–S138. doi:10.1016/j.pmrj.2015.09.022
- Wu T, Dong Y, Song H, Fu Y, Li JH. Ultrasound-guided versus landmark in knee arthrocentesis: a systematic review. Semin Arthritis Rheum 2016; 45(5):627–632. doi:10.1016/j.semarthrit.2015.10.011
- Failla JM, van Holsbeeck M, Vanderschueren G. Detection of a 0.5-mm-thick thorn using ultrasound: a case report. J Hand Surg Am 1995; 20(3):456–457.
- Teefey SA, Hasan SA, Middleton WD, Patel M, Wright RW, Yamaguchi K. Ultrasonography of the rotator cuff. A comparison of ultrasonographic and arthroscopic findings in one hundred consecutive cases. J Bone Joint Surg Am 2000; 82(4):498–504.
- van Holsbeeck MT, Kolowich PA, Eyler WR, et al. US depiction of partial-thickness tear of the rotator cuff. Radiology 1995; 197(2):443–446. doi:10.1148/radiology.197.2.7480690
- Balich SM, Sheley RC, Brown TR, Sauser DD, Quinn SF. MR imaging of the rotator cuff tendon: interobserver agreement and analysis of interpretive errors. Radiology 1997; 204(1):191–194. doi:10.1148/radiology.204.1.9205245
- Dinnes J, Loveman E, McIntyre L, Waugh N. The effectiveness of diagnostic tests for the assessment of shoulder pain due to soft tissue disorders: a systematic review. Health Technol Assess 2003; 7(29):1–166. doi:10.3310/hta7290
- Rockett MS, Waitches G, Sudakoff G, Brage M. Use of ultrasonography versus magnetic resonance imaging for tendon abnormalities around the ankle. Foot Ankle Int 1998; 19(9):604–612.
- Grant TH, Kelikian AS, Jereb SE, McCarthy RJ. Ultrasound diagnosis of peroneal tendon tears. A surgical correlation. J Bone Joint Surg Am 2005; 87(8):1788–1794. doi:10.2106/JBJS.D.02450
- Hartgerink P, Fessell DP, Jacobson JA, van Holsbeeck MT. Full- versus partial-thickness Achilles tendon tears: sonographic accuracy and characterization in 26 cases with surgical correlation. Radiology 2001; 220(2):406–412. doi:10.1148/radiology.220.2.r01au41406
- Cho KH, Park BH, Yeon KM. Ultrasound of the adult hip. Semin Ultrasound CT MR 2000; 21(3):214–230.
- Adler RS, Finzel KC. The complementary roles of MR imaging and ultrasound of tendons. Radiol Clin North Am 2005; 43(4):771–807. doi:10.1016/j.rcl.2005.02.011
- Martinoli C, Bianchi S, Derchi LE. Tendon and nerve sonography. Radiol Clin North Am 1999; 37(4):691–711. doi:10.1016/S0033-8389(05)70124-X
- Fessell DP, Vanderschueren GM, Jacobson JA, et al. US of the ankle: technique, anatomy, and diagnosis of pathologic conditions. Radiographics 1998; 18(2):325–340. doi:10.1148/radiographics.18.2.9536481
- Neustadter J, Raikin SM, Nazarian LN. Dynamic sonographic evaluation of peroneal tendon subluxation. AJR Am J Roentgenol 2004; 183(4):985–988. doi:10.2214/ajr.183.4.1830985
- Verhaven EF, Shahabpour M, Handelberg FW, Vaes PH, Opdecam PJ. The accuracy of three-dimensional magnetic resonance imaging in the diagnosis of ruptures of the lateral ligaments of the ankle. Am J Sports Med 1991; 19(6):583–587. doi:10.1177/036354659101900605
- Milz P, Milz S, Steinborn M, Mittlmeier T, Putz R, Reiser M. Lateral ankle ligaments and tibiofibular syndesmosis. 13-MHz high-frequency sonography and MRI compared in 20 patients. Acta Orthop Scand 1998; 69(1):51–55.
- De Smet AA, Winter TC, Best TM, Bernhardt DT. Dynamic sonography with valgus stress to assess elbow ulnar collateral ligament injury in baseball pitchers. Skeletal Radiol 2002; 31(11):671–676. doi:10.1007/s00256-002-0558-0
- Melville DM, Jacobson JA, Fessell DP. Ultrasound of the thumb ulnar collateral ligament: technique and pathology. AJR Am J Roentgenol 2014; 202(2):W168. doi:10.2214/AJR.13.11335
- Court-Payen M. Sonography of the knee: intra-articular pathology. J Clin Ultrasound 2004; 32(9):481–490. doi:10.1002/jcu.20069
- Azzoni R, Cabitza P. Is there a role for sonography in the diagnosis of tears of the knee menisci? J Clin Ultrasound 2002; 30(8):472–476. doi:10.1002/jcu.10106
- Jacobson JA, Wilson TJ, Yang LJ. Sonography of common peripheral nerve disorders with clinical correlation. J Ultrasound Med 2016; 35(4):683–693. doi:10.7863/ultra.15.05061
- Ali ZS, Pisapia JM, Ma TS, Zager EL, Heuer GG, Khoury V. Ultrasonographic evaluation of peripheral nerves. World Neurosurg 2016; 85(1):333–339. doi:10.1016/j.wneu.2015.10.005
- Bignotti B, Signori A, Sormani MP, Molfetta L, Martinoli C, Tagliafico A. Ultrasound versus magnetic resonance imaging for Morton neuroma: systematic review and meta-analysis. Eur Radiol 2015; 25(8):2254–2262. doi:10.1007/s00330-015-3633-3
Ultrasonography has been used to evaluate musculoskeletal problems for decades but has only recently become more widely available in the United States. Advances in technology and physician familiarity are increasing its role in orthopedic imaging.
No single imaging method can yield all musculoskeletal diagnoses. Like any imaging technique, ultrasonography has strengths and weaknesses specific to orthopedics. Radiography, computed tomography (CT), and magnetic resonance imaging (MRI) play important roles for investigating musculoskeletal problems and are complementary to each other and to ultrasonography.
To help clinicians make informed decisions about ordering musculoskeletal ultrasonography, this article reviews the basic physics underlying ultrasonography, its advantages and disadvantages compared with other imaging methods, and common clinical applications.
CLASSIC TECHNOLOGY MAKING A RESURGENCE
The first reports of the use of musculoskeletal ultrasonography appeared in the 1970s for investigating the rotator cuff,1–3 actually preceding reports of its use in obstetrics and gynecology.4 In the 1980s, reports emerged for evaluating the Achilles tendon.5,6 After that, its popularity in the United States plateaued, likely because of the advent of MRI, lower reimbursement and greater variability in interpretation compared with MRI, as well as a lack of physicians and sonographers trained in its use.7,8
Musculoskeletal ultrasonography is currently experiencing a resurgence. Although it remains a specialized service more commonly available in large hospitals, its use is increasing rapidly, and it will likely become more widely available.
SPECIAL TRAINING REQUIRED
Musculoskeletal ultrasonography is simply an ultrasonographic examination of part of the musculoskeletal system. But because not all ultrasonographic transducers offer sufficient resolution for musculoskeletal evaluation and not all sonographers and imaging physicians are familiar with the specialized techniques, musculoskeletal ultrasonography often has a separate designation (eg, “MSKUS,” “MSUS”). At Cleveland Clinic, it is offered through the department of musculoskeletal imaging by subspecialty-trained musculoskeletal radiologists and specially trained musculoskeletal ultrasonographers with 4 to 5 years of training in the technique.
Musculoskeletal ultrasonography is also performed by physician groups with specialized training, including sports medicine physicians, rheumatologists, physiatrists, neurologists, and orthopedic surgeons. The American Institute of Ultrasound in Medicine offers voluntary accreditation for practice groups using musculoskeletal ultrasonography. Certification in musculoskeletal radiology is offered to sonographers through the American Registry for Diagnostic Medical Sonography.
SONOGRAPHY HAS UNIQUE QUALITIES
Ultrasonography uses high-frequency sound waves to generate images. The transducer (or probe) emits sound from the many piezoelectric elements at its surface, and the sound waves travel through and react with tissues. Sound reflected by tissues is detected by the transducer and converted to an image. Objects that reflect sound appear hyperechoic (brighter), whereas tissues that reflect little or no sound appear hypoechoic.
High-resolution imaging of superficial structures
(B, arrow).
Ultrasonography involves a fundamental trade-off between image resolution and imaging depth. Higher-frequency sound waves do not penetrate far into tissues but generate a higher-resolution image; lower-frequency sound waves can penetrate much further but yield a lower-resolution image. Although high-resolution imaging of deep structures with ultrasonography is not possible (Figure 1), many musculoskeletal structures are located superficially and are amenable to ultrasonographic evaluation.
Be aware of artifacts
Some materials attenuate sound very little, such as simple fluid. Low attenuation results in artifacts on ultrasonography, making tissues behind the simple fluid appear brighter than neighboring tissues. These artifacts may be reported as “increased through transmission” or “posterior acoustic enhancement.” Conversely, metal and bone reflect all sound waves that reach them, rendering any structures beyond them invisible. This “shadowing” creates a problem for imaging of structures in or near bone. Subcutaneous fat also attenuates sound waves, limiting the use of ultrasonography for patients with obesity (Figure 2).
High-frequency linear transducer sharpens images
High-frequency linear transducers reduce anisotropy because their flat surface keeps sound waves more uniformly perpendicular to the structure of interest.4,7 Their development has allowed imaging of superficial structures that is superior to that of MRI. A high-frequency linear transducer offers more than twice the spatial resolution of a typical 1.5T MRI examination of superficial tissue.12,13
Operator experience is critical
Ultrasonography examinations, more than other imaging tests, are dependent on operator experience. A solid understanding of musculoskeletal anatomy is imperative. Because the probe images only a thin section of tissue (about the thickness of a credit card), referencing adjacent structures for orientation is more difficult with ultrasonography than with CT or MRI.
The accuracy of ultrasonography is highly dependent on acquiring and interpreting images, whereas the accuracy of MRI is dependent primarily on image interpretation.7 Interpreting physicians must check that sonographers capture relevant targets.
STRENGTHS OF MUSCULOSKELETAL ULTRASONOGRAPHY
Ultrasonography has multiple advantages:
No ionizing radiation exposure.
Portability. Unlike CT or MRI, ultrasonography equipment is portable.
Increased patient comfort. Patient positioning for an ultrasonography examination is more flexible than for MRI or CT,14 and the examination does not induce claustrophobia.8
High-resolution imaging. Ultrasonography provides very-high-resolution imaging of superficial soft tissues—in some cases, higher than MRI or CT.
Real-time dynamic examinations are possible with ultrasonography, unlike with CT or MRI, and may increase test sensitivity.4,15–18
Implanted hardware is less of a problem. Although ultrasonography cannot image beyond implanted orthopedic metallic hardware, the hardware does not obscure surrounding soft tissues as it does on CT and MRI.6,19,20 Also, ultrasonography is safe for patients with a pacemaker.8
WEAKNESSES
The main disadvantages of musculoskeletal ultrasonography are inherent to its limited field of view, making it inappropriate for a survey examination (eg, for ankle pain, knee pain, hip pain).4 Unlike CT and MRI, ultrasonography does not provide a “bird’s-eye view,” and important abnormalities can be missed during evaluation of large areas (Figure 4).
Ultrasonography also cannot evaluate bone or intra-articular structures such as cartilage, bone marrow, labrum, and intra-articular ligaments; MRI is the standard for evaluating these structures.21
Ultrasonography is time-consuming. To perform a detailed examination of the anterior, posterior, medial, and lateral aspects of the hip, knee, or ankle would require 1.5 to 2 hours of scanning time and an additional 10 to 25 minutes of image checking and interpretation.
CURRENT CLINICAL INDICATIONS
Musculoskeletal ultrasonography is best used for clinical questions regarding limited, superficial musculoskeletal problems.
Fluid collections
Ultrasonography can help evaluate small fluid collections in soft tissue. As is true for a lung opacity on chest radiography, soft-tissue fluid detected on ultrasonography is nonspecific, and results must be correlated with the clinical picture to narrow the differential diagnosis.
Fluid collections can be classified as loculated or nonloculated.
Nonloculated fluid involves more fluid than is simply interposed between tissue planes and has no wall or defined margins. It can be simple or complex in appearance: simple fluid is anechoic, and complex fluid appears more heterogeneous and may contain septations or debris.
Subcutaneous edema, which may occur postoperatively or from trauma, venous insufficiency, or inflammatory or infectious processes, appears on ultrasonography as nonloculated fluid interspersed between subcutaneous fat lobules.
Loculated fluid collections have well-defined margins or a discrete wall that does not follow normal tissue planes. They can also be simple or complex and can be caused by hematoma, abscess, or ganglion. Less commonly, neoplasms can mimic a loculated fluid collection (Figure 4).
A ganglion is a specific type of loculated fluid collection containing synovial fluid arising from a joint or tendon sheath. It tends to occur in specific locations, most commonly around the wrist, most often arising from the dorsal scapholunate ligament and volar wrist between the radial artery and flexor carpi radialis.22 On MRI, it can be difficult to distinguish between small vascular structures and a small ganglion, especially in the hands and feet.23
Ultrasonography can also help identify a Baker cyst, a specific fluid collection arising from the semimembranosus bursa between the medial head of the gastrocnemius tendon and the semimembranosus tendon. Ultrasonography can also detect inflammation, rupture, or leaking associated with a Baker cyst.24
Power Doppler is an ultrasonographic examination that can detect increased blood flow surrounding a fluid collection and determine the likelihood of an acute inflammatory or infectious cause.25
Joint effusion and synovitis
Musculoskeletal ultrasonography can help evaluate joints for effusion and synovitis. It is highly sensitive (94%) and specific (95%) for synovitis, making it superior to contrast-enhanced MRI.26,27 The area of concern should be limited to 1 quadrant of a joint (anterior, posterior, medial, or lateral); for problems beyond that, MRI should be considered.
A joint effusion appears as a distended joint capsule containing hypoechoic (complex) or anechoic (simple) joint fluid.
Complex joint fluid may contain debris and occurs with hemarthrosis, infection, and inflammation.23 Hypertrophied synovium is hypoechoic and can mimic complex joint fluid.
Power Doppler evaluation can help distinguish synovitis from joint fluid by demonstrating blood flow, a feature of synovitis but not of simple joint fluid. Power Doppler is the most sensitive means of detecting blood flow, although it does not show direction of flow.28
Using ultrasonography can help to improve disease control and minimize disabling changes by monitoring synovitis therapy. In addition, subclinical synovitis and enthesitis (inflammation of insertion sites of tendons or ligaments into bone) detected by ultrasonography may predict future disease and disease flares.29–31
Ultrasonographic guidance for a wide range of procedures is increasing rapidly.32–36 Multiple studies have shown the advantage of ultrasonography-guided aspiration and injection compared with techniques without imaging guidance.37,38
Soft-tissue masses
Accurately diagnosing soft-tissue masses can be difficult. A mass may remain indeterminate even after multiple imaging studies, requiring biopsy or surgical referral. However, for a few specific masses, ultrasonography is highly accurate and can eliminate the need for further imaging.
Ultrasonography can help evaluate soft- tissue masses no larger than 5 cm in diameter and no deeper than superficial muscular fascia. If the mass is larger or deeper than that, ultrasonography is less reliable for showing the margins of the mass and its relationship to adjacent structures (Figure 5). Further imaging by MRI may be recommended in such cases.
Fortunately, many of the most common soft-tissue masses can be accurately diagnosed with ultrasonography, including lipomas, ganglion cysts, foreign bodies, and simple fluid collections.4,39 Nerve-sheath tumors can also be diagnosed with ultrasonography if the lesion clearly arises from a nerve. Other soft-tissue masses are likely to be indeterminate with ultrasonography, requiring follow-up with MRI with contrast.
Tendons
Musculoskeletal ultrasonography can be effective for evaluating tendons around joints, especially 1 or a small number of nearby superficial tendons. Tendons particularly well suited for ultrasonographic examination include:
- Upper-extremity tendons located in the rotator cuff or around the elbow, and flexor and extensor tendons of the hands; ultrasonographic evaluation of the rotator cuff is highly accurate, equivalent to that of MRI for partial-thickness and full-thickness tearing40–43
- Lower-extremity tendons of the extensor mechanism of the knee, distal hamstring tendons, tendons around the ankle,44–46 and flexor and extensor tendons of the foot.
Ultrasonography can help diagnose a variety of tendon abnormalities (Table 1),48,49 including tearing, for which a dynamic examination can be performed.
Many tendons have a tendon sheath containing tenosynovium, while others have surrounding peritenon only; either can become thickened and inflamed. Tenosynovitis is a nonspecific finding and may be inflammatory, infectious, or posttraumatic. The presence of tendon sheath fluid alone on ultrasonography can be a normal finding, and some tendon sheaths that communicate with adjacent joints (eg, the long head biceps tendon, the flexor hallucis longus tendon) commonly contain simple fluid.6 A dynamic examination with ultrasonography can help diagnose snapping related to abnormal tendon movement, for example, in the case of intra-sheath and extra-sheath subluxation of the peroneal tendons.45,50,51
Ligaments
Ultrasonography can detect abnormalities in many superficial ligaments (Table 1).
Ankle. Ankle ligaments are superficial and can be clearly visualized. The diagnostic accuracy of ultrasonography for tearing of the anterior talofibular ligament may be as high as 100%.50,52,53
Elbow and thumb. The larger of the collateral ligaments of the elbow, especially the ulnar collateral ligament, and the ulnar collateral ligament of the thumb can be effectively evaluated with ultrasonography.54,55
Knee. The collateral ligaments of the knee can be seen with ultrasonography, but injuries of the external ligaments of the knee are often associated with intrinsic derangements that cannot be evaluated with ultrasonography.56,57 Intra-articular ligaments such as the anterior cruciate ligament are also not amenable to ultrasonography.
Dynamic examination of a ligament with ultrasonography can help determine the grade of the injury.
Deeply located ligaments (eg, around the hip) and ligaments surrounded by bone, such as the Lisfranc ligament, cannot be completely seen on ultrasonography.
Muscle
Musculoskeletal ultrasonography is useful for small areas of concern within a muscle (Table 1). It can detect muscle strains and tears, intramuscular collections or lesions, and fascial scarring or fascial injuries such as superficial muscle herniation. Although ultrasonography may yield a definitive diagnosis for a muscle problem, further imaging may be needed.
Nerves
Ultrasonography is useful for peripheral nerve investigation but requires a steep learning curve for sonographers and interpreting physicians.58,59 It is best suited for directed questions regarding focal abnormal nerve findings on physical examination.
Ultrasonography can help identify areas of nerve entrapment caused by a mass or dynamic compression. It can detect neuritis (Table 1), lesions of peripheral nerves (eg, nerve-sheath tumors), and neuromas (eg, Morton neuroma of the intermetatarsal space). In a large meta-analysis, ultrasonography and MRI were found to be equally accurate for detecting Morton neuroma.60 Even for nerve-sheath tumors located deep to the muscular fascia, ultrasonography can confirm the diagnosis because of the characteristic appearance of the nerves. Ultrasonography can also demonstrate a large extent of the course of superficial peripheral nerves while keeping the imaging plane appropriately oriented to the nerves.
Acknowledgment: We would like to sincerely thank Megan Griffiths, MA, for her help in the preparation and submission of this manuscript.
- Hamilton JV, Flinn G Jr, Haynie CC, Cefalo RC. Diagnosis of rectus sheath hematoma by B-mode ultrasound: a case report. Am J Obstet Gynecol 1976; 125(4):562–565. doi:10.1016/0002-9378(76)90379-3
- Zweymüller VK, Kratochwil A. Ultrasound diagnosis of bone and soft tissue tumours. Wien Klin Wochenschr 1975; 87(12):397–398. German.
- Mayer V. Ultrasonography of the rotator cuff. J Ultrasound Med 1985; 4(11):608, 607. doi:10.7863/jum.1985.4.11.608
- McNally EG. The development and clinical applications of musculoskeletal ultrasound. Skeletal Radiol 2011; 40(9):1223–1231. doi:10.1007/s00256-011-1220-5
- Ignashin NS, Girshin SG, Tsypin IS. Ultrasonic scanning in subcutaneous rupture of the Achilles tendon. Vestn Khir Im I I Grek 1981; 127(9):82–85. Russian.
- Robinson P. Sonography of common tendon injuries. AJR Am J Roentgenol 2009; 193(3):607–618. doi:10.2214/AJR.09.2808
- Jacobson JA. Musculoskeletal ultrasound: focused impact on MRI. AJR Am J Roentgenol 2009; 193(3):619–627. doi:10.2214/AJR.09.2841
- Nazarian LN. The top 10 reasons musculoskeletal sonography is an important complementary or alternative technique to MRI. AJR Am J Roentgenol 2008; 190(6):1621–1626. doi:10.2214/AJR.07.3385
- AIUM technical bulletin. Transducer manipulation. American Institute of Ultrasound in Medicine. J Ultrasound Med 1999; 18(2):169–175. doi:10.7863/jum.1999.18.2.169
- Connolly DJ, Berman L, McNally EG. The use of beam angulation to overcome anisotropy when viewing human tendon with high frequency linear array ultrasound. Br J Radiol 2001; 74 (878):183–185. doi:10.1259/bjr.74.878.740183
- Crass JR, van de Vegte GL, Harkavy LA. Tendon echogenicity: ex vivo study. Radiology 1988; 167(2):499–501. doi:10.1148/radiology.167.2.3282264
- Erickson SJ. High-resolution imaging of the musculoskeletal system. Radiology 1997; 205(3):593–618. doi:10.1148/radiology.205.3.9393511
- Link TM, Majumdar S, Peterfy C, et al. High resolution MRI of small joints: impact of spatial resolution on diagnostic performance and SNR. Magn Reson Imaging 1998; 16(2):147–155. doi:10.1016/S0730-725X(97)00244-0
- Middleton WD, Payne WT, Teefey SA, Hildebolt CF, Rubin DA, Yamaguchi K. Sonography and MRI of the shoulder: comparison of patient satisfaction. AJR Am J Roentgenol 2004; 183(5):1449–1452. doi:10.2214/ajr.183.5.1831449
- Khoury V, Cardinal E, Bureau NJ. Musculoskeletal sonography: a dynamic tool for usual and unusual disorders. AJR Am J Roentgenol 2007; 188(1):W63–W73. doi:10.2214/AJR.06.0579
- Farin PU, Jaroma H, Harju A, Soimakallio S. Medial displacement of the biceps brachii tendon: evaluation with dynamic sonography during maximal external shoulder rotation. Radiology 1995; 195(3):845–848. doi:10.1148/radiology.195.3.7754019
- Miller TT, Adler RS, Friedman L. Sonography of injury of the ulnar collateral ligament of the elbow-initial experience. Skeletal Radiol 2004; 33(7):386–391. doi:10.1007/s00256-004-0788-4
- Nazarian LN, McShane JM, Ciccotti MG, O’Kane PL, Harwood MI. Dynamic US of the anterior band of the ulnar collateral ligament of the elbow in asymptomatic major league baseball pitchers. Radiology 2003; 227(1):149–154. doi:10.1148/radiol.2271020288
- Jacobson JA, Lax MJ. Musculoskeletal sonography of the postoperative orthopedic patient. Semin Musculoskelet Radiol 2002; 6(1):67–77. doi:10.1055/s-2002-23165
- Sofka CM, Adler RS. Original report. Sonographic evaluation of shoulder arthroplasty. AJR Am J Roentgenol 2003; 180(4):1117–1120. doi:10.2214/ajr.180.4.1801117
- Silvestri E, Martinoli C, Derchi LE, Bertolotto M, Chiaramondia M, Rosenberg I. Echotexture of peripheral nerves: correlation between US and histologic findings and criteria to differentiate tendons. Radiology 1995; 197(1):291–296. doi:10.1148/radiology.197.1.7568840
- Cardinal E, Buckwalter KA, Braunstein EM, Mih AD. Occult dorsal carpal ganglion: comparison of US and MR imaging. Radiology 1994; 193(1):259–262. doi:10.1148/radiology.193.1.8090903
- Jacobson JA. Musculoskeletal ultrasound and MRI: which do I choose? Semin Musculoskelet Radiol 2005; 9(2):135–149. doi:10.1055/s-2005-872339
- Ward EE, Jacobson JA, Fessell DP, Hayes CW, van Holsbeeck M. Sonographic detection of Baker’s cysts: comparison with MR imaging. AJR Am J Roentgenol 2001; 176(2):373–380. doi:10.2214/ajr.176.2.1760373
- Bhasin S, Cheung PP. The role of power Doppler ultrasonography as disease activity marker in rheumatoid arthritis. Dis Markers 2015; 2015:325909. doi:10.1155/2015/325909
- Fukuba E, Yoshizako T, Kitagaki H, Murakawa Y, Kondo M, Uchida N. Power Doppler ultrasonography for assessment of rheumatoid synovitis: comparison with dynamic magnetic resonance imaging. Clin Imaging 2013; 37(1):134–137. doi:10.1016/j.clinimag.2012.02.008
- Takase-Minegishi K, Horita N, Kobayashi K, et al. Diagnostic test accuracy of ultrasound for synovitis in rheumatoid arthritis: systematic review and meta-analysis. Rheumatology (Oxford) 2018; 57(1):49–58. doi:10.1093/rheumatology/kex036
- Klareskog L, Catrina AI, Paget S. Rheumatoid arthritis. Lancet 2009; 373(9664):659–672. doi:10.1016/S0140-6736(09)60008-8
- Ash ZR, Tinazzi I, Gallego CC, et al. Psoriasis patients with nail disease have a greater magnitude of underlying systemic subclinical enthesopathy than those with normal nails. Ann Rheum Dis 2012; 71(4):553–556. doi:10.1136/annrheumdis-2011-200478
- Han J, Geng Y, Deng X, Zhang Z. Subclinical synovitis assessed by ultrasound predicts flare and progressive bone erosion in rheumatoid arthritis patients with clinical remission: a systematic review and metaanalysis. J Rheumatol 2016; 43(11):2010–2018. doi.org/10.3899/jrheum.160193
- Iagnocco A, Finucci A, Ceccarelli F, Perricone C, Iorgoveanu V, Valesini G. Power Doppler ultrasound monitoring of response to anti-tumour necrosis factor alpha treatment in patients with rheumatoid arthritis. Rheumatology (Oxford) 2015; 54(10):1890–1896. doi:10.1093/rheumatology/kev211
- Henning PT. Ultrasound-guided foot and ankle procedures. Phys Med Rehabil Clin N Am 2016; 27(3):649–671. doi:10.1016/j.pmr.2016.04.005
- Lueders DR, Smith J, Sellon JL. Ultrasound-guided knee procedures. Phys Med Rehabil Clin North Am 2016; 27(3):631–648. doi:10.1016/j.pmr.2016.04.010
- Payne JM. Ultrasound-guided hip procedures. Phys Med Rehabil Clin North Am 2016; 27(3):607–629. doi:10.1016/j.pmr.2016.04.004
- Strakowski JA. Ultrasound-guided peripheral nerve procedures. Phys Med Rehabil Clin North Am 2016; 27(3):687–715. doi:10.1016/j.pmr.2016.04.006
- Sussman WI, Williams CJ, Mautner K. Ultrasound-guided elbow procedures. Phys Med Rehabil Clin North Am 2016; 27(3):573–587. doi:10.1016/j.pmr.2016.04.002
- Finnoff JT. The evolution of diagnostic and interventional ultrasound in sports medicine. PM R 2016; 8(suppl 3):S133–S138. doi:10.1016/j.pmrj.2015.09.022
- Wu T, Dong Y, Song H, Fu Y, Li JH. Ultrasound-guided versus landmark in knee arthrocentesis: a systematic review. Semin Arthritis Rheum 2016; 45(5):627–632. doi:10.1016/j.semarthrit.2015.10.011
- Failla JM, van Holsbeeck M, Vanderschueren G. Detection of a 0.5-mm-thick thorn using ultrasound: a case report. J Hand Surg Am 1995; 20(3):456–457.
- Teefey SA, Hasan SA, Middleton WD, Patel M, Wright RW, Yamaguchi K. Ultrasonography of the rotator cuff. A comparison of ultrasonographic and arthroscopic findings in one hundred consecutive cases. J Bone Joint Surg Am 2000; 82(4):498–504.
- van Holsbeeck MT, Kolowich PA, Eyler WR, et al. US depiction of partial-thickness tear of the rotator cuff. Radiology 1995; 197(2):443–446. doi:10.1148/radiology.197.2.7480690
- Balich SM, Sheley RC, Brown TR, Sauser DD, Quinn SF. MR imaging of the rotator cuff tendon: interobserver agreement and analysis of interpretive errors. Radiology 1997; 204(1):191–194. doi:10.1148/radiology.204.1.9205245
- Dinnes J, Loveman E, McIntyre L, Waugh N. The effectiveness of diagnostic tests for the assessment of shoulder pain due to soft tissue disorders: a systematic review. Health Technol Assess 2003; 7(29):1–166. doi:10.3310/hta7290
- Rockett MS, Waitches G, Sudakoff G, Brage M. Use of ultrasonography versus magnetic resonance imaging for tendon abnormalities around the ankle. Foot Ankle Int 1998; 19(9):604–612.
- Grant TH, Kelikian AS, Jereb SE, McCarthy RJ. Ultrasound diagnosis of peroneal tendon tears. A surgical correlation. J Bone Joint Surg Am 2005; 87(8):1788–1794. doi:10.2106/JBJS.D.02450
- Hartgerink P, Fessell DP, Jacobson JA, van Holsbeeck MT. Full- versus partial-thickness Achilles tendon tears: sonographic accuracy and characterization in 26 cases with surgical correlation. Radiology 2001; 220(2):406–412. doi:10.1148/radiology.220.2.r01au41406
- Cho KH, Park BH, Yeon KM. Ultrasound of the adult hip. Semin Ultrasound CT MR 2000; 21(3):214–230.
- Adler RS, Finzel KC. The complementary roles of MR imaging and ultrasound of tendons. Radiol Clin North Am 2005; 43(4):771–807. doi:10.1016/j.rcl.2005.02.011
- Martinoli C, Bianchi S, Derchi LE. Tendon and nerve sonography. Radiol Clin North Am 1999; 37(4):691–711. doi:10.1016/S0033-8389(05)70124-X
- Fessell DP, Vanderschueren GM, Jacobson JA, et al. US of the ankle: technique, anatomy, and diagnosis of pathologic conditions. Radiographics 1998; 18(2):325–340. doi:10.1148/radiographics.18.2.9536481
- Neustadter J, Raikin SM, Nazarian LN. Dynamic sonographic evaluation of peroneal tendon subluxation. AJR Am J Roentgenol 2004; 183(4):985–988. doi:10.2214/ajr.183.4.1830985
- Verhaven EF, Shahabpour M, Handelberg FW, Vaes PH, Opdecam PJ. The accuracy of three-dimensional magnetic resonance imaging in the diagnosis of ruptures of the lateral ligaments of the ankle. Am J Sports Med 1991; 19(6):583–587. doi:10.1177/036354659101900605
- Milz P, Milz S, Steinborn M, Mittlmeier T, Putz R, Reiser M. Lateral ankle ligaments and tibiofibular syndesmosis. 13-MHz high-frequency sonography and MRI compared in 20 patients. Acta Orthop Scand 1998; 69(1):51–55.
- De Smet AA, Winter TC, Best TM, Bernhardt DT. Dynamic sonography with valgus stress to assess elbow ulnar collateral ligament injury in baseball pitchers. Skeletal Radiol 2002; 31(11):671–676. doi:10.1007/s00256-002-0558-0
- Melville DM, Jacobson JA, Fessell DP. Ultrasound of the thumb ulnar collateral ligament: technique and pathology. AJR Am J Roentgenol 2014; 202(2):W168. doi:10.2214/AJR.13.11335
- Court-Payen M. Sonography of the knee: intra-articular pathology. J Clin Ultrasound 2004; 32(9):481–490. doi:10.1002/jcu.20069
- Azzoni R, Cabitza P. Is there a role for sonography in the diagnosis of tears of the knee menisci? J Clin Ultrasound 2002; 30(8):472–476. doi:10.1002/jcu.10106
- Jacobson JA, Wilson TJ, Yang LJ. Sonography of common peripheral nerve disorders with clinical correlation. J Ultrasound Med 2016; 35(4):683–693. doi:10.7863/ultra.15.05061
- Ali ZS, Pisapia JM, Ma TS, Zager EL, Heuer GG, Khoury V. Ultrasonographic evaluation of peripheral nerves. World Neurosurg 2016; 85(1):333–339. doi:10.1016/j.wneu.2015.10.005
- Bignotti B, Signori A, Sormani MP, Molfetta L, Martinoli C, Tagliafico A. Ultrasound versus magnetic resonance imaging for Morton neuroma: systematic review and meta-analysis. Eur Radiol 2015; 25(8):2254–2262. doi:10.1007/s00330-015-3633-3
KEY POINTS
- Ultrasonography can be used to evaluate small fluid collections in soft tissue; joint effusions and synovitis; soft tissue masses (≤ 5 cm in diameter); tendon, ligament and muscle injuries; and peripheral nerve entrapment and lesions.
- Ultrasonography is not appropriate for survey examinations of vague or diffuse symptoms or for evaluating soft-tissue areas more than a few centimeters in diameter or more than a few centimeters deep.
- Musculoskeletal ultrasonography requires specially trained sonographers and interpreting physicians.