User login
Lightweight mesh linked to longer LOS, worse QOL
Compared with midweight mesh, lightweight mesh was associated with more surgical site infection and longer hospital stay following open ventral hernia repair, according to a report published in the American Journal of Surgery.
In addition, lightweight mesh was associated with greater pain, more limitation of movement, and poorer quality of life for up to 2 years after the procedure, compared with midweight mesh.

Approximately 250,000 open ventral hernia repairs are performed in the Unites States each year, and mesh is used in 85% or more. Since heavyweight mesh was found to reduce abdominal wall mobility, which led to chronic discomfort in about 20% of cases, manufacturers turned to mesh that was more flexible, had reduced mass to decrease foreign-body reactions, but was strong enough to withstand the physiological stress that the abdominal wall is subjected to, the investigators noted.
They compared outcomes after hernia repairs using lightweight and midweight mesh by analyzing information in the International Hernia Mesh Registry database, which covers more than 30 medical centers in 10 countries. For this study, the researchers focused on 549 patients for whom surgeons had selected lightweight (34.2%) or midweight (47.7%) mesh. (The remaining 18.1% of cases used heavyweight mesh.)
Across the study groups, patients were similar for gender distribution; body mass index; race; and the presence of chronic obstructive pulmonary disease, asthma, and immunosuppression – factors that can heavily influence wound repair.
In an initial analysis of the data, midweight mesh was associated with significantly fewer superficial surgical site infections (1.2%) than lightweight mesh (4.8%), as well as a significantly shorter length of stay (3.6 days vs 5.3 days). However, rates of postoperative abdominal wall complications, abscesses, urinary tract infection, pneumonia, hematoma formation, seroma formation, ileus, deep vein thrombosis, and unplanned returns to the operating room were similar.
At 6-month follow-up, lightweight mesh was associated with significantly greater mesh sensation, abdominal discomfort, and movement limitation, as well as significantly worse overall quality of life (QOL), than midweight mesh. At 12 months, lightweight mesh was associated with significantly greater pain and limitation of movement and significantly worse QOL. At 24 months, lightweight mesh continued to be associated with movement limitation, but scores on other measures were similar to those with midweight mesh.
In a multivariate analysis that controlled for many potentially confounding variables, including smoking status, separation of the components of the mesh, the number of sutures anchoring the mesh, and the mesh location within the abdomen, midweight mesh was not associated with worse QOL scores at any time point. In contrast, lightweight mesh was associated with significantly worse QOL scores at 6 months, with an odds ratio of 2.64, and with significantly more pain at 12 months, with an OR of 2.58, Dr. Groene and his associates said (Am J Surg. 2016 Dec;212[6]:1054-62).
The investigators also noted that among their own hernia repair patients, lightweight mesh tends to fracture more easily than midweight mesh. Recent studies also have reported that over time, lightweight mesh is more likely to fail due to fracturing than midweight mesh, they added.
This study had no relevant financial relationships or sources of support. Dr. Groene and his associates reported having no financial conflicts of interest.
Compared with midweight mesh, lightweight mesh was associated with more surgical site infection and longer hospital stay following open ventral hernia repair, according to a report published in the American Journal of Surgery.
In addition, lightweight mesh was associated with greater pain, more limitation of movement, and poorer quality of life for up to 2 years after the procedure, compared with midweight mesh.
Approximately 250,000 open ventral hernia repairs are performed in the Unites States each year, and mesh is used in 85% or more. Since heavyweight mesh was found to reduce abdominal wall mobility, which led to chronic discomfort in about 20% of cases, manufacturers turned to mesh that was more flexible, had reduced mass to decrease foreign-body reactions, but was strong enough to withstand the physiological stress that the abdominal wall is subjected to, the investigators noted.
They compared outcomes after hernia repairs using lightweight and midweight mesh by analyzing information in the International Hernia Mesh Registry database, which covers more than 30 medical centers in 10 countries. For this study, the researchers focused on 549 patients for whom surgeons had selected lightweight (34.2%) or midweight (47.7%) mesh. (The remaining 18.1% of cases used heavyweight mesh.)
Across the study groups, patients were similar for gender distribution; body mass index; race; and the presence of chronic obstructive pulmonary disease, asthma, and immunosuppression – factors that can heavily influence wound repair.
In an initial analysis of the data, midweight mesh was associated with significantly fewer superficial surgical site infections (1.2%) than lightweight mesh (4.8%), as well as a significantly shorter length of stay (3.6 days vs 5.3 days). However, rates of postoperative abdominal wall complications, abscesses, urinary tract infection, pneumonia, hematoma formation, seroma formation, ileus, deep vein thrombosis, and unplanned returns to the operating room were similar.
At 6-month follow-up, lightweight mesh was associated with significantly greater mesh sensation, abdominal discomfort, and movement limitation, as well as significantly worse overall quality of life (QOL), than midweight mesh. At 12 months, lightweight mesh was associated with significantly greater pain and limitation of movement and significantly worse QOL. At 24 months, lightweight mesh continued to be associated with movement limitation, but scores on other measures were similar to those with midweight mesh.
In a multivariate analysis that controlled for many potentially confounding variables, including smoking status, separation of the components of the mesh, the number of sutures anchoring the mesh, and the mesh location within the abdomen, midweight mesh was not associated with worse QOL scores at any time point. In contrast, lightweight mesh was associated with significantly worse QOL scores at 6 months, with an odds ratio of 2.64, and with significantly more pain at 12 months, with an OR of 2.58, Dr. Groene and his associates said (Am J Surg. 2016 Dec;212[6]:1054-62).
The investigators also noted that among their own hernia repair patients, lightweight mesh tends to fracture more easily than midweight mesh. Recent studies also have reported that over time, lightweight mesh is more likely to fail due to fracturing than midweight mesh, they added.
This study had no relevant financial relationships or sources of support. Dr. Groene and his associates reported having no financial conflicts of interest.
FROM THE AMERICAN JOURNAL OF SURGERY
Key clinical point: Compared with midweight mesh, lightweight mesh was associated with more surgical site infections and longer hospital stay in the short term and greater pain, more limitation of movement, and poorer quality of life for up to 2 years after open ventral hernia repair.
Major finding: In the short term, midweight mesh was associated with significantly fewer superficial surgical site infections (1.2%) than lightweight mesh (4.8%), as well as a significantly shorter length of stay (3.6 days vs 5.3 days).
Data source: An analysis of information in an international prospective registry of hernia mesh surgeries, which involved 549 adults.
Disclosures: This study had no relevant financial relationships or sources of support. Dr. Groene and his associates reported having no financial conflicts of interest.

High levels of flu activity in 10 U.S. states
The 2016-2017 flu season shifted into high gear at the end of calendar year 2016, as four states were reported to be at the highest level of flu activity and six others were close behind, according to the Centers for Disease Control and Prevention.
For the week ending Dec. 31, 2016, Georgia, New Jersey, Oklahoma, and Oregon were at level 10 on the CDC’s 1-10 scale of influenza-like illness (ILI). Others in the “high” range were New York at level 9 and Alabama, Louisiana, Missouri, South Carolina, and Utah at level 8. Puerto Rico was also at level 8, after being at level 10 for the previous few weeks. An additional 10 states were in the “moderate” range (6-7), the CDC reported.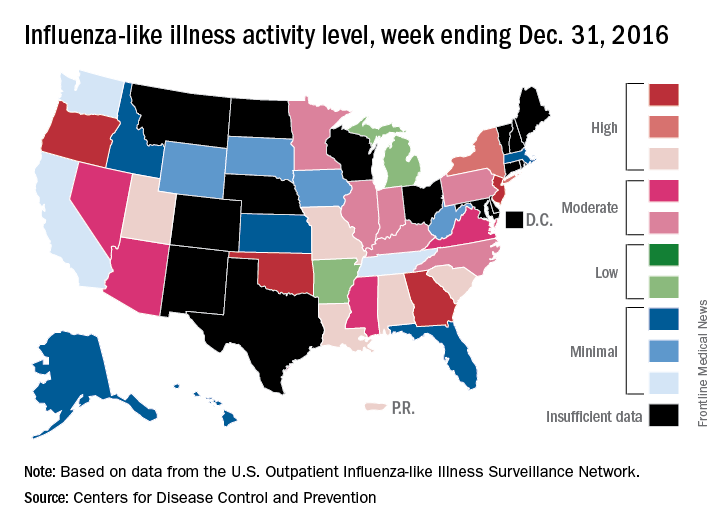
The CDC has not reported any flu-related pediatric deaths yet this season. Pediatric death totals for each of the last 3 years were 111 for 2013-2014, 148 for 2014-2015, and 89 for 2015-2016, the CDC said.
Adolescents, boys, black children most likely to be hospitalized in SJS and TEN
Annual hospitalization rates in the United States for Stevens-Johnson syndrome (SJS) and toxic epidermal necrolysis (TEN) were shown to be higher in adolescents, boys, and black children, in a cross-sectional analysis of discharge records from more than 4,100 hospitals.
Using relevant ICD-9 codes, researchers at Harvard University identified 1,571 patients hospitalized for SJS, TEN, or both in 2009 and 2012, as listed in the Kids Inpatient Database from the Agency for Healthcare Research and Quality. The highest hospitalization rates per 100,000 in each year were for adolescents between 15 and 19 years (P = .01), boys (P = .03), and black children (P = .82). The overall risk of death from these conditions was 1.5% in 2009 and 0.3% in 2012. The data were published online in a brief report (Pediatr Dermatol. 2016 Dec 19. doi: 10.1111/pde.13050).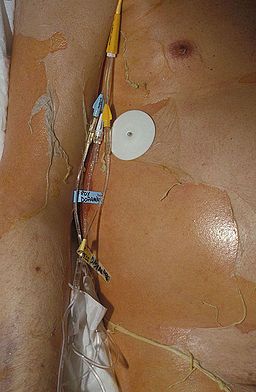
With the number of SJS- and TEN-related hospitalizations between 0.1 and 1.0 per 100,000, lead author Yusuke Okubo MD, MPH, and his colleagues wrote that their data aligned with previous studies; however, regarding the emphasis on demographic differences, theirs was, to the best of their knowledge, “the first study to reveal these disparities.” Compared with adults, they added, mortality was “remarkably lower” in children.
The authors had no disclosures.
[email protected]
On Twitter @whitneymcknight
Key clinical point:
Major finding: Hospitalization rates for SJS/TEN were highest among adolescents (aged 15-19) at 1.36 and 1.09 per 100,000 children in 2009 and 2012, respectively.
Data source: An analysis of 1,571 pediatric discharge records for 2009 and 2012 from more than 4,100 hospitals in a national database.
Disclosures: The authors had no disclosures.
Instability of INRs
Clinical question: Does an initial stable international normalized ratio (INR) predict long-term stability?
Background: Warfarin decreases stroke risk among patients with atrial fibrillation; however, it interacts with food and drugs and requires monitoring to achieve a therapeutic INR. It is unclear if patients on warfarin with an initial stable INR value remain stable over time. Additionally, it is controversial whether patients on warfarin with previously stable INRs should benefit from switching to a non–vitamin K oral anticoagulant.
Study design: Retrospective study.
Setting: Outpatient clinics.
Synopsis: Data were collected from the Outcomes Registry for Better Informed Treatment of Atrial Fibrillation. Included in the study were patients taking warfarin at baseline with three or more INR values in the first 6 months and six or more INR values in the subsequent year. Stability was defined as 80% or more INRs in therapeutic range (2.0-3.0).
Only 26% of patients taking warfarin had a stable INR during the first 6 months, and only 34% continued to have a stable INR in the subsequent year.
Bottom line: Initial stable INR within the first 6 months among patients taking warfarin does not predict long-term INR stability in the subsequent year.
Citation: Pokorney SD, Simon DN, Thomas L, et al. Stability of international normalized ratios in patients taking long-term warfarin therapy. JAMA.2016;316(6):661-663
Dr. Florindez is an assistant professor at the University of Miami Miller School of Medicine and a hospitalist at University of Miami Hospital and Jackson Memorial Hospital.
Partnering with stakeholders using an example patient-reported outcomes project
Recently, researchers have been challenged to design methods that ensure that key constituents are partners in research, and not simply participants. Here we describe some innovative approaches we used to engage stakeholders. The approaches are drawn from a patient-centered outcomes research project, focusing on the graphic display of patient-reported outcomes (PROs) data. PROs represent patients’ perspectives on the impact of health, disease, and treatment, without interpretation by a clinician or anyone else. PROs include, among other things, patients’ assessments of their symptoms, their level of physical and psychosocial functioning, and health-related quality-of-life.1
As a first example of the key role of stakeholders in this project, input from cancer patients and clinicians, drawn from previous research, motivated us to ask whether there might be a “better way” to display PRO data when used to inform clinical practice. Specifically, even though cancer patients and clinicians endorse the importance of PRO data to promote patient-centered care, both groups report challenges using PROs in practice because of difficulty understanding what the PRO scores mean (eg, what is a good score or a bad score?; for individual patients, which scores should clinicians be concerned about?; for clinical trial PROs, what differences in PRO scores between treatments are clinically important?). The challenges in interpreting PRO data result in part from a large number of PRO measures (eg, one database includes more than 1,000 instruments)2 and no standards across PRO measures regarding how they are scored and scaled, or in how the data are presented.3 For example, on some PRO measures, higher scores represent better outcomes; on some PRO measures, lower scores represent better outcomes; and on some PRO measures, whether higher or lower scores represent better outcomes depends on the domain being measured. Further, some measures are scaled 0-100, with the extremes representing the best/worst scores possible, whereas others are normed to, for example, a population average of 50. Because of this variation, a score of 70 can have a completely different meaning depending on the PRO measure (or domain within a measure). As noted above, previous research has documented that this variation limits patients’ and clinicians’ understanding of the PRO scores, creating an important barrier to their use in practice.4-5
To address this stakeholder-driven research question, we undertook a three-part study to identify approaches for PRO data display that can be easily interpreted, regardless of scoring or scaling conventions, with the overall goal of improving patient and clinician understanding and use of PROs in oncology clinical practice. Part 1 of the study identified attributes of graphic displays of PRO data that are helpful and confusing.6 Part 2 involved developing improved PRO data presentation approaches.7 Part 3 evaluated the accuracy-of-interpretation and clarity of the developed approaches.8-10 The methods and findings of the three-part study are reported elsewhere;6-10 here, we describe the various approaches employed to engage stakeholders throughout the project.
As described above, the first reflection of stakeholder input was in the research question we asked. We then sought to identify the key stakeholder groups and ensure that they participated in each stage of the project. The relevant stakeholder groups we identified were: patients and their caregivers; health care providers (eg, oncologists, oncology nurses) who need to understand PRO data for their own consideration and for discussion with patients; and PRO researchers who develop, validate, and apply PRO measures.
Having identified these three key stakeholder groups, we sought to obtain broad representation of their perspectives. For example, we ensured that our investigative team included a cancer survivor, a cancer care provider, and PRO researchers. To supplement the stakeholder input from the investigative team, we formed a nine-member Stakeholder Advisory Board, with multiple representatives from each key constituency. We also aimed to be as broad as possible in the populations sampled for data collection. For example, we extended beyond the Johns Hopkins cancer center to include the Johns Hopkins Clinical Research Network, a consortium of academic and community health systems across the mid-Atlantic United States. Beyond the in-person data collection across the region, our study also included an internet survey of cancer patients/survivors, cancer care providers, and PRO researchers from across the United States and internationally. Taken together, these approaches improve the diversity of our sample and, thereby, the generalizability of our findings.
In addition to obtaining broad perspectives across stakeholder groups, we created genuine partnerships with the stakeholders to inform every aspect of the project. As described above, the study itself was motivated by feedback from cancer patients and clinicians regarding the challenges they experienced when trying to interpret PRO scores, and we therefore ensured that each stakeholder group contributed to the study’s design. Stakeholders also played a critical role in the conduct of the study. For example, in the first part of the study, we conducted one-on-one interviews with 50 cancer patients and 20 cancer clinicians to obtain their insights regarding attributes of current approaches for presenting PRO data that are helpful and confusing.6 At the completion of each interview, we asked participants whether they would be interested in partnering with the researchers in developing improved presentation formats in the next phase of the project. These volunteers were organized into work groups that reviewed the findings from the initial round of interviews with the investigative team, provided suggestions regarding candidate formats that could be used to improve presentation approaches, and helped pilot the internet survey.7 In this way, research participants had the opportunity to evolve into research partners, providing critically important input throughout the process.
The implementation and dissemination of findings is another area in which stakeholder partnership is particularly valuable. For example, several of our stakeholder partners have an advocacy background, which can be quite useful for conveying the project’s results in a compelling way. Other stakeholders, such as journal editors, are in a position to act directly to implement the study findings by, for example, adding best practices for presenting PRO data to their journal’s author instructions. Notably, some of the skills stakeholders bring come in addition to their role as stakeholders. For example, one of our patient stakeholders has a background in marketing, and this marketing expertise (completely separate from his patient experience) has helped the research team think about how to present data to broad audiences in a meaningful way.
In summary, this project has implemented stakeholder-driven approaches to address an important barrier to patient-centered cancer care. Several key lessons in stakeholder engagement have emerged from this experience. It is important to identify the key constituencies early on in the process. Involving stakeholders from the start enables them to play important roles in every aspect of the study, starting with study design conception. There are also innovative ways to integrate stakeholders in study conduct, such as our work groups of research participants who volunteered to partner with the research team to develop improved data presentation approaches. Implementation and dissemination is another area where stakeholders, based on their background and connections, can play a critical role. Throughout the process, it is valuable to challenge the project to obtain perspectives from as broad a range of stakeholders as possible. Finally, stakeholders have expertise beyond their stakeholder roles, and these skills can be quite valuable to the overall research agenda. In this project, our partnership with stakeholders has helped improve the presentation of PRO data to patients and providers, thereby improving the patient-centeredness of cancer care.
Acknowledgments
The PRO Data Presentation Stakeholder Advisory Board includes Neil K Aaronson, PhD (Netherlands Cancer Institute, Amsterdam); Patricia A Ganz, MD (University of California-Los Angeles and Jonsson Comprehensive Cancer Center, Los Angeles, CA); Ravin Garg, MD (Anne Arundel Medical Center, Annapolis, MD); Michael Fisch, MD (MD Anderson Cancer Center, Houston, TX); Vanessa Hoffman, MPH (Bladder Cancer Advocacy Network, Washington, DC); Bryce B Reeve, PhD (University of North Carolina at Chapel Hill and Lineberger Comprehensive Cancer Center, Chapel Hill, NC); Eden Stotsky-Himelfarb (Sidney Kimmel Comprehensive Cancer Center at Johns Hopkins, Baltimore, MD); Ellen Stovall (National Coalition for Cancer Survivorship, Washington, DC [posthumous]); Matthew Zachary (Stupid Cancer, New York, NY).
The authors thank The Johns Hopkins Clinical Research Network site investigators and staff and, in particular, the patients and clinicians who participated in this project.
Supported by a Patient-Centered Outcomes Research Institute (PCORI) Award (R-1410-24904). All statements in this report, including its findings and conclusions, are solely those of the authors and do not necessarily represent the views of PCORI, its board of governors or methodology committee. Drs Snyder and Smith are members of the Sidney Kimmel Comprehensive Cancer Center at Johns Hopkins (P30 CA 006973). The funders had no role in the study design; data collection, analysis, or interpretation; writing; or decision to submit.
1. Acquadro C, Berzon R, Dubois D, et al. Incorporating the patient’s perspective into drug development and communication: an ad hoc task force report of the Patient-Reported Outcomes (PRO) Harmonization Group meeting at the Food and Drug Administration, February 16, 2001. Value Health. 2003;6(5):522-531.
2. PROQOLID, the Patient-Reported Outcome and Quality of Life Instruments Database. https://eprovide.mapi-trust.org/. Accessed November 10, 2016.
3. Brundage MD, Snyder CF. Patient-reported outcomes in clinical practice: using standards to break down barriers. Clin Invest. 2012;2(4):343-346.
4. Brundage M, Bass B, Jolie R, et al. A knowledge translation challenge: clinical use of quality of life data from cancer clinical trials. Qual Life Res. 2011;20(7):979-985.
5. Snyder CF, Jensen R, Courtin SO, et al. PatientViewpoint: a website for patient-reported outcomes assessment. Qual Life Res. 2009;18(7):793-800.
6. Brundage M, Smith KC, Little EA, Bantug ET, Snyder CF. PRO Data Presentation Stakeholder Advisory Board. Communicating patient-reported outcome scores using graphic formats: results from a mixed-methods evaluation. Qual Life Res. 2015;24(10):2457-2472.
7. Smith KC, Brundage MD, Tolbert E, Little EA, Bantug ET, Snyder C. PRO Data Presentation Stakeholder Advisory Board. Engaging stakeholders to improve presentation of patient-reported outcomes data in clinical practice. Support Care Cancer. 2016;24(10):4149-4157.
8. Snyder CF, Smith KC, Bantug ET, Tolbert EE, Blackford AL, Brundage MD. PRO Data Presentation Stakeholder Advisory Board. What do these scores mean? Presenting patient-reported outcomes data to patients and clinicians to improve interpretability. Cancer. 2017;123(10):1848-1859.
9. Brundage M, Blackford A, Tolbert E, Smith K, Bantug E, Snyder C. PRO Data Presentation Stakeholder Advisory Board. Presenting comparative study PRO results to clinicians and researchers: beyond the eye of the beholder. Qual Life Res. 2017 Nov 2 [Epub ahead of print].
10. Tolbert E, Snyder C, Bantug E, Blackford A, Brundage M. PRO Data Presentation Stakeholder Advisory Board. Graphing group-level data from research studies for presentation to patients in educational materials and decision aids. Qual Life Res. 2016;25(suppl 1):17.
Recently, researchers have been challenged to design methods that ensure that key constituents are partners in research, and not simply participants. Here we describe some innovative approaches we used to engage stakeholders. The approaches are drawn from a patient-centered outcomes research project, focusing on the graphic display of patient-reported outcomes (PROs) data. PROs represent patients’ perspectives on the impact of health, disease, and treatment, without interpretation by a clinician or anyone else. PROs include, among other things, patients’ assessments of their symptoms, their level of physical and psychosocial functioning, and health-related quality-of-life.1
As a first example of the key role of stakeholders in this project, input from cancer patients and clinicians, drawn from previous research, motivated us to ask whether there might be a “better way” to display PRO data when used to inform clinical practice. Specifically, even though cancer patients and clinicians endorse the importance of PRO data to promote patient-centered care, both groups report challenges using PROs in practice because of difficulty understanding what the PRO scores mean (eg, what is a good score or a bad score?; for individual patients, which scores should clinicians be concerned about?; for clinical trial PROs, what differences in PRO scores between treatments are clinically important?). The challenges in interpreting PRO data result in part from a large number of PRO measures (eg, one database includes more than 1,000 instruments)2 and no standards across PRO measures regarding how they are scored and scaled, or in how the data are presented.3 For example, on some PRO measures, higher scores represent better outcomes; on some PRO measures, lower scores represent better outcomes; and on some PRO measures, whether higher or lower scores represent better outcomes depends on the domain being measured. Further, some measures are scaled 0-100, with the extremes representing the best/worst scores possible, whereas others are normed to, for example, a population average of 50. Because of this variation, a score of 70 can have a completely different meaning depending on the PRO measure (or domain within a measure). As noted above, previous research has documented that this variation limits patients’ and clinicians’ understanding of the PRO scores, creating an important barrier to their use in practice.4-5
To address this stakeholder-driven research question, we undertook a three-part study to identify approaches for PRO data display that can be easily interpreted, regardless of scoring or scaling conventions, with the overall goal of improving patient and clinician understanding and use of PROs in oncology clinical practice. Part 1 of the study identified attributes of graphic displays of PRO data that are helpful and confusing.6 Part 2 involved developing improved PRO data presentation approaches.7 Part 3 evaluated the accuracy-of-interpretation and clarity of the developed approaches.8-10 The methods and findings of the three-part study are reported elsewhere;6-10 here, we describe the various approaches employed to engage stakeholders throughout the project.
As described above, the first reflection of stakeholder input was in the research question we asked. We then sought to identify the key stakeholder groups and ensure that they participated in each stage of the project. The relevant stakeholder groups we identified were: patients and their caregivers; health care providers (eg, oncologists, oncology nurses) who need to understand PRO data for their own consideration and for discussion with patients; and PRO researchers who develop, validate, and apply PRO measures.
Having identified these three key stakeholder groups, we sought to obtain broad representation of their perspectives. For example, we ensured that our investigative team included a cancer survivor, a cancer care provider, and PRO researchers. To supplement the stakeholder input from the investigative team, we formed a nine-member Stakeholder Advisory Board, with multiple representatives from each key constituency. We also aimed to be as broad as possible in the populations sampled for data collection. For example, we extended beyond the Johns Hopkins cancer center to include the Johns Hopkins Clinical Research Network, a consortium of academic and community health systems across the mid-Atlantic United States. Beyond the in-person data collection across the region, our study also included an internet survey of cancer patients/survivors, cancer care providers, and PRO researchers from across the United States and internationally. Taken together, these approaches improve the diversity of our sample and, thereby, the generalizability of our findings.
In addition to obtaining broad perspectives across stakeholder groups, we created genuine partnerships with the stakeholders to inform every aspect of the project. As described above, the study itself was motivated by feedback from cancer patients and clinicians regarding the challenges they experienced when trying to interpret PRO scores, and we therefore ensured that each stakeholder group contributed to the study’s design. Stakeholders also played a critical role in the conduct of the study. For example, in the first part of the study, we conducted one-on-one interviews with 50 cancer patients and 20 cancer clinicians to obtain their insights regarding attributes of current approaches for presenting PRO data that are helpful and confusing.6 At the completion of each interview, we asked participants whether they would be interested in partnering with the researchers in developing improved presentation formats in the next phase of the project. These volunteers were organized into work groups that reviewed the findings from the initial round of interviews with the investigative team, provided suggestions regarding candidate formats that could be used to improve presentation approaches, and helped pilot the internet survey.7 In this way, research participants had the opportunity to evolve into research partners, providing critically important input throughout the process.
The implementation and dissemination of findings is another area in which stakeholder partnership is particularly valuable. For example, several of our stakeholder partners have an advocacy background, which can be quite useful for conveying the project’s results in a compelling way. Other stakeholders, such as journal editors, are in a position to act directly to implement the study findings by, for example, adding best practices for presenting PRO data to their journal’s author instructions. Notably, some of the skills stakeholders bring come in addition to their role as stakeholders. For example, one of our patient stakeholders has a background in marketing, and this marketing expertise (completely separate from his patient experience) has helped the research team think about how to present data to broad audiences in a meaningful way.
In summary, this project has implemented stakeholder-driven approaches to address an important barrier to patient-centered cancer care. Several key lessons in stakeholder engagement have emerged from this experience. It is important to identify the key constituencies early on in the process. Involving stakeholders from the start enables them to play important roles in every aspect of the study, starting with study design conception. There are also innovative ways to integrate stakeholders in study conduct, such as our work groups of research participants who volunteered to partner with the research team to develop improved data presentation approaches. Implementation and dissemination is another area where stakeholders, based on their background and connections, can play a critical role. Throughout the process, it is valuable to challenge the project to obtain perspectives from as broad a range of stakeholders as possible. Finally, stakeholders have expertise beyond their stakeholder roles, and these skills can be quite valuable to the overall research agenda. In this project, our partnership with stakeholders has helped improve the presentation of PRO data to patients and providers, thereby improving the patient-centeredness of cancer care.
Acknowledgments
The PRO Data Presentation Stakeholder Advisory Board includes Neil K Aaronson, PhD (Netherlands Cancer Institute, Amsterdam); Patricia A Ganz, MD (University of California-Los Angeles and Jonsson Comprehensive Cancer Center, Los Angeles, CA); Ravin Garg, MD (Anne Arundel Medical Center, Annapolis, MD); Michael Fisch, MD (MD Anderson Cancer Center, Houston, TX); Vanessa Hoffman, MPH (Bladder Cancer Advocacy Network, Washington, DC); Bryce B Reeve, PhD (University of North Carolina at Chapel Hill and Lineberger Comprehensive Cancer Center, Chapel Hill, NC); Eden Stotsky-Himelfarb (Sidney Kimmel Comprehensive Cancer Center at Johns Hopkins, Baltimore, MD); Ellen Stovall (National Coalition for Cancer Survivorship, Washington, DC [posthumous]); Matthew Zachary (Stupid Cancer, New York, NY).
The authors thank The Johns Hopkins Clinical Research Network site investigators and staff and, in particular, the patients and clinicians who participated in this project.
Supported by a Patient-Centered Outcomes Research Institute (PCORI) Award (R-1410-24904). All statements in this report, including its findings and conclusions, are solely those of the authors and do not necessarily represent the views of PCORI, its board of governors or methodology committee. Drs Snyder and Smith are members of the Sidney Kimmel Comprehensive Cancer Center at Johns Hopkins (P30 CA 006973). The funders had no role in the study design; data collection, analysis, or interpretation; writing; or decision to submit.
1. Acquadro C, Berzon R, Dubois D, et al. Incorporating the patient’s perspective into drug development and communication: an ad hoc task force report of the Patient-Reported Outcomes (PRO) Harmonization Group meeting at the Food and Drug Administration, February 16, 2001. Value Health. 2003;6(5):522-531.
2. PROQOLID, the Patient-Reported Outcome and Quality of Life Instruments Database. https://eprovide.mapi-trust.org/. Accessed November 10, 2016.
3. Brundage MD, Snyder CF. Patient-reported outcomes in clinical practice: using standards to break down barriers. Clin Invest. 2012;2(4):343-346.
4. Brundage M, Bass B, Jolie R, et al. A knowledge translation challenge: clinical use of quality of life data from cancer clinical trials. Qual Life Res. 2011;20(7):979-985.
5. Snyder CF, Jensen R, Courtin SO, et al. PatientViewpoint: a website for patient-reported outcomes assessment. Qual Life Res. 2009;18(7):793-800.
6. Brundage M, Smith KC, Little EA, Bantug ET, Snyder CF. PRO Data Presentation Stakeholder Advisory Board. Communicating patient-reported outcome scores using graphic formats: results from a mixed-methods evaluation. Qual Life Res. 2015;24(10):2457-2472.
7. Smith KC, Brundage MD, Tolbert E, Little EA, Bantug ET, Snyder C. PRO Data Presentation Stakeholder Advisory Board. Engaging stakeholders to improve presentation of patient-reported outcomes data in clinical practice. Support Care Cancer. 2016;24(10):4149-4157.
8. Snyder CF, Smith KC, Bantug ET, Tolbert EE, Blackford AL, Brundage MD. PRO Data Presentation Stakeholder Advisory Board. What do these scores mean? Presenting patient-reported outcomes data to patients and clinicians to improve interpretability. Cancer. 2017;123(10):1848-1859.
9. Brundage M, Blackford A, Tolbert E, Smith K, Bantug E, Snyder C. PRO Data Presentation Stakeholder Advisory Board. Presenting comparative study PRO results to clinicians and researchers: beyond the eye of the beholder. Qual Life Res. 2017 Nov 2 [Epub ahead of print].
10. Tolbert E, Snyder C, Bantug E, Blackford A, Brundage M. PRO Data Presentation Stakeholder Advisory Board. Graphing group-level data from research studies for presentation to patients in educational materials and decision aids. Qual Life Res. 2016;25(suppl 1):17.
Cannulas versus needles for soft tissue filler injection
With loss of deep fat pad compartments and bony resorption with normal aging, soft tissue fillers have become a mainstay in minimally invasive aesthetic treatments. Preference of injecting with a needle versus a cannula is often user and training dependent. Blunt-tipped cannulas may provide a lower risk of bruising, as well as potentially devastating complications such as intravascular occlusion that can lead to skin necrosis and blindness. Even for advanced injectors, however, cannula use may portend a learning curve if the clinicians are used to injecting with needles.
A recently published observational study using cadaver heads looked at precision in supraperiosteal placement with a sharp needle compared with a blunt tipped cannula.1 The investigators injected dye material with soft-tissue fillers at different aesthetic facial sites on the supraperiosteum, then observed the placement of dye and filler after dissection. In this study, the placement of product was more precise with the cannulas. The filler was injected on the periosteum with a needle. Some of the filler then migrated along the trajectory of the needle path back toward the epidermis, ending up in multiple tissue layers. So there was more extrusion of the filler in the superficial layers with a needle without a retrograde injection technique. Even with the needle tip on the periosteum and no movement of the needle, the needle technique showed a higher risk of intra-arterial injections. This study is limited by the fact that in vivo circumstances could potentially alter the outcome, as could user injection technique.

Cannulas should be highly considered in any deep tissue compartment, but especially in more advanced injection technique areas, such as the nasal dorsum. Another cadaver study from Thailand showed that the anatomy of the dorsal nasal artery is not consistent.2 It is injection into this artery that can lead to blindness via flow to the ophthalmic artery. The study showed that both the diameter of the artery and the presence of a single or bilateral dorsal nasal artery varied. The dorsal nasal artery travels in the subcutaneous tissue layer of the nasal dorsum on the transverse nasalis muscle and its midline nasal aponeurosis, which connects the muscles on both sides. Bilateral dorsal nasal arteries were present in 34% of the specimens. A single and large dorsal nasal artery was present in 28%.
Needles are still useful in some places where precise small aliquot touch-up of filler placement is needed or where it may be difficult to reach with the cannula without making an additional portal of entry. More viscous fillers such as calcium hydroxylapatite and poly-L-lactic acid can be difficult to inject through a cannula and require a needle for injection. More superficially, small 30- or 32-gauge needles are also required for the injection of certain hyaluronic acid fillers in the superficial dermis for more etched lines.

The risk of arterial wall perforation and emboli with cannulas is lower, but these complications can still occur. The risk increases with a perpendicular angle between the artery and the cannula, thus slow small aliquot injection technique along with knowledge of anatomy is essential.3 While both needles and cannulas are useful in practice and achieve excellent cosmetic results, cannula use in the deeper compartments among practitioners is encouraged to minimize complications.
References
1. Aesthet Surg J. 2016 Dec 16. pii: sjw220.
2. Aesthetic Plast Surg. 2016 Dec 28. doi: 10.1007/s00266-016-0756-0.
3. Aesthetic Plast Surg. 2016 Dec 23. doi: 10.1007/s00266-016-0725-7.
Dr. Wesley and Dr. Talakoub are co-contributors to this column. Dr. Wesley practices dermatology in Beverly Hills, Calif. Dr. Talakoub is in private practice in McLean, Va. This month’s column is by Dr. Wesley. Write to them at [email protected]. They had no relevant disclosures.
With loss of deep fat pad compartments and bony resorption with normal aging, soft tissue fillers have become a mainstay in minimally invasive aesthetic treatments. Preference of injecting with a needle versus a cannula is often user and training dependent. Blunt-tipped cannulas may provide a lower risk of bruising, as well as potentially devastating complications such as intravascular occlusion that can lead to skin necrosis and blindness. Even for advanced injectors, however, cannula use may portend a learning curve if the clinicians are used to injecting with needles.
A recently published observational study using cadaver heads looked at precision in supraperiosteal placement with a sharp needle compared with a blunt tipped cannula.1 The investigators injected dye material with soft-tissue fillers at different aesthetic facial sites on the supraperiosteum, then observed the placement of dye and filler after dissection. In this study, the placement of product was more precise with the cannulas. The filler was injected on the periosteum with a needle. Some of the filler then migrated along the trajectory of the needle path back toward the epidermis, ending up in multiple tissue layers. So there was more extrusion of the filler in the superficial layers with a needle without a retrograde injection technique. Even with the needle tip on the periosteum and no movement of the needle, the needle technique showed a higher risk of intra-arterial injections. This study is limited by the fact that in vivo circumstances could potentially alter the outcome, as could user injection technique.
Cannulas should be highly considered in any deep tissue compartment, but especially in more advanced injection technique areas, such as the nasal dorsum. Another cadaver study from Thailand showed that the anatomy of the dorsal nasal artery is not consistent.2 It is injection into this artery that can lead to blindness via flow to the ophthalmic artery. The study showed that both the diameter of the artery and the presence of a single or bilateral dorsal nasal artery varied. The dorsal nasal artery travels in the subcutaneous tissue layer of the nasal dorsum on the transverse nasalis muscle and its midline nasal aponeurosis, which connects the muscles on both sides. Bilateral dorsal nasal arteries were present in 34% of the specimens. A single and large dorsal nasal artery was present in 28%.
Needles are still useful in some places where precise small aliquot touch-up of filler placement is needed or where it may be difficult to reach with the cannula without making an additional portal of entry. More viscous fillers such as calcium hydroxylapatite and poly-L-lactic acid can be difficult to inject through a cannula and require a needle for injection. More superficially, small 30- or 32-gauge needles are also required for the injection of certain hyaluronic acid fillers in the superficial dermis for more etched lines.
The risk of arterial wall perforation and emboli with cannulas is lower, but these complications can still occur. The risk increases with a perpendicular angle between the artery and the cannula, thus slow small aliquot injection technique along with knowledge of anatomy is essential.3 While both needles and cannulas are useful in practice and achieve excellent cosmetic results, cannula use in the deeper compartments among practitioners is encouraged to minimize complications.
References
1. Aesthet Surg J. 2016 Dec 16. pii: sjw220.
2. Aesthetic Plast Surg. 2016 Dec 28. doi: 10.1007/s00266-016-0756-0.
3. Aesthetic Plast Surg. 2016 Dec 23. doi: 10.1007/s00266-016-0725-7.
Dr. Wesley and Dr. Talakoub are co-contributors to this column. Dr. Wesley practices dermatology in Beverly Hills, Calif. Dr. Talakoub is in private practice in McLean, Va. This month’s column is by Dr. Wesley. Write to them at [email protected]. They had no relevant disclosures.
Osteopenia risk up in men with sarcopenia and COPD
Men experiencing sarcopenia who also have been diagnosed with chronic obstructive pulmonary disease (COPD) are at a significantly higher risk of developing osteopenia and osteoporosis than are men who do not suffer from COPD, according to a new study published in Chest.
“Muscle depletion has been considered a risk factor for low [bone mineral density (BMD)] in the healthy general population [but] data on the association between sarcopenia and osteopenia/osteoporosis in COPD patients are lacking,” wrote the investigators of the study, coauthored by Moo Suk Park, MD, of Yonsei University in Seoul, South Korea (Chest. 2017 Jan. doi: 10.1016/j.chest.2016.12.006).
“Although previous studies showed that loss of fat-free mass (FFM) was related to BMD loss in COPD patients, it is difficult to know the genuine relationship between skeletal muscle mass and BMD because whole body FFM contains a large proportion of water-retaining organs and nonmuscle soft tissue,” the authors continued.
The investigators examined data from the Korean National Health and Nutritional Examination Survey (KNHANES), looking for men at least 20 years of age with COPD who had both pulmonary function test and the dual-energy x-ray absorptiometry (DXA) performed on them during the years 2008-2011. A total of 864 men were deemed eligible for inclusion, and were scored for sarcopenia and osteopenia/osteoporosis; the former was assessed via the appendicular skeletal mass index (ASMI), with the latter done via T-score.
“Sarcopenia and presarcopenia were defined according to the presence of ASMI values that were less than two standard deviations (SDs) and between 2SDs and 1SD, respectively, below the mean value of a young male reference group aged 20-39 years,” according to the investigators. “Osteoporosis, osteopenia, and normal BMD were identified according to the lowest T-score of the three measured locations and were defined according to the World Health Organization criteria.”

“This study affirms the systemic nature of COPD, as it is not merely a disease that manifests as breathlessness and other respiratory complaints, but affects many aspects of a patient’s functionality and overall health,” explained Eric J. Gartman, MD, of Brown University, Providence, Rhode Island. “In clinical practice, this study reminds us that we need to consider these other issues in a COPD patient’s care, since the outcomes from these problems (e.g. hip fractures) can be devastating.”

A critical limitation of this study, however, is the sample population, according to Dr. Gartman. “It is solely made up of Korean men, thus somewhat limiting the generalizability to a larger population [and] especially to women, given that there are several other considerations surrounding effects on BMD.”
No funding sources were disclosed. The authors reported no conflicts of interest.
*This article was updated on 1/20/17 at 1:30 p.m. It misstated the affiliation for Vera Palo, MD, FCCP.
Men experiencing sarcopenia who also have been diagnosed with chronic obstructive pulmonary disease (COPD) are at a significantly higher risk of developing osteopenia and osteoporosis than are men who do not suffer from COPD, according to a new study published in Chest.
“Muscle depletion has been considered a risk factor for low [bone mineral density (BMD)] in the healthy general population [but] data on the association between sarcopenia and osteopenia/osteoporosis in COPD patients are lacking,” wrote the investigators of the study, coauthored by Moo Suk Park, MD, of Yonsei University in Seoul, South Korea (Chest. 2017 Jan. doi: 10.1016/j.chest.2016.12.006).
“Although previous studies showed that loss of fat-free mass (FFM) was related to BMD loss in COPD patients, it is difficult to know the genuine relationship between skeletal muscle mass and BMD because whole body FFM contains a large proportion of water-retaining organs and nonmuscle soft tissue,” the authors continued.
The investigators examined data from the Korean National Health and Nutritional Examination Survey (KNHANES), looking for men at least 20 years of age with COPD who had both pulmonary function test and the dual-energy x-ray absorptiometry (DXA) performed on them during the years 2008-2011. A total of 864 men were deemed eligible for inclusion, and were scored for sarcopenia and osteopenia/osteoporosis; the former was assessed via the appendicular skeletal mass index (ASMI), with the latter done via T-score.
“Sarcopenia and presarcopenia were defined according to the presence of ASMI values that were less than two standard deviations (SDs) and between 2SDs and 1SD, respectively, below the mean value of a young male reference group aged 20-39 years,” according to the investigators. “Osteoporosis, osteopenia, and normal BMD were identified according to the lowest T-score of the three measured locations and were defined according to the World Health Organization criteria.”
“This study affirms the systemic nature of COPD, as it is not merely a disease that manifests as breathlessness and other respiratory complaints, but affects many aspects of a patient’s functionality and overall health,” explained Eric J. Gartman, MD, of Brown University, Providence, Rhode Island. “In clinical practice, this study reminds us that we need to consider these other issues in a COPD patient’s care, since the outcomes from these problems (e.g. hip fractures) can be devastating.”
A critical limitation of this study, however, is the sample population, according to Dr. Gartman. “It is solely made up of Korean men, thus somewhat limiting the generalizability to a larger population [and] especially to women, given that there are several other considerations surrounding effects on BMD.”
No funding sources were disclosed. The authors reported no conflicts of interest.
*This article was updated on 1/20/17 at 1:30 p.m. It misstated the affiliation for Vera Palo, MD, FCCP.
FROM CHEST
Key clinical point:
Major finding: Sarcopenia in men with COPD carried a significantly higher risk of bone mineral density loss: OR = 2.31 (95% CI 1.53–3.46) (P less than .001).
Data source: Retrospective cross-sectional study of data on 777 men with COPD during 2008-2011.
Disclosures: No funding sources were disclosed. The authors reported no conflicts of interest.

United States about to top 40,000 Zika cases
The number of pregnant women with laboratory evidence of Zika infection jumped up a bit at the end of 2016, and the United States approached 40,000 Zika cases among all Americans at the beginning of the new year, according to reports from the Centers for Disease Control and Prevention.
There were 187 additional pregnant women with Zika virus infection reported in the 2 weeks ending Dec. 27, compared with the 136 new reports of infected women in each of the two previous comparable periods (Dec. 1-13 and Nov. 18-30). Most of the 187 new cases were reported in the U.S. territories, while 46 were reported in the 50 states and the District of Columbia. There have been delays in reporting, the CDC noted, so these cannot be considered real-time estimates.
For the 2 weeks ending Dec. 27, there were reports of two more infants born with Zika-related birth defects, bringing the total to 36 for the states/D.C. The CDC is no longer reporting adverse pregnancy outcomes for the territories because Puerto Rico is not using the same inclusion criteria. The number of pregnancy losses remains at five in the states/D.C., where it has been since August. Aggregated data from the U.S. Zika Pregnancy Registry show that there have been 875 completed pregnancies with or without birth defects, the CDC said.
Zika-related birth defects reported by the CDC could include microcephaly, calcium deposits in the brain indicating possible brain damage, excess fluid in the brain cavities and surrounding the brain, absent or poorly formed brain structures, abnormal eye development, or other problems resulting from brain damage that affect nerves, muscles, and bones. The pregnancy losses encompass any miscarriage, stillbirth, and termination with evidence of birth defects.
Inpatient antibiotic use has not declined
Clinical question: How has inpatient antibiotic use changed in the United States in recent years?
Study design: Retrospective analysis.
Setting: Adult and pediatric data from 300 acute-care hospitals, 2006-2012.
Synopsis: Weighted extrapolation of data from a database was used to estimate national antibiotic use. Overall, 55.1% of discharged patients received antibiotics. The rate of antibiotic use was 755/1,000 patient-days over the study period. The small increase in antibiotic use over the years (5.6 days of therapy/1,000 patient-days increase; 95% CI, –18.9 to 30.1; P = .65) was not statistically significant. There was a significant decrease in the use of aminoglycosides, first- and second-generation cephalosporins, fluoroquinolones, sulfonamide, metronidazole, and penicillins. The use of third- and fourth-generation cephalosporins, macrolides, glycopeptides, beta-lactam/beta-lactamase inhibitor, carbapenems, and tetracyclines has increased significantly.
Limitations of the study include underrepresentation of pediatric hospitals and certain geographic regions.
Bottom line: Antibiotic-use rates have not changed during 2006-2012. However, broad-spectrum antibiotic use has increased significantly.
Citation: Baggs J, Fridkin SK, Pollack LA, Srinivasan A, Jernigan JA. Estimating national trends in inpatient antibiotic use among US hospitals from 2006 to 2012. JAMA Intern Med. 2016;176(11):1639-1648.
Dr. Menon is an assistant professor at the University of Miami Miller School of Medicine and a hospitalist at University of Miami Hospital and Jackson Memorial Hospital.
Enthesitis seen in 35% of PsA patients
About one-third of people with psoriatic arthritis have clinical enthesitis, according to results from a prospective cohort study of more than 800 patients.
Enthesitis, or soreness and inflammation at sites where soft tissue attaches to bone, is considered to be common in psoriatic arthritis (PsA), but its true prevalence has been difficult to define in this population, according to a group of researchers led by Ari Polachek, MD, of the University of Toronto.
Previous studies attempting to quantify enthesitis prevalence in PsA populations have found it to be as low as 8% to more than 50% of patients affected, Dr. Polachek and his colleagues noted, but such disparities can likely be attributed to the use of different enthesitis measures. To define enthesitis in the current study, the investigators used the SPondyloArthritis Research Consortium Canada (SPARCC) enthesitis index, which they called “valid and reliable, particularly for patients with PsA.”
Dr. Polachek and his colleagues detected enthesitis in 281 (35%) of 803 patents who had been recruited during 2008-2014 at a single clinic dedicated to PsA. The enthesitis diagnoses were established for at least one site on an initial visit (n = 128) or during a mean 3 years’ follow-up (n = 192).
The investigators reported that the annual incidence of enthesitis in this population was 0.9% (Arthritis Care Res. 2016 Dec 20. doi: 10.1002/acr.23174). About half of the patients in the cohort had only one site affected, and one-third had two sites affected. The most common of these sites were the Achilles tendon, plantar fascia, and the lateral epicondyle, Dr. Polachek and colleagues reported. They also found several factors associated with enthesitis: higher inflamed joint count (odds ratio, 1.06; P = .0002), less clinical damage (OR, 0.9; P = .04), more pain (OR, 1.15; P = .01), and presence of tenosynovitis (OR, 5.3; P less than .0001) or dactylitis (OR, 2.5; P = .02).
Significant risk factors for enthesitis included higher body mass index (hazard ratio, 1.04; P = .02), more actively inflamed joints (HR, 1.04; P = .0004), and younger age (HR, 0.98; P = .02). Among the patients in the cohort, 57% were male, the mean age was 50.8 years, and mean PsA disease duration was 12.3 years. Median time to resolution of enthesitis was 7.5 months, with 70% of patients improving without changes to their treatment.
The University of Toronto PsA research program receives funding from Krembil Foundation. Dr. Polachek disclosed grant funding from Janssen Canada. No other authors reported conflicts of interest.
FROM ARTHRITIS CARE & RESEARCH
Key clinical point:
Major finding: Prevalence of enthesitis was 35% in a cohort of PsA patients; significant risk factors included high BMI, higher disease activity, and younger age.
Data source: About 800 PsA patients treated at a university clinic during 2008-2014; mean follow-up was 3.3 years.
Disclosures: The Krembil Foundation indirectly supported the study, whose lead author disclosed receipt of a grant from a pharmaceutical manufacturer.