User login
Does this help the patient?
Twenty minutes after Ronald Reagan finished his inaugural address, the Islamic Republic of Iran announced the release of 52 American hostages that Iran had held for the last year of Jimmy Carter’s presidency. The timing led to the “October Surprise conspiracy theory,” in which some inferred a deliberate plan to influence an American election. We now refer to any political event timed to an election as an “October Surprise.” We are awaiting some type of surprise prior to this November’s elections. Events unfolding this fall will have generational effects on American politics, our health care delivery models, our financial security, individual rights and the democratic infrastructure of our country. This is not an election to sit out.

The proposed rule the Centers for Medicare & Medicaid published in the summer has generated a massive public response. The major issues (as discussed in last month’s GI & Hepatology News issue, including the editorial) include a dramatic change in documentation requirements and payment for evaluation and management (E/M) codes for both new and returning patients. While the reduction in documentation is laudable, the reduction in reimbursement for complex visits is not. At Michigan Medicine (2.2 million outpatient visits per year), reimbursements would go down by $3.5 million annually for our E/M visits. Most responses to the proposed rule requested a year’s delay and intensive analysis of work involved prior to reducing payments (see further comments at gastro.org, the AGA website).
This month we cover a new anti-obesity drug that shows cardiovascular safety. This is a welcome potential addition to our therapies since another story updates us on the relentless rise in obesity in this country. We cover the world’s alcohol use this month. On a financial note, the anticipated savings from biosimilars may be less than we hoped if data from Medicare Part D can be generalized. We also cover a diagnostic update about eosinophilic esophagitis.
I hope you enjoy this issue of GI & Hepatology News and all the AGA publications that provide you with up-to-date science, clinical information, and news about gastroenterology in general. Remember to vote. On the wall across from my desk as I sit as a leader in ambulatory care at Michigan Medicine, there is a large sign that grounds me. It reads, “Does this help the patient?”
John I. Allen, MD, MBA, AGAF
Editor in Chief
Twenty minutes after Ronald Reagan finished his inaugural address, the Islamic Republic of Iran announced the release of 52 American hostages that Iran had held for the last year of Jimmy Carter’s presidency. The timing led to the “October Surprise conspiracy theory,” in which some inferred a deliberate plan to influence an American election. We now refer to any political event timed to an election as an “October Surprise.” We are awaiting some type of surprise prior to this November’s elections. Events unfolding this fall will have generational effects on American politics, our health care delivery models, our financial security, individual rights and the democratic infrastructure of our country. This is not an election to sit out.
The proposed rule the Centers for Medicare & Medicaid published in the summer has generated a massive public response. The major issues (as discussed in last month’s GI & Hepatology News issue, including the editorial) include a dramatic change in documentation requirements and payment for evaluation and management (E/M) codes for both new and returning patients. While the reduction in documentation is laudable, the reduction in reimbursement for complex visits is not. At Michigan Medicine (2.2 million outpatient visits per year), reimbursements would go down by $3.5 million annually for our E/M visits. Most responses to the proposed rule requested a year’s delay and intensive analysis of work involved prior to reducing payments (see further comments at gastro.org, the AGA website).
This month we cover a new anti-obesity drug that shows cardiovascular safety. This is a welcome potential addition to our therapies since another story updates us on the relentless rise in obesity in this country. We cover the world’s alcohol use this month. On a financial note, the anticipated savings from biosimilars may be less than we hoped if data from Medicare Part D can be generalized. We also cover a diagnostic update about eosinophilic esophagitis.
I hope you enjoy this issue of GI & Hepatology News and all the AGA publications that provide you with up-to-date science, clinical information, and news about gastroenterology in general. Remember to vote. On the wall across from my desk as I sit as a leader in ambulatory care at Michigan Medicine, there is a large sign that grounds me. It reads, “Does this help the patient?”
John I. Allen, MD, MBA, AGAF
Editor in Chief

Did psychiatry take a wrong turn?
Maybe it is just me. It probably is. It seems I must have taken a wrong turn in practicing psychiatry somewhere along the line.

For whatever reason, I never truly saw and appreciated the seamlessness between the psychiatric problems children, adults, and the elderly have plaguing them. Of course, I always marveled at how a child who had honest-to-goodness autism could become a full-grown adult and have an adult psychiatrist diagnose that individual as having schizophrenia; why not an adult with autism? But that was the extent of my understanding of the seamlessness between childhood and adult diagnoses. Maybe it is because I was poorly trained and never bothered to get a childhood developmental from my adult psychiatric patients. When I would present a case to supervisors as an adult psychiatric resident, I recall never presenting a child developmental history as a part of the patient’s trajectory. It was as though since there was adult psychiatry and child psychiatry, then the disorders of adults and children should be separated as well.
I know many adult psychiatrists never ask their adult patients, “How old were you when you graduated high school?” although an answer of “I never graduated,” or I graduated at 19-20” should raise questions. When I was in community psychiatry residency, I had some training at the Institute for Juvenile Research (birthplace of child psychiatry), so I understood something about children and the problems they had. Of course, back then, child psychiatric diagnoses were not that good, but with the advent of the DSM-5, children’s psychiatric diagnoses became more precise. This was probably because of research and better epidemiologic data about the prevalence of the six major neurodevelopmental disorders (intellectual disability, attention-deficit/hyperactivity disorder, speech and language disorders, autism spectrum disorders, specific learning disorders, and motor disorders). Maybe I am too old to remember, but I don’t remember anyone with a serious focus on what happens to psychiatrically ill children when they grow up to be adults or what psychiatric problems adult psychiatric patients had when they were children.
In a brilliant article in the September issue of the American Journal of Psychiatry, Avshalom Caspi, PhD, and Terrie E. Moffitt, PhD, propose that there is a single dimension of psychopathology, or “p.”
The authors perceptively remind us that we characterize children’s psychopathology as internalizing and externalizing disorders (with a slight nod to psychotic disorders in children), but these features do not seem prominent or ubiquitous in adult psychiatry’s thinking about adult psychiatric patients. They do a great job at pointing out there is ample evidence of a great deal of comorbidity between “discrete” children’s and adults’ psychiatric disorders. We certainly learned this from the findings of the DSM-5’s Personality and Personality Disorders Work Group.
Their p suggests a common thread between various childhood psychiatric disorders and adult psychiatric disorders. Furthermore, Dr. Caspi’s and Dr. Moffitt’s assertion that longitudinal research identifying “poor childhood self-control” (a symptom of affect dysregulation) and poor executive functioning as a salient early developmental predictor of their p sounds a lot like fetal alcohol exposure to me (Fetal Alcohol Exposure Among African Americans). So does their declaration that individuals with higher levels of p have difficulty with attention, concentration, mental control, and visual-motor problems.
Maybe I have confirmational bias, as I have seen the common thread of fetal alcohol exposure run from childhood to adults, but many of my residents and students see it as well.
Accordingly, I think we have made mistakes in psychiatry when we ask (if we ask) the mother of our patients was she drinking when she was pregnant, and “Was the patient born low-birth weight and/or premature?” We should be asking – “When did you realize you were pregnant?” “Were you doing any social drinking before you knew you were pregnant?” Thus, we miss the common thread of fetal alcohol exposure in child and adult psychopathology.
I realize that a great many competing interests are trying to get our time and attention, and there is a lot to read and figure out. In our efforts to do no harm, do psychiatrists try to take their time to fully understand things before we act? Some aspects of our understanding seem to be “no brainers,” and the continuation of child neurodevelopmental disorders morphing into adult mental disorders should be obvious. But maybe we took a wrong turn – which is why it took me 45 years to figure out that fetal alcohol exposure in utero has a significant impact on adult psychiatric disorders.
Dr. Bell is staff psychiatrist at Jackson Park Hospital’s surgical-medical/psychiatric inpatient unit; clinical professor emeritus, department of psychiatry, University of Illinois at Chicago; former director of the Institute for Juvenile Research; and former president/CEO of the Community Mental Health Council, all in Chicago. He also serves as chair of psychiatry at Windsor University, St. Kitts.
Maybe it is just me. It probably is. It seems I must have taken a wrong turn in practicing psychiatry somewhere along the line.
For whatever reason, I never truly saw and appreciated the seamlessness between the psychiatric problems children, adults, and the elderly have plaguing them. Of course, I always marveled at how a child who had honest-to-goodness autism could become a full-grown adult and have an adult psychiatrist diagnose that individual as having schizophrenia; why not an adult with autism? But that was the extent of my understanding of the seamlessness between childhood and adult diagnoses. Maybe it is because I was poorly trained and never bothered to get a childhood developmental from my adult psychiatric patients. When I would present a case to supervisors as an adult psychiatric resident, I recall never presenting a child developmental history as a part of the patient’s trajectory. It was as though since there was adult psychiatry and child psychiatry, then the disorders of adults and children should be separated as well.
I know many adult psychiatrists never ask their adult patients, “How old were you when you graduated high school?” although an answer of “I never graduated,” or I graduated at 19-20” should raise questions. When I was in community psychiatry residency, I had some training at the Institute for Juvenile Research (birthplace of child psychiatry), so I understood something about children and the problems they had. Of course, back then, child psychiatric diagnoses were not that good, but with the advent of the DSM-5, children’s psychiatric diagnoses became more precise. This was probably because of research and better epidemiologic data about the prevalence of the six major neurodevelopmental disorders (intellectual disability, attention-deficit/hyperactivity disorder, speech and language disorders, autism spectrum disorders, specific learning disorders, and motor disorders). Maybe I am too old to remember, but I don’t remember anyone with a serious focus on what happens to psychiatrically ill children when they grow up to be adults or what psychiatric problems adult psychiatric patients had when they were children.
In a brilliant article in the September issue of the American Journal of Psychiatry, Avshalom Caspi, PhD, and Terrie E. Moffitt, PhD, propose that there is a single dimension of psychopathology, or “p.”
The authors perceptively remind us that we characterize children’s psychopathology as internalizing and externalizing disorders (with a slight nod to psychotic disorders in children), but these features do not seem prominent or ubiquitous in adult psychiatry’s thinking about adult psychiatric patients. They do a great job at pointing out there is ample evidence of a great deal of comorbidity between “discrete” children’s and adults’ psychiatric disorders. We certainly learned this from the findings of the DSM-5’s Personality and Personality Disorders Work Group.
Their p suggests a common thread between various childhood psychiatric disorders and adult psychiatric disorders. Furthermore, Dr. Caspi’s and Dr. Moffitt’s assertion that longitudinal research identifying “poor childhood self-control” (a symptom of affect dysregulation) and poor executive functioning as a salient early developmental predictor of their p sounds a lot like fetal alcohol exposure to me (Fetal Alcohol Exposure Among African Americans). So does their declaration that individuals with higher levels of p have difficulty with attention, concentration, mental control, and visual-motor problems.
Maybe I have confirmational bias, as I have seen the common thread of fetal alcohol exposure run from childhood to adults, but many of my residents and students see it as well.
Accordingly, I think we have made mistakes in psychiatry when we ask (if we ask) the mother of our patients was she drinking when she was pregnant, and “Was the patient born low-birth weight and/or premature?” We should be asking – “When did you realize you were pregnant?” “Were you doing any social drinking before you knew you were pregnant?” Thus, we miss the common thread of fetal alcohol exposure in child and adult psychopathology.
I realize that a great many competing interests are trying to get our time and attention, and there is a lot to read and figure out. In our efforts to do no harm, do psychiatrists try to take their time to fully understand things before we act? Some aspects of our understanding seem to be “no brainers,” and the continuation of child neurodevelopmental disorders morphing into adult mental disorders should be obvious. But maybe we took a wrong turn – which is why it took me 45 years to figure out that fetal alcohol exposure in utero has a significant impact on adult psychiatric disorders.
Dr. Bell is staff psychiatrist at Jackson Park Hospital’s surgical-medical/psychiatric inpatient unit; clinical professor emeritus, department of psychiatry, University of Illinois at Chicago; former director of the Institute for Juvenile Research; and former president/CEO of the Community Mental Health Council, all in Chicago. He also serves as chair of psychiatry at Windsor University, St. Kitts.
Put the cash in the shoebox
Even when I was training back in the Pleistocene era, old Doc Greenberg was a throwback. During my pediatric residency, I accompanied him for a day to his office in the Parkchester neighborhood of the Bronx. With no secretary or office staff, Greenberg just processed patients himself. After he examined their kids, each mother handed him a $10 bill, which he stuffed into a box in his desk drawer. No records, no accountability, no payroll taxes ... Those were the days, bygone even then.

What prompted this reverie was recollecting a conversation I had quite some time ago with Stan, a retired drug rep of the old school: terrible combover, rumpled suit, beat-up briefcase. Stan regaled me with tales of derms he had called on many years before.
“Ed Gillooly down in Scituate used to charge $7 a visit,” Stan told me. “I asked him why so little – this was back in the ’60s – and he said, ‘Phil Gluckstern charges 20 bucks a visit in his fancy downtown office, but he has to spend half an hour with a patient. I just see ’em, diagnose ’em, prescribe for ’em, and they’re out the door.’
“Dermatology wasn’t the high-class deal it’s gotten to be,” said Stan. “It was sort of out there. Every doctor had his own special lotion or concoction, his calling card. The local pharmacist knew how to mix it up, but of course would never share the secret formula.
“Nobody referred anybody to another doctor if they could help it. They were terrified they’d never see the patient back.
“It was all cash. There was no Medicare, no third parties. The money would get put into a shoebox, which would go into the doctor’s closet. A lot of offices were in the doc’s house. Sometimes a babysitter would go through the closet, and wouldn’t you know, but the next time the doc’s wife looked, last week’s receipts were gone.
“Secretaries? Doctors wouldn’t bother with them. Sometimes their mothers or wives, who knew as little about office management as they did, would come in and mess things up.”
This observation resonated. Almost 40 years ago, I took over what was left of Al Shipman’s practice when the old-timer (as he seemed to me then) retired to Florida.
Al’s office was a converted garage. Rummaging through a closet, he offered me ancient samples of sulfur-resorcinol acne lotions. Then he pulled out a well-thumbed Merck Manual from the 1930s, with the front cover missing. “I always found this useful,” he said. “You can have it if you want.” I politely declined.
“You young fellas spend money like it’s going out of style,” said Al. “You all think you need secretaries. Never had one!”
My reverie done, I focused back on Stan, who was saying, “Doctors in those days did pretty much everything themselves.
“For instance, Jack Vallis had about thirty chairs in his waiting room. Whenever Jack came out to call the next patient, everybody got up and moved over one chair.
“Once – I swear this actually happened – a patient came in with a severe laceration on his wrist; his damned arm was dangling half-off. But he had to sit down in the last chair and take his turn, same as anybody else.
“I used to call on non-derms too. We carried cortisone creams and antifungal creams, and they used to stop and ask me, ‘Now Stan, I put this fungus cream on the fungus and the cortisone cream on the eczema, am I right?’”
Some things indeed don’t change.

I guess it’s just human nature to pine for When patients (or their biopsy specimens) could go to any lab you sent them to.
Ah, wasn’t that the life? When patients paid you 10 bucks in cash and you stuffed it in your shoebox? When if they didn’t have cash, they sent you a roast turkey on Thanksgiving, or a dozen eggs, or maybe nothing at all?
If you’re the sentimental sort, you can wax nostalgic about those good old days if you want. But you’ll forgive me if I don’t join you.
Dr. Rockoff practices dermatology in Brookline, Mass., and is a longtime contributor to Dermatology News. He serves on the clinical faculty at Tufts University, Boston, and has taught senior medical students and other trainees for 30 years. His second book, “Act Like a Doctor, Think Like a Patient,” is available at amazon.com and barnesandnoble.com. Write to him at [email protected].
Even when I was training back in the Pleistocene era, old Doc Greenberg was a throwback. During my pediatric residency, I accompanied him for a day to his office in the Parkchester neighborhood of the Bronx. With no secretary or office staff, Greenberg just processed patients himself. After he examined their kids, each mother handed him a $10 bill, which he stuffed into a box in his desk drawer. No records, no accountability, no payroll taxes ... Those were the days, bygone even then.
What prompted this reverie was recollecting a conversation I had quite some time ago with Stan, a retired drug rep of the old school: terrible combover, rumpled suit, beat-up briefcase. Stan regaled me with tales of derms he had called on many years before.
“Ed Gillooly down in Scituate used to charge $7 a visit,” Stan told me. “I asked him why so little – this was back in the ’60s – and he said, ‘Phil Gluckstern charges 20 bucks a visit in his fancy downtown office, but he has to spend half an hour with a patient. I just see ’em, diagnose ’em, prescribe for ’em, and they’re out the door.’
“Dermatology wasn’t the high-class deal it’s gotten to be,” said Stan. “It was sort of out there. Every doctor had his own special lotion or concoction, his calling card. The local pharmacist knew how to mix it up, but of course would never share the secret formula.
“Nobody referred anybody to another doctor if they could help it. They were terrified they’d never see the patient back.
“It was all cash. There was no Medicare, no third parties. The money would get put into a shoebox, which would go into the doctor’s closet. A lot of offices were in the doc’s house. Sometimes a babysitter would go through the closet, and wouldn’t you know, but the next time the doc’s wife looked, last week’s receipts were gone.
“Secretaries? Doctors wouldn’t bother with them. Sometimes their mothers or wives, who knew as little about office management as they did, would come in and mess things up.”
This observation resonated. Almost 40 years ago, I took over what was left of Al Shipman’s practice when the old-timer (as he seemed to me then) retired to Florida.
Al’s office was a converted garage. Rummaging through a closet, he offered me ancient samples of sulfur-resorcinol acne lotions. Then he pulled out a well-thumbed Merck Manual from the 1930s, with the front cover missing. “I always found this useful,” he said. “You can have it if you want.” I politely declined.
“You young fellas spend money like it’s going out of style,” said Al. “You all think you need secretaries. Never had one!”
My reverie done, I focused back on Stan, who was saying, “Doctors in those days did pretty much everything themselves.
“For instance, Jack Vallis had about thirty chairs in his waiting room. Whenever Jack came out to call the next patient, everybody got up and moved over one chair.
“Once – I swear this actually happened – a patient came in with a severe laceration on his wrist; his damned arm was dangling half-off. But he had to sit down in the last chair and take his turn, same as anybody else.
“I used to call on non-derms too. We carried cortisone creams and antifungal creams, and they used to stop and ask me, ‘Now Stan, I put this fungus cream on the fungus and the cortisone cream on the eczema, am I right?’”
Some things indeed don’t change.
I guess it’s just human nature to pine for When patients (or their biopsy specimens) could go to any lab you sent them to.
Ah, wasn’t that the life? When patients paid you 10 bucks in cash and you stuffed it in your shoebox? When if they didn’t have cash, they sent you a roast turkey on Thanksgiving, or a dozen eggs, or maybe nothing at all?
If you’re the sentimental sort, you can wax nostalgic about those good old days if you want. But you’ll forgive me if I don’t join you.
Dr. Rockoff practices dermatology in Brookline, Mass., and is a longtime contributor to Dermatology News. He serves on the clinical faculty at Tufts University, Boston, and has taught senior medical students and other trainees for 30 years. His second book, “Act Like a Doctor, Think Like a Patient,” is available at amazon.com and barnesandnoble.com. Write to him at [email protected].
Transgender equality: U.S. physicians must lead the way
Physicians have a duty to uphold to all kinds of people we serve, and transgender people are just that: people.

According to the U.S. Transgender Survey of 2015, one-third of transgender individuals have experienced a negative reaction from a health care provider in the past year. About 40% have attempted suicide in their lifetime, nearly nine times the rate of the U.S. general population. HIV positivity in the transgender community is nearly five times the rate of the U.S. general population.
In many states across the United States, including Pennsylvania, there are no comprehensive nondiscrimination laws that protect members of the LGBTQ community from being denied housing or from being fired because of their sexual orientation or gender identity and expression. Members of the transgender community have experienced brutal, unfair judgment and have been denied fair opportunities.
There have been numerous cases where transgender individuals have been treated unfairly by private businesses and public institutions. These instances include people being physically assaulted, verbally harassed, or denied their basic rights.
The denial of these fundamental rights calls for change, and the responsibility of this shift toward equality falls upon a faction of some of the most important people in our society: American physicians.
These patients are at an already vulnerable time of their lives and often need support from those who are in the best position to provide it.
Esteemed medical organizations such as the American Medical Association have iterated their beliefs about the importance of equality in medical treatment several times, mentioning that their support for equal care is blind of gender, sexual orientation, and gender identity.
The AMA has developed numerous policies that support LGBTQ individuals. General policies developed include those on the Continued Support of Human Rights and Freedom, the Nondiscrimination Policy, and Civil Rights Restoration. Several additional physician- and patient-centered policies have also been developed to reinforce the AMA’s support.
As a doctor who can recognize the importance of this initiative, I think it is of utmost importance that physicians support, spearhead, and lead this movement – not as part of a political agenda, but for the purpose of providing aid to a community that has not been receiving the clinical or social acknowledgment it deserves.
Often, transgender patients look to their health care providers for counsel, support, and education when confused about government legislation, insurance policies, and benefits. Yet, many physicians find themselves to be either unaware of the answers or unable to help with current resources at hand when approached about this issue. That is the case despite the wide number of resources and articles that are available to educate physicians to support their patients.
In cases like these, it is imperative that transgender patients, as any other patient would, receive the guidance and support they need. It is a respected obligation to our valued profession that we are continuously learning – exploring, discovering, and seeing the future of treatment for the benefit of those we serve, especially for the growing needs of our transgender patients.
The dynamics of equal treatment for the transgender community require significant action of health care professionals, and it is the will and power of American physicians that will propel this movement toward victory. As a transgender Pennsylvanian and American, I am proud to serve my community, my state, and my nation as the secretary of health for the Commonwealth of Pennsylvania.
In addition to serving as Pennsylvania’s secretary of health, Dr. Levine is professor of pediatrics and psychiatry at Penn State University, Hershey.
Physicians have a duty to uphold to all kinds of people we serve, and transgender people are just that: people.
According to the U.S. Transgender Survey of 2015, one-third of transgender individuals have experienced a negative reaction from a health care provider in the past year. About 40% have attempted suicide in their lifetime, nearly nine times the rate of the U.S. general population. HIV positivity in the transgender community is nearly five times the rate of the U.S. general population.
In many states across the United States, including Pennsylvania, there are no comprehensive nondiscrimination laws that protect members of the LGBTQ community from being denied housing or from being fired because of their sexual orientation or gender identity and expression. Members of the transgender community have experienced brutal, unfair judgment and have been denied fair opportunities.
There have been numerous cases where transgender individuals have been treated unfairly by private businesses and public institutions. These instances include people being physically assaulted, verbally harassed, or denied their basic rights.
The denial of these fundamental rights calls for change, and the responsibility of this shift toward equality falls upon a faction of some of the most important people in our society: American physicians.
These patients are at an already vulnerable time of their lives and often need support from those who are in the best position to provide it.
Esteemed medical organizations such as the American Medical Association have iterated their beliefs about the importance of equality in medical treatment several times, mentioning that their support for equal care is blind of gender, sexual orientation, and gender identity.
The AMA has developed numerous policies that support LGBTQ individuals. General policies developed include those on the Continued Support of Human Rights and Freedom, the Nondiscrimination Policy, and Civil Rights Restoration. Several additional physician- and patient-centered policies have also been developed to reinforce the AMA’s support.
As a doctor who can recognize the importance of this initiative, I think it is of utmost importance that physicians support, spearhead, and lead this movement – not as part of a political agenda, but for the purpose of providing aid to a community that has not been receiving the clinical or social acknowledgment it deserves.
Often, transgender patients look to their health care providers for counsel, support, and education when confused about government legislation, insurance policies, and benefits. Yet, many physicians find themselves to be either unaware of the answers or unable to help with current resources at hand when approached about this issue. That is the case despite the wide number of resources and articles that are available to educate physicians to support their patients.
In cases like these, it is imperative that transgender patients, as any other patient would, receive the guidance and support they need. It is a respected obligation to our valued profession that we are continuously learning – exploring, discovering, and seeing the future of treatment for the benefit of those we serve, especially for the growing needs of our transgender patients.
The dynamics of equal treatment for the transgender community require significant action of health care professionals, and it is the will and power of American physicians that will propel this movement toward victory. As a transgender Pennsylvanian and American, I am proud to serve my community, my state, and my nation as the secretary of health for the Commonwealth of Pennsylvania.
In addition to serving as Pennsylvania’s secretary of health, Dr. Levine is professor of pediatrics and psychiatry at Penn State University, Hershey.
Recommending HPV vaccination: How would you grade yourself?
A few weeks ago, a patient asked whether he could get my opinion on something unrelated to his yellow fever vaccine visit: He asked what I thought about the human papillomavirus (HPV) vaccine. His daughter’s primary care physician (PCP) had recommended it, but he “heard that it wasn’t safe.” We had a brief discussion.
My pediatric training days have long since ended, but I was taught never to miss an opportunity to immunize. In this case, it was to help a parent decide to immunize. This type of encounter is not unusual because, as part of preparing persons for international travel, I review their routine immunizations. When documentation of a vaccine is absent, it is pointed out and often remedied after a brief discussion.
Unfortunately, with HPV, too often parents state “my primary care physician said” it was optional, it was not required, or it was never recommended. Some were told to wait until their child was older, and several have safety concerns as did the parent above. I sometimes hear, “it’s not necessary for my child”; this is usually a clue indicating that the issue is more likely about how HPV is transmitted than what HPV vaccine can prevent. Most have welcomed the opportunity to discuss the vaccine, hear about its benefits, and have their questions answered. All leave with HPV information and are directed to websites that provide accurate information. They are referred to their PCP – hopefully to be immunized.
Three vaccines – meningococcal conjugate vaccine (MCV), Tdap, and HPV vaccine – all are recommended for administration at 11-12 years of age. A booster of MCV is recommended at 16 years. However, let’s focus on HPV. In 2007, HPV administration was recommended by the Advisory Committee on Immunization Practices (ACIP) for girls; by 2011, the recommendation was extended to boys. It was a three-dose schedule expected to be completed by age 13 years. In December 2016, a two-dose schedule administered at least 6 months apart was recommended for teens who initiated immunization at less than 15 years. Three doses were still recommended for those initiating HPV after 15 years. This was the only time the number of doses to complete a vaccine series had been decreased based on postlicensure data. So
Vaccine coverage
The National Immunization Survey–Teen (NIS-Teen) monitors vaccine coverage annually amongst adolescents aged 13-17 years. Data are obtained from individuals from every state, as well as the District of Columbia, the U.S. Virgin Islands, and six major urban areas.
According to the Centers for Disease Control and Prevention’s Morbidity and Mortality Weekly Report (2018 Aug 24;67[33]:909-17), HPV vaccination continues to lag behind Tdap and MCV in 2018. Among all adolescents, coverage with one or more doses of HPV was 66%, with up-to-date HPV status in 49%. In contrast, 82% received a dose of MCV, and 89% received a dose of Tdap.
Coverage for receiving one or more doses of HPV among females was 69%, and up-to-date HPV status was 53%; among males, coverage with one or more doses was 63%, and up-to-date HPV status was 44%.
Up-to-date HPV coverage status differed geographically, ranging from 29% in Mississippi to 78% in DC. Overall, eight states and the District of Columbia reported increases in up-to-date status (District of Columbia, Louisiana, Massachusetts, Nebraska, North Carolina, South Carolina, Texas, Vermont, and Virginia). Kudos to Virginia for having the largest increase (20 percentage points).
Coverage also differed between urban and rural areas: one or more doses at 70% vs. 59% and up-to-date status at 52% vs. 42%.
HPV coverage differed by poverty level as well. It was higher for persons living below the poverty level, with one or more doses in 73% and up-to-date status in 54%, compared with persons living at or above poverty level at 63% and 47%, respectively.
HPV-related cancers
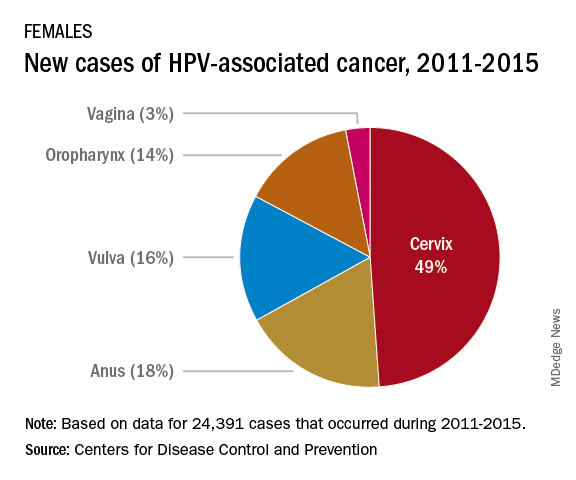
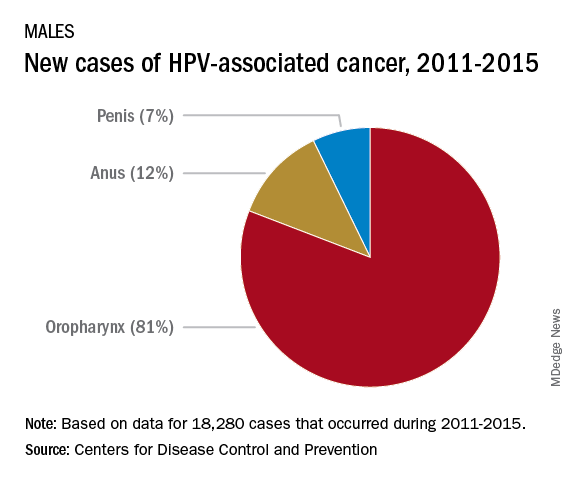
The most recent CDC data regarding types of HPV-associated cancers during 2011-2015 suggest that HPV types 16 and 18 account for the majority of cervical (78%) and oropharyngeal (86%) cancers.
Currently, there are more cases of oropharyngeal cancer than cervical, and we have no screening tool for the former.
Safety
Safety has been well documented. Since licensure, no serious safety concerns have been identified, contrary to what has been reported on various social and news media outlets. Yet it remains a concern for many parents who have delayed initiation of vaccine. Efficacy also has been documented in the United States and abroad.
Suggestions for improving HPV immunization coverage
Here are eight suggestions to help you recommend the vaccine and convince hesitant parents of its necessity:
1. Focus on your delivery of the HPV immunization recommendation. Clinician recommendation is the No. 1 reason parents vaccinate. The tone you use and how you make the recommendation can affect how the parent perceives the importance of this vaccine. The following are components of a high-quality recommendation (Academic Pediatrics. 2018;18:S23-S27):
- Routinely recommend vaccine at 11-12 years.
- Recommend vaccine for all preteens, not just those you feel are at risk for infection.
- Recommend the vaccine be given the same day it is discussed.
- Use language that expresses the importance of the HPV vaccine.
2. Use the “announcement or presumptive approach.” You expect the parent to agree with your recommendation. You don’t want to convey that it is an option.
3. Remind parents that immunizing on time means only two doses of HPV.
4. Revisit the topic again during another visit if a parent declines. Data suggest secondary acceptance can be as high as 66%.
5. Consider using a motivational interviewing approach for parents who are very hesitant to vaccinate. Most people want to comply with recommended health interventions.
6. Educate your staff about the importance of HPV vaccine and how it prevents cancer.
7. Determine how well your practice immunizes adolescents. This would be a perfect quality improvement project.
8. Explore “Answering Parents’ Questions” and other resources at www.cdc.gov/hpv to find quick answers to HPV vaccine–related questions .

Why is HPV coverage, a vaccine to prevent cancer, still lagging behind Tdap and MCV? I am as puzzled as others. What I do know is this: Our children will mature and one day become sexually active. They can be exposed to and get infected with HPV, and we can’t predict which ones will not clear the virus and end up developing an HPV-related cancer in the future. At the end of the day, HPV vaccination is cancer prevention.
Dr. Word is a pediatric infectious disease specialist and director of the Houston Travel Medicine Clinic. She said she had no relevant financial disclosures. Email her at [email protected].
A few weeks ago, a patient asked whether he could get my opinion on something unrelated to his yellow fever vaccine visit: He asked what I thought about the human papillomavirus (HPV) vaccine. His daughter’s primary care physician (PCP) had recommended it, but he “heard that it wasn’t safe.” We had a brief discussion.
My pediatric training days have long since ended, but I was taught never to miss an opportunity to immunize. In this case, it was to help a parent decide to immunize. This type of encounter is not unusual because, as part of preparing persons for international travel, I review their routine immunizations. When documentation of a vaccine is absent, it is pointed out and often remedied after a brief discussion.
Unfortunately, with HPV, too often parents state “my primary care physician said” it was optional, it was not required, or it was never recommended. Some were told to wait until their child was older, and several have safety concerns as did the parent above. I sometimes hear, “it’s not necessary for my child”; this is usually a clue indicating that the issue is more likely about how HPV is transmitted than what HPV vaccine can prevent. Most have welcomed the opportunity to discuss the vaccine, hear about its benefits, and have their questions answered. All leave with HPV information and are directed to websites that provide accurate information. They are referred to their PCP – hopefully to be immunized.
Three vaccines – meningococcal conjugate vaccine (MCV), Tdap, and HPV vaccine – all are recommended for administration at 11-12 years of age. A booster of MCV is recommended at 16 years. However, let’s focus on HPV. In 2007, HPV administration was recommended by the Advisory Committee on Immunization Practices (ACIP) for girls; by 2011, the recommendation was extended to boys. It was a three-dose schedule expected to be completed by age 13 years. In December 2016, a two-dose schedule administered at least 6 months apart was recommended for teens who initiated immunization at less than 15 years. Three doses were still recommended for those initiating HPV after 15 years. This was the only time the number of doses to complete a vaccine series had been decreased based on postlicensure data. So
Vaccine coverage
The National Immunization Survey–Teen (NIS-Teen) monitors vaccine coverage annually amongst adolescents aged 13-17 years. Data are obtained from individuals from every state, as well as the District of Columbia, the U.S. Virgin Islands, and six major urban areas.
According to the Centers for Disease Control and Prevention’s Morbidity and Mortality Weekly Report (2018 Aug 24;67[33]:909-17), HPV vaccination continues to lag behind Tdap and MCV in 2018. Among all adolescents, coverage with one or more doses of HPV was 66%, with up-to-date HPV status in 49%. In contrast, 82% received a dose of MCV, and 89% received a dose of Tdap.
Coverage for receiving one or more doses of HPV among females was 69%, and up-to-date HPV status was 53%; among males, coverage with one or more doses was 63%, and up-to-date HPV status was 44%.
Up-to-date HPV coverage status differed geographically, ranging from 29% in Mississippi to 78% in DC. Overall, eight states and the District of Columbia reported increases in up-to-date status (District of Columbia, Louisiana, Massachusetts, Nebraska, North Carolina, South Carolina, Texas, Vermont, and Virginia). Kudos to Virginia for having the largest increase (20 percentage points).
Coverage also differed between urban and rural areas: one or more doses at 70% vs. 59% and up-to-date status at 52% vs. 42%.
HPV coverage differed by poverty level as well. It was higher for persons living below the poverty level, with one or more doses in 73% and up-to-date status in 54%, compared with persons living at or above poverty level at 63% and 47%, respectively.
HPV-related cancers
The most recent CDC data regarding types of HPV-associated cancers during 2011-2015 suggest that HPV types 16 and 18 account for the majority of cervical (78%) and oropharyngeal (86%) cancers.
Currently, there are more cases of oropharyngeal cancer than cervical, and we have no screening tool for the former.
Safety
Safety has been well documented. Since licensure, no serious safety concerns have been identified, contrary to what has been reported on various social and news media outlets. Yet it remains a concern for many parents who have delayed initiation of vaccine. Efficacy also has been documented in the United States and abroad.
Suggestions for improving HPV immunization coverage
Here are eight suggestions to help you recommend the vaccine and convince hesitant parents of its necessity:
1. Focus on your delivery of the HPV immunization recommendation. Clinician recommendation is the No. 1 reason parents vaccinate. The tone you use and how you make the recommendation can affect how the parent perceives the importance of this vaccine. The following are components of a high-quality recommendation (Academic Pediatrics. 2018;18:S23-S27):
- Routinely recommend vaccine at 11-12 years.
- Recommend vaccine for all preteens, not just those you feel are at risk for infection.
- Recommend the vaccine be given the same day it is discussed.
- Use language that expresses the importance of the HPV vaccine.
2. Use the “announcement or presumptive approach.” You expect the parent to agree with your recommendation. You don’t want to convey that it is an option.
3. Remind parents that immunizing on time means only two doses of HPV.
4. Revisit the topic again during another visit if a parent declines. Data suggest secondary acceptance can be as high as 66%.
5. Consider using a motivational interviewing approach for parents who are very hesitant to vaccinate. Most people want to comply with recommended health interventions.
6. Educate your staff about the importance of HPV vaccine and how it prevents cancer.
7. Determine how well your practice immunizes adolescents. This would be a perfect quality improvement project.
8. Explore “Answering Parents’ Questions” and other resources at www.cdc.gov/hpv to find quick answers to HPV vaccine–related questions .
Why is HPV coverage, a vaccine to prevent cancer, still lagging behind Tdap and MCV? I am as puzzled as others. What I do know is this: Our children will mature and one day become sexually active. They can be exposed to and get infected with HPV, and we can’t predict which ones will not clear the virus and end up developing an HPV-related cancer in the future. At the end of the day, HPV vaccination is cancer prevention.
Dr. Word is a pediatric infectious disease specialist and director of the Houston Travel Medicine Clinic. She said she had no relevant financial disclosures. Email her at [email protected].
Educate your adolescent patients about herpes
We are all familiar with the line, “Herpes lasts forever.” There is no cure for infection with a herpes virus, whether it is herpes simplex 1 (HSV-1) or herpes simplex 2 (HSV-2).

There are antivirals to reduce the length and severity of flare-ups, and continued therapy can suppress the virus, which reduces shedding. Both HSV-1 and HSV-2 can cause genital herpes and oral herpes, i.e. cold sores. HSV-1 has a milder initial episode and fewer flareups, whereas HSV-2 can have a more severe initial episode and frequent flareups.1
According to data from the National Health and Nutrition Examination Survey (NHANES) for 2015-2016, HSV-1 prevalence was 48% among 14- to 19-year-olds and HSV-2 prevalence was 12% in the same age group. Overall, age-adjusted HSV-1 prevalence was higher in females (51%) than in males (45%) in persons aged 14-49 years.2
The reality is that most people with HSV-1 or HSV-2 don’t even know they have it, as both tend to be asymptomatic. Therefore, all reported statistics are grossly underrepresenting the prevalence of the disease.
HSV is a common disease. Regardless of symptoms, shedding occurs. Although condoms reduce the risk of spread, using one doesn’t eliminate it because of the possibility of contact beyond the area covered by the condom and the ability of HSV to be passed through oral sex. The only true prevention is abstinence.
Herpes simplex virus is a sexually transmitted infection that is lifelong. Its presence can increase the risk of contracting HIV. If it is contracted in the third trimester of pregnancy or if a breakout occurs during the third trimester, risk of transmitting to the infant can occur, with devastating neurological impact. Despite the seriousness and longevity of the virus, the vast majority of people with the virus have it unknowingly, and live normal healthy lives.
It is just as important that we educate them that, if they contract herpes, it is not end of their ability to have intimate relationships. Debunking the myth that HSV-2 is a worse disease to have than HSV-1 can significantly reduce the psychological burden caused by this disease, and encourage patients to be more honest about their diagnosis. This not only will assist people in seeking medical advice if they have concerns, but it will encourage conversations about HSV, which hopefully will reduce spread of the virus.

Dr. Pearce is a pediatrician in Frankfort, Ill. She said she had no relevant financial disclosures. Email her at [email protected].
References
1. J Infect Dis. 2014 Feb. doi: 10.1093/infdis/jit458.
2. NCHS Data Brief, no 304. 2018 Feb.
We are all familiar with the line, “Herpes lasts forever.” There is no cure for infection with a herpes virus, whether it is herpes simplex 1 (HSV-1) or herpes simplex 2 (HSV-2).
There are antivirals to reduce the length and severity of flare-ups, and continued therapy can suppress the virus, which reduces shedding. Both HSV-1 and HSV-2 can cause genital herpes and oral herpes, i.e. cold sores. HSV-1 has a milder initial episode and fewer flareups, whereas HSV-2 can have a more severe initial episode and frequent flareups.1
According to data from the National Health and Nutrition Examination Survey (NHANES) for 2015-2016, HSV-1 prevalence was 48% among 14- to 19-year-olds and HSV-2 prevalence was 12% in the same age group. Overall, age-adjusted HSV-1 prevalence was higher in females (51%) than in males (45%) in persons aged 14-49 years.2
The reality is that most people with HSV-1 or HSV-2 don’t even know they have it, as both tend to be asymptomatic. Therefore, all reported statistics are grossly underrepresenting the prevalence of the disease.
HSV is a common disease. Regardless of symptoms, shedding occurs. Although condoms reduce the risk of spread, using one doesn’t eliminate it because of the possibility of contact beyond the area covered by the condom and the ability of HSV to be passed through oral sex. The only true prevention is abstinence.
Herpes simplex virus is a sexually transmitted infection that is lifelong. Its presence can increase the risk of contracting HIV. If it is contracted in the third trimester of pregnancy or if a breakout occurs during the third trimester, risk of transmitting to the infant can occur, with devastating neurological impact. Despite the seriousness and longevity of the virus, the vast majority of people with the virus have it unknowingly, and live normal healthy lives.
It is just as important that we educate them that, if they contract herpes, it is not end of their ability to have intimate relationships. Debunking the myth that HSV-2 is a worse disease to have than HSV-1 can significantly reduce the psychological burden caused by this disease, and encourage patients to be more honest about their diagnosis. This not only will assist people in seeking medical advice if they have concerns, but it will encourage conversations about HSV, which hopefully will reduce spread of the virus.
Dr. Pearce is a pediatrician in Frankfort, Ill. She said she had no relevant financial disclosures. Email her at [email protected].
References
1. J Infect Dis. 2014 Feb. doi: 10.1093/infdis/jit458.
2. NCHS Data Brief, no 304. 2018 Feb.
What is the Diagnosis - September 2018
At the visit, the girl’s skin scrapings were analyzed under the microscope with potassium hydroxide (KOH) and no fungal elements were seen. A culture from one of the lesions was positive for methicillin-sensitive Staphylococcus aureus.
She was diagnosed with bullous impetigo (BI).
Impetigo is the most common superficial skin infection and can present as a nonbullous (most common) and bullous (least common) form.1 Nonbullous impetigo is usually caused the Staphylococcus aureus or Streptococcus pyogenes and tends to occur at sites of prior trauma like insect bites, scratches, atopic dermatitis, or varicella. On the other hand, bullous impetigo is caused by the local production of exfoliative toxins (ETA or ETB) by phage group II of Staphylococcus aureus. The exfoliative toxin binds to desmoglin-1, one of the desmosomal proteins of the skin, causing acantholysis at the level of the granular layer and blister formation. Different from nonbullous impetigo, bullous impetigo tends to occur in normal, undamaged skin. Lesions are more common in neonates and young infants but children also can be affected.
The characteristic lesions in bullous impetigo are small blisters that enlarge to 1-cm to 5-cm bullae that easily rupture, leaving an erythematous plaque with a collarette of scale or “double ring scale,” with minimal crust and mild erythema. They commonly occur on the face, trunk, buttocks, and intertriginous areas. The lesions heal within 4-6 weeks, leaving no scarring. Associated systemic symptoms are rare but some patients can present with weakness, fever, and diarrhea. The toxin can disseminate and cause staphylococcal scalded skin syndrome in neonates or older patients with renal failure or immunodeficiency.
The transmission of Staphylococcus aureus can occur from colonized or infected family members, children in contact sports, as well as contact with animals such as dogs, cattle, and poultry.2 Transmission from a pet rabbit also has been reported. In our patient, transmission from her pet hamster could have occurred as the areas on the body where there were lesions were areas where she was holding and cuddling her new pet.
The differential diagnosis of the type of lesions our patient presented with includes tinea corporis, and bullous tinea, which also can be transmitted by animals such as kittens. A KOH analysis ruled out this diagnosis. Tinea skin lesions tend to be more scaly than bullous impetigo lesions, which are more inflamed and crusted. Bullous arthropod reactions should be considered in the differential diagnosis as well. Bullous bite reaction lesions present with tense bullae, as they are subepidermal in nature and are pruritic. Subacute cutaneous lupus lesions present as annular scaly plaques with an erythematous border and central clearing usually in sun exposed areas similar to the distribution of our patient. Severe contact dermatitis reactions also can blister and form similar lesions as seen in our patient but with the difference that our patient didn’t complain of pruritus, which is a characteristic feature of allergic contact dermatitis. In neonates or young infants with bullous lesions other conditions such as herpes simplex infection, epidermolysis bullosa, bullous pemphigoid, linear IgA bullous dermatosis, bullous mastocytosis, and bullous erythema multiforme should be considered in the differential diagnosis.
First line treatment for impetigo consists of the use of topical application of mupirocin (Bactroban) 2% ointment, retapamulin (Altabax) 1% ointment, or fusidic acid 2% cream. A Cochrane review compared systemic versus topical treatment for impetigo concluding that topical treatment with either mupirocin or retapamulin is equally if not more effective than oral antibiotics.3 Ozenoxacin (Xepi), a new nonfluorinated topical quinolone has recently been Food and Drug Administration approved for the treatment of localized impetigo in patients 2 months of age and older.4 When there is treatment failure with topical antibiotics, widespread disease, or systemic symptoms, oral antimicrobials should be consider, such as beta-lactamase–resistant penicillin, first-generation cephalosporins, or clindamycin. The use of bleach baths and general hygiene measures for 4 months can reduce the risks of recurrence in 20% of the patients as noted by a study by Kaplan et al.5
Our patient was treated with oral cephalexin for 7 days as well as topical mupirocin with fast resolution of the lesions. Sadly, the parents gave her hamster pet away.
Dr. Matiz is a pediatric dermatologist at Southern California Permanente Medical Group, San Diego. Email her at [email protected]
References
1. Am Fam Physician. 2014 Aug 15;90(4):229-35.
2. Zentralbl Bakteriol Mikrobiol Hyg A. 1987 Jun;265(1-2):218-26.
3. Cochrane Database Syst Rev. 2012 Jan 18;1:CD003261.
4. Ann Pharmacother. 2018 Jun 1:1060028018786510.
5. Clin Infect Dis. 2014 Mar;58(5):679-82.
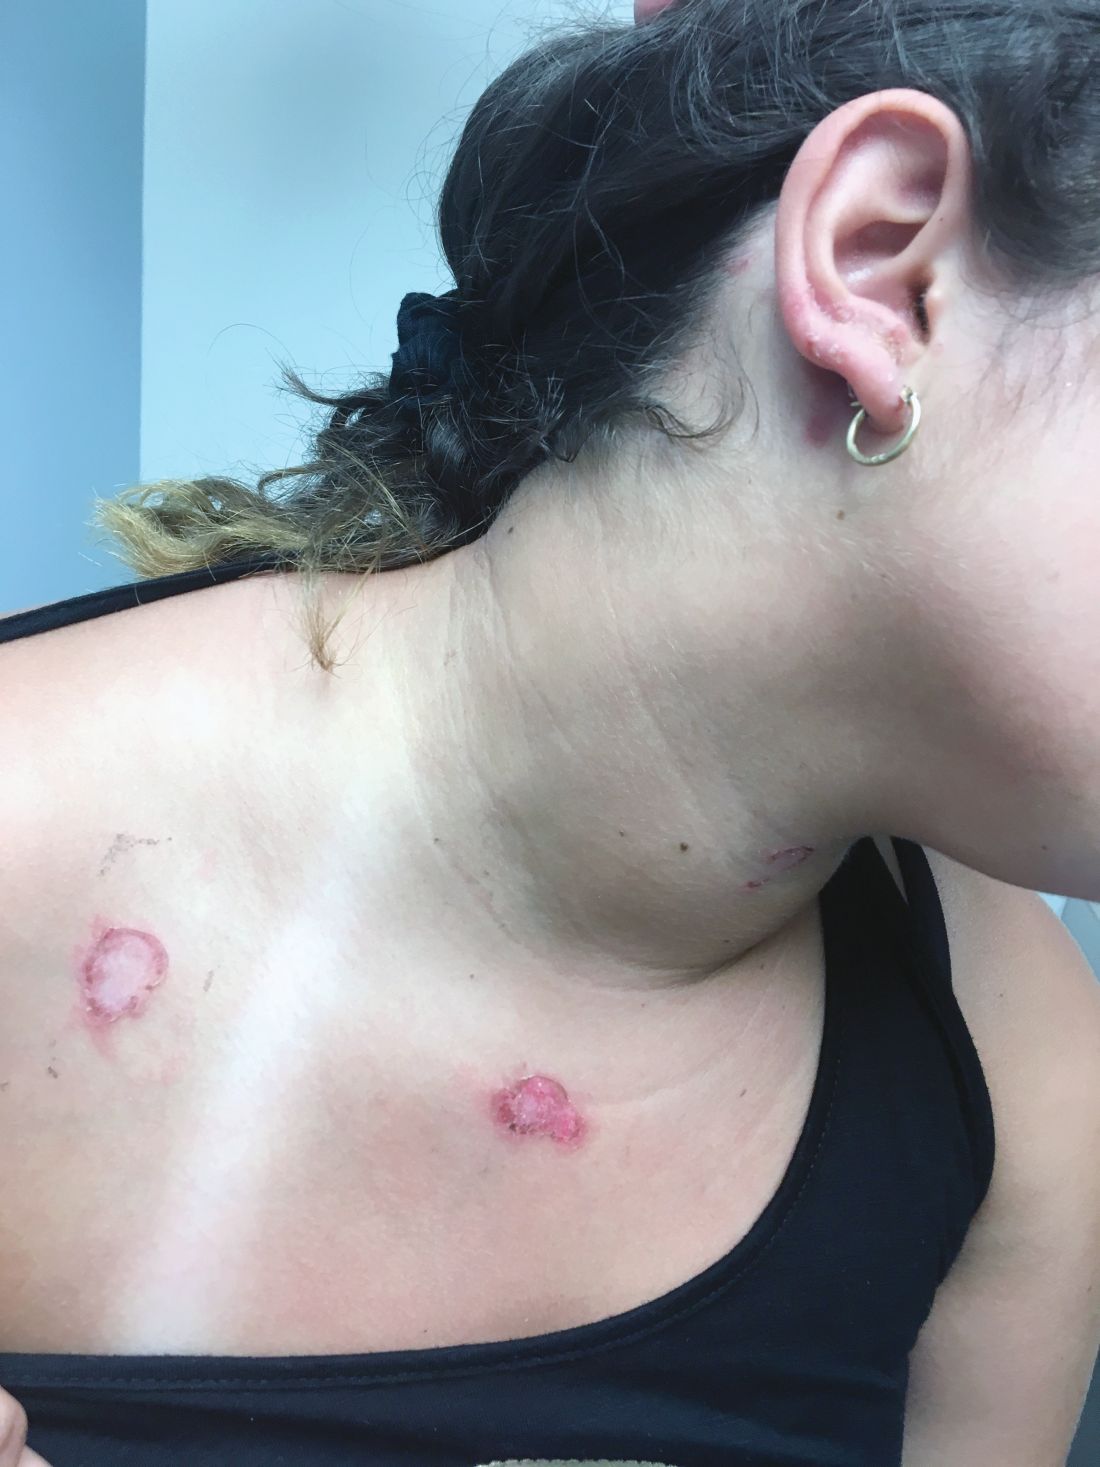
On physical exam, the girl is in no acute distress. Her vital signs are stable, and she has no fever.
On skin examination, she has several erythematous, crusted scaly plaques with double ring of scale on the nose, ears, neck, upper chest, and few on the abdomen. On her left abdomen, there is a small blister. Her seborrheic dermatitis is well controlled with mild erythema behind her ears and minimal scale on her scalp.
All children deserve support for their gender identities
The Atlantic published the article “When Children Say They’re Trans” by Jesse Singal in its July/August edition not too long ago. In this article, the author wrote about the increasing availability of treatments for affirming one’s gender identity and the rising concerns about the risks surrounding those treatments.

A key issue in the article is the concept of desistance. Desistance is a phenomenon in which individuals no longer feel that their gender identities are incongruent with their physical appearance. Highly related to desistance is detransitioning, a phenomenon in which transgender individuals no longer take the steps (e.g., hormone therapy) to affirm their gender identity. Singal highlights the concern surrounding starting medical treatments to affirm an individual’s gender identity, considering that the changes are irreversible and that it is possible for children to change their minds. Implied in the article is a call for a cautious approach for treating children who identify as transgender because it will be difficult to predict what one’s final gender identity is; however, I believe that a better approach is to support the child in the journey in affirming the gender identity.
The evidence on the rate of desistance may not be accurate
One argument for the cautious approach is the often cited statistic that 80% of children with gender nonconforming behaviors do not identify as transgender when they are adults. This is derived from four published studies that track the gender identity of individuals with gender nonconforming behaviors in childhood.1-4 These estimates may not be accurate, mainly due to these studies’ methodological shortcomings. For example, those who were lost to follow-up were assumed to be cisgender as adults and no efforts were made to verify these individuals’ gender identity.2-4 I do not intend to thoroughly critique these studies in this column. This is best left to peer-reviewed commentaries (a good example is one written by Newhook et al. 2018).5 I worry, however, that some clinicians may dismiss a child’s gender identity based on these studies and recommend to the parents to delay supporting a transition until the child “knows for sure.” The problem with this approach is that it may worsen the health and well-being of transgender youth, as there is growing evidence that transgender children who are supported by their parents are less likely to have mental health problems.6,7
The reasons for desistance are far more complicated
The common narrative of desistance is that the individuals simply change their minds because they were “confused” during adolescence. However, the truth is more complicated. Children can identify their own gender as early as 2 years old;8 however, when a child’s gender identity matches the assigned sex at birth, this is often reinforced. In contrast, if a child’s gender identity does not match the assigned sex at birth, it often is challenged by peers and adults. This challenge by peers, their families, and medical providers may be one of the reasons why transitioning is so difficult for many transgender youth – and many do give up.3,9 In these cases, some people wait for years, if not decades, to come out again and start transitioning when they finally feel supported and safe – even in their 90s! Other transgender people realize that their gender identity is not on the binary (neither male nor female), so they no longer need cross-sex hormones or surgeries to affirm their gender identity. Finally, others are concerned about the side effects, such as infertility, and feel that the risks for those side effects are not worth it, so they find other, nonmedical or nonsurgical ways to affirm their gender identity or manage their gender dysphoria.
Positive outcomes are more common
Reports of youth detransitioning highlight many physicians’ fears of making a mistake; however, these reports obscure the more common – and positive – outcomes for transgender individuals who took steps to affirm their gender identity. The Report of the 2011 Transition Survey shows that 97% were satisfied with being on hormone therapy and 90% were satisfied with obtaining bottom surgery.10 Furthermore, there is growing evidence showing that such treatments are associated with better health.11 A study by de Vries et al. found that transgender youth who transitioned in adolescence had less depression and better adjustment as adults.12 Finally, there is a lack of evidence supporting the concept that someone whose gender identity is fluid over time is any less healthy than those whose gender identity is static over time. Rare outcomes should never be dismissed; however, providers should not use rare events as the primary driver for discouraging evidence-based treatment.

The key is support
I believe that every child’s gender identity should be supported and affirmed. Clinicians can provide this support and affirmation through the following actions:
- At the first visit, clinicians should ask what the child’s hopes and expectations are for pursuing gender-affirming medical treatments.
- Clinicians should allow the child the opportunity to describe and process their gender identity instead of assuming that they are on the binary.
- Clinicians must recognize the varied reasons for desistance – stigma, discrimination, shame, or need to fit within a gender binary – and find ways to address those factors.
- Clinicians should have a thorough discussion with patients and their families about the risks of not supporting the child’s gender identity versus the risk of medical or surgical treatments used to affirm one’s gender identity and process with the child and the family where the values and wishes are within the context of those risks.
- Most importantly, clinicians should emphasize support for whatever decisions the child makes to affirm their gender identity. Providing support is essential in promoting the health and well-being of any child.
Dr. Montano is assistant professor of pediatrics at the University of Pittsburgh and an adolescent medicine physician at Children’s Hospital of Pittsburgh of UPMC. Email him at [email protected].
References
1. Dev Psychol. 2008;44(1):34-45.
2. J Am Acad Child Adolesc Psychiatry. 2013 Jun;52(6):582-90.
3. Clin Child Psychol Psychiatry. 2011 Oct;16(4):499-516.
4. J Am Acad Child Adolesc Psychiatry. 2008 Dec;47(12):1413-23.
5. International Journal of Transgenderism. 2018;19(2):212-24.
6. Pediatrics. 2016 Mar;137(3):e20153223.
7. J Sex Marital Ther. 2010;36(1):6-23.
8. “Adolescence,” 11th ed. (New York: McGraw-Hill Education; 2016).
9. Graduate Journal of Social Science. 2010;7(2):26-43.
10. “Affirming Gender, Affirming Lives: A Report of the 2011 Transition Survey,” Gender Advocacy Training & Education, 2012.
11. Transgend Health. 2016 Jan;1(1):21-31.
12. Pediatrics. 2014 Oct;134(4):696-704.
The Atlantic published the article “When Children Say They’re Trans” by Jesse Singal in its July/August edition not too long ago. In this article, the author wrote about the increasing availability of treatments for affirming one’s gender identity and the rising concerns about the risks surrounding those treatments.
A key issue in the article is the concept of desistance. Desistance is a phenomenon in which individuals no longer feel that their gender identities are incongruent with their physical appearance. Highly related to desistance is detransitioning, a phenomenon in which transgender individuals no longer take the steps (e.g., hormone therapy) to affirm their gender identity. Singal highlights the concern surrounding starting medical treatments to affirm an individual’s gender identity, considering that the changes are irreversible and that it is possible for children to change their minds. Implied in the article is a call for a cautious approach for treating children who identify as transgender because it will be difficult to predict what one’s final gender identity is; however, I believe that a better approach is to support the child in the journey in affirming the gender identity.
The evidence on the rate of desistance may not be accurate
One argument for the cautious approach is the often cited statistic that 80% of children with gender nonconforming behaviors do not identify as transgender when they are adults. This is derived from four published studies that track the gender identity of individuals with gender nonconforming behaviors in childhood.1-4 These estimates may not be accurate, mainly due to these studies’ methodological shortcomings. For example, those who were lost to follow-up were assumed to be cisgender as adults and no efforts were made to verify these individuals’ gender identity.2-4 I do not intend to thoroughly critique these studies in this column. This is best left to peer-reviewed commentaries (a good example is one written by Newhook et al. 2018).5 I worry, however, that some clinicians may dismiss a child’s gender identity based on these studies and recommend to the parents to delay supporting a transition until the child “knows for sure.” The problem with this approach is that it may worsen the health and well-being of transgender youth, as there is growing evidence that transgender children who are supported by their parents are less likely to have mental health problems.6,7
The reasons for desistance are far more complicated
The common narrative of desistance is that the individuals simply change their minds because they were “confused” during adolescence. However, the truth is more complicated. Children can identify their own gender as early as 2 years old;8 however, when a child’s gender identity matches the assigned sex at birth, this is often reinforced. In contrast, if a child’s gender identity does not match the assigned sex at birth, it often is challenged by peers and adults. This challenge by peers, their families, and medical providers may be one of the reasons why transitioning is so difficult for many transgender youth – and many do give up.3,9 In these cases, some people wait for years, if not decades, to come out again and start transitioning when they finally feel supported and safe – even in their 90s! Other transgender people realize that their gender identity is not on the binary (neither male nor female), so they no longer need cross-sex hormones or surgeries to affirm their gender identity. Finally, others are concerned about the side effects, such as infertility, and feel that the risks for those side effects are not worth it, so they find other, nonmedical or nonsurgical ways to affirm their gender identity or manage their gender dysphoria.
Positive outcomes are more common
Reports of youth detransitioning highlight many physicians’ fears of making a mistake; however, these reports obscure the more common – and positive – outcomes for transgender individuals who took steps to affirm their gender identity. The Report of the 2011 Transition Survey shows that 97% were satisfied with being on hormone therapy and 90% were satisfied with obtaining bottom surgery.10 Furthermore, there is growing evidence showing that such treatments are associated with better health.11 A study by de Vries et al. found that transgender youth who transitioned in adolescence had less depression and better adjustment as adults.12 Finally, there is a lack of evidence supporting the concept that someone whose gender identity is fluid over time is any less healthy than those whose gender identity is static over time. Rare outcomes should never be dismissed; however, providers should not use rare events as the primary driver for discouraging evidence-based treatment.
The key is support
I believe that every child’s gender identity should be supported and affirmed. Clinicians can provide this support and affirmation through the following actions:
- At the first visit, clinicians should ask what the child’s hopes and expectations are for pursuing gender-affirming medical treatments.
- Clinicians should allow the child the opportunity to describe and process their gender identity instead of assuming that they are on the binary.
- Clinicians must recognize the varied reasons for desistance – stigma, discrimination, shame, or need to fit within a gender binary – and find ways to address those factors.
- Clinicians should have a thorough discussion with patients and their families about the risks of not supporting the child’s gender identity versus the risk of medical or surgical treatments used to affirm one’s gender identity and process with the child and the family where the values and wishes are within the context of those risks.
- Most importantly, clinicians should emphasize support for whatever decisions the child makes to affirm their gender identity. Providing support is essential in promoting the health and well-being of any child.
Dr. Montano is assistant professor of pediatrics at the University of Pittsburgh and an adolescent medicine physician at Children’s Hospital of Pittsburgh of UPMC. Email him at [email protected].
References
1. Dev Psychol. 2008;44(1):34-45.
2. J Am Acad Child Adolesc Psychiatry. 2013 Jun;52(6):582-90.
3. Clin Child Psychol Psychiatry. 2011 Oct;16(4):499-516.
4. J Am Acad Child Adolesc Psychiatry. 2008 Dec;47(12):1413-23.
5. International Journal of Transgenderism. 2018;19(2):212-24.
6. Pediatrics. 2016 Mar;137(3):e20153223.
7. J Sex Marital Ther. 2010;36(1):6-23.
8. “Adolescence,” 11th ed. (New York: McGraw-Hill Education; 2016).
9. Graduate Journal of Social Science. 2010;7(2):26-43.
10. “Affirming Gender, Affirming Lives: A Report of the 2011 Transition Survey,” Gender Advocacy Training & Education, 2012.
11. Transgend Health. 2016 Jan;1(1):21-31.
12. Pediatrics. 2014 Oct;134(4):696-704.

How to manage school failure
The start of the school year brings excitement and some expected anxiety, around seeing friends and undertaking new challenges. While setbacks, small failures, and disappointments are an essential part of a child’s mastery of new challenges, academic and otherwise, occasionally a child will experience school failure in many areas. When this happens, the school usually will engage parents to help understand and address what might be interfering with the child’s performance at school. Parents may turn to their trusted pediatricians for guidance in sorting out school failure, as the list of possible causes is very long. By asking the right questions and knowing your patient, you can efficiently investigate this problem so that your patient may quickly get back on track, both academically and in overall development.

Are their academic problems a striking change from prior years? If your patients previously had managed coursework with ease, then there is a new problem interfering with their performance, unless they are young enough that earlier years were not as challenging. Possibly a previous school was not as demanding or new academic expectations such as writing an essay or a dramatic increase in reading expectations have exposed a learning disability or attentional issue that is interfering with performance. This can be sorted out by asking more specific questions about their function. Do they struggle more with reading, essay writing, or math? Do they struggle with sustained attention on assignments or handing in completed work? Your patients can help answer these questions, as can as parents and teachers. Neuropsychological testing can elucidate specific learning disabilities or indicate marked problems with attention, working memory, or processing speed that may be improved with cognitive coaching, in-class strategies, and even medications. With older patients, a new problem is less likely to be the first presentation of an underlying learning or attentional issue and will need further investigation.
Do your patients still enjoy school or are they resisting attending? Students who are avoiding school may be struggling with anxiety. This may be a consequence of their academic struggles, as they try to avoid the shame, embarrassment, or discomfort of their failure to understand material, keep up, or perform. Alternately, the anxiety may have come first, leading to an inability to manage the challenges of school and then failure academically. Similarly, a mood disorder such as depression can create problems with attention, energy, interest, and motivation that make it difficult to attend and participate in school.

Ask about any family history of school problems and psychiatric disorders as these issues often run in families. Ask if there is anxiety around academic or social performance or more generalized anxiety. Are they experiencing trouble with sleep, energy, appetite? Have they withdrawn from other interests? Are they more tearful or irritable in all settings? When these symptoms are universal (i.e., occurring across settings and affecting school), there is likely an underlying psychiatric disorder driving them, and they require a full psychiatric assessment. It is worth noting that often children or adolescents with mood or anxiety disorders will experience somatic symptoms such as stomach aches or headaches alongside the loss of energy and motivation. They may come to the pediatrician first, and it is important to investigate the likely psychiatric illnesses (anxiety in prepubertal children and anxiety or depression in adolescents) as well as the more esoteric medical problems that could be causing such universal impairment in a child or teenager. Stigma still exists around psychiatric illness and it is powerful when a pediatrician can tell a family that these illnesses are common in young people (affecting nearly 20% of children by the age of 18) and very treatable.
Drug and alcohol abuse may be associated with another psychiatric illness or can be independent problems that interfere with the healthy development and school performance of young people, including middle school students. Find out if your patients are drinking alcohol, using marijuana, vaping, utilizing prescription medications that are not their own, or using other illegal drugs. Substance use that has led to problems at school is by definition a problem (in addition to being illegal) and will not improve without treatment. These young people need a full psychiatric evaluation, and they and their parents require specialized treatment and support to address the substance abuse problem.

Of course, school failure may represent other sources of stress. It is critical to find out from your patients if they feel safe at school. Are they being bullied or threatened? Do they have a safe way to get to and from school? Has something else occurred at the school that has left them feeling vigilant and unable to concentrate on classwork? While bullying or living in a neighborhood plagued by violence may not be easy problems to fix, it is critical to find out about them so the adults – parents, teachers, and others – can provide the students with support while directly addressing the safety issue. Do not fail to find out if the fear is at home. Children who are managing physical or sexual abuse may be too stressed to complete homework or even attend school. A caring, curious pediatrician will be a lifeline to a safer future for these children.
Similarly, it is important to find out if your patient is managing less dramatic stresses at home. Perhaps a parent has been seriously ill, working two jobs, or managing a problem with drugs or alcohol, and your patient is caring for that person, or for siblings, instead of keeping up with schoolwork. Perhaps there has been a stressful loss or transition, such as the death of a grandparent or pet, the loss of a job, or a big move, or family discord/violence that has made it difficult for your patient to focus on homework or interfered with parental supervision or homework help. Perhaps your patient has gotten a job to help the family financially and has no time for homework. Bringing such a challenge out into the open and rallying support for your patient and the family in these circumstances is often enough to foster adaptation to these stresses and a return to healthy function in school.
Finally, it is possible that school failure is a function of milder imbalances in a young person’s life. Some children may respond to the expanded independence of adolescence by making poor choices. When do they go to bed at night? Are they staying up late playing video games or surfing the web? Not all insomnia represents illness. Find out how much independence your patients have and how they are managing their time and responsibilities. Help them to think about how to protect time for both responsibilities and relaxation. You also may help the parents of these young people think about how to set expectations and basic rules while stepping back appropriately to allow for expanding independence in ways that will help their children to flourish.
Once defined, Setting reasonable expectations, curriculum adjustments, any needed psychiatric treatment, building on a child’s strengths, and paying attention to self-esteem are the hallmarks of effective interventions.
Dr. Swick is an attending psychiatrist in the division of child psychiatry at Massachusetts General Hospital, Boston, and director of the Parenting at a Challenging Time (PACT) Program at the Vernon Cancer Center at Newton Wellesley Hospital, also in Boston. Dr. Jellinek is professor emeritus of psychiatry and pediatrics, Harvard Medical School, Boston. Email them at [email protected].
The start of the school year brings excitement and some expected anxiety, around seeing friends and undertaking new challenges. While setbacks, small failures, and disappointments are an essential part of a child’s mastery of new challenges, academic and otherwise, occasionally a child will experience school failure in many areas. When this happens, the school usually will engage parents to help understand and address what might be interfering with the child’s performance at school. Parents may turn to their trusted pediatricians for guidance in sorting out school failure, as the list of possible causes is very long. By asking the right questions and knowing your patient, you can efficiently investigate this problem so that your patient may quickly get back on track, both academically and in overall development.
Are their academic problems a striking change from prior years? If your patients previously had managed coursework with ease, then there is a new problem interfering with their performance, unless they are young enough that earlier years were not as challenging. Possibly a previous school was not as demanding or new academic expectations such as writing an essay or a dramatic increase in reading expectations have exposed a learning disability or attentional issue that is interfering with performance. This can be sorted out by asking more specific questions about their function. Do they struggle more with reading, essay writing, or math? Do they struggle with sustained attention on assignments or handing in completed work? Your patients can help answer these questions, as can as parents and teachers. Neuropsychological testing can elucidate specific learning disabilities or indicate marked problems with attention, working memory, or processing speed that may be improved with cognitive coaching, in-class strategies, and even medications. With older patients, a new problem is less likely to be the first presentation of an underlying learning or attentional issue and will need further investigation.
Do your patients still enjoy school or are they resisting attending? Students who are avoiding school may be struggling with anxiety. This may be a consequence of their academic struggles, as they try to avoid the shame, embarrassment, or discomfort of their failure to understand material, keep up, or perform. Alternately, the anxiety may have come first, leading to an inability to manage the challenges of school and then failure academically. Similarly, a mood disorder such as depression can create problems with attention, energy, interest, and motivation that make it difficult to attend and participate in school.
Ask about any family history of school problems and psychiatric disorders as these issues often run in families. Ask if there is anxiety around academic or social performance or more generalized anxiety. Are they experiencing trouble with sleep, energy, appetite? Have they withdrawn from other interests? Are they more tearful or irritable in all settings? When these symptoms are universal (i.e., occurring across settings and affecting school), there is likely an underlying psychiatric disorder driving them, and they require a full psychiatric assessment. It is worth noting that often children or adolescents with mood or anxiety disorders will experience somatic symptoms such as stomach aches or headaches alongside the loss of energy and motivation. They may come to the pediatrician first, and it is important to investigate the likely psychiatric illnesses (anxiety in prepubertal children and anxiety or depression in adolescents) as well as the more esoteric medical problems that could be causing such universal impairment in a child or teenager. Stigma still exists around psychiatric illness and it is powerful when a pediatrician can tell a family that these illnesses are common in young people (affecting nearly 20% of children by the age of 18) and very treatable.
Drug and alcohol abuse may be associated with another psychiatric illness or can be independent problems that interfere with the healthy development and school performance of young people, including middle school students. Find out if your patients are drinking alcohol, using marijuana, vaping, utilizing prescription medications that are not their own, or using other illegal drugs. Substance use that has led to problems at school is by definition a problem (in addition to being illegal) and will not improve without treatment. These young people need a full psychiatric evaluation, and they and their parents require specialized treatment and support to address the substance abuse problem.
Of course, school failure may represent other sources of stress. It is critical to find out from your patients if they feel safe at school. Are they being bullied or threatened? Do they have a safe way to get to and from school? Has something else occurred at the school that has left them feeling vigilant and unable to concentrate on classwork? While bullying or living in a neighborhood plagued by violence may not be easy problems to fix, it is critical to find out about them so the adults – parents, teachers, and others – can provide the students with support while directly addressing the safety issue. Do not fail to find out if the fear is at home. Children who are managing physical or sexual abuse may be too stressed to complete homework or even attend school. A caring, curious pediatrician will be a lifeline to a safer future for these children.
Similarly, it is important to find out if your patient is managing less dramatic stresses at home. Perhaps a parent has been seriously ill, working two jobs, or managing a problem with drugs or alcohol, and your patient is caring for that person, or for siblings, instead of keeping up with schoolwork. Perhaps there has been a stressful loss or transition, such as the death of a grandparent or pet, the loss of a job, or a big move, or family discord/violence that has made it difficult for your patient to focus on homework or interfered with parental supervision or homework help. Perhaps your patient has gotten a job to help the family financially and has no time for homework. Bringing such a challenge out into the open and rallying support for your patient and the family in these circumstances is often enough to foster adaptation to these stresses and a return to healthy function in school.
Finally, it is possible that school failure is a function of milder imbalances in a young person’s life. Some children may respond to the expanded independence of adolescence by making poor choices. When do they go to bed at night? Are they staying up late playing video games or surfing the web? Not all insomnia represents illness. Find out how much independence your patients have and how they are managing their time and responsibilities. Help them to think about how to protect time for both responsibilities and relaxation. You also may help the parents of these young people think about how to set expectations and basic rules while stepping back appropriately to allow for expanding independence in ways that will help their children to flourish.
Once defined, Setting reasonable expectations, curriculum adjustments, any needed psychiatric treatment, building on a child’s strengths, and paying attention to self-esteem are the hallmarks of effective interventions.
Dr. Swick is an attending psychiatrist in the division of child psychiatry at Massachusetts General Hospital, Boston, and director of the Parenting at a Challenging Time (PACT) Program at the Vernon Cancer Center at Newton Wellesley Hospital, also in Boston. Dr. Jellinek is professor emeritus of psychiatry and pediatrics, Harvard Medical School, Boston. Email them at [email protected].

ADHD in the long term
Parents whose kids are diagnosed with ADHD face important questions about what to expect in the long term and how that might inform treatment. Studies find that ADHD diagnosed in childhood tends to persist in up to 65% of adolescents (some estimates are lower depending on criteria used),1 and about 50% of people are estimated to continue to meet criteria for ADHD as adults.2 Many studies have attempted to understand what long-term risks are associated with ADHD, as well as the factors that help better predict which characteristics in childhood might predict those risks. A recent article was published on a cohort of boys followed over 33 years.3 This, as well as other large prospective studies, such as the Multimodal Treatment of ADHD (MTA) provide us with helpful long-range data that inform this article.4-6 This article reviews risks in adolescence and adulthood and the factors thought to be associated with them.

What predicts persistence of ADHD symptoms in adolescence?
Several factors emerge consistently, including higher symptom severity, comorbid conduct disorder, and lower childhood IQ; other findings include family-related factors, such as lower parental mental health, less-positive parenting, and lower rates of parental education. In general, hyperactivity and impulsivity wanes, while inattention symptoms remain more stable.
What does ADHD predict for adolescents?
Adolescents with ADHD are more than twice as likely to be involved in pregnancies under the age of 18 years, true for both male and female genders.7 This finding also is associated with increased substance use and low academic achievement but not completely explained by it. Adolescents with persistent ADHD symptoms experience poorer educational success than do kids without ADHD symptoms, according to teacher reports of performance and measurements of grade point average. They are more likely to repeat a grade.8 Related but independent is the relationship of substance use disorders in kids with ADHD. Adolescents with ADHD are more likely to use nicotine or marijuana or meet criteria for any substance use disorder than adolescents without ADHD. Finally, adolescents aged 12-18 years with ADHD are at higher risk for motor vehicle accidents and all types of accidental injuries.9
What predicts persistence of ADHD symptoms in adulthood?
A follow-up study of the MTA trial 16 years later looked at ADHD diagnosed before age 12 years and the association with symptom persistence in adulthood, defined by the DSM-5 cutoff criteria of five symptoms. The following factors related to symptom persistence: childhood psychiatric comorbidity, higher ADHD symptom severity, and parental mental health problems. Notably, family socioeconomic status, child IQ, and parental education were not associated. In addition to looking at symptom persistence, other studies have looked at predictors of functional impairment in adulthood following a childhood ADHD diagnosis (independent of whether people continue to meet criteria for the disorder). The main findings that seem consistently related to all functional outcomes, including social, occupational, and educational, are lower childhood IQ and history of conduct problems (in the absence of meeting criteria for full childhood conduct disorder). Educational family-related factors, such as socioeconomic status and lower parental education, were related to lower educational functioning only.
What does ADHD predict for adults?
It appears that overall, adults who were diagnosed with ADHD as children show poorer functional outcomes than did those who weren’t, and there is a step-wise relationship when considering adults whose symptoms persist, with more severe outcomes compared with adults whose symptoms have desisted, who in turn have worse outcomes than adults who were never diagnosed with ADHD. Educational attainments follow this pattern with the highest average levels of education in the non-ADHD group and the lowest average years in the group with persistent symptoms. Occupational success and percent receiving public assistance again separated between each group, with the symptom persisters faring the worst, the symptom desisters better, and those never affected by ADHD, the best. In terms of emotional disorders, it was only the symptom persisters who suffered from higher rates of mood and anxiety disorders. Similarly, only the symptom persisters had significantly more marijuana use disorders. No other substance use disorders or legal outcomes were significant.
How does this affect how we approach treatment?
Clinicians and researchers who specialize in ADHD have been arguing for ADHD to be treated as more of a chronic disease and for impairment to be the focus of treatment, rather than simply symptom control.10 With what we know about long-term functional impairment, there is reason to consider a more holistic picture of a child or an adolescent and how they are functioning in their academic, emotional, and social domains. A meta-analysis of treatment and long-term outcomes suggests that psychostimulant treatment, psychotherapy treatment, and combined treatment all improve long-term functioning, especially self-esteem, social functioning, and academic functioning, with combined psychotherapeutic and pharmacologic treatments associated with the highest effect sizes.11

For those who treat ADHD, it is our job to provide education to families about the chronic risks associated with the diagnosis, and the importance of offering multimodal therapy that can address family factors that might be contributing to risks, as well as the child’s overall well-being. If we are to make sense of how adults may experience impairment even in the absence of ongoing symptoms, we might look at how their overall wellness was interrupted during development. Maybe they fell into a different crowd of kids? Maybe they stopped achieving at school in a way that changed the achievement trajectory they were on? Maybe they impulsively picked up substances or got in trouble with the law? These events can have lasting impacts on well-being. We must use medicine and psychotherapy to help with symptoms, but we must look beyond treating illness and use evidence-based strategies to promote wellness at the level of the entire family.
Dr. Guth is an assistant professor in the department of psychiatry at the University of Vermont Medical Center and the University of Vermont, both in Burlington. She works with children and adolescents as well as women in the perinatal period. She has no relevant financial disclosures.
References
1. Psychol Med. 2006 Feb;36(2):159-65.
2. J Am Acad Child Adolesc Psychiatry. 2016 Nov;55(11):937-44.e4.
3. J Am Acad Child Adolesc Psychiatry. 2018 Aug;57(8):571-82.e1.
4. J Am Acad Child Adolesc Psychiatry. 2017 Aug;56(8):687-95.e7.
5. J Am Acad Child Adolesc Psychiatry. 2016 Nov;55(11):945-52.e2.
6. J Am Acad Child Adolesc Psychiatry. 2009 May;48(5):484-500.
7. J Atten Disord. 2017 Sep 1:1087054717730610. doi: 10.1177/1087054717730610.
8. J Atten Disord. 2016 May;20(5):383-9.
9. Eur Child Adolesc Psychiatry. 2014 Feb;23(2):95-102.
10. JAMA Pediatr. 2018 Aug 13. doi: 10.1001/jamapediatrics.2018.1642.
11. PLoS One. 2015 Feb 25;10(2):e0116407.
Parents whose kids are diagnosed with ADHD face important questions about what to expect in the long term and how that might inform treatment. Studies find that ADHD diagnosed in childhood tends to persist in up to 65% of adolescents (some estimates are lower depending on criteria used),1 and about 50% of people are estimated to continue to meet criteria for ADHD as adults.2 Many studies have attempted to understand what long-term risks are associated with ADHD, as well as the factors that help better predict which characteristics in childhood might predict those risks. A recent article was published on a cohort of boys followed over 33 years.3 This, as well as other large prospective studies, such as the Multimodal Treatment of ADHD (MTA) provide us with helpful long-range data that inform this article.4-6 This article reviews risks in adolescence and adulthood and the factors thought to be associated with them.
What predicts persistence of ADHD symptoms in adolescence?
Several factors emerge consistently, including higher symptom severity, comorbid conduct disorder, and lower childhood IQ; other findings include family-related factors, such as lower parental mental health, less-positive parenting, and lower rates of parental education. In general, hyperactivity and impulsivity wanes, while inattention symptoms remain more stable.
What does ADHD predict for adolescents?
Adolescents with ADHD are more than twice as likely to be involved in pregnancies under the age of 18 years, true for both male and female genders.7 This finding also is associated with increased substance use and low academic achievement but not completely explained by it. Adolescents with persistent ADHD symptoms experience poorer educational success than do kids without ADHD symptoms, according to teacher reports of performance and measurements of grade point average. They are more likely to repeat a grade.8 Related but independent is the relationship of substance use disorders in kids with ADHD. Adolescents with ADHD are more likely to use nicotine or marijuana or meet criteria for any substance use disorder than adolescents without ADHD. Finally, adolescents aged 12-18 years with ADHD are at higher risk for motor vehicle accidents and all types of accidental injuries.9
What predicts persistence of ADHD symptoms in adulthood?
A follow-up study of the MTA trial 16 years later looked at ADHD diagnosed before age 12 years and the association with symptom persistence in adulthood, defined by the DSM-5 cutoff criteria of five symptoms. The following factors related to symptom persistence: childhood psychiatric comorbidity, higher ADHD symptom severity, and parental mental health problems. Notably, family socioeconomic status, child IQ, and parental education were not associated. In addition to looking at symptom persistence, other studies have looked at predictors of functional impairment in adulthood following a childhood ADHD diagnosis (independent of whether people continue to meet criteria for the disorder). The main findings that seem consistently related to all functional outcomes, including social, occupational, and educational, are lower childhood IQ and history of conduct problems (in the absence of meeting criteria for full childhood conduct disorder). Educational family-related factors, such as socioeconomic status and lower parental education, were related to lower educational functioning only.
What does ADHD predict for adults?
It appears that overall, adults who were diagnosed with ADHD as children show poorer functional outcomes than did those who weren’t, and there is a step-wise relationship when considering adults whose symptoms persist, with more severe outcomes compared with adults whose symptoms have desisted, who in turn have worse outcomes than adults who were never diagnosed with ADHD. Educational attainments follow this pattern with the highest average levels of education in the non-ADHD group and the lowest average years in the group with persistent symptoms. Occupational success and percent receiving public assistance again separated between each group, with the symptom persisters faring the worst, the symptom desisters better, and those never affected by ADHD, the best. In terms of emotional disorders, it was only the symptom persisters who suffered from higher rates of mood and anxiety disorders. Similarly, only the symptom persisters had significantly more marijuana use disorders. No other substance use disorders or legal outcomes were significant.
How does this affect how we approach treatment?
Clinicians and researchers who specialize in ADHD have been arguing for ADHD to be treated as more of a chronic disease and for impairment to be the focus of treatment, rather than simply symptom control.10 With what we know about long-term functional impairment, there is reason to consider a more holistic picture of a child or an adolescent and how they are functioning in their academic, emotional, and social domains. A meta-analysis of treatment and long-term outcomes suggests that psychostimulant treatment, psychotherapy treatment, and combined treatment all improve long-term functioning, especially self-esteem, social functioning, and academic functioning, with combined psychotherapeutic and pharmacologic treatments associated with the highest effect sizes.11
For those who treat ADHD, it is our job to provide education to families about the chronic risks associated with the diagnosis, and the importance of offering multimodal therapy that can address family factors that might be contributing to risks, as well as the child’s overall well-being. If we are to make sense of how adults may experience impairment even in the absence of ongoing symptoms, we might look at how their overall wellness was interrupted during development. Maybe they fell into a different crowd of kids? Maybe they stopped achieving at school in a way that changed the achievement trajectory they were on? Maybe they impulsively picked up substances or got in trouble with the law? These events can have lasting impacts on well-being. We must use medicine and psychotherapy to help with symptoms, but we must look beyond treating illness and use evidence-based strategies to promote wellness at the level of the entire family.
Dr. Guth is an assistant professor in the department of psychiatry at the University of Vermont Medical Center and the University of Vermont, both in Burlington. She works with children and adolescents as well as women in the perinatal period. She has no relevant financial disclosures.
References
1. Psychol Med. 2006 Feb;36(2):159-65.
2. J Am Acad Child Adolesc Psychiatry. 2016 Nov;55(11):937-44.e4.
3. J Am Acad Child Adolesc Psychiatry. 2018 Aug;57(8):571-82.e1.
4. J Am Acad Child Adolesc Psychiatry. 2017 Aug;56(8):687-95.e7.
5. J Am Acad Child Adolesc Psychiatry. 2016 Nov;55(11):945-52.e2.
6. J Am Acad Child Adolesc Psychiatry. 2009 May;48(5):484-500.
7. J Atten Disord. 2017 Sep 1:1087054717730610. doi: 10.1177/1087054717730610.
8. J Atten Disord. 2016 May;20(5):383-9.
9. Eur Child Adolesc Psychiatry. 2014 Feb;23(2):95-102.
10. JAMA Pediatr. 2018 Aug 13. doi: 10.1001/jamapediatrics.2018.1642.
11. PLoS One. 2015 Feb 25;10(2):e0116407.