User login
Radiofrequency Microtenotomy for Elbow Epicondylitis: Midterm Results
Elbow epicondylitis is a painful condition caused by overuse and development of tendon degeneration. It is one of the most common elbow problems in adults, occurring both laterally and medially. “Tennis elbow” or lateral epicondylitis is diagnosed 7 to 10 times more often than the medial form, “golfer’s elbow.”1 Although these injuries are often associated with racquet sports, activities such as bowling and weightlifting and the professions of carpentry, plumbing, and meat-cutting have been described as causes.2,3
Elbow epicondylitis is thought to be the result of multiple microtraumatic events that cause disruption of the internal structure of the tendon and degeneration of the cells and matrix.4 Lesions caused by chronic overuse are now commonly called tendinosis and are not considered inflammatory in nature. Although the term tendinitis is used frequently and indiscriminately, histopathologic studies have shown that specimens of tendon obtained from areas of chronic overuse do not contain large numbers of macrophages, lymphocytes, or neutrophils.5 Rather, tendinosis appears to be a degenerative process that is characterized by the presence of dense populations of fibroblasts, vascular hyperplasia, and disorganized collagen. This constellation of findings has been termed by some authors as angiofibroblastic hyperplasia.6
Conservative care for the treatment of chronic tendinosis has been well described and is often successful. Treatment consists of rest, ice, compression, and elevation in the acute phase. This can be followed with bracing, activity modification, physical therapy, oral nonsteroidal anti-inflammatory drugs, topical applications, and injections of cortisone or platelet-rich plasma. When conservative treatment fails, surgical intervention may be considered. Procedures for the treatment of lateral epicondylitis include open débridement and release, arthroscopic débridement, percutaneous release, and radiofrequency (RF) coblation. The goals of operative treatment are to resect pathological material, to stimulate neovascularization by producing focused local bleeding, and to create a healthy scar while doing the least possible structural damage to surrounding tissues.4
The efficacy of a bipolar RF-based approach for using microtenotomy was first recognized when researchers studied the effects of transmyocardial revascularization for treating congestive heart failure.7 The use of RF- and laser-based transmyocardial revascularization initiated an angiogenic response in degenerated (ischemic) heart tissue. This success led to investigating the use of a RF-based approach for performing microtenotomy. Preclinical studies demonstrated that RF-based microtenotomy was effective for stimulating an angiogenic-healing response in tendon tissue.8 Histologic evaluation of treated tendons showed an early inflammatory response, with new blood-vessel formation by 28 days. In 2005, short-term results of this technique were published.9 This preliminary prospective case series showed that the treatment was safe and effectively improved or eliminated clinical symptoms.9 In the present midterm study, we hypothesized that pain scores would improve after RF microtenotomy and that these favorable results would continue to be observed over a longer term postoperatively.
Materials and Methods
Patients
This was a prospective, nonrandomized, single-center clinical study. After receiving institutional review board approval, patients who were 18 to 65 years of age with a diagnosis of tendinosis were approached for enrollment. For inclusion, patients had to be symptomatic for at least 6 months and had to have failed extensive conservative treatments. Nonoperative treatment included activity modification, enrollment in a facility- or home-based exercise program, bracing, oral nonsteroidal anti-inflammatory medication, and cortisone injection. Candidates with diabetes, confirmed or suspected pregnancy, surgery in the same tendon, implanted hardware adjacent to the target treatment region, or who were receiving care under workers’ compensation or had litigation-related injury were excluded. A single clinician performed a thorough medical history and clinical evaluation. The clinical follow-up and data collection were performed by an independent medical technician.
Clinical Outcomes
Pain status was assessed by using a visual analog scale (VAS). Postoperative clinical assessment was conducted within the first 2 days; at 7 to 10 days; at 4 to 6 weeks; and at 3, 6, 12, and 24 months, up to 9 years postoperatively. The VAS scales were completed annually up to 9 years after the procedure.
The percent improvement of VAS score was calculated. This value represented the difference between the patient’s preoperative and most recent VAS assessments. Failure of the procedure was defined as less than 50% improvement of the VAS score.
The RF-Based Microtenotomy Device
The Topaz Microdebrider (ArthroCare), connected to a System 2000 generator at setting 4 (175 V-RMS), was used to perform the RF-based microtenotomy. The device uses a controlled plasma-mediated RF-based process (coblation). Radiofrequency energy is used to excite the electrolytes in a conductive medium, such as a saline solution, to create precisely focused plasma. The energized particles in the plasma have sufficient energy to break molecular bonds,10,11 excising or dissolving (ie, ablating) soft tissue at relatively low temperatures (typically, 40°-70° C).12,13 The diameter of the active tip of the Topaz device is 0.8 mm.
Surgical Procedure
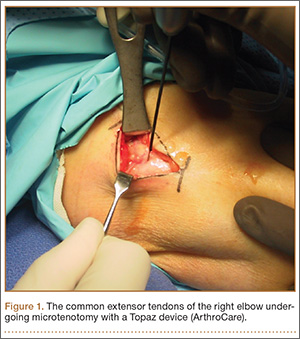
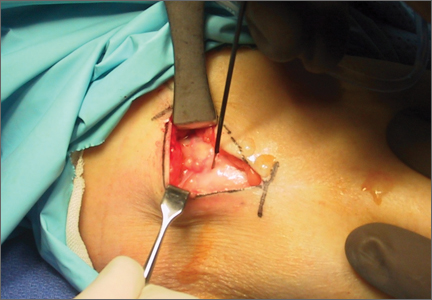
The senior author performed the majority of procedures in this study. Near the end of the series, the senior author’s associate also performed procedures. The symptomatic area of the tendon was identified and marked while the patient was alert. After the patient was positioned appropriately, light sedation was administered. A tourniquet was placed over the treatment limb and inflated to 250 mm Hg. A small incision, approximately 3 cm in length, was made over the marked treatment site to expose the involved tendon. After initiating sterile isotonic saline flow of 1 drop every 1 to 2 seconds from a line connected to the RF system, the tip of the device was placed on the tendon perpendicular to its surface (Figure 1). Using a light touch, it was activated for 500 milliseconds using a timer accessory for the control box. Five to 8 grams of pressure were applied with the device to penetrate the tendon and achieve successful ablation. The RF applications were performed at 5-mm intervals, to create a grid-like pattern on and throughout the symptomatic tendon area. The tendon was perforated to a depth of several millimeters on every second or third application throughout the treatment grid. After treatment of the symptomatic area, the wound was irrigated with copious amounts of normal saline solution and closed with interrupted nylon suture. Local anesthetic was injected only in the skin and in subcutaneous tissue. Standard wound dressings were applied. In the immediate postoperative period, the patient was advised to begin gentle active and passive range-of-motion exercises. Each patient was evaluated at 1 week postoperatively. At 6 weeks, patients were permitted to increase the intensity of their activities. Return to sports and heavy lifting was allowed once the patient was asymptomatic and had achieved full strength and range of motion; this typically occurred at 6 to 9 weeks after surgery.
Statistical Analysis
Normally distributed data were described using standard parametric statistics (ie, mean and standard deviation); non-normally distributed data were characterized using nonparametric descriptors (ie, median and quartiles). Statistical evaluation of improvement in pain status was performed by calculating 99% confidence intervals and using the Student t test for change between subsequent time points. Use of confidence intervals provides a descriptive analysis of the observed treatment effect, while permitting determination of statistical relevance. In all statistical testing, confidence bounds not including 0 were considered statistically significant. Probability of P ≤ .01 for committing type I experiment-wise error (rejecting a true null hypothesis) was selected for all statistical testing because of our lack of a control group, small sample size, and evaluation of multiple postoperative time points.
Results
Eighty consecutive patients with tendinosis of the elbow were included in this study. Sixty-nine patients were treated for lateral epicondylitis and 11 for medial epicondylitis. The average age of the patients (33 women, 47 men) was 50 years. The duration of follow-up evaluation ranged from 6 months to 9 years (mean, 2.5 years; median, 2 years). The Table presents the VAS improvement for these patients after the RF microtenotomy.
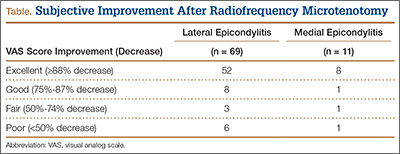
Within the lateral epicondylitis group, 91% (63/69) of the patients reported a successful outcome. The postoperative VAS improved to 1.3 from 6.9, which demonstrated an 81% improvement. Of the 6 patients that did not improve, 2 underwent repeat surgery.
Among the patients treated for medial epicondylitis, 91% (10/11) reported improvement in symptoms. The postoperative VAS improved to 1.3 from 6.1, a 79% improvement. One patient did not improve and did not undergo repeat surgery.
Discussion
For the treatment of medial and lateral elbow epicondylitis, RF microtenotomy is successful in 91% of patients. Symptomatic improvement was observed up to 9 years postoperatively. During this study, no complications were recorded; 7 treatment failures occurred. When compared with other techniques, the results with RF microtenotomy are equivalent or better.
In a retrospective study, Szabo and colleagues14 compared open, arthroscopic, and percutaneous release for lateral elbow tendinosis. They found the 3 methods to be highly effective for the treatment of tendinosis with no significant difference between them. Resection of the epicondyle and transfer of the anconeus muscle was found to be effective (94%) in a retrospective study by Almquist and colleagues.15 Dunn and coauthors16 reported a 97% success rate at 10 to 14 years postoperatively with a mini-open technique. Rubenthaler and colleagues17 showed 88% effectiveness for the open technique and 93% for the arthroscopic technique. With arthroscopic release of the extensor carpi radialis brevis tendon, Lattermann and coauthors18 reported clinical improvement in 94% of patients. In a study by Rose and colleagues,19 denervation of the lateral epicondyle was effective in relieving pain in 80% of patients who had had a positive response to a local anesthetic block. In a recently published study by Koh and coauthors,20 19 of 20 patients experienced a favorable outcome after treatment with ultrasonic microresection.
Regardless of surgical methods and their reported success rate, complications are associated with elbow surgery. Postoperative problems may include restricted function, elbow instability, persistent muscle weakness, and painful neuroma of the posterior cutaneous nerve.10,21,22 The recent introduction of arthroscopic release offers the potential for less morbidity and enables visualization of the elbow joint. However, disadvantages of the arthroscopic approach include violation of the joint for extra-articular pathology, increased operative time and cost, and neurovascular complications. Additionally, it is possible that the entire spectrum of extra-articular tendinosis cannot be effectively identified arthroscopically.23 In a prospective, randomized study, Meknas and colleagues24 compared RF microtenotomy with extensor tendon release and repair. They showed that patients treated with RF-microtenotomy experienced earlier pain relief and improved grip strength over the release group.
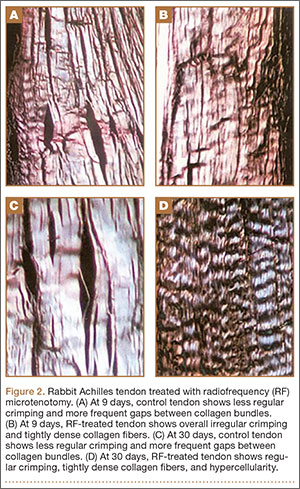
Different proposed mechanisms of action have been described to explain the favorable effects of the RF-based microtenotomy procedure, such as induced healing by an angiogenic response in the tendon tissue. In an animal study, Harwood and colleagues8 showed that low-dose RF-based plasma microtenotomy has the ability to stimulate angiogenic growth factors in tendons, such as αv integrin and vascular endothelial growth factor. These factors have been shown to be associated with healing.8 Early inflammatory response with new-vessel formation after 28 days was found in another animal study using the same method.25 Evaluation of RF-based methods in a prospective controlled laboratory study using a rabbit-tendon model showed histologic evidence of early inflammation with development of neovasculature after treatment.8 A later histologic study using an aged Achilles rabbit tendon model was performed to evaluate the effect of RF-based plasma microtenotomy on collagen remodeling.25 The degenerated tendon showed gaps, few normal crimpings, and a lack of reflectivity under polarized light. At 9 days after treatment, the treated tendon showed localized irregular crimpings, and, at 30 days, it showed regular crimping, tightly dense collagen fibers, and hypercellularity with good reflectivity. This was similar in appearance to a normal nondegenerated tendon (Figures 2A-2D). The RF-treated tendon also demonstrated an increase in production of insulin-like growth factor-1, β-fibroblast growth factor-1, αv integrin, and vascular endothelial growth factor.
Pathologic nerve ingrowth or nerve irritation in the tendon substance has been considered a possible cause of the pain experienced with tendinosis. Radiofrequency treatment has been shown to induce acute degeneration and ablation of sensory nerve fibers.26 These degenerated nerve fibers were observed to regenerate at 90 days after treatment.27 These findings provide potential evidence for early pain relief that is maintained long term as the nerves regenerate.
This midterm follow-up of patients with elbow epicondylitis has shown that RF-based microtenotomy can produce successful, durable results. Microtenotomy is a technically simple procedure to perform and is associated with a rapid and uncomplicated recovery. It is safe and can effectively eliminate or markedly reduce clinical symptoms.
Limitations
Lateral epicondylitis has been described as a self-limited disease, with resolution of symptoms at 12 to 18 months with conservative treatment. This perspective challenges the indication of any proposed surgical treatment for the condition. Although the results of this research demonstrated the benefits of RF microtenotomy, there are inherent limitations of the study design. The study lacks a control group, and randomization would improve the strength of the study. Additional outcome measures, such as Disabilities of the Arm, Shoulder, and Hand score, and grip strength could complement pain scores to provide more data. These data were collected in a preliminary study.9 Postoperative histologic analysis of treated human tissue would be ideal, but ethical considerations limit study to animal models. An additional limitation is potential examiner bias. Data collection was performed by an independent medical technician; a third-party blinded evaluation could have been performed, but this was not feasible in a clinical setting.
Conclusion
Radiofrequency-based microtenotomy is a safe and effective procedure for elbow epicondylitis. The results are durable with successful outcomes observed 9 years after surgery.
1. Leach RE, Miller JK. Lateral and medial epicondylitis of the elbow. Clin Sports Med. 1987;6(2):259-272.
2. Vangsness CT Jr, Jobe FW. Surgical technique of medial epicondylitis: Results in 35 elbows. J Bone Joint Surg Br. 1991;73(3):409-411.
3. Galloway M, DeMaio M, Mangine R. Rehabilitative techniques in the treatment of medial and lateral epicondylitis. Orthopedics. 1992;15(9):1089-1096.
4. Kraushaar BS, Nirschl RP. Tendinosis of the elbow (tennis elbow). Clinical features and findings of histological, immunohistochemical, and electron microscopy studies. J Bone Joint Surg Am. 1999;81(2):259-278.
5. Leadbetter WB. Cell-matrix response in tendon injury. Clin Sports Med. 1992;11(3):533-578.
6. Nirschl RP. Tennis elbow tendinosis: pathoanatomy, nonsurgical and surgical management. In: Fine LJ, ed. Repetitive Motion Disorders of the Upper Extremity. Rosemont, IL: American Academy of Orthopaedic Surgeons; 1995:467-479.
7. Chu V, Kuang J, Aiaid A, Korkola S, Chiu RC. Angiogenic response induced by mechanical transmyocardial revascularization. J Thorac Cardiovasc Surg 1999;118:849-856.
8. Harwood R, Bowden K, Amiel M, Tasto JP, Amiel D. Structural and angiogenic response to bipolar radiofrequency treatment of normal rabbit achilles tendon: a potential application to the treatment of tendinosis. Trans Orthop Res Soc. 2003;28:819.
9. Tasto JP, Cummings J, Medlock V, Hardesty R, Amiel D. Microtenotomy using a radiofrequency probe to treat lateral epicondylitis. Arthroscopy. 2005;21(7):851-860.
10. Woloszko J, Stalder KR, Brown IG. Plasma characteristics of repetitively-pulsed electrical discharges in saline solutions used for surgical procedures. IEEE Trans Plasma Sci. 2002;30:1376-1383.
11. Stalder KR, Woloszko J, Brown IG, Smith CD. Repetitive plasma discharges in saline solutions. Appl Phys Lett. 2001;79:4503-4505.
12. Woloszko J, Gilbride C. Coblation technology (plasma mediated ablation for otolaryngology applications). Proc SPIE. 2000;3907:306–316.
13. Woloszko J, Kwende MM, Stalder KR. Coblation in otolaryngology. Proc SPIE. 2003;4949:341–352.
14. Szabo SJ, Savoie FH 3rd, Field LD, Ramsey JR, Hosemann CD. Tendinosis of the extensor carpi radialis brevis: an evaluation of three methods of operative treatment. J Shoulder Elbow Surg Am. 2006;15(6):721-727.
15. Almquist EE, Necking L, Bach AW. Epicondylar resection with anconeus transfer for chronic lateral epicondylitis. J Hand Surg Am. 1998;23(4):723-731.
16. Dunn JH, Kim JJ, Davis L, Nirschl RP. Ten- to 14-year follow-up of the Nirschl surgical technique for lateral epicondylitis. Am J Sports Med. 2008;36(2):261-266.
17. Rubenthaler F, Wiese M, Senge A, Keller L, Wittenberg RH. Long-term follow-up of open and endoscopic Hohmann procedures for lateral epicondylitis. Arthroscopy. 2005;21(6):684-690.
18. Lattermann C, Romeo AA, Anbari A, et al. Arthroscopic debridement of the extensor carpi radialis brevis for the treatment of recalcitrant lateral epicondylitis. J Shoulder Elbow Surg. 2010;19(5):651-656.
19. Rose NE, Forman SK, Dellon AL. Denervation of the lateral epicondyle for treatment of chronic lateral epicondylitis. J Hand Surg Am. 2013;38(2):344-349.
20. Koh JS, Mohan PC, Howe TS, et al. Fasciotomy and surgical tenotomy for recalcitrant lateral elbow tendonopathy: early clinical experience with a novel device for minimally invasive percutaneous microresection. Am J Sports Med. 2013;41(3):636-644.
21. Nirschl RP, Ashman ES. Elbow tendonopathy: tennis elbow. Clin Sports Med. 2003;22(4):813-836.
22. Dellon AL, Kim J, Ducic I. Painful neuroma of the posterior cutaneous nerve of the forearm after surgery for lateral humeral epicondylitis. J Hand Surg Am. 2004;29(3):387-390.
23. Cummins CA. Lateral epicondylitis: in-vivo assessment of arthroscopic debridement and correlation with patient outcomes. Am J Sports Med. 2006;34(9):1486-1491.
24. Meknas K, Odden-Miland A, Mercer JB, Castillejo M, Johansen O. Radiofrequency microtenotomy: a promising method for treatment of recalcitrant lateral epicondylitis. Am J Sports Med. 2008;36(10):1960-1965.
25. Takahashi N, Tasto JP, Locke J, et al. The use of radiofrequency (RF) for the treatment of chronic tendinosis. Paper presented at: 6th Biennial Congress of the International Society of Arthroscopy, Knee Surgery, and Orthopaedic Sports Medicine Congress; May 2007; Florence, Italy. Abstract 1433.
26. Takahashi N, Tasto JP, Ritter M, et al. Pain relief through an antinociceptive effect after radiofrequency application. Am J Sports Med. 2007;35(5):805-810.
27. Ochiai N, Tasto JP, Ohtori S, Takahashi N, Moriya H, Amiel D. Nerve regeneration after radiofrequency ablation. Am J Sports Med. 2007;35(11):1940-1944.
Elbow epicondylitis is a painful condition caused by overuse and development of tendon degeneration. It is one of the most common elbow problems in adults, occurring both laterally and medially. “Tennis elbow” or lateral epicondylitis is diagnosed 7 to 10 times more often than the medial form, “golfer’s elbow.”1 Although these injuries are often associated with racquet sports, activities such as bowling and weightlifting and the professions of carpentry, plumbing, and meat-cutting have been described as causes.2,3
Elbow epicondylitis is thought to be the result of multiple microtraumatic events that cause disruption of the internal structure of the tendon and degeneration of the cells and matrix.4 Lesions caused by chronic overuse are now commonly called tendinosis and are not considered inflammatory in nature. Although the term tendinitis is used frequently and indiscriminately, histopathologic studies have shown that specimens of tendon obtained from areas of chronic overuse do not contain large numbers of macrophages, lymphocytes, or neutrophils.5 Rather, tendinosis appears to be a degenerative process that is characterized by the presence of dense populations of fibroblasts, vascular hyperplasia, and disorganized collagen. This constellation of findings has been termed by some authors as angiofibroblastic hyperplasia.6
Conservative care for the treatment of chronic tendinosis has been well described and is often successful. Treatment consists of rest, ice, compression, and elevation in the acute phase. This can be followed with bracing, activity modification, physical therapy, oral nonsteroidal anti-inflammatory drugs, topical applications, and injections of cortisone or platelet-rich plasma. When conservative treatment fails, surgical intervention may be considered. Procedures for the treatment of lateral epicondylitis include open débridement and release, arthroscopic débridement, percutaneous release, and radiofrequency (RF) coblation. The goals of operative treatment are to resect pathological material, to stimulate neovascularization by producing focused local bleeding, and to create a healthy scar while doing the least possible structural damage to surrounding tissues.4
The efficacy of a bipolar RF-based approach for using microtenotomy was first recognized when researchers studied the effects of transmyocardial revascularization for treating congestive heart failure.7 The use of RF- and laser-based transmyocardial revascularization initiated an angiogenic response in degenerated (ischemic) heart tissue. This success led to investigating the use of a RF-based approach for performing microtenotomy. Preclinical studies demonstrated that RF-based microtenotomy was effective for stimulating an angiogenic-healing response in tendon tissue.8 Histologic evaluation of treated tendons showed an early inflammatory response, with new blood-vessel formation by 28 days. In 2005, short-term results of this technique were published.9 This preliminary prospective case series showed that the treatment was safe and effectively improved or eliminated clinical symptoms.9 In the present midterm study, we hypothesized that pain scores would improve after RF microtenotomy and that these favorable results would continue to be observed over a longer term postoperatively.
Materials and Methods
Patients
This was a prospective, nonrandomized, single-center clinical study. After receiving institutional review board approval, patients who were 18 to 65 years of age with a diagnosis of tendinosis were approached for enrollment. For inclusion, patients had to be symptomatic for at least 6 months and had to have failed extensive conservative treatments. Nonoperative treatment included activity modification, enrollment in a facility- or home-based exercise program, bracing, oral nonsteroidal anti-inflammatory medication, and cortisone injection. Candidates with diabetes, confirmed or suspected pregnancy, surgery in the same tendon, implanted hardware adjacent to the target treatment region, or who were receiving care under workers’ compensation or had litigation-related injury were excluded. A single clinician performed a thorough medical history and clinical evaluation. The clinical follow-up and data collection were performed by an independent medical technician.
Clinical Outcomes
Pain status was assessed by using a visual analog scale (VAS). Postoperative clinical assessment was conducted within the first 2 days; at 7 to 10 days; at 4 to 6 weeks; and at 3, 6, 12, and 24 months, up to 9 years postoperatively. The VAS scales were completed annually up to 9 years after the procedure.
The percent improvement of VAS score was calculated. This value represented the difference between the patient’s preoperative and most recent VAS assessments. Failure of the procedure was defined as less than 50% improvement of the VAS score.
The RF-Based Microtenotomy Device
The Topaz Microdebrider (ArthroCare), connected to a System 2000 generator at setting 4 (175 V-RMS), was used to perform the RF-based microtenotomy. The device uses a controlled plasma-mediated RF-based process (coblation). Radiofrequency energy is used to excite the electrolytes in a conductive medium, such as a saline solution, to create precisely focused plasma. The energized particles in the plasma have sufficient energy to break molecular bonds,10,11 excising or dissolving (ie, ablating) soft tissue at relatively low temperatures (typically, 40°-70° C).12,13 The diameter of the active tip of the Topaz device is 0.8 mm.
Surgical Procedure
The senior author performed the majority of procedures in this study. Near the end of the series, the senior author’s associate also performed procedures. The symptomatic area of the tendon was identified and marked while the patient was alert. After the patient was positioned appropriately, light sedation was administered. A tourniquet was placed over the treatment limb and inflated to 250 mm Hg. A small incision, approximately 3 cm in length, was made over the marked treatment site to expose the involved tendon. After initiating sterile isotonic saline flow of 1 drop every 1 to 2 seconds from a line connected to the RF system, the tip of the device was placed on the tendon perpendicular to its surface (Figure 1). Using a light touch, it was activated for 500 milliseconds using a timer accessory for the control box. Five to 8 grams of pressure were applied with the device to penetrate the tendon and achieve successful ablation. The RF applications were performed at 5-mm intervals, to create a grid-like pattern on and throughout the symptomatic tendon area. The tendon was perforated to a depth of several millimeters on every second or third application throughout the treatment grid. After treatment of the symptomatic area, the wound was irrigated with copious amounts of normal saline solution and closed with interrupted nylon suture. Local anesthetic was injected only in the skin and in subcutaneous tissue. Standard wound dressings were applied. In the immediate postoperative period, the patient was advised to begin gentle active and passive range-of-motion exercises. Each patient was evaluated at 1 week postoperatively. At 6 weeks, patients were permitted to increase the intensity of their activities. Return to sports and heavy lifting was allowed once the patient was asymptomatic and had achieved full strength and range of motion; this typically occurred at 6 to 9 weeks after surgery.
Statistical Analysis
Normally distributed data were described using standard parametric statistics (ie, mean and standard deviation); non-normally distributed data were characterized using nonparametric descriptors (ie, median and quartiles). Statistical evaluation of improvement in pain status was performed by calculating 99% confidence intervals and using the Student t test for change between subsequent time points. Use of confidence intervals provides a descriptive analysis of the observed treatment effect, while permitting determination of statistical relevance. In all statistical testing, confidence bounds not including 0 were considered statistically significant. Probability of P ≤ .01 for committing type I experiment-wise error (rejecting a true null hypothesis) was selected for all statistical testing because of our lack of a control group, small sample size, and evaluation of multiple postoperative time points.
Results
Eighty consecutive patients with tendinosis of the elbow were included in this study. Sixty-nine patients were treated for lateral epicondylitis and 11 for medial epicondylitis. The average age of the patients (33 women, 47 men) was 50 years. The duration of follow-up evaluation ranged from 6 months to 9 years (mean, 2.5 years; median, 2 years). The Table presents the VAS improvement for these patients after the RF microtenotomy.
Within the lateral epicondylitis group, 91% (63/69) of the patients reported a successful outcome. The postoperative VAS improved to 1.3 from 6.9, which demonstrated an 81% improvement. Of the 6 patients that did not improve, 2 underwent repeat surgery.
Among the patients treated for medial epicondylitis, 91% (10/11) reported improvement in symptoms. The postoperative VAS improved to 1.3 from 6.1, a 79% improvement. One patient did not improve and did not undergo repeat surgery.
Discussion
For the treatment of medial and lateral elbow epicondylitis, RF microtenotomy is successful in 91% of patients. Symptomatic improvement was observed up to 9 years postoperatively. During this study, no complications were recorded; 7 treatment failures occurred. When compared with other techniques, the results with RF microtenotomy are equivalent or better.
In a retrospective study, Szabo and colleagues14 compared open, arthroscopic, and percutaneous release for lateral elbow tendinosis. They found the 3 methods to be highly effective for the treatment of tendinosis with no significant difference between them. Resection of the epicondyle and transfer of the anconeus muscle was found to be effective (94%) in a retrospective study by Almquist and colleagues.15 Dunn and coauthors16 reported a 97% success rate at 10 to 14 years postoperatively with a mini-open technique. Rubenthaler and colleagues17 showed 88% effectiveness for the open technique and 93% for the arthroscopic technique. With arthroscopic release of the extensor carpi radialis brevis tendon, Lattermann and coauthors18 reported clinical improvement in 94% of patients. In a study by Rose and colleagues,19 denervation of the lateral epicondyle was effective in relieving pain in 80% of patients who had had a positive response to a local anesthetic block. In a recently published study by Koh and coauthors,20 19 of 20 patients experienced a favorable outcome after treatment with ultrasonic microresection.
Regardless of surgical methods and their reported success rate, complications are associated with elbow surgery. Postoperative problems may include restricted function, elbow instability, persistent muscle weakness, and painful neuroma of the posterior cutaneous nerve.10,21,22 The recent introduction of arthroscopic release offers the potential for less morbidity and enables visualization of the elbow joint. However, disadvantages of the arthroscopic approach include violation of the joint for extra-articular pathology, increased operative time and cost, and neurovascular complications. Additionally, it is possible that the entire spectrum of extra-articular tendinosis cannot be effectively identified arthroscopically.23 In a prospective, randomized study, Meknas and colleagues24 compared RF microtenotomy with extensor tendon release and repair. They showed that patients treated with RF-microtenotomy experienced earlier pain relief and improved grip strength over the release group.
Different proposed mechanisms of action have been described to explain the favorable effects of the RF-based microtenotomy procedure, such as induced healing by an angiogenic response in the tendon tissue. In an animal study, Harwood and colleagues8 showed that low-dose RF-based plasma microtenotomy has the ability to stimulate angiogenic growth factors in tendons, such as αv integrin and vascular endothelial growth factor. These factors have been shown to be associated with healing.8 Early inflammatory response with new-vessel formation after 28 days was found in another animal study using the same method.25 Evaluation of RF-based methods in a prospective controlled laboratory study using a rabbit-tendon model showed histologic evidence of early inflammation with development of neovasculature after treatment.8 A later histologic study using an aged Achilles rabbit tendon model was performed to evaluate the effect of RF-based plasma microtenotomy on collagen remodeling.25 The degenerated tendon showed gaps, few normal crimpings, and a lack of reflectivity under polarized light. At 9 days after treatment, the treated tendon showed localized irregular crimpings, and, at 30 days, it showed regular crimping, tightly dense collagen fibers, and hypercellularity with good reflectivity. This was similar in appearance to a normal nondegenerated tendon (Figures 2A-2D). The RF-treated tendon also demonstrated an increase in production of insulin-like growth factor-1, β-fibroblast growth factor-1, αv integrin, and vascular endothelial growth factor.
Pathologic nerve ingrowth or nerve irritation in the tendon substance has been considered a possible cause of the pain experienced with tendinosis. Radiofrequency treatment has been shown to induce acute degeneration and ablation of sensory nerve fibers.26 These degenerated nerve fibers were observed to regenerate at 90 days after treatment.27 These findings provide potential evidence for early pain relief that is maintained long term as the nerves regenerate.
This midterm follow-up of patients with elbow epicondylitis has shown that RF-based microtenotomy can produce successful, durable results. Microtenotomy is a technically simple procedure to perform and is associated with a rapid and uncomplicated recovery. It is safe and can effectively eliminate or markedly reduce clinical symptoms.
Limitations
Lateral epicondylitis has been described as a self-limited disease, with resolution of symptoms at 12 to 18 months with conservative treatment. This perspective challenges the indication of any proposed surgical treatment for the condition. Although the results of this research demonstrated the benefits of RF microtenotomy, there are inherent limitations of the study design. The study lacks a control group, and randomization would improve the strength of the study. Additional outcome measures, such as Disabilities of the Arm, Shoulder, and Hand score, and grip strength could complement pain scores to provide more data. These data were collected in a preliminary study.9 Postoperative histologic analysis of treated human tissue would be ideal, but ethical considerations limit study to animal models. An additional limitation is potential examiner bias. Data collection was performed by an independent medical technician; a third-party blinded evaluation could have been performed, but this was not feasible in a clinical setting.
Conclusion
Radiofrequency-based microtenotomy is a safe and effective procedure for elbow epicondylitis. The results are durable with successful outcomes observed 9 years after surgery.
1. Leach RE, Miller JK. Lateral and medial epicondylitis of the elbow. Clin Sports Med. 1987;6(2):259-272.
2. Vangsness CT Jr, Jobe FW. Surgical technique of medial epicondylitis: Results in 35 elbows. J Bone Joint Surg Br. 1991;73(3):409-411.
3. Galloway M, DeMaio M, Mangine R. Rehabilitative techniques in the treatment of medial and lateral epicondylitis. Orthopedics. 1992;15(9):1089-1096.
4. Kraushaar BS, Nirschl RP. Tendinosis of the elbow (tennis elbow). Clinical features and findings of histological, immunohistochemical, and electron microscopy studies. J Bone Joint Surg Am. 1999;81(2):259-278.
5. Leadbetter WB. Cell-matrix response in tendon injury. Clin Sports Med. 1992;11(3):533-578.
6. Nirschl RP. Tennis elbow tendinosis: pathoanatomy, nonsurgical and surgical management. In: Fine LJ, ed. Repetitive Motion Disorders of the Upper Extremity. Rosemont, IL: American Academy of Orthopaedic Surgeons; 1995:467-479.
7. Chu V, Kuang J, Aiaid A, Korkola S, Chiu RC. Angiogenic response induced by mechanical transmyocardial revascularization. J Thorac Cardiovasc Surg 1999;118:849-856.
8. Harwood R, Bowden K, Amiel M, Tasto JP, Amiel D. Structural and angiogenic response to bipolar radiofrequency treatment of normal rabbit achilles tendon: a potential application to the treatment of tendinosis. Trans Orthop Res Soc. 2003;28:819.
9. Tasto JP, Cummings J, Medlock V, Hardesty R, Amiel D. Microtenotomy using a radiofrequency probe to treat lateral epicondylitis. Arthroscopy. 2005;21(7):851-860.
10. Woloszko J, Stalder KR, Brown IG. Plasma characteristics of repetitively-pulsed electrical discharges in saline solutions used for surgical procedures. IEEE Trans Plasma Sci. 2002;30:1376-1383.
11. Stalder KR, Woloszko J, Brown IG, Smith CD. Repetitive plasma discharges in saline solutions. Appl Phys Lett. 2001;79:4503-4505.
12. Woloszko J, Gilbride C. Coblation technology (plasma mediated ablation for otolaryngology applications). Proc SPIE. 2000;3907:306–316.
13. Woloszko J, Kwende MM, Stalder KR. Coblation in otolaryngology. Proc SPIE. 2003;4949:341–352.
14. Szabo SJ, Savoie FH 3rd, Field LD, Ramsey JR, Hosemann CD. Tendinosis of the extensor carpi radialis brevis: an evaluation of three methods of operative treatment. J Shoulder Elbow Surg Am. 2006;15(6):721-727.
15. Almquist EE, Necking L, Bach AW. Epicondylar resection with anconeus transfer for chronic lateral epicondylitis. J Hand Surg Am. 1998;23(4):723-731.
16. Dunn JH, Kim JJ, Davis L, Nirschl RP. Ten- to 14-year follow-up of the Nirschl surgical technique for lateral epicondylitis. Am J Sports Med. 2008;36(2):261-266.
17. Rubenthaler F, Wiese M, Senge A, Keller L, Wittenberg RH. Long-term follow-up of open and endoscopic Hohmann procedures for lateral epicondylitis. Arthroscopy. 2005;21(6):684-690.
18. Lattermann C, Romeo AA, Anbari A, et al. Arthroscopic debridement of the extensor carpi radialis brevis for the treatment of recalcitrant lateral epicondylitis. J Shoulder Elbow Surg. 2010;19(5):651-656.
19. Rose NE, Forman SK, Dellon AL. Denervation of the lateral epicondyle for treatment of chronic lateral epicondylitis. J Hand Surg Am. 2013;38(2):344-349.
20. Koh JS, Mohan PC, Howe TS, et al. Fasciotomy and surgical tenotomy for recalcitrant lateral elbow tendonopathy: early clinical experience with a novel device for minimally invasive percutaneous microresection. Am J Sports Med. 2013;41(3):636-644.
21. Nirschl RP, Ashman ES. Elbow tendonopathy: tennis elbow. Clin Sports Med. 2003;22(4):813-836.
22. Dellon AL, Kim J, Ducic I. Painful neuroma of the posterior cutaneous nerve of the forearm after surgery for lateral humeral epicondylitis. J Hand Surg Am. 2004;29(3):387-390.
23. Cummins CA. Lateral epicondylitis: in-vivo assessment of arthroscopic debridement and correlation with patient outcomes. Am J Sports Med. 2006;34(9):1486-1491.
24. Meknas K, Odden-Miland A, Mercer JB, Castillejo M, Johansen O. Radiofrequency microtenotomy: a promising method for treatment of recalcitrant lateral epicondylitis. Am J Sports Med. 2008;36(10):1960-1965.
25. Takahashi N, Tasto JP, Locke J, et al. The use of radiofrequency (RF) for the treatment of chronic tendinosis. Paper presented at: 6th Biennial Congress of the International Society of Arthroscopy, Knee Surgery, and Orthopaedic Sports Medicine Congress; May 2007; Florence, Italy. Abstract 1433.
26. Takahashi N, Tasto JP, Ritter M, et al. Pain relief through an antinociceptive effect after radiofrequency application. Am J Sports Med. 2007;35(5):805-810.
27. Ochiai N, Tasto JP, Ohtori S, Takahashi N, Moriya H, Amiel D. Nerve regeneration after radiofrequency ablation. Am J Sports Med. 2007;35(11):1940-1944.
Giant Bone Island of the Tibia in a Child
A bone island is a focus of normal cortical bone located within the medullary cavity. The vast majority of bone islands are small, measuring from 1 mm to 2 cm in size. They are found more frequently in adults than in children. The lesion can be virtually diagnosed on the basis of its characteristic clinical and imaging features. Differential diagnosis may be difficult when the lesion manifests itself uncharacteristically by being symptomatic, very large, and hot on bone scan.1-4
The term giant bone island has been used to describe a large lesion1 that measures more than 2 cm in any dimension.5 Giant bone islands have been described only in adults,1,5-15 and the longest bone island length reported is 10.5 cm.10 They are usually symptomatic and associated with increased radionuclide uptake on bone scintigraphy.14
The history and the clinical and imaging presentation of an even longer, symptomatic, and scintigraphically hot lesion in the tibial diaphysis of a 10-year-old boy is reported. The lesion further exhibited several atypical imaging features necessitating an open biopsy, which confirmed the diagnosis of a giant bone island. The pertinent differential diagnosis and the clinical and radiographic findings after 15-year follow-up are also presented and discussed. The patient provided written informed consent for print and electronic publication of this case report.
Case Report
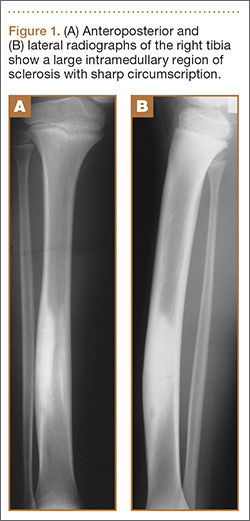
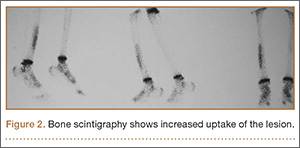
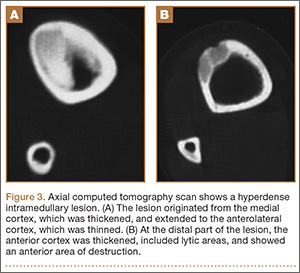
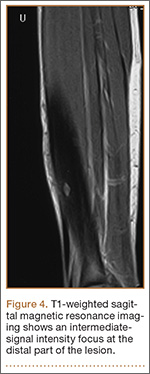
A 10-year-old boy was admitted for surgical repair of an inguinal hernia. Physical examination revealed a painless but tender anterior bowing of the right tibial diaphysis. The patient was a healthy-appearing white male with normal vital signs, gait, and posture. His parents noticed a slight protuberance of the tibia at age 2.5 years. No medical advice was asked for the bone swelling after that time. After recovery from the inguinal hernia repair 3 weeks later, the bone lesion was thoroughly examined. Radiographs showed an oblong, homogenous region of dense sclerosis in the diaphysis of the right tibia. The lesion had relatively well-defined margins and was located in the medullary cavity. Speculations were not obvious in the periphery of the lesion, which exhibited a sharp circumscription (Figures 1A, 1B). A well-defined lytic area was evident at the distal part of the lesion (Figure 1B). There was no periosteal reaction. Blood and serum chemistries were within normal limits, including serum calcium, phosphorus, and alkaline phosphatase. A conventional 3-phase bone scintigraphy (300 MBq) with technetium-99m HDP (hydroxydiphosphonate) indicated increased uptake in the area of the lesion but no other skeletal abnormality (Figure 2). Computed tomography (CT) showed that the lesion was purely intramedullary and densely blastic. The lesion originated from the medial cortex, which was thickened (Figure 3A). The lesion extended to the anterolateral cortex, which was thinned and included a lytic area. In the distal part of the lesion, the anterolateral cortex was thickened, included lytic areas, and exhibited an anterior portion of cortical destruction (Figure 3B). The fatty marrow adjacent to the region of sclerosis appeared normal. There was no evidence of extraosseous soft-tissue changes. On both T1- and T2-weighted magnetic resonance imaging (MRI), the lesion exhibited low-signal intensity. The lesion measured 10.8×2.2×1 cm. It originated from the medial cortical bone of the tibia, blended into the medullary cavity, and extended anteriorly towards and through the anterior cortex. The area of cortical destruction was clearly evident on the axial MRI. The periosteum was displaced and eroded anteriorly by focal radiating bony streaks. No enhancement was seen after the intravenous administration of gadolinium-diethylenetriamine pentaacetic acid (Gd-DTPA) as a contrast medium. There were no extraosseous soft-tissue changes. In the distal part of the lesion, sagittal and axial MRI showed a 1.2×0.8×0.7-cm well-defined ovoid focus, with characteristics of cystic degeneration that exhibited intermediate-signal intensity on T1-weighted MRI (Figure 4) and high-signal intensity on T2-weighted MRI.
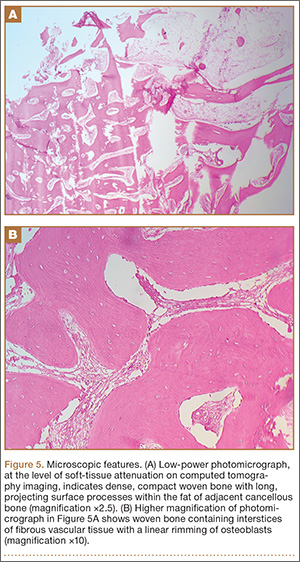
An open biopsy was performed. Macroscopically, a wedge of compact bone measuring 3×1.7×0.6 cm was taken. Microscopic examination showed a thinned periphery of lamellar (mature) bone with haversian canals and, beneath it, woven (immature) bone with long-surface processes projecting within adjacent cancellous bone (Figure 5A). The woven bone contained loose vascular fibrous tissue. No osteoclasts were noted, and the very few osteoblasts lining the bone trabeculae were small, single-layered, and flat (Figure 5B). There was no evidence of neoplastic cells. There was no abnormality of the periosteum and the surrounding soft tissues.
The histology was pathognomonic of a giant bone island. No additional surgical intervention was recommended.
The postoperative course was uncomplicated, and the patient was discharged 2 weeks later. An above-the-knee plaster was recommended for 3 months and a below-the-knee splint for an additional 2-month period. Full weight-bearing was allowed only after the postsurgical sixth month to prevent an impending fracture. The tibial bowing was tender to pressure or palpation, and the patient reported mild spontaneous pain during follow-up. Radiographs 1 year after surgery indicated that the bone area removed for biopsy was replaced by compact bone. MRI performed 4 years after surgery showed that the volume of the lesion in relation to the host bone was not changed.
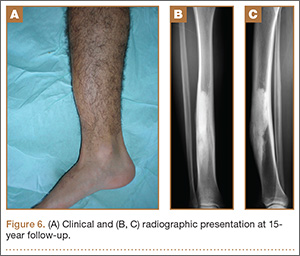
At the last follow-up 15 years after surgery, the anterior tibial bowing was not changed (Figure 6A), but the patient additionally complained of skin irritation after intense training wearing boots during military service. The radiographic appearance of the lesion was also not changed, while the periphery of the lesion exhibited scarce radiating bony streaks with rounded contours (Figures 6B, 6C). The clinical symptoms and signs from wearing military boots completely subsided after a couple of weeks’ rest from daily army activities, but the mild spontaneous pain and the local tenderness over the tibial bowing persisted.
Discussion
Giant bone islands are more likely to be associated with clinical symptoms than the usual small-sized bone island. Some degree of pain was detected in 8 of 10 patients with a giant bone island presented in the literature, but it was induced by trauma in 3 of them.14
Radiographic appearance is among the distinguishing diagnostic features of a giant bone island. It appears as an ovoid, round, or oblong, homogenously dense, single or multiple focus of sclerosis within the medullary cavity; it is oriented along the long axis of the host bone, and it exhibits peripheral pseudopodia or radiating spicules producing the typical “thorny” or “paintbrush” appearance.8,16,17 It does not exhibit cortical penetration and it is not associated with periosteal reaction.10
The CT findings include a sclerotic and hyperdense focus with spiculated margins extending into the adjacent cancellous bone. The lack of bone destruction and soft-tissue mass are also diagnostic.3,7 MRI findings will reflect the low-signal intensity characteristics of cortical bone on all pulse sequences.18
Enostoses usually exhibit no activity on skeletal scintigraphy, while giant lesions generally show increased radiotracer uptake.5,9-11,14,19-27 The latter may result from the increased amount of bone turnover, which is seen more often with larger lesions because of active bone deposition and remodeling.20,21,23,28 Histopathology of a giant bone island appears identical to the well-described pathologic appearance of smaller bone islands. The lesion is composed of compact lamellar bone and haversian systems, which blend with the adjacent spongiosa. The surrounding cancellous bone forms thorn-like trabeculae radiating from the lesion and merging with the cancellous bone.1,4,5,8,28
The presumptive diagnosis of a bone island is based on the clinical findings, imaging features, and follow-up examinations. An asymptomatic, isolated, sclerotic bone lesion showing the typical features of a bone island on plain radiography, CT, and MRI, whatever its size, that is nonactive on bone scan may be easily diagnosed. However, a symptomatic patient with a hot lesion on scintigraphy should be carefully observed. In addition, larger lesions may raise the suspicion of a neoplasm, such as a sclerotic variant of osteosarcoma. In such cases, an open biopsy may be undertaken. No specific treatment is required after the diagnosis has been confirmed. There is no literature to suggest that, after adequate biopsy confirmation, excision or resection is necessary. Follow-up radiographic examination of the lesion should be suggested to monitor for any potential growth.2,10,23
The first giant bone island appearing in a child is presented in this report. The lack of a causative factor leading to the anterior tibial bowing indicated that the bone deformity was caused primarily by the lesion. The present case is unusual for the appearance of several atypical features, some of which have not been previously described. Peripheral radiating spiculated margin was absent on the patient’s initial radiographs and CT imaging. MRI indicated only the presence of radiating bony streaks that displaced and eroded the periosteum on the anterior border of the lesion. The CT findings that the lesion likely originated or was in close proximity with the medial cortex of the tibia were also atypical. It has been previously reported that spinal lesions located immediately below the cortex tend to fuse with the endosteal surface, while similar features may also be seen in the appendicular enostoses.4,29 Other CT findings, such as the thinning of the overlying anterolateral cortical bone, as well as the cortical thickening at the periphery of the lesion associated with areas of soft-tissue attenuation and anterior cortical destruction, have not been described even in the atypical features of a giant bone island. The lytic area resembling a nidus that was evident at the distal part of the lesion was more likely consistent with an area of resorption, which, although rare, has been described on giant lesions.2,9,29 The substantial amount of woven bone transforming to lamellar bone that was evident in the present patient’s microscopic features is also an atypical finding, although it may be expected to some degree in scintigraphically hot, large lesions.28 The clinical and imaging progress of the lesion supported the diagnosis of a giant bone island. The degree of the anterior tibial bowing and the volume of the lesion in relation to the host bone were not changed throughout the follow-up period, indicating that the growth of the lesion followed the growth of the normal bone.
The differential diagnosis of a giant bone island includes a variety of benign tumors and tumor-like lesions, as well as malignant bone lesions.2,4,23,28,30,31 In the patient presented in this report, the diagnosis of an atypical sclerotic presentation of a nonossifying fibroma or healing stage of this lesion could be consistent with some of the CT findings, including the eccentric origin from the cortex associated with medial cortical thickening, the anterolateral cortical thinning, and the soft-tissue attenuation of cortical areas. In addition, unifocal osteofibrous dysplasia may also present with a long intracortical diaphyseal lucency within an area of marked cortical sclerosis and cause a bowing deformity. Both diagnoses were excluded, since no fibrous stroma was evident on the histologic examination of the lesion. A large or giant long-bone osteoma would be associated with the outer cortical margin of bone but would not involve the intramedullary space. The scintigraphically increased uptake of radioisotope, as well as the CT and MRI findings, were not consistent with the diagnosis of osteoid osteoma, osteoblastoma, or osteomyelitis. Although most imaging findings were consistent with a benign lesion, and contrast-enhanced MRI showed no increased vascularity, anterior cortical disruption necessitated a bone biopsy to rule out any potential malignancy.
The histopathology in association with the clinical and imaging findings indicated the diagnosis of a giant bone island. The increased proportion of maturing woven bone over lamellar bone indicated an active remodeling lesion that could be related to the patient’s age, since the clinical and radiographic features of the lesion were not changed after 15-year follow-up.
Conclusion
This is the first giant bone island diagnosed in a patient before puberty. Its greatest length was 10.8 cm, which is the longest reported in the literature. The imaging appearance included several atypical features that are very rare or have not been reported. Microscopic features indicated less mature lamellar bone and a prominent proportion of maturing woven bone. The clinical and the radiographic appearance of the lesion were not changed after 15-year follow-up.
1. Smith J. Giant bone islands. Radiology. 1973;7(1):35-36.
2. Mirra JM. Bone Tumors: Clinical, Radiologic and Pathologic Correlations. Philadelphia, PA: Lea & Febiger; 1989.
3. Greenspan A. Bone island (enostosis): current concept - a review. Skeletal Radiol. 1995;24(2):111-115.
4. Kransdorf MJ, Peterson JJ, Bancroft LW. MR imaging of the knee: incidental osseous lesions. Radiol Clin North Am. 2007;45(6):943-954.
5. Gold RH, Mirra JM, Remotti F, Pignatti G. Case report 527: Giant bone island of tibia. Skeletal Radiol. 1989;18(2):129-132.
6. Onitsuka H. Roentgenologic aspects of bone islands. Radiology. 1977;123(3):607-612.
7. Ehara S, Kattapuram SV, Rosenberg AE. Giant bone island. Computed tomography findings. Clin Imaging. 1989;13(3):231-233.
8. Greenspan A, Steiner G, Knutzon R. Bone island (enostosis): clinical significance and radiologic and pathologic correlations. Skeletal Radiol. 1991;20(2):85-90.
9. Avery GR, Wilsdon JB, Malcolm AJ. Giant bone island with some central resorption. Skeletal Radiol. 1995;24(1):59-60.
10. Brien EW, Mirra JM, Latanza L, Fedenko A, Luck J Jr. Giant bone island of femur. Case report, literature review, and its distinction from low grade osteosarcoma. Skeletal Radiol. 1995;24(7):546-550.
11. Greenspan A, Klein MJ. Giant bone island. Skeletal Radiol. 1996;25(1):67-69.
12. Trombetti A, Noël E. Giant bone islands: a case with 31 years of follow-up. Joint Bone Spine. 2002;69(1):81-84.
13. Dhaon BK, Gautam VK, Jain P, Jaiswal A, Nigam V. Giant bone island of femur complicating replacement arthroplasty: a report of two cases. J Surg Orthop Adv. 2004;13(4):220-223.
14. Park HS, Kim JR, Lee SY, Jang KY. Symptomatic giant (10-cm) bone island of the tibia. Skeletal Radiol. 2005;34(6):347-350.
15. Ikeuchi M, Komatsu M, Tani T. Giant bone island of femur with femoral head necrosis: a case report. Arch Orthop Trauma Surg. 2010;130(4):447-450.
16. Kim SK, Barry WF Jr. Bone island. Am J Roentgenol Radium Ther Nucl Med. 1964;92:1301-1306.
17. Kim SK, Barry WF Jr. Bone islands. Radiology. 1968;90(1):77-78.
18. Cerase A, Priolo F. Skeletal benign bone-forming lesions. Eur J Radiol. 1998;27:S91–S97.
19. Go RT, El-Khoury GY, Wehbe MA. Radionuclide bone image in growing and stable bone island. Skeletal Radiol. 1980;5(1):15-18.
20. Hall FM, Goldberg RP, Davies JA, Fainsinger MH. Scintigraphic assessment of bone islands. Radiology. 1980;135(3):737-742.
21. Greenspan A, Stadalnik RC. Bone island: scintigraphic findings and their clinical application. Can Assoc Radiol J. 1995;46(5):368-379.
22. Sickles EA, Genant HK, Hoffer PB. Increased localization of 99mTc-pyrophosphate in a bone island: case report. J Nucl Med. 1976;17(2):113-115.
23. Dorfman HD, Czerniak B. Bone Tumors. St Louis: Mosby; 1998.
24. Ngan H. Growing bone islands. Clin Radiol. 1972;23(2):199-201.
25. Davies JA, Hall FM, Goldberg RP, Kasdon EJ. Positive bone scan in a bone island. Case report. J Bone Joint Surg Am. 1979;61(6):943-945.
26. Simon K, Mulligan ME. Growing bone islands revisited. A case report. J Bone Joint Surg Am. 1985;67(5):809-811.
27. Blank N, Lieber A. The significance of growing bone islands. Radiology. 1965;85(3):508-511.
28. Greenspan A, Gernot J, Wolfgang R. Differential Diagnosis of Orthopaedic Oncology. Philadelphia, PA: Lippincott Williams & Wilkins; 2007.
29. Kransdorf MJ, Murphey MD. Osseous tumors. In: Davies AM, Sundaram M, James SLJ, eds. Imaging of Bone Tumors and Tumor-Like Lesions. Berlin, Germany: Springer-Verlag; 2009.
30. Mödder B, Guhl B, Schaefer HE. Growing bone islands as differential diagnosis of osteoplastic metastases. Rontgenblatter. 1980;33(6):286-288.
31. Flechner RE, Mills SE. Atlas of Tumor Pathology: Tumors of the Bones and Joints. Washington, DC: Armed Forces Institute of Pathology; 1993.
A bone island is a focus of normal cortical bone located within the medullary cavity. The vast majority of bone islands are small, measuring from 1 mm to 2 cm in size. They are found more frequently in adults than in children. The lesion can be virtually diagnosed on the basis of its characteristic clinical and imaging features. Differential diagnosis may be difficult when the lesion manifests itself uncharacteristically by being symptomatic, very large, and hot on bone scan.1-4
The term giant bone island has been used to describe a large lesion1 that measures more than 2 cm in any dimension.5 Giant bone islands have been described only in adults,1,5-15 and the longest bone island length reported is 10.5 cm.10 They are usually symptomatic and associated with increased radionuclide uptake on bone scintigraphy.14
The history and the clinical and imaging presentation of an even longer, symptomatic, and scintigraphically hot lesion in the tibial diaphysis of a 10-year-old boy is reported. The lesion further exhibited several atypical imaging features necessitating an open biopsy, which confirmed the diagnosis of a giant bone island. The pertinent differential diagnosis and the clinical and radiographic findings after 15-year follow-up are also presented and discussed. The patient provided written informed consent for print and electronic publication of this case report.
Case Report
A 10-year-old boy was admitted for surgical repair of an inguinal hernia. Physical examination revealed a painless but tender anterior bowing of the right tibial diaphysis. The patient was a healthy-appearing white male with normal vital signs, gait, and posture. His parents noticed a slight protuberance of the tibia at age 2.5 years. No medical advice was asked for the bone swelling after that time. After recovery from the inguinal hernia repair 3 weeks later, the bone lesion was thoroughly examined. Radiographs showed an oblong, homogenous region of dense sclerosis in the diaphysis of the right tibia. The lesion had relatively well-defined margins and was located in the medullary cavity. Speculations were not obvious in the periphery of the lesion, which exhibited a sharp circumscription (Figures 1A, 1B). A well-defined lytic area was evident at the distal part of the lesion (Figure 1B). There was no periosteal reaction. Blood and serum chemistries were within normal limits, including serum calcium, phosphorus, and alkaline phosphatase. A conventional 3-phase bone scintigraphy (300 MBq) with technetium-99m HDP (hydroxydiphosphonate) indicated increased uptake in the area of the lesion but no other skeletal abnormality (Figure 2). Computed tomography (CT) showed that the lesion was purely intramedullary and densely blastic. The lesion originated from the medial cortex, which was thickened (Figure 3A). The lesion extended to the anterolateral cortex, which was thinned and included a lytic area. In the distal part of the lesion, the anterolateral cortex was thickened, included lytic areas, and exhibited an anterior portion of cortical destruction (Figure 3B). The fatty marrow adjacent to the region of sclerosis appeared normal. There was no evidence of extraosseous soft-tissue changes. On both T1- and T2-weighted magnetic resonance imaging (MRI), the lesion exhibited low-signal intensity. The lesion measured 10.8×2.2×1 cm. It originated from the medial cortical bone of the tibia, blended into the medullary cavity, and extended anteriorly towards and through the anterior cortex. The area of cortical destruction was clearly evident on the axial MRI. The periosteum was displaced and eroded anteriorly by focal radiating bony streaks. No enhancement was seen after the intravenous administration of gadolinium-diethylenetriamine pentaacetic acid (Gd-DTPA) as a contrast medium. There were no extraosseous soft-tissue changes. In the distal part of the lesion, sagittal and axial MRI showed a 1.2×0.8×0.7-cm well-defined ovoid focus, with characteristics of cystic degeneration that exhibited intermediate-signal intensity on T1-weighted MRI (Figure 4) and high-signal intensity on T2-weighted MRI.
An open biopsy was performed. Macroscopically, a wedge of compact bone measuring 3×1.7×0.6 cm was taken. Microscopic examination showed a thinned periphery of lamellar (mature) bone with haversian canals and, beneath it, woven (immature) bone with long-surface processes projecting within adjacent cancellous bone (Figure 5A). The woven bone contained loose vascular fibrous tissue. No osteoclasts were noted, and the very few osteoblasts lining the bone trabeculae were small, single-layered, and flat (Figure 5B). There was no evidence of neoplastic cells. There was no abnormality of the periosteum and the surrounding soft tissues.
The histology was pathognomonic of a giant bone island. No additional surgical intervention was recommended.
The postoperative course was uncomplicated, and the patient was discharged 2 weeks later. An above-the-knee plaster was recommended for 3 months and a below-the-knee splint for an additional 2-month period. Full weight-bearing was allowed only after the postsurgical sixth month to prevent an impending fracture. The tibial bowing was tender to pressure or palpation, and the patient reported mild spontaneous pain during follow-up. Radiographs 1 year after surgery indicated that the bone area removed for biopsy was replaced by compact bone. MRI performed 4 years after surgery showed that the volume of the lesion in relation to the host bone was not changed.
At the last follow-up 15 years after surgery, the anterior tibial bowing was not changed (Figure 6A), but the patient additionally complained of skin irritation after intense training wearing boots during military service. The radiographic appearance of the lesion was also not changed, while the periphery of the lesion exhibited scarce radiating bony streaks with rounded contours (Figures 6B, 6C). The clinical symptoms and signs from wearing military boots completely subsided after a couple of weeks’ rest from daily army activities, but the mild spontaneous pain and the local tenderness over the tibial bowing persisted.
Discussion
Giant bone islands are more likely to be associated with clinical symptoms than the usual small-sized bone island. Some degree of pain was detected in 8 of 10 patients with a giant bone island presented in the literature, but it was induced by trauma in 3 of them.14
Radiographic appearance is among the distinguishing diagnostic features of a giant bone island. It appears as an ovoid, round, or oblong, homogenously dense, single or multiple focus of sclerosis within the medullary cavity; it is oriented along the long axis of the host bone, and it exhibits peripheral pseudopodia or radiating spicules producing the typical “thorny” or “paintbrush” appearance.8,16,17 It does not exhibit cortical penetration and it is not associated with periosteal reaction.10
The CT findings include a sclerotic and hyperdense focus with spiculated margins extending into the adjacent cancellous bone. The lack of bone destruction and soft-tissue mass are also diagnostic.3,7 MRI findings will reflect the low-signal intensity characteristics of cortical bone on all pulse sequences.18
Enostoses usually exhibit no activity on skeletal scintigraphy, while giant lesions generally show increased radiotracer uptake.5,9-11,14,19-27 The latter may result from the increased amount of bone turnover, which is seen more often with larger lesions because of active bone deposition and remodeling.20,21,23,28 Histopathology of a giant bone island appears identical to the well-described pathologic appearance of smaller bone islands. The lesion is composed of compact lamellar bone and haversian systems, which blend with the adjacent spongiosa. The surrounding cancellous bone forms thorn-like trabeculae radiating from the lesion and merging with the cancellous bone.1,4,5,8,28
The presumptive diagnosis of a bone island is based on the clinical findings, imaging features, and follow-up examinations. An asymptomatic, isolated, sclerotic bone lesion showing the typical features of a bone island on plain radiography, CT, and MRI, whatever its size, that is nonactive on bone scan may be easily diagnosed. However, a symptomatic patient with a hot lesion on scintigraphy should be carefully observed. In addition, larger lesions may raise the suspicion of a neoplasm, such as a sclerotic variant of osteosarcoma. In such cases, an open biopsy may be undertaken. No specific treatment is required after the diagnosis has been confirmed. There is no literature to suggest that, after adequate biopsy confirmation, excision or resection is necessary. Follow-up radiographic examination of the lesion should be suggested to monitor for any potential growth.2,10,23
The first giant bone island appearing in a child is presented in this report. The lack of a causative factor leading to the anterior tibial bowing indicated that the bone deformity was caused primarily by the lesion. The present case is unusual for the appearance of several atypical features, some of which have not been previously described. Peripheral radiating spiculated margin was absent on the patient’s initial radiographs and CT imaging. MRI indicated only the presence of radiating bony streaks that displaced and eroded the periosteum on the anterior border of the lesion. The CT findings that the lesion likely originated or was in close proximity with the medial cortex of the tibia were also atypical. It has been previously reported that spinal lesions located immediately below the cortex tend to fuse with the endosteal surface, while similar features may also be seen in the appendicular enostoses.4,29 Other CT findings, such as the thinning of the overlying anterolateral cortical bone, as well as the cortical thickening at the periphery of the lesion associated with areas of soft-tissue attenuation and anterior cortical destruction, have not been described even in the atypical features of a giant bone island. The lytic area resembling a nidus that was evident at the distal part of the lesion was more likely consistent with an area of resorption, which, although rare, has been described on giant lesions.2,9,29 The substantial amount of woven bone transforming to lamellar bone that was evident in the present patient’s microscopic features is also an atypical finding, although it may be expected to some degree in scintigraphically hot, large lesions.28 The clinical and imaging progress of the lesion supported the diagnosis of a giant bone island. The degree of the anterior tibial bowing and the volume of the lesion in relation to the host bone were not changed throughout the follow-up period, indicating that the growth of the lesion followed the growth of the normal bone.
The differential diagnosis of a giant bone island includes a variety of benign tumors and tumor-like lesions, as well as malignant bone lesions.2,4,23,28,30,31 In the patient presented in this report, the diagnosis of an atypical sclerotic presentation of a nonossifying fibroma or healing stage of this lesion could be consistent with some of the CT findings, including the eccentric origin from the cortex associated with medial cortical thickening, the anterolateral cortical thinning, and the soft-tissue attenuation of cortical areas. In addition, unifocal osteofibrous dysplasia may also present with a long intracortical diaphyseal lucency within an area of marked cortical sclerosis and cause a bowing deformity. Both diagnoses were excluded, since no fibrous stroma was evident on the histologic examination of the lesion. A large or giant long-bone osteoma would be associated with the outer cortical margin of bone but would not involve the intramedullary space. The scintigraphically increased uptake of radioisotope, as well as the CT and MRI findings, were not consistent with the diagnosis of osteoid osteoma, osteoblastoma, or osteomyelitis. Although most imaging findings were consistent with a benign lesion, and contrast-enhanced MRI showed no increased vascularity, anterior cortical disruption necessitated a bone biopsy to rule out any potential malignancy.
The histopathology in association with the clinical and imaging findings indicated the diagnosis of a giant bone island. The increased proportion of maturing woven bone over lamellar bone indicated an active remodeling lesion that could be related to the patient’s age, since the clinical and radiographic features of the lesion were not changed after 15-year follow-up.
Conclusion
This is the first giant bone island diagnosed in a patient before puberty. Its greatest length was 10.8 cm, which is the longest reported in the literature. The imaging appearance included several atypical features that are very rare or have not been reported. Microscopic features indicated less mature lamellar bone and a prominent proportion of maturing woven bone. The clinical and the radiographic appearance of the lesion were not changed after 15-year follow-up.
1. Smith J. Giant bone islands. Radiology. 1973;7(1):35-36.
2. Mirra JM. Bone Tumors: Clinical, Radiologic and Pathologic Correlations. Philadelphia, PA: Lea & Febiger; 1989.
3. Greenspan A. Bone island (enostosis): current concept - a review. Skeletal Radiol. 1995;24(2):111-115.
4. Kransdorf MJ, Peterson JJ, Bancroft LW. MR imaging of the knee: incidental osseous lesions. Radiol Clin North Am. 2007;45(6):943-954.
5. Gold RH, Mirra JM, Remotti F, Pignatti G. Case report 527: Giant bone island of tibia. Skeletal Radiol. 1989;18(2):129-132.
6. Onitsuka H. Roentgenologic aspects of bone islands. Radiology. 1977;123(3):607-612.
7. Ehara S, Kattapuram SV, Rosenberg AE. Giant bone island. Computed tomography findings. Clin Imaging. 1989;13(3):231-233.
8. Greenspan A, Steiner G, Knutzon R. Bone island (enostosis): clinical significance and radiologic and pathologic correlations. Skeletal Radiol. 1991;20(2):85-90.
9. Avery GR, Wilsdon JB, Malcolm AJ. Giant bone island with some central resorption. Skeletal Radiol. 1995;24(1):59-60.
10. Brien EW, Mirra JM, Latanza L, Fedenko A, Luck J Jr. Giant bone island of femur. Case report, literature review, and its distinction from low grade osteosarcoma. Skeletal Radiol. 1995;24(7):546-550.
11. Greenspan A, Klein MJ. Giant bone island. Skeletal Radiol. 1996;25(1):67-69.
12. Trombetti A, Noël E. Giant bone islands: a case with 31 years of follow-up. Joint Bone Spine. 2002;69(1):81-84.
13. Dhaon BK, Gautam VK, Jain P, Jaiswal A, Nigam V. Giant bone island of femur complicating replacement arthroplasty: a report of two cases. J Surg Orthop Adv. 2004;13(4):220-223.
14. Park HS, Kim JR, Lee SY, Jang KY. Symptomatic giant (10-cm) bone island of the tibia. Skeletal Radiol. 2005;34(6):347-350.
15. Ikeuchi M, Komatsu M, Tani T. Giant bone island of femur with femoral head necrosis: a case report. Arch Orthop Trauma Surg. 2010;130(4):447-450.
16. Kim SK, Barry WF Jr. Bone island. Am J Roentgenol Radium Ther Nucl Med. 1964;92:1301-1306.
17. Kim SK, Barry WF Jr. Bone islands. Radiology. 1968;90(1):77-78.
18. Cerase A, Priolo F. Skeletal benign bone-forming lesions. Eur J Radiol. 1998;27:S91–S97.
19. Go RT, El-Khoury GY, Wehbe MA. Radionuclide bone image in growing and stable bone island. Skeletal Radiol. 1980;5(1):15-18.
20. Hall FM, Goldberg RP, Davies JA, Fainsinger MH. Scintigraphic assessment of bone islands. Radiology. 1980;135(3):737-742.
21. Greenspan A, Stadalnik RC. Bone island: scintigraphic findings and their clinical application. Can Assoc Radiol J. 1995;46(5):368-379.
22. Sickles EA, Genant HK, Hoffer PB. Increased localization of 99mTc-pyrophosphate in a bone island: case report. J Nucl Med. 1976;17(2):113-115.
23. Dorfman HD, Czerniak B. Bone Tumors. St Louis: Mosby; 1998.
24. Ngan H. Growing bone islands. Clin Radiol. 1972;23(2):199-201.
25. Davies JA, Hall FM, Goldberg RP, Kasdon EJ. Positive bone scan in a bone island. Case report. J Bone Joint Surg Am. 1979;61(6):943-945.
26. Simon K, Mulligan ME. Growing bone islands revisited. A case report. J Bone Joint Surg Am. 1985;67(5):809-811.
27. Blank N, Lieber A. The significance of growing bone islands. Radiology. 1965;85(3):508-511.
28. Greenspan A, Gernot J, Wolfgang R. Differential Diagnosis of Orthopaedic Oncology. Philadelphia, PA: Lippincott Williams & Wilkins; 2007.
29. Kransdorf MJ, Murphey MD. Osseous tumors. In: Davies AM, Sundaram M, James SLJ, eds. Imaging of Bone Tumors and Tumor-Like Lesions. Berlin, Germany: Springer-Verlag; 2009.
30. Mödder B, Guhl B, Schaefer HE. Growing bone islands as differential diagnosis of osteoplastic metastases. Rontgenblatter. 1980;33(6):286-288.
31. Flechner RE, Mills SE. Atlas of Tumor Pathology: Tumors of the Bones and Joints. Washington, DC: Armed Forces Institute of Pathology; 1993.
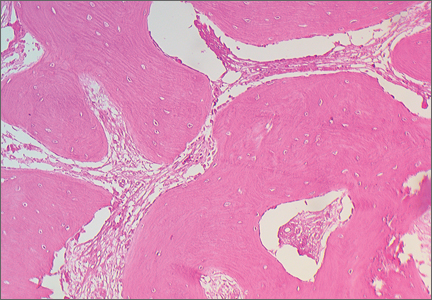
New Developments in Adult Vaccination: Challenges and Opportunities to Protect Vulnerable Veterans From Pneumococcal Disease
Streptococcus pneumoniae (S pneumoniae), also known as pneumococcus, is a successful human pathogen with significant clinical impact that causes pneumonia and invasive infections, including bacteremia and meningitis.1 In the preantibiotic era, nearly 80% of patients with bacteremic pneumococcal pneumonia died.2 The introduction of sulfas and penicillin in the mid-20th century, subsequent refinements in antibiotic chemotherapy, and improvements in supportive care rendered pneumococcal disease readily treatable, notwithstanding the threat of antibiotic-resistant pneumococcus.3 Despite the availability of effective antibiotic therapy against S pneumoniae, pneumococcal disease remains a significant cause of morbidity and mortality among people with increased susceptibility, such as older adults and those living with chronic illness or immunosuppressive conditions. In developed countries like the U.S., where a growing portion of the population is vulnerable to S pneumoniae by virtue of their advanced age and underlying medical conditions, pneumococcal disease is still an important public health concern.4
Penumococcal Vaccines: A Long Time Coming
Vaccination against S pneumoniae has proven an efficacious strategy to reduce the morbidity and mortality associated with this pathogen.5 The original efforts to develop a pneumococcal vaccine culminated in 1945 with a vaccine containing pneumococcal capsular polysaccharides, which elicited a protective immune response among U.S. soldiers (Table 1).Subsequent investigations determined that the protective response was specific to pneumococcal disease caused by the 4 pneumococcal capsular serotypes included in the vaccine, that the carrier rate of pneumococcus with the vaccine serotypes decreased by about 50%, and that the incidence of pneumonia from the vaccine serotypes was reduced even in nonimmunized soldiers.6 These early observations remain relevant to our contemporary understanding of the impact of pneumococcal vaccination: Protection is limited to serotypes included in the vaccine; the vaccine reduces colonization; and the vaccine leads to herd immunity—the protection of unvaccinated subjects.
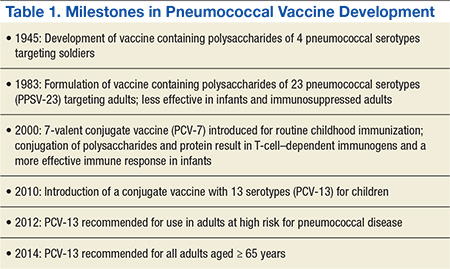
Despite this achievement, the use of vaccines as a strategy to combat pneumococcal disease was upstaged in the subsequent decades by the success of antibiotics. Renewed interest in pneumococcal vaccines resulted from the efforts of Robert Austrian, MD, who astutely observed that “highly effective antimicrobial drugs must be supplemented by other measures, both prophylactic and therapeutic, if the significant mortality resulting still from pneumococcal infection is to be reduced.”7
After initial studies carried out in South African gold miners, the FDA approved a pneumococcal polysaccharide vaccine (PPSV) against 23 of about 90 circulating serotypes.8 The CDC and the Advisory Committee on Immunization Practices (ACIP) initially recommended PPSV-23 for persons perceived to be at high risk for pneumococcal disease, including those with chronic diseases, immunocompromising conditions, and older adults.9
Three decades later, the analysis of a large body of available evidence demonstrated the protective effects of PPSV-23 against invasive pneumococcal disease caused by pneumococcal types included in the vaccine, especially bacteremic pneumonia (about 75% reduction, odds ratio [OR] 0.26, 95% confidence interval [CI] 0.14-0.45).10 A perceived shortcoming of PPSV-23, which some experts dispute, is the lack of definite protection against nonbacteremic pneumococcal pneumonia.11 Studies of nursing home residents demonstrated a 50% reduction in the incidence of both pneumococcal pneumonia and all-cause pneumonia, suggesting that PPSV-23 offers protection against noninvasive pneumococcal pneumonia in specific populations.12 Additional potential limitations of PPSV-23 include reduced benefit in patients aged > 65 years and waning of protection over time.13
Related: Identification and Management of Middle East Respiratory Syndrome
Protein-Conjugate Vaccines
Clearly, the most important limitation of PPSV-23, inherent to all capsular polysaccharide vaccines, is that it does not elicit an immune response in children aged < 2 years. The successful development of a vaccine against Haemophilus influenzae type b (Hib) gave rise to a new generation of pneumococcal vaccines.14 Specifically, the Hib vaccine covalently binds, or conjugates, the capsule polysaccharide to an antigenic protein, leading to effective T-cell–mediated antibody production in infants and toddlers.
In 2000, children received the first iteration of a protein-conjugate vaccine containing the 7 most relevant pneumococcal serotypes (PCV-7).15 The effects of PCV-7 on pneumococcal disease have been extraordinary, practically eliminating infections caused by the pneumococcal serotypes included in the vaccine. Immunizing children with PCV-7 also ushered in a fundamental public health benefit for adults aged > 65 years: a reduction of nearly 90% in the incidence of pneumococcal infections caused by serotypes included in the vaccine. By eliciting mucosal immunity, which leads to decreased nasal carriage of the covered pneumococcal strains among children, PVC-7 generates herd immunity, leading to reductions in transmission, colonization, and infection with vaccine serotypes among adults.16
In 2010, a conjugate vaccine containing 13 serotypes (PCV-13) replaced PCV-7 administration for children.17,18 The PCV-13 is expected to protect children and the herd from disease caused by 6 additional pneumococcal serotypes, including those that surged as replacement strains, filling the ecologic niche created by PCV-7, such as the epidemiologically relevant serotype 19A.19,20
Immune-Compromised Adults
One of the shortcomings of PPSV-23 is its lack of efficacy in patients with advanced HIV, a group with an exquisite vulnerability to pneumococcal disease, as demonstrated by a randomized controlled trial of PPSV-23 in African patients with advanced, untreated HIV infection.21 Similarly, there is concern that patients with lymphoma, leukemia, multiple myeloma, and Hodgkin disease, also at high risk of pneumococcal infection, do not mount sufficient immune responses to polysaccharide antigens or that these responses are adversely affected by chemotherapy or immune suppressing medications. In these populations, a conjugate vaccine (PCV-7 or PCV-13) may elicit a more robust and durable immune response than a polysaccharide vaccine (PPSV-23). A randomized placebo-controlled trial demonstrated the efficacy of PCV-7 in protecting patients with advanced HIV against pneumococcal disease in Africa.22 Based in part on this observation, the ACIP now recommends the use of PCV-13 in patients with HIV and other immunosuppressing conditions, including chronic renal failure.23 A direct comparison of the relative protection of PPSV-23 vs PCV-7 in this population has not been performed.
Pneumococcal Vaccines in the Elderly
Although PPSV-23 was widely adopted in the U.S. with the intention to protect adults aged > 65 years from pneumococcal infection, this vaccine did not achieve global appeal. In the Netherlands, for instance, PPSV-23 had very low penetration and was never endorsed by public health authorities. Concerns have been issued about the decreased immunogenicity of a polysaccharide vaccine in older adults, invoking the concept of immune senescence, a term that describes a diminished capacity to mount robust immune responses due to aging.
Protein-conjugated antigens, on the other hand, can elicit a better initial immune response than a polysaccharide vaccine can in an older adult. Whether the effect is sustained and translates to better clinical outcomes remains unknown. The adoption of PCV-13 and the continued role of PPSV-23 in adults aged > 65 years have been examined carefully by experts.24,25
Dutch investigators organized the Community Acquired Pneumonia Immunization Trial in Adults (CAPITA), randomizing about 85,000 adults aged > 65 years toreceive eitherPCV-13 or a placebo.26 After 3 years of observation, the occurrence of invasive pneumococcal disease (caused by the vaccine serotypes) decreased by 85% in participants who received the vaccine compared with those who received a placebo. Additionally, the incidence of pneumococcal pneumonia (caused by the vaccine serotypes) decreased by 45% (Table 2). The findings of this trial largely inform the recommendation issued by APIC in October 2014 to administer PCV-13 vaccine to adults aged > 65 years.27

Polysaccharide Vaccine in Adults
A crucial limitation of the CAPITA study is that it does not provide a head-to-head comparison with PPSV-23. Similarly, the recommendation to use PCV-13 in patients with immune system compromising conditions did not arise from a direct comparison between PCV-13 and PPSV-23. In both groups of patients, ACIP continues to recommend PPSV-23 to extend protection to the 10 additional pneumococcal serotypes not included in PCV-13.28 Additionally, ACIP maintains its long-standing recommendation to administer PPSV-23 to adults aged < 65 years who have diabetes mellitus, or chronic liver, lung, or heart disease, or those who are tobacco smokers or misuse alcohol.
Notably, the order in which the vaccines are administered may influence their effectiveness. In adults aged 50 to 64 years, initial vaccination with PCV-13 followed by PPSV-23 lead to a better antipneumococcal immune response.14,29 Specifically, PCV-13 enhanced the response to subsequent administration of PPSV-23, whereas an initial PPSV-23 vaccine resulted in a decreased response to subsequent administration of PCV-13. After a 1-year interval between vaccines, immune titers to a second vaccination were not inferior.30 All the above considerations have shaped the ACIP recommendations for the administration of pneumococcal vaccines.27,31 Pneumococcal vaccination was a straightforward exercise when PPSV-23 was the only vaccine available for adults. The advent of PCV-13, however, renders pneumococcal immunization of adults more complicated (Figure 1).
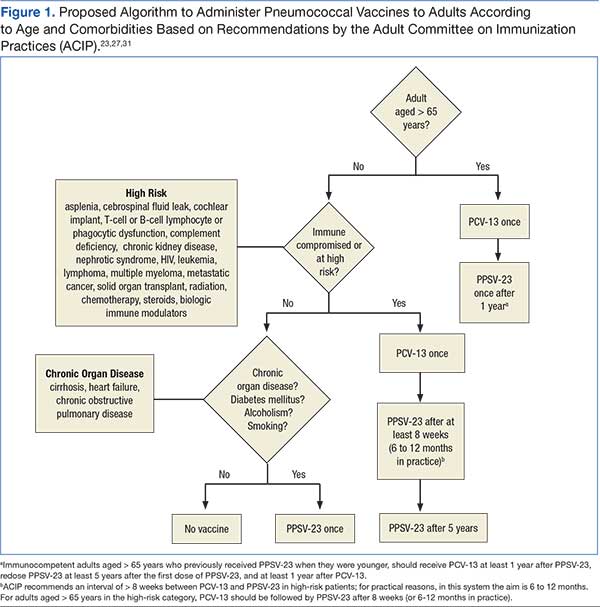
Improving Vaccination Rates
The complex recommendations to vaccinate adults against pneumococcus may reveal obstacles to effective pneumococcal vaccination programs.32 From the perspective of health care institutions, the adoption of the new pneumococcal vaccine implies an added cost. A pneumococcal vaccination strategy that incorporates PCV-13 may be cost-effective, at least under certain parameters.33-35 There remains, however, the issue of affordability and the opportunity cost—the need to decrease funding for other health care programs to accommodate an increased budget for pneumococcal vaccination. Logistically, maintaining a reliable supply of vaccines to meet the demand of practitioners at various sites requires careful planning. Consequently, tracking vaccinated and unvaccinated patients and carefully coordinating among clinical providers, nurses, and pharmacists are essential.
From the perspective of clinical providers, an additional pneumococcal vaccine complicating the vaccination schedule for adults represents an increased burden. Providers will need information to reach their own conclusions regarding the rationale behind the development and use of pneumococcal conjugate vaccines, the existing and evolving recommendations from public health authorities, and the strengths and limitations of the evidence supporting the use of pneumococcal vaccines. Otherwise, providers may find it difficult to incorporate new data and guidelines supporting pneumococcal vaccination into their decision-making (Boxes 1-4). An additional and formidable challenge is to carve out time during an already busy clinical encounter to discuss pneumococcal vaccines and other immunizations.36
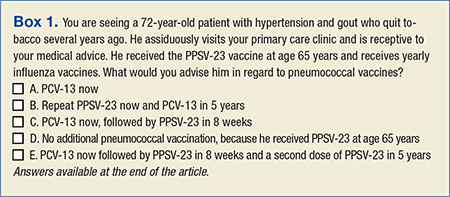
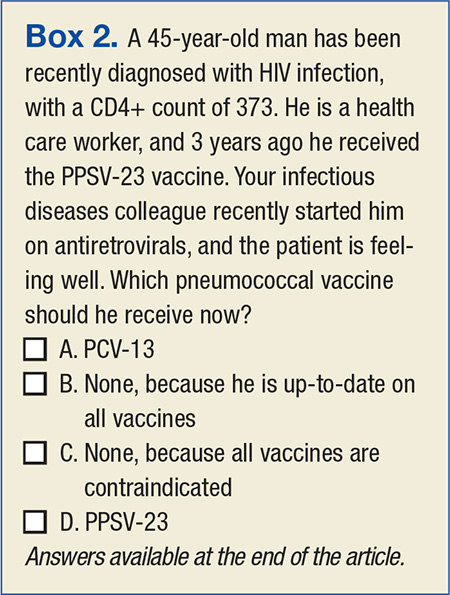
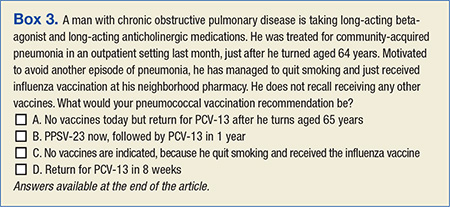
Related: The Importance of an Antimicrobial Stewardship Program
Similarly, older adults or patients with chronic health conditions may not recognize the important role that vaccines can play in their health maintenance and are likely to prioritize other issues during medical visits. It is not obvious for patients that multiple vaccines may be necessary to prevent pneumococcal disease. Furthermore, many patients, not unreasonably, may assume that their yearly influenza vaccine is sufficiently protective against pneumonia. Therefore, patients need to be educated about the rationale behind pneumococcal conjugate vaccination. Ultimately, access to immunization—the opportunity for patients to have an encounter with their providers and with the health care system that results in the administration of an appropriate vaccine—will determine whether goals for pneumococcal vaccination are achieved.
The evolving landscape for the implementation of pneumococcal vaccines creates the need to develop, implement, and refine organizational changes to adhere to the new guidelines for the use of PCV-13 and PPSV-23 vaccines. These interventions, if effective, may help improve pneumococcal vaccination coverage among adults (Table 3).
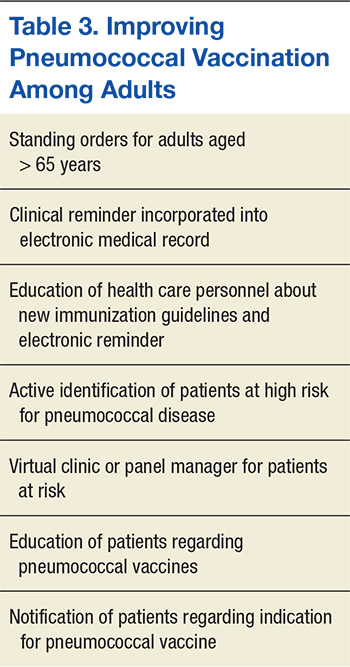
Harnessing the Power of the EMR
Interventions to improve the adherence to pneumococcal vaccination guidelines begin by identifying persons eligible for vaccination based on their age, their vaccination status (ie, persons previously unvaccinated or due for vaccination according to the recommended schedule), or the presence of medical conditions conferring high risk for pneumococcal disease. This, in turn, depends on adequate documentation of patients’ underlying medical diagnosis, as well as up-to-date records of vaccine administration to patients.
Health care systems possessing a mature and sophisticated electronic medical record (EMR), such as the VHA Computerized Patient Record System (CPRS), are in a good position to wield such information to plan, implement, and assure the quality of activities designed to improve pneumococcal vaccination rates. An analysis of the proportion of veterans in VISN 10 who received pneumococcal vaccination revealed that even with the advantages of a robust EMR and a highly developed infrastructure devoted to primary care, pneumococcal vaccine coverage remains below the 60% target goal, although well above national averages (Figure 2).37,38
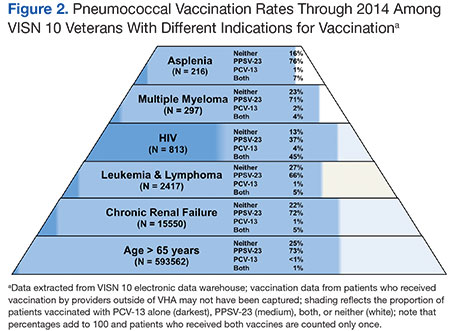
Standing Orders
Standing orders make it possible for nurses and pharmacists to administer vaccines according to a preestablished protocol without a physician’s direct evaluation of each patient. Standing orders are a versatile intervention, with a record of effective implementation in both outpatient and inpatient facilities, in acute-care and long-term care facilities, and in most instances where patients interact with the health care system. Based on strong scientific evidence, ACIP recommends the adoption of standing-order programs to improve pneumococcal vaccination rates among adults.39 Indeed, standing-order programs may prove a very effective intervention to fulfill the recommendation to administer PCV-13 to adults aged > 65 years.
The Virtual Vaccination Clinic
Unfortunately, with 2 vaccines that have to be administered at different times to various groups of patients at risk, the current state of pneumococcal vaccination may be too complex to be readily reduced to a comprehensible set of standing orders. An innovative way to realize the benefit of standing orders is to target high-risk groups for pneumococcal disease who are eligible for vaccination by selecting them using the EMR and entering standing orders tailored to their specific vaccination needs. The selection of patients according to comorbidities and vaccination status and the determination of the appropriate pneumococcal vaccine takes place in the context of a “virtual” vaccination clinic.40
Enhancing Vaccinations
Further improvement in pneumococcal vaccination rates are likely to result from interventions that increase the demand for vaccines among patients and practitioners. Efforts to disseminate information and provide advice regarding pneumococcal vaccination are likely to result in patients seeking and clinicians offering the appropriate vaccine. Similarly, interventions to enhance the supply of vaccines at the point of care may reduce barriers that patients might encounter when attempting to receive vaccinations.
Another set of system-based interventions that can assist clinicians in making timely and appropriate vaccination decisions are EMR reminders, especially those targeting patients at high risk for pneumococcal disease because of underlying illnesses.41 Previous experience with pneumococcal vaccination in patients aged > 65 years indicates that EMR reminders facilitate improvements in vaccination. The involvement of a panel manager who coordinated with the primary care provider and contacted patients directly augmented the effect of the EMR reminder by 25%.42
Related: Venous Thromboembolism Prophylaxis in Acutely Ill Veterans With Respiratory Disease
Patient reminder and recall systems also demonstrated effectiveness in improving immunization rates.43 In certain groups, notification of patients has been achieved through electronic methods, such as short text messaging or e-mail.44 Determining which interventions within a bundle are essential may be impossible, because the various interventions reinforce one another, and the likelihood of patients benefitting from at least one of the activities increases when multiple interventions are administered together. Therefore, the Task Force on Community Preventive Services supports combining provider reminder systems with education and other measures that encourage use of vaccines in patients and providers.45
Box answer key: 1: A; 2: A; 3: B; 4: A.
Conclusion
The increasing role of vaccines in the health maintenance of adults represents a change in paradigm for primary care and specialty providers. Physicians must assess the value and limitations of vaccines and find time to discuss immunizations with their adult patients. Health care systems can increase opportunities for vaccination and facilitate encounters that result in vaccination by educating patients and health care personnel and through the innovative use of reminders and standing orders in the EMR. Undertaking these activities may limit the burden of pneumococcal disease, an important cause of morbidity and mortality in adults that is preventable through immunization.
Acknowledgements
This work is dedicated to the memory of John M. Rieger, Information Technology Specialist at the Cleveland VAMC and Chief Master Sergeant, Air Force Reserve.
Author Disclosure
This work was supported by a research grant from Pfizer and by the Louis Stokes Cleveland VAMC, the VISN 10 Geriatric Research Education and Clinical Center, and the Clinical and Translational Science Collaborative of Cleveland (award UL1TR000439 from the National Center for Advancing Translational Sciences of the National Institutes of Health NIH). The content is the responsibility of the authors and does not represent the official views of the NIH or the VA.
Disclaimer
The opinions expressed herein are those of the authors and do not necessarily reflect those of Federal Practitioner, Frontline Medical Communications Inc., the U.S. Government, or any of its agencies. This article may discuss unlabeled or investigational use of certain drugs. Please review complete prescribing information for specific drugs or drug combinations—including indications, contraindications, warnings, and adverse effects—before administering pharmacologic therapy to patients.
1. Bogaert D, De Groot R, Hermans PW. Streptococcus pneumoniae colonisation: the key to pneumococcal disease. Lancet Infect Dis. 2004;4(3):144-154.
2. Tilghman RC, Finland M. Clinical significance of bacteremia in pneumococcic pneumonia. Arch Intern Med (Chic). 1937;59(4):602-619.
3. Jones RN, Jacobs MR, Sader HS. Evolving trends in Streptococcus pneumoniae resistance: implications for therapy of community-acquired bacterial pneumonia. Int J Antimicrob Agents. 2010;36(3):197-204.
4. Lexau CA, Lynfield R, Danila R, et al; Active Bacterial Core Surveillance Team. Changing epidemiology of invasive pneumococcal disease among older adults in the era of pediatric pneumococcal conjugate vaccine. JAMA. 2005;294(16):2043-2051.
5. Musher DM. How effective is vaccination in preventing pneumococcal disease? Infect Dis Clin North Am. 2013;27(1):229-241.
6. Macleod CM, Hodges RG, Heidelberger M, Bernhard WG. Prevention of pneumococcal pneumonia by immunization with specific capsular polysaccharides. J Exp Med. 1945;82(6):445-465.
7. Austrian R, Gold J. Pneumococcal bacteremia with especial reference to bacteremic pneumococcal pneumonia. Ann Intern Med. 1964;60:759-776.
8. Austrian R. The Jeremiah Metzger Lecture: Of gold and pneumococci: a history of pneumococcal vaccines in South Africa. Trans Am Clin Climatol Assoc. 1978;89:141-161.
9. Centers for Disease Control (CDC). Pneumococcal polysaccharide vaccine. MMWR Morb Mortal Wkly Rep. 1981;30(33):410-412, 417-419.
10. Moberley S, Holden J, Tatham DP, Andrews RM. Vaccines for preventing pneumococcal infection in adults. Cochrane Database Syst Rev. 2013;1:CD000422.
11. Huss A, Scott P, Stuck AE, Trotter C, Egger M. Efficacy of pneumococcal vaccination in adults: a meta-analysis. CMAJ. 2009;180(1):48-58.
12. Maruyama T, Taguchi O, Niederman MS, et al. Efficacy of 23-valent pneumococcal vaccine in preventing pneumonia and improving survival in nursing home residents: double blind, randomised and placebo controlled trial. BMJ. 2010;340:c1004.
13. Shapiro ED, Berg AT, Austrian R, et al. The protective efficacy of polyvalent pneumococcal polysaccharide vaccine. N Eng J Med. 1991;325(21):1453-1460.
14. Musher DM, Sampath R, Rodriguez-Barradas MC. The potential role for protein-conjugate pneumococcal vaccine in adults: what is the supporting evidence? Clin Infect Dis. 2011;52(5):633-640.
15. Advisory Committee on Immunization Practices. Preventing pneumococcal disease among infants and young children. Recommendations of the Advisory Committee on Immunization Practices (ACIP). MMWR Recomm Rep. 2000;49(RR-9):1-35.
16. Griffin MR, Zhu Y, Moore MR, Whitney CG, Grijalva CG. U.S. hospitalizations for pneumonia after a decade of pneumococcal vaccination. N Eng J Med. 2013;369(2):155-163.
17. Nuorti JP, Whitney CG, Centers for Disease Control and Prevention (CDC). Prevention of pneumococcal disease among infants and children - use of 13-valent pneumococcal conjugate vaccine and 23-valent pneumococcal polysaccharide vaccine - recommendations of the Advisory Committee on Immunization Practices (ACIP). MMWR Recomm Rep. 2010;59(RR-11):1-18.
18. Centers for Disease Control and Prevention (CDC). Licensure of a 13-valent pneumococcal conjugate vaccine (PCV13) and recommendations for use among children--Advisory Committee on Immunization Practices (ACIP), 2010. MMWR Morb Mortal Wkly Rep. 2010;59(9):258-261.
19. Iroh Tam PY, Madoff LC, Coombes B, Pelton SI. Invasive pneumococcal disease after implementation of 13-valent conjugate vaccine. Pediatrics. 2014;134(2):210-217.
20. Waight PA, Andrews NJ, Ladhani SN, Sheppard CL, Slack MP, Miller E. Effect of the 13-valent pneumococcal conjugate vaccine on invasive pneumococcal disease in England and Wales 4 years after its introduction: an observational cohort study. Lancet Infect Dis. 2015;15(5):535-543.
21. French N, Nakiyingi J, Carpenter LM, et al. 23-valent pneumococcal polysaccharide vaccine in HIV-1-infected Ugandan adults: double-blind, randomised and placebo controlled trial. Lancet. 2000;355(9221):2106-2111.
22. French N, Gordon SB, Mwalukomo T, et al. A trial of a 7-valent pneumococcal conjugate vaccine in HIV-infected adults. N Eng J Med. 2010;362(9):812-822.
23. Centers for Disease Control and Prevention (CDC). Use of 13-valent pneumococcal conjugate vaccine and 23-valent pneumococcal polysaccharide vaccine for adults with immunocompromising conditions: recommendations of the Advisory Committee on Immunization Practices (ACIP). MMWR Morb Mortal Wkly Rep. 2012;61(40):816-819.
24. Paradiso PR. Pneumococcal conjugate vaccine for adults: a new paradigm. Clin Infect Dis. 2012;55(2):259-264.
25. Musher DM. Editorial commentary: should 13-valent protein-conjugate pneumococcal vaccine be used routinely in adults? Clin Infect Dis. 2012;55(2):265-267.
26. Bonten MJ, Huijts SM, Bolkenbaas M, et al. Polysaccharide conjugate vaccine against pneumococcal pneumonia in adults. N Eng J Med. 2015;372(12):1114-1125.
27. Tomczyk S, Bennett NM, Stoecker C, et al; Centers for Disease Control and Prevention (CDC). Use of 13-valent pneumococcal conjugate vaccine and 23-valent pneumococcal polysaccharide vaccine among adults aged ≥ 65 years: recommendations of the Advisory Committee on Immunization Practices (ACIP). MMWR Morb Mortal Wkly Rep. 2014;63(37):822-825.
28. Grabenstein JD. Effectiveness and serotype coverage: key criteria for pneumococcal vaccines for adults. Clin Infect Dis. 2012;55(2):255-258.
29. Jackson LA, Gurtman A, van Cleeff M, et al. Influence of initial vaccination with 13-valent pneumococcal conjugate vaccine or 23-valent pneumococcal polysaccharide vaccine on anti-pneumococcal responses following subsequent pneumococcal vaccination in adults 50 years and older. Vaccine. 2013;31(35):3594-3602.
30. Greenberg RN, Gurtman A, Frenck RW, et al. Sequential administration of 13-valent pneumococcal conjugate vaccine and 23-valent pneumococcal polysaccharide vaccine in pneumococcal vaccine-naïve adults 60-64 years of age. Vaccine. 2014;32(20):2364-2374.
31. Kobayashi M, Bennett NM, Gierke R, et al. Intervals between PCV13 and PPSV23 vaccines: recommendations of the Advisory Committee on Immunization Practices (ACIP). MMWR Morb Mortal Wkly Rep. 2015;64(34):944-947.
32. Walton LR, Orenstein WA, Pickering LK. Lessons learned from making and implementing vaccine recommendations in the U.S. Am J Prev Med. 2015;pii:S0749-3797(15)00333-00335 [Epub ahead of print].
33. Cho BH, Stoecker C, Link-Gelles R, Moore MR. Cost-effectiveness of administering 13-valent pneumococcal conjugate vaccine in addition to 23-valent pneumococcal polysaccharide vaccine to adults with immunocompromising conditions. Vaccine. 2013;31(50):6011-6021.
34. Smith KJ, Nowalk MP, Raymund M, Zimmerman RK. Cost-effectiveness of pneumococcal conjugate vaccination in immunocompromised adults. Vaccine. 2013;31(37):3950-3956.
35. Smith KJ, Wateska AR, Nowalk MP, Raymund M, Nuorti JP, Zimmerman RK. Cost-effectiveness of adult vaccination strategies using pneumococcal conjugate vaccine compared with pneumococcal polysaccharide vaccine. JAMA. 2012;307(8):804-812.
36. Kyaw MH, Greene CM, Schaffner W, et al; Active Bacterial Core Surveillance Program of the Emerging Infections Program Network. Adults with invasive pneumococcal disease: missed opportunities for vaccination. Am J Prev Med. 2006;31(4):286-292.
37. Williams WW, Lu PJ, O'Halloran A, et al; Centers for Disease Control and Prevention (CDC). Vaccination coverage among adults, excluding influenza vaccination - United States, 2013. MMWR Morb Mortal Wkly Rep. 2015;64(4):95-102.
38. Committee on Review of Priorities in the National Vaccine Plan, Institute of Medicine. Priorities for the National Vaccine Plan. Washington, DC: National Academies Press; 2010.
39. McKibben LJ, Stange PV, Sneller VP, Strikas RA, Rodewald LE; Advisory Committee on Immunization Practices. Use of standing orders programs to increase adult vaccination rates. MMWR Recomm Rep. 2000;49(RR-1):15-16.
40. Jump RLP, Banks R, Wilson B, et al. A virtual clinic improves pneumococcal vaccination for asplenic veterans at high-risk for pneumococcal disease. Open Forum Infect Dis. In press.
41. Ledwich LJ, Harrington TM, Ayoub WT, Sartorius JA, Newman ED. Improved influenza and pneumococcal vaccination in rheumatology patients taking immunosuppressants using an electronic health record best practice alert. Arthritis Rheum. 2009;61(11):1505-1510.
42. Loo TS, Davis RB, Lipsitz LA, et al. Electronic medical record reminders and panel management to improve primary care of elderly patients. Arch Intern Med. 2011;171(17):1552-1558.
43. Jacobson Vann JC, Szilagyi P. Patient reminder and patient recall systems to improve immunization rates. Cochrane Database Syst Rev. 2005;(3):CD003941.
44. Ghadieh AS, Hamadeh GN, Mahmassani DM, Lakkis NA. The effect of various types of patients' reminders on the uptake of pneumococcal vaccine in adults: a randomized controlled trial. Vaccine. 2015;33(43):5868-5872.
45. Ndiaye SM, Hopkins DP, Shefer AM, et al; Task Force on Community Preventive Services. Interventions to improve influenza, pneumococcal polysaccharide, and hepatitis B vaccination coverage among high-risk adults: a systematic review. Am J Prev Med. 2005;28(5)(suppl):248-279.
Streptococcus pneumoniae (S pneumoniae), also known as pneumococcus, is a successful human pathogen with significant clinical impact that causes pneumonia and invasive infections, including bacteremia and meningitis.1 In the preantibiotic era, nearly 80% of patients with bacteremic pneumococcal pneumonia died.2 The introduction of sulfas and penicillin in the mid-20th century, subsequent refinements in antibiotic chemotherapy, and improvements in supportive care rendered pneumococcal disease readily treatable, notwithstanding the threat of antibiotic-resistant pneumococcus.3 Despite the availability of effective antibiotic therapy against S pneumoniae, pneumococcal disease remains a significant cause of morbidity and mortality among people with increased susceptibility, such as older adults and those living with chronic illness or immunosuppressive conditions. In developed countries like the U.S., where a growing portion of the population is vulnerable to S pneumoniae by virtue of their advanced age and underlying medical conditions, pneumococcal disease is still an important public health concern.4
Penumococcal Vaccines: A Long Time Coming
Vaccination against S pneumoniae has proven an efficacious strategy to reduce the morbidity and mortality associated with this pathogen.5 The original efforts to develop a pneumococcal vaccine culminated in 1945 with a vaccine containing pneumococcal capsular polysaccharides, which elicited a protective immune response among U.S. soldiers (Table 1).Subsequent investigations determined that the protective response was specific to pneumococcal disease caused by the 4 pneumococcal capsular serotypes included in the vaccine, that the carrier rate of pneumococcus with the vaccine serotypes decreased by about 50%, and that the incidence of pneumonia from the vaccine serotypes was reduced even in nonimmunized soldiers.6 These early observations remain relevant to our contemporary understanding of the impact of pneumococcal vaccination: Protection is limited to serotypes included in the vaccine; the vaccine reduces colonization; and the vaccine leads to herd immunity—the protection of unvaccinated subjects.
Despite this achievement, the use of vaccines as a strategy to combat pneumococcal disease was upstaged in the subsequent decades by the success of antibiotics. Renewed interest in pneumococcal vaccines resulted from the efforts of Robert Austrian, MD, who astutely observed that “highly effective antimicrobial drugs must be supplemented by other measures, both prophylactic and therapeutic, if the significant mortality resulting still from pneumococcal infection is to be reduced.”7
After initial studies carried out in South African gold miners, the FDA approved a pneumococcal polysaccharide vaccine (PPSV) against 23 of about 90 circulating serotypes.8 The CDC and the Advisory Committee on Immunization Practices (ACIP) initially recommended PPSV-23 for persons perceived to be at high risk for pneumococcal disease, including those with chronic diseases, immunocompromising conditions, and older adults.9
Three decades later, the analysis of a large body of available evidence demonstrated the protective effects of PPSV-23 against invasive pneumococcal disease caused by pneumococcal types included in the vaccine, especially bacteremic pneumonia (about 75% reduction, odds ratio [OR] 0.26, 95% confidence interval [CI] 0.14-0.45).10 A perceived shortcoming of PPSV-23, which some experts dispute, is the lack of definite protection against nonbacteremic pneumococcal pneumonia.11 Studies of nursing home residents demonstrated a 50% reduction in the incidence of both pneumococcal pneumonia and all-cause pneumonia, suggesting that PPSV-23 offers protection against noninvasive pneumococcal pneumonia in specific populations.12 Additional potential limitations of PPSV-23 include reduced benefit in patients aged > 65 years and waning of protection over time.13
Related: Identification and Management of Middle East Respiratory Syndrome
Protein-Conjugate Vaccines
Clearly, the most important limitation of PPSV-23, inherent to all capsular polysaccharide vaccines, is that it does not elicit an immune response in children aged < 2 years. The successful development of a vaccine against Haemophilus influenzae type b (Hib) gave rise to a new generation of pneumococcal vaccines.14 Specifically, the Hib vaccine covalently binds, or conjugates, the capsule polysaccharide to an antigenic protein, leading to effective T-cell–mediated antibody production in infants and toddlers.
In 2000, children received the first iteration of a protein-conjugate vaccine containing the 7 most relevant pneumococcal serotypes (PCV-7).15 The effects of PCV-7 on pneumococcal disease have been extraordinary, practically eliminating infections caused by the pneumococcal serotypes included in the vaccine. Immunizing children with PCV-7 also ushered in a fundamental public health benefit for adults aged > 65 years: a reduction of nearly 90% in the incidence of pneumococcal infections caused by serotypes included in the vaccine. By eliciting mucosal immunity, which leads to decreased nasal carriage of the covered pneumococcal strains among children, PVC-7 generates herd immunity, leading to reductions in transmission, colonization, and infection with vaccine serotypes among adults.16
In 2010, a conjugate vaccine containing 13 serotypes (PCV-13) replaced PCV-7 administration for children.17,18 The PCV-13 is expected to protect children and the herd from disease caused by 6 additional pneumococcal serotypes, including those that surged as replacement strains, filling the ecologic niche created by PCV-7, such as the epidemiologically relevant serotype 19A.19,20
Immune-Compromised Adults
One of the shortcomings of PPSV-23 is its lack of efficacy in patients with advanced HIV, a group with an exquisite vulnerability to pneumococcal disease, as demonstrated by a randomized controlled trial of PPSV-23 in African patients with advanced, untreated HIV infection.21 Similarly, there is concern that patients with lymphoma, leukemia, multiple myeloma, and Hodgkin disease, also at high risk of pneumococcal infection, do not mount sufficient immune responses to polysaccharide antigens or that these responses are adversely affected by chemotherapy or immune suppressing medications. In these populations, a conjugate vaccine (PCV-7 or PCV-13) may elicit a more robust and durable immune response than a polysaccharide vaccine (PPSV-23). A randomized placebo-controlled trial demonstrated the efficacy of PCV-7 in protecting patients with advanced HIV against pneumococcal disease in Africa.22 Based in part on this observation, the ACIP now recommends the use of PCV-13 in patients with HIV and other immunosuppressing conditions, including chronic renal failure.23 A direct comparison of the relative protection of PPSV-23 vs PCV-7 in this population has not been performed.
Pneumococcal Vaccines in the Elderly
Although PPSV-23 was widely adopted in the U.S. with the intention to protect adults aged > 65 years from pneumococcal infection, this vaccine did not achieve global appeal. In the Netherlands, for instance, PPSV-23 had very low penetration and was never endorsed by public health authorities. Concerns have been issued about the decreased immunogenicity of a polysaccharide vaccine in older adults, invoking the concept of immune senescence, a term that describes a diminished capacity to mount robust immune responses due to aging.
Protein-conjugated antigens, on the other hand, can elicit a better initial immune response than a polysaccharide vaccine can in an older adult. Whether the effect is sustained and translates to better clinical outcomes remains unknown. The adoption of PCV-13 and the continued role of PPSV-23 in adults aged > 65 years have been examined carefully by experts.24,25
Dutch investigators organized the Community Acquired Pneumonia Immunization Trial in Adults (CAPITA), randomizing about 85,000 adults aged > 65 years toreceive eitherPCV-13 or a placebo.26 After 3 years of observation, the occurrence of invasive pneumococcal disease (caused by the vaccine serotypes) decreased by 85% in participants who received the vaccine compared with those who received a placebo. Additionally, the incidence of pneumococcal pneumonia (caused by the vaccine serotypes) decreased by 45% (Table 2). The findings of this trial largely inform the recommendation issued by APIC in October 2014 to administer PCV-13 vaccine to adults aged > 65 years.27
Polysaccharide Vaccine in Adults
A crucial limitation of the CAPITA study is that it does not provide a head-to-head comparison with PPSV-23. Similarly, the recommendation to use PCV-13 in patients with immune system compromising conditions did not arise from a direct comparison between PCV-13 and PPSV-23. In both groups of patients, ACIP continues to recommend PPSV-23 to extend protection to the 10 additional pneumococcal serotypes not included in PCV-13.28 Additionally, ACIP maintains its long-standing recommendation to administer PPSV-23 to adults aged < 65 years who have diabetes mellitus, or chronic liver, lung, or heart disease, or those who are tobacco smokers or misuse alcohol.
Notably, the order in which the vaccines are administered may influence their effectiveness. In adults aged 50 to 64 years, initial vaccination with PCV-13 followed by PPSV-23 lead to a better antipneumococcal immune response.14,29 Specifically, PCV-13 enhanced the response to subsequent administration of PPSV-23, whereas an initial PPSV-23 vaccine resulted in a decreased response to subsequent administration of PCV-13. After a 1-year interval between vaccines, immune titers to a second vaccination were not inferior.30 All the above considerations have shaped the ACIP recommendations for the administration of pneumococcal vaccines.27,31 Pneumococcal vaccination was a straightforward exercise when PPSV-23 was the only vaccine available for adults. The advent of PCV-13, however, renders pneumococcal immunization of adults more complicated (Figure 1).
Improving Vaccination Rates
The complex recommendations to vaccinate adults against pneumococcus may reveal obstacles to effective pneumococcal vaccination programs.32 From the perspective of health care institutions, the adoption of the new pneumococcal vaccine implies an added cost. A pneumococcal vaccination strategy that incorporates PCV-13 may be cost-effective, at least under certain parameters.33-35 There remains, however, the issue of affordability and the opportunity cost—the need to decrease funding for other health care programs to accommodate an increased budget for pneumococcal vaccination. Logistically, maintaining a reliable supply of vaccines to meet the demand of practitioners at various sites requires careful planning. Consequently, tracking vaccinated and unvaccinated patients and carefully coordinating among clinical providers, nurses, and pharmacists are essential.
From the perspective of clinical providers, an additional pneumococcal vaccine complicating the vaccination schedule for adults represents an increased burden. Providers will need information to reach their own conclusions regarding the rationale behind the development and use of pneumococcal conjugate vaccines, the existing and evolving recommendations from public health authorities, and the strengths and limitations of the evidence supporting the use of pneumococcal vaccines. Otherwise, providers may find it difficult to incorporate new data and guidelines supporting pneumococcal vaccination into their decision-making (Boxes 1-4). An additional and formidable challenge is to carve out time during an already busy clinical encounter to discuss pneumococcal vaccines and other immunizations.36
Related: The Importance of an Antimicrobial Stewardship Program
Similarly, older adults or patients with chronic health conditions may not recognize the important role that vaccines can play in their health maintenance and are likely to prioritize other issues during medical visits. It is not obvious for patients that multiple vaccines may be necessary to prevent pneumococcal disease. Furthermore, many patients, not unreasonably, may assume that their yearly influenza vaccine is sufficiently protective against pneumonia. Therefore, patients need to be educated about the rationale behind pneumococcal conjugate vaccination. Ultimately, access to immunization—the opportunity for patients to have an encounter with their providers and with the health care system that results in the administration of an appropriate vaccine—will determine whether goals for pneumococcal vaccination are achieved.
The evolving landscape for the implementation of pneumococcal vaccines creates the need to develop, implement, and refine organizational changes to adhere to the new guidelines for the use of PCV-13 and PPSV-23 vaccines. These interventions, if effective, may help improve pneumococcal vaccination coverage among adults (Table 3).
Harnessing the Power of the EMR
Interventions to improve the adherence to pneumococcal vaccination guidelines begin by identifying persons eligible for vaccination based on their age, their vaccination status (ie, persons previously unvaccinated or due for vaccination according to the recommended schedule), or the presence of medical conditions conferring high risk for pneumococcal disease. This, in turn, depends on adequate documentation of patients’ underlying medical diagnosis, as well as up-to-date records of vaccine administration to patients.
Health care systems possessing a mature and sophisticated electronic medical record (EMR), such as the VHA Computerized Patient Record System (CPRS), are in a good position to wield such information to plan, implement, and assure the quality of activities designed to improve pneumococcal vaccination rates. An analysis of the proportion of veterans in VISN 10 who received pneumococcal vaccination revealed that even with the advantages of a robust EMR and a highly developed infrastructure devoted to primary care, pneumococcal vaccine coverage remains below the 60% target goal, although well above national averages (Figure 2).37,38
Standing Orders
Standing orders make it possible for nurses and pharmacists to administer vaccines according to a preestablished protocol without a physician’s direct evaluation of each patient. Standing orders are a versatile intervention, with a record of effective implementation in both outpatient and inpatient facilities, in acute-care and long-term care facilities, and in most instances where patients interact with the health care system. Based on strong scientific evidence, ACIP recommends the adoption of standing-order programs to improve pneumococcal vaccination rates among adults.39 Indeed, standing-order programs may prove a very effective intervention to fulfill the recommendation to administer PCV-13 to adults aged > 65 years.
The Virtual Vaccination Clinic
Unfortunately, with 2 vaccines that have to be administered at different times to various groups of patients at risk, the current state of pneumococcal vaccination may be too complex to be readily reduced to a comprehensible set of standing orders. An innovative way to realize the benefit of standing orders is to target high-risk groups for pneumococcal disease who are eligible for vaccination by selecting them using the EMR and entering standing orders tailored to their specific vaccination needs. The selection of patients according to comorbidities and vaccination status and the determination of the appropriate pneumococcal vaccine takes place in the context of a “virtual” vaccination clinic.40
Enhancing Vaccinations
Further improvement in pneumococcal vaccination rates are likely to result from interventions that increase the demand for vaccines among patients and practitioners. Efforts to disseminate information and provide advice regarding pneumococcal vaccination are likely to result in patients seeking and clinicians offering the appropriate vaccine. Similarly, interventions to enhance the supply of vaccines at the point of care may reduce barriers that patients might encounter when attempting to receive vaccinations.
Another set of system-based interventions that can assist clinicians in making timely and appropriate vaccination decisions are EMR reminders, especially those targeting patients at high risk for pneumococcal disease because of underlying illnesses.41 Previous experience with pneumococcal vaccination in patients aged > 65 years indicates that EMR reminders facilitate improvements in vaccination. The involvement of a panel manager who coordinated with the primary care provider and contacted patients directly augmented the effect of the EMR reminder by 25%.42
Related: Venous Thromboembolism Prophylaxis in Acutely Ill Veterans With Respiratory Disease
Patient reminder and recall systems also demonstrated effectiveness in improving immunization rates.43 In certain groups, notification of patients has been achieved through electronic methods, such as short text messaging or e-mail.44 Determining which interventions within a bundle are essential may be impossible, because the various interventions reinforce one another, and the likelihood of patients benefitting from at least one of the activities increases when multiple interventions are administered together. Therefore, the Task Force on Community Preventive Services supports combining provider reminder systems with education and other measures that encourage use of vaccines in patients and providers.45
Box answer key: 1: A; 2: A; 3: B; 4: A.
Conclusion
The increasing role of vaccines in the health maintenance of adults represents a change in paradigm for primary care and specialty providers. Physicians must assess the value and limitations of vaccines and find time to discuss immunizations with their adult patients. Health care systems can increase opportunities for vaccination and facilitate encounters that result in vaccination by educating patients and health care personnel and through the innovative use of reminders and standing orders in the EMR. Undertaking these activities may limit the burden of pneumococcal disease, an important cause of morbidity and mortality in adults that is preventable through immunization.
Acknowledgements
This work is dedicated to the memory of John M. Rieger, Information Technology Specialist at the Cleveland VAMC and Chief Master Sergeant, Air Force Reserve.
Author Disclosure
This work was supported by a research grant from Pfizer and by the Louis Stokes Cleveland VAMC, the VISN 10 Geriatric Research Education and Clinical Center, and the Clinical and Translational Science Collaborative of Cleveland (award UL1TR000439 from the National Center for Advancing Translational Sciences of the National Institutes of Health NIH). The content is the responsibility of the authors and does not represent the official views of the NIH or the VA.
Disclaimer
The opinions expressed herein are those of the authors and do not necessarily reflect those of Federal Practitioner, Frontline Medical Communications Inc., the U.S. Government, or any of its agencies. This article may discuss unlabeled or investigational use of certain drugs. Please review complete prescribing information for specific drugs or drug combinations—including indications, contraindications, warnings, and adverse effects—before administering pharmacologic therapy to patients.
1. Bogaert D, De Groot R, Hermans PW. Streptococcus pneumoniae colonisation: the key to pneumococcal disease. Lancet Infect Dis. 2004;4(3):144-154.
2. Tilghman RC, Finland M. Clinical significance of bacteremia in pneumococcic pneumonia. Arch Intern Med (Chic). 1937;59(4):602-619.
3. Jones RN, Jacobs MR, Sader HS. Evolving trends in Streptococcus pneumoniae resistance: implications for therapy of community-acquired bacterial pneumonia. Int J Antimicrob Agents. 2010;36(3):197-204.
4. Lexau CA, Lynfield R, Danila R, et al; Active Bacterial Core Surveillance Team. Changing epidemiology of invasive pneumococcal disease among older adults in the era of pediatric pneumococcal conjugate vaccine. JAMA. 2005;294(16):2043-2051.
5. Musher DM. How effective is vaccination in preventing pneumococcal disease? Infect Dis Clin North Am. 2013;27(1):229-241.
6. Macleod CM, Hodges RG, Heidelberger M, Bernhard WG. Prevention of pneumococcal pneumonia by immunization with specific capsular polysaccharides. J Exp Med. 1945;82(6):445-465.
7. Austrian R, Gold J. Pneumococcal bacteremia with especial reference to bacteremic pneumococcal pneumonia. Ann Intern Med. 1964;60:759-776.
8. Austrian R. The Jeremiah Metzger Lecture: Of gold and pneumococci: a history of pneumococcal vaccines in South Africa. Trans Am Clin Climatol Assoc. 1978;89:141-161.
9. Centers for Disease Control (CDC). Pneumococcal polysaccharide vaccine. MMWR Morb Mortal Wkly Rep. 1981;30(33):410-412, 417-419.
10. Moberley S, Holden J, Tatham DP, Andrews RM. Vaccines for preventing pneumococcal infection in adults. Cochrane Database Syst Rev. 2013;1:CD000422.
11. Huss A, Scott P, Stuck AE, Trotter C, Egger M. Efficacy of pneumococcal vaccination in adults: a meta-analysis. CMAJ. 2009;180(1):48-58.
12. Maruyama T, Taguchi O, Niederman MS, et al. Efficacy of 23-valent pneumococcal vaccine in preventing pneumonia and improving survival in nursing home residents: double blind, randomised and placebo controlled trial. BMJ. 2010;340:c1004.
13. Shapiro ED, Berg AT, Austrian R, et al. The protective efficacy of polyvalent pneumococcal polysaccharide vaccine. N Eng J Med. 1991;325(21):1453-1460.
14. Musher DM, Sampath R, Rodriguez-Barradas MC. The potential role for protein-conjugate pneumococcal vaccine in adults: what is the supporting evidence? Clin Infect Dis. 2011;52(5):633-640.
15. Advisory Committee on Immunization Practices. Preventing pneumococcal disease among infants and young children. Recommendations of the Advisory Committee on Immunization Practices (ACIP). MMWR Recomm Rep. 2000;49(RR-9):1-35.
16. Griffin MR, Zhu Y, Moore MR, Whitney CG, Grijalva CG. U.S. hospitalizations for pneumonia after a decade of pneumococcal vaccination. N Eng J Med. 2013;369(2):155-163.
17. Nuorti JP, Whitney CG, Centers for Disease Control and Prevention (CDC). Prevention of pneumococcal disease among infants and children - use of 13-valent pneumococcal conjugate vaccine and 23-valent pneumococcal polysaccharide vaccine - recommendations of the Advisory Committee on Immunization Practices (ACIP). MMWR Recomm Rep. 2010;59(RR-11):1-18.
18. Centers for Disease Control and Prevention (CDC). Licensure of a 13-valent pneumococcal conjugate vaccine (PCV13) and recommendations for use among children--Advisory Committee on Immunization Practices (ACIP), 2010. MMWR Morb Mortal Wkly Rep. 2010;59(9):258-261.
19. Iroh Tam PY, Madoff LC, Coombes B, Pelton SI. Invasive pneumococcal disease after implementation of 13-valent conjugate vaccine. Pediatrics. 2014;134(2):210-217.
20. Waight PA, Andrews NJ, Ladhani SN, Sheppard CL, Slack MP, Miller E. Effect of the 13-valent pneumococcal conjugate vaccine on invasive pneumococcal disease in England and Wales 4 years after its introduction: an observational cohort study. Lancet Infect Dis. 2015;15(5):535-543.
21. French N, Nakiyingi J, Carpenter LM, et al. 23-valent pneumococcal polysaccharide vaccine in HIV-1-infected Ugandan adults: double-blind, randomised and placebo controlled trial. Lancet. 2000;355(9221):2106-2111.
22. French N, Gordon SB, Mwalukomo T, et al. A trial of a 7-valent pneumococcal conjugate vaccine in HIV-infected adults. N Eng J Med. 2010;362(9):812-822.
23. Centers for Disease Control and Prevention (CDC). Use of 13-valent pneumococcal conjugate vaccine and 23-valent pneumococcal polysaccharide vaccine for adults with immunocompromising conditions: recommendations of the Advisory Committee on Immunization Practices (ACIP). MMWR Morb Mortal Wkly Rep. 2012;61(40):816-819.
24. Paradiso PR. Pneumococcal conjugate vaccine for adults: a new paradigm. Clin Infect Dis. 2012;55(2):259-264.
25. Musher DM. Editorial commentary: should 13-valent protein-conjugate pneumococcal vaccine be used routinely in adults? Clin Infect Dis. 2012;55(2):265-267.
26. Bonten MJ, Huijts SM, Bolkenbaas M, et al. Polysaccharide conjugate vaccine against pneumococcal pneumonia in adults. N Eng J Med. 2015;372(12):1114-1125.
27. Tomczyk S, Bennett NM, Stoecker C, et al; Centers for Disease Control and Prevention (CDC). Use of 13-valent pneumococcal conjugate vaccine and 23-valent pneumococcal polysaccharide vaccine among adults aged ≥ 65 years: recommendations of the Advisory Committee on Immunization Practices (ACIP). MMWR Morb Mortal Wkly Rep. 2014;63(37):822-825.
28. Grabenstein JD. Effectiveness and serotype coverage: key criteria for pneumococcal vaccines for adults. Clin Infect Dis. 2012;55(2):255-258.
29. Jackson LA, Gurtman A, van Cleeff M, et al. Influence of initial vaccination with 13-valent pneumococcal conjugate vaccine or 23-valent pneumococcal polysaccharide vaccine on anti-pneumococcal responses following subsequent pneumococcal vaccination in adults 50 years and older. Vaccine. 2013;31(35):3594-3602.
30. Greenberg RN, Gurtman A, Frenck RW, et al. Sequential administration of 13-valent pneumococcal conjugate vaccine and 23-valent pneumococcal polysaccharide vaccine in pneumococcal vaccine-naïve adults 60-64 years of age. Vaccine. 2014;32(20):2364-2374.
31. Kobayashi M, Bennett NM, Gierke R, et al. Intervals between PCV13 and PPSV23 vaccines: recommendations of the Advisory Committee on Immunization Practices (ACIP). MMWR Morb Mortal Wkly Rep. 2015;64(34):944-947.
32. Walton LR, Orenstein WA, Pickering LK. Lessons learned from making and implementing vaccine recommendations in the U.S. Am J Prev Med. 2015;pii:S0749-3797(15)00333-00335 [Epub ahead of print].
33. Cho BH, Stoecker C, Link-Gelles R, Moore MR. Cost-effectiveness of administering 13-valent pneumococcal conjugate vaccine in addition to 23-valent pneumococcal polysaccharide vaccine to adults with immunocompromising conditions. Vaccine. 2013;31(50):6011-6021.
34. Smith KJ, Nowalk MP, Raymund M, Zimmerman RK. Cost-effectiveness of pneumococcal conjugate vaccination in immunocompromised adults. Vaccine. 2013;31(37):3950-3956.
35. Smith KJ, Wateska AR, Nowalk MP, Raymund M, Nuorti JP, Zimmerman RK. Cost-effectiveness of adult vaccination strategies using pneumococcal conjugate vaccine compared with pneumococcal polysaccharide vaccine. JAMA. 2012;307(8):804-812.
36. Kyaw MH, Greene CM, Schaffner W, et al; Active Bacterial Core Surveillance Program of the Emerging Infections Program Network. Adults with invasive pneumococcal disease: missed opportunities for vaccination. Am J Prev Med. 2006;31(4):286-292.
37. Williams WW, Lu PJ, O'Halloran A, et al; Centers for Disease Control and Prevention (CDC). Vaccination coverage among adults, excluding influenza vaccination - United States, 2013. MMWR Morb Mortal Wkly Rep. 2015;64(4):95-102.
38. Committee on Review of Priorities in the National Vaccine Plan, Institute of Medicine. Priorities for the National Vaccine Plan. Washington, DC: National Academies Press; 2010.
39. McKibben LJ, Stange PV, Sneller VP, Strikas RA, Rodewald LE; Advisory Committee on Immunization Practices. Use of standing orders programs to increase adult vaccination rates. MMWR Recomm Rep. 2000;49(RR-1):15-16.
40. Jump RLP, Banks R, Wilson B, et al. A virtual clinic improves pneumococcal vaccination for asplenic veterans at high-risk for pneumococcal disease. Open Forum Infect Dis. In press.
41. Ledwich LJ, Harrington TM, Ayoub WT, Sartorius JA, Newman ED. Improved influenza and pneumococcal vaccination in rheumatology patients taking immunosuppressants using an electronic health record best practice alert. Arthritis Rheum. 2009;61(11):1505-1510.
42. Loo TS, Davis RB, Lipsitz LA, et al. Electronic medical record reminders and panel management to improve primary care of elderly patients. Arch Intern Med. 2011;171(17):1552-1558.
43. Jacobson Vann JC, Szilagyi P. Patient reminder and patient recall systems to improve immunization rates. Cochrane Database Syst Rev. 2005;(3):CD003941.
44. Ghadieh AS, Hamadeh GN, Mahmassani DM, Lakkis NA. The effect of various types of patients' reminders on the uptake of pneumococcal vaccine in adults: a randomized controlled trial. Vaccine. 2015;33(43):5868-5872.
45. Ndiaye SM, Hopkins DP, Shefer AM, et al; Task Force on Community Preventive Services. Interventions to improve influenza, pneumococcal polysaccharide, and hepatitis B vaccination coverage among high-risk adults: a systematic review. Am J Prev Med. 2005;28(5)(suppl):248-279.

Therapeutic Interchange From Rosuvastatin to Atorvastatin in a Veteran Population
Patients with known cardiovascular (CV) disease are at greater risk for CV events.1 Hydroxymethylglutaryl-CoA (HMG Co-A) reductase inhibitors, or statins, have been shown to reduce CV events and to reduce all-cause mortality.1,2 Thus, these agents should be a standard approach to secondary prevention of CV events.1,2 Although the main function of statins is to lower total cholesterol (TC) and low-density lipoprotein cholesterol (LDL-C) levels, trials have shown that other lipid-lowering agents have reduced the incidence of CV events but have failed to show any difference in mortality.1 Thus, the therapeutic effects of statins may be a result of “pleiotropic” effects in addition to a reduction in LDL-C.3
As a result, prescribing practices and professional society guidelines have deferred to statins as a first-line choice for lipid-lowering therapy.1 Although each statin varies in its ability to lower LDL-C and inhibit HMG Co-A reductase, as a class, statins have been proven to be safe and efficacious in reducing LDL-C, decreasing risk of coronary artery disease, and decreasing mortality.
The 2013 American College of Cardiology (ACC) and American Heart Association (AHA) guideline on the treatment of blood cholesterol to reduce CV risk in adults resulted in a major shift in clinical practice recommendations. The focus of treatment has changed from LDL-C and TC goals to stratifying patients to either high-intensity or moderate-intensity statin therapy, based on their comorbidities and risk of atherosclerotic CV disease (ASCVD).1 Primary prevention of CV disease has been proposed for patients with diabetes mellitus aged 40 to 75 years, familial hypercholesterolemia (LDL-C > 190 mg/dL), and for patients with an ASCVD risk score > 7.5%. Secondary prevention has been proposed for all patients with a history of ASCVD. Among the available choices for intensive statin therapy, the 2 most potent regimens are atorvastatin (40-80 mg) and rosuvastatin (20-40 mg) daily. The ACC/AHA guideline recommends high-potency therapy with either rosuvastatin or atorvastatin with equal preference.1
Related: New Incentives for Helping Prevent Heart Disease
Statin therapy is generally well tolerated; however, the use of statins is not without risk of adverse drug reactions (ADRs). Skeletal muscle discomfort has been reported in 4% to 10% of patients taking either atorvastatin or rosuvastatin.4,5 Liver enzyme abnormalities are less common, having been reported in only about 2% to 3% of patients taking either atorvastatin or rosuvastatin.4,5 Although muscle-related intolerance and liver enzyme abnormalities are considered to be class effects, research speculates that the therapeutic and safety effects of statins may differ, based on tissue solubility.2,6 Variability in the myotoxic and hepatotoxic effects of statins has been attributed to differences in tissue solubility, hypothesizing that lipophilic statins are more easily taken up into myocytes and hepatocytes, resulting in an increase in toxic effects.2,6
This study assessed differences in therapeutic and safety endpoints resulting from the recent interchange from rosuvastatin to atorvastatin within the North Florida/South Georgia Veterans Health System (NF/SGVHS). Although both these agents are high-potency HMG Co-A reductase inhibitors and share a mechanism of action, they have pharmacokinetic differences, including a key difference in tissue solubility (Table 1).
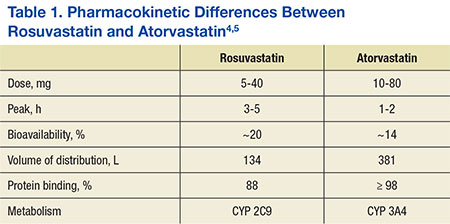
With the availability of low-cost generic atorvastatin in early 2012, the VA Medical Advisory Panel and Pharmacy Benefits Management (VA MAP/PBM) added atorvastatin to the VA National Formulary as the preferred high-potency statin.7,8 Before October 2012, rosuvastatin had been the preferred high-potency statin within the VA. With support from VA MAP/PBM leadership, NF/SGVHS instituted an interchange from rosuvastatin to atorvastatin for cost-savings purposes.9
Before the interchange, the records of patients were reviewed to determine whether justification existed for continued use of rosuvastatin. Patients were converted to atorvastatin if deemed appropriate and received education and consultation through direct patient contact or a letter regarding the interchange. Justifications for continued use of rosuvastatin included documentation of an atorvastatin ADR, active liver disease, or patients taking cyclosporine or certain protease inhibitors.8
The objective of this retrospective evaluation was to assess the efficacy and safety of the interchange from rosuvastatin to atorvastatin within NF/SGVHS. The results of this review are helpful to confirm the efficacy and safety of the interchange and identify any differences in efficacy and safety that may have occurred as a result of the interchange to a different high-potency statin. For this review, statin efficacy was assessed via review of pre- and postinterchange lipid panel values, assessing for a significant difference between equipotent atorvastatin and rosuvastatin therapy. Similarly, safety was assessed by analysis of pre- and postinterchange liver enzyme panels and assessing for significant differences as a result of the interchange.
Methods
The therapeutic interchange was conducted within the NF/SGVHS, which provides patient care at hospitals in Gainesville, Florida, and Lake City, Florida, and 11 outpatient clinics located throughout North Florida and South Georgia. Like other VA facilities, NF/SGVHS uses Computerized Patient Records System (CPRS) to electronically integrate all clinical patient information, including medical progress notes, consults, admission and discharge summaries, allergies and ADRs, patient problem lists (diagnoses), vital signs, medication orders, and laboratory test results. Approval to conduct this study was granted by the University of Florida Investigational Review Board and the Research and Development Committee at NF/SGVHS.
Therapeutic Interchange Process
Interchange from rosuvastatin to atorvastatin was expected to provide about $643,000 annually in drug cost savings to NF/SGVHS while providing equivalent therapy. The cost for a 30-day supply of rosuvastatin was about $22.56 at the time of interchange, and a 30-day supply of generic atorvastatin was $1.77.The interchange from rosuvastatin to atorvastatin was approved by the Pharmacy and Therapeutics Committee Meeting on August 8, 2012, and began shortly thereafter. Interchanges were halted temporarily in November 2012 due to a shortage of manufacturer supply, but the process fully resumed in January 2013 once the drug shortage resolved. Direction was provided to VA facilities by a guidance letter issued through PBM leadership.8 The interchange used a standard interchange guide to complete the process (Table 2).

Posttherapeutic Interchange Analysis
Researchers conducted an internal pharmacy computerizedprescription records search to identify VA outpatients who were converted from rosuvastatin to atorvastatin from February 1, 2012, to August 1, 2013. A total of 202 patients were randomly selected and included in this retrospective chart review. Investigators analyzed data points for safety and efficacy, including liver function tests (LFTs), lipid panels, and ADR reports. This information was obtained from laboratory data, vital signs, allergy information, ADR data, and progress notes using CPRS. Two sets of laboratory data were obtained for research purposes, the most recent laboratory values pre-interchange and the most recent laboratory values postinterchange to atorvastatin.
Investigators determined whether patients were converted to an equivalent dose of atorvastatin through an assessment of the most recent dosage of rosuvastatin before the interchange and the dosage of atorvastatin postinterchange. Researchers also analyzed refill history and interacting medications to assess possible confounding factors. Medication adherence was assessed via refill history. Medication adherence was defined as a medication possession ratio of at least 70%, which correlated to receipt of 3 or more 90-day supplies in the year prior to interchange. The above data were collected via retrospective chart review and entered into a spreadsheet.
Statistics
All identifying information was removed from the data set prior to statistical analysis. The data analysis for this project was generated using SAS/STAT software, version 9.3 of the SAS System for Linux x64 (SAS Institute, Cary, North Carolina).
Researchers assumed an equal variance in preinterchange and postinterchange lipid and liver panel values. Preinterchange and postinterchange lipid values (LDL-C, HDL-C, total cholesterol [TC], and triglycerides [TGs]) and liver values (aspartate aminotransferase [AST], alanine aminotransferase [ALT], alkaline phosphatase [ALP], and creatinine phosphokinase [CPK]) were analyzed by paired t test. All values were reported as mean (SD), and significance was defined as P < .05.
Results
More than 6,000 veterans within the NF/SGVHS were identified as eligible for the interchange. Of those who were converted, 202 patient records were randomly selected and reviewed. Patient population characteristics are summarized in Table 3. Most patients were aged > 65 years (61.4%) with an average body mass index (BMI) of 32.4. Most patients were converted to the correct corresponding dose of atorvastatin (82.7%) and achieved adherence with statin therapy (84.2%). There was no difference in pre- and postinterchange adherence detected as a result of this review.
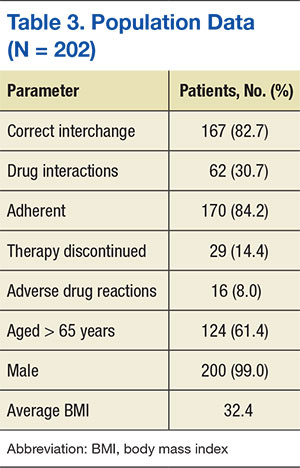
Related: New Guideline on Dyslipidemia: Less Is More
Adverse drug reactions were documented in 16 cases, accounting for 8% of the study population. The most commonly reported ADR was myalgia or arthralgia, which was found in 10 cases (5%). Other ADRs identified in this retrospective review included treatment failure, nausea, vomiting, abdominal discomfort, abnormal liver enzymes, nasopharyngitis, and pruritis (Table 4). Of note, treatment failure was determined on a case-by-case basis but was generally defined as a failure to reach LDL-C goal (< 100 mg/dL or < 70 mg/dL), despite titration of atorvastatin. Interacting medications were identified in 30.7% of patients; however, no reported ADRs were associated with interacting medications. The most common drug interaction was concomitant niacin, followed by antiarrhythmics (ie, amiodarone, diltiazem, etc), and fibrates (ie, gemfibrozil, fenofibrate). All potentially interacting medications identified in this retrospective chart review are compiled in Table 5.
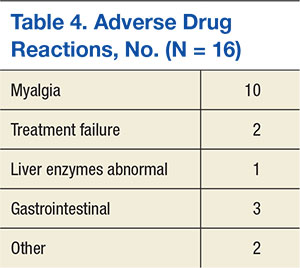
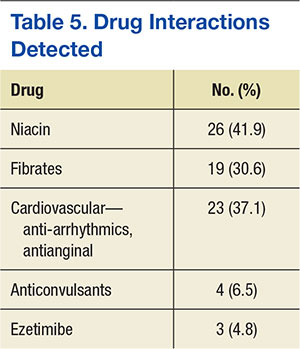
No significant difference between mean pre- and postinterchange lipid panel values was identified in this retrospective chart review (Table 6). In addition, no significant difference was detected in pre- and post-interchange AST, ALT, and CPK values (Table 7). However, a statistically significant increase in ALP was detected, with a mean ALP of 73.33 IU/L prior to interchange and 83.64 IU/L postinterchange (P < .0001).
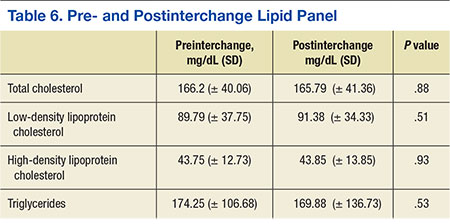
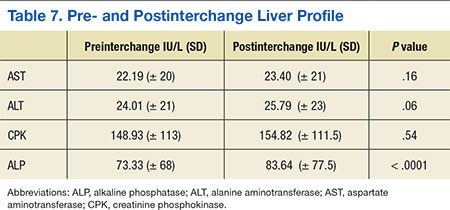
Discussion
The goal of this retrospective observation was to ensure that safety and efficacy were not compromised as a result of this cost-saving therapeutic interchange. No differences in liver enzymes (safety) and lipid control (effectiveness) were observed in this study. There were no statistically significant changes to the lipid panel or liver panel detected with the exception of ALP. The reason for this statistically significant increase is unknown; however, it may support the hypothesis of variation in hepatocellular effects between the statins due to lipophilic properties.3,6 In general, liver enzymes can be affected by extrahepatic functions. Serum ALP and other liver enzymes can be affected by bone disease, abdominal adiposity, alcoholism, and other concomitant diseases.10 No comorbid conditions were assessed, thus differences in liver enzymes may not be fully attributable to statin therapy. This retrospective review found no clinically significant effect correlated with the increase in ALP.
The results of this analysis are congruent with similar therapeutic interchange studies, which resulted in cost savings without compromising safety or efficacy.9,11 Unlike other therapeutic interchange studies, this study analyzed both safety and lipid-lowering efficacy outcomes, instead of focusing solely on changes in LDL-C lowering, total cost savings, and/or adherence.12,13 By including the entire lipid panel and liver panel into the review, this study conducted a more inclusive review of interchangeability with statins, addressing issues such as HDL-C lowering, TG changes, and liver enzyme fluctuation on conversion. There had not been a sufficient time to assess efficacy in terms of CV outcomes.
Related: Poor Outcomes for African Americans in Cardiac Rehabilitation
Two adverse events alluded to therapeutic failure as a reason for discontinuing atorvastatin. In the previous ATP III lipid guidelines, therapeutic failure was achieved when patients did not reach their LDL-C goals despite appropriate titration of statin therapy.2 However, the ACC/AHA lipid guidelines have done away with lipid goals as a measurement of treatment therapy, focusing rather on evidence-based high- or moderate-intensity statin therapy that has been proven in clinical trials to reduce mortality and CV events.1 Although measurement of efficacy via lipid panel values is no longer a guideline recommendation, the results of this chart review have shown no difference in lipid values as a result of the interchange, confirming the interchangeability of rosuvastatin and atorvastatin at their equivalent doses.
Limitations
The interchange of rosuvastatin to atorvastatin was a policy change affecting all patients within the NF/SGVHS. In order to reflect true population data and more accurately predict the effects of such a policy change, this study used intention-to-treat analysis, including all patients, even patients who were found to be nonadherent. This study is also limited by sample size (N = 202). Additionally, the generalizability of these findings may be limited. The study population was mostly males aged > 65 years with an average BMI of 32.4. Researchers did not compile comorbidity, race, or concomitant medication data. Additionally, the duration of statin therapy prior to laboratory value collection was undefined.
A retrospective chart review lends itself to limitations in data collection. Medication adherence is a factor that is assumed to have a significant effect on the results of this interchange. In this review, adherence was assessed via refill history. Researchers were unable to confirm actual consumption of the medication.
Additionally, researchers did not analyze comorbid conditions, which may have had an effect on lipid panel and liver panel values. For those veterans who discontinued atorvastatin therapy, the reason for discontinuation was often not documented. Thus, researchers were unable to assess reasons for discontinuation.
Conclusion
The results generated from a review of the therapeutic exchange of rosuvastatin to atorvastatin within a veteran population affirm that the interchange was not associated with any differences in safety or lipid control, but did result in significant drug cost savings. This study provides support for health care systems considering therapeutic interchange with high-intensity statins safely and effectively.
Acknowledgements
This material is the result of work supported with resources and the use of facilities at the North Florida/South Georgia Veterans Health System in Gainesville, Florida. The authors would like to acknowledge Kim Hoang, PharmD, for her contributions to this project.
Author disclosures
The authors report no actual or potential conflicts of interest with regard to this article.
Disclaimer
The opinions expressed herein are those of the authors and do not necessarily reflect those of Federal Practitioner, Frontline Medical Communications Inc., the U.S. Government, or any of its agencies. This article may discuss unlabeled or investigational use of certain drugs. Please review the complete prescribing information for specific drugs or drug combinations—including indications, contraindications, warnings, and adverse effects—before administering pharmacologic therapy to patients.
1. Stone NJ, Robinson JG, Lichtenstein AH, et al; American College of Cardiology/American Heart Association Task Force on Practice Guidelines. 2013 ACC/AHA guideline on the treatment of blood cholesterol to reduce atherosclerotic cardiovascular risk in adults: a report of the American College of Cardiology/American Heart Association Task Force on Practice Guidelines. J Am Coll Cardiol. 2014;63(25 pt B):2889-2934.
2. Grundy SM, Cleeman JI, Merz CN, et al; National Heart, Lung, and Blood Institute; American College of Cardiology Foundation; American Heart Association. Implications of recent clinical trials for the National Cholesterol Education Program Adult Treatment Panel III guidelines. Circulation. 2004;110(2):227-239.
3. McKenney JM. Pharmacologic characteristics of statins. Clin Cardiol. 2003;26(4 suppl 3):III32-III38.
4. Pfizer. Lipitor [package insert]. New York, NY: Pfizer; 2015.
5. Crestor [package insert]. Wilmington, DE:AstraZeneca; 2015.
6. Rosenson RS. Current overview of statin-induced myopathy. Am J Med. 2004;116(6):408-416.
7. FDA approves first generic version of cholesterol-lowering drug Lipitor [news release]. U.S. Food and Drug Administration; November 30, 2011. http://www.fda.gov/NewsEvents/Newsroom/PressAnnouncements/ucm281817.htm. Accessed November 11, 2015.
8. U.S. Department of Veterans Affairs. VHA Pharmacy Benefits Management Services, Medical Advisory Panel and VISN Pharmacist Executives. Interchange to generic atorvastatin-recommendations. Atorvastatin Conversion Guidance. 2012. U.S. Department of Veterans Affairs intranet website. https://vaww.cmopnational.va.gov/cmop/PBM/Clinical%20Guidance/Therapeutic%20Interchange%20Guidance/Atorvastatin%20Conversion%20Guidance%20(PBM-MAP-VPE)-Final.docx. Accessed November 16, 2015.
9. Pratt DS, Kaplan MM. Evaluation of Liver Function. In: Longo DL, Fauci AS, Kasper DL, Hauser SL, Jameson JL, Loscalzo J, eds. Harrison's Principles of Internal Medicine. 18th ed. New York: McGraw Hill Professional Publishing; 2011:2527-2530.
10. Taylor AJ, Grace K, Swiecki J, et al. Lipid-lowering efficacy, safety, and costs of a large-scale therapeutic statin formulary conversion program. Pharmacotherapy . 2001;21(9):1130-1139.
11. Billups SJ, Plushner SL, Olson KI, Koehler TJ, Kerzee J. Clinical and economic outcomes of conversion of simvastatin to lovastatin in a group-model health maintenance organization. J Manag Care Pharm. 2005;11(8):681-686.
12. Schachtner JM, Guharoy R, Medicis JJ, Newman N, Speizer R. Prevalence and cost savings of therapeutic interchange among U.S. hospitals. Am J Health Syst Pharm. 2002;59(6):529-533.
13. Hilleman DE, Wurdeman RL, Lenz TL. Therapeutic change of HMG-CoA reductase inhibitors in patients with coronary artery disease. Pharmacotherapy. 2001;21(4):410-415.
Patients with known cardiovascular (CV) disease are at greater risk for CV events.1 Hydroxymethylglutaryl-CoA (HMG Co-A) reductase inhibitors, or statins, have been shown to reduce CV events and to reduce all-cause mortality.1,2 Thus, these agents should be a standard approach to secondary prevention of CV events.1,2 Although the main function of statins is to lower total cholesterol (TC) and low-density lipoprotein cholesterol (LDL-C) levels, trials have shown that other lipid-lowering agents have reduced the incidence of CV events but have failed to show any difference in mortality.1 Thus, the therapeutic effects of statins may be a result of “pleiotropic” effects in addition to a reduction in LDL-C.3
As a result, prescribing practices and professional society guidelines have deferred to statins as a first-line choice for lipid-lowering therapy.1 Although each statin varies in its ability to lower LDL-C and inhibit HMG Co-A reductase, as a class, statins have been proven to be safe and efficacious in reducing LDL-C, decreasing risk of coronary artery disease, and decreasing mortality.
The 2013 American College of Cardiology (ACC) and American Heart Association (AHA) guideline on the treatment of blood cholesterol to reduce CV risk in adults resulted in a major shift in clinical practice recommendations. The focus of treatment has changed from LDL-C and TC goals to stratifying patients to either high-intensity or moderate-intensity statin therapy, based on their comorbidities and risk of atherosclerotic CV disease (ASCVD).1 Primary prevention of CV disease has been proposed for patients with diabetes mellitus aged 40 to 75 years, familial hypercholesterolemia (LDL-C > 190 mg/dL), and for patients with an ASCVD risk score > 7.5%. Secondary prevention has been proposed for all patients with a history of ASCVD. Among the available choices for intensive statin therapy, the 2 most potent regimens are atorvastatin (40-80 mg) and rosuvastatin (20-40 mg) daily. The ACC/AHA guideline recommends high-potency therapy with either rosuvastatin or atorvastatin with equal preference.1
Related: New Incentives for Helping Prevent Heart Disease
Statin therapy is generally well tolerated; however, the use of statins is not without risk of adverse drug reactions (ADRs). Skeletal muscle discomfort has been reported in 4% to 10% of patients taking either atorvastatin or rosuvastatin.4,5 Liver enzyme abnormalities are less common, having been reported in only about 2% to 3% of patients taking either atorvastatin or rosuvastatin.4,5 Although muscle-related intolerance and liver enzyme abnormalities are considered to be class effects, research speculates that the therapeutic and safety effects of statins may differ, based on tissue solubility.2,6 Variability in the myotoxic and hepatotoxic effects of statins has been attributed to differences in tissue solubility, hypothesizing that lipophilic statins are more easily taken up into myocytes and hepatocytes, resulting in an increase in toxic effects.2,6
This study assessed differences in therapeutic and safety endpoints resulting from the recent interchange from rosuvastatin to atorvastatin within the North Florida/South Georgia Veterans Health System (NF/SGVHS). Although both these agents are high-potency HMG Co-A reductase inhibitors and share a mechanism of action, they have pharmacokinetic differences, including a key difference in tissue solubility (Table 1).
With the availability of low-cost generic atorvastatin in early 2012, the VA Medical Advisory Panel and Pharmacy Benefits Management (VA MAP/PBM) added atorvastatin to the VA National Formulary as the preferred high-potency statin.7,8 Before October 2012, rosuvastatin had been the preferred high-potency statin within the VA. With support from VA MAP/PBM leadership, NF/SGVHS instituted an interchange from rosuvastatin to atorvastatin for cost-savings purposes.9
Before the interchange, the records of patients were reviewed to determine whether justification existed for continued use of rosuvastatin. Patients were converted to atorvastatin if deemed appropriate and received education and consultation through direct patient contact or a letter regarding the interchange. Justifications for continued use of rosuvastatin included documentation of an atorvastatin ADR, active liver disease, or patients taking cyclosporine or certain protease inhibitors.8
The objective of this retrospective evaluation was to assess the efficacy and safety of the interchange from rosuvastatin to atorvastatin within NF/SGVHS. The results of this review are helpful to confirm the efficacy and safety of the interchange and identify any differences in efficacy and safety that may have occurred as a result of the interchange to a different high-potency statin. For this review, statin efficacy was assessed via review of pre- and postinterchange lipid panel values, assessing for a significant difference between equipotent atorvastatin and rosuvastatin therapy. Similarly, safety was assessed by analysis of pre- and postinterchange liver enzyme panels and assessing for significant differences as a result of the interchange.
Methods
The therapeutic interchange was conducted within the NF/SGVHS, which provides patient care at hospitals in Gainesville, Florida, and Lake City, Florida, and 11 outpatient clinics located throughout North Florida and South Georgia. Like other VA facilities, NF/SGVHS uses Computerized Patient Records System (CPRS) to electronically integrate all clinical patient information, including medical progress notes, consults, admission and discharge summaries, allergies and ADRs, patient problem lists (diagnoses), vital signs, medication orders, and laboratory test results. Approval to conduct this study was granted by the University of Florida Investigational Review Board and the Research and Development Committee at NF/SGVHS.
Therapeutic Interchange Process
Interchange from rosuvastatin to atorvastatin was expected to provide about $643,000 annually in drug cost savings to NF/SGVHS while providing equivalent therapy. The cost for a 30-day supply of rosuvastatin was about $22.56 at the time of interchange, and a 30-day supply of generic atorvastatin was $1.77.The interchange from rosuvastatin to atorvastatin was approved by the Pharmacy and Therapeutics Committee Meeting on August 8, 2012, and began shortly thereafter. Interchanges were halted temporarily in November 2012 due to a shortage of manufacturer supply, but the process fully resumed in January 2013 once the drug shortage resolved. Direction was provided to VA facilities by a guidance letter issued through PBM leadership.8 The interchange used a standard interchange guide to complete the process (Table 2).
Posttherapeutic Interchange Analysis
Researchers conducted an internal pharmacy computerizedprescription records search to identify VA outpatients who were converted from rosuvastatin to atorvastatin from February 1, 2012, to August 1, 2013. A total of 202 patients were randomly selected and included in this retrospective chart review. Investigators analyzed data points for safety and efficacy, including liver function tests (LFTs), lipid panels, and ADR reports. This information was obtained from laboratory data, vital signs, allergy information, ADR data, and progress notes using CPRS. Two sets of laboratory data were obtained for research purposes, the most recent laboratory values pre-interchange and the most recent laboratory values postinterchange to atorvastatin.
Investigators determined whether patients were converted to an equivalent dose of atorvastatin through an assessment of the most recent dosage of rosuvastatin before the interchange and the dosage of atorvastatin postinterchange. Researchers also analyzed refill history and interacting medications to assess possible confounding factors. Medication adherence was assessed via refill history. Medication adherence was defined as a medication possession ratio of at least 70%, which correlated to receipt of 3 or more 90-day supplies in the year prior to interchange. The above data were collected via retrospective chart review and entered into a spreadsheet.
Statistics
All identifying information was removed from the data set prior to statistical analysis. The data analysis for this project was generated using SAS/STAT software, version 9.3 of the SAS System for Linux x64 (SAS Institute, Cary, North Carolina).
Researchers assumed an equal variance in preinterchange and postinterchange lipid and liver panel values. Preinterchange and postinterchange lipid values (LDL-C, HDL-C, total cholesterol [TC], and triglycerides [TGs]) and liver values (aspartate aminotransferase [AST], alanine aminotransferase [ALT], alkaline phosphatase [ALP], and creatinine phosphokinase [CPK]) were analyzed by paired t test. All values were reported as mean (SD), and significance was defined as P < .05.
Results
More than 6,000 veterans within the NF/SGVHS were identified as eligible for the interchange. Of those who were converted, 202 patient records were randomly selected and reviewed. Patient population characteristics are summarized in Table 3. Most patients were aged > 65 years (61.4%) with an average body mass index (BMI) of 32.4. Most patients were converted to the correct corresponding dose of atorvastatin (82.7%) and achieved adherence with statin therapy (84.2%). There was no difference in pre- and postinterchange adherence detected as a result of this review.
Related: New Guideline on Dyslipidemia: Less Is More
Adverse drug reactions were documented in 16 cases, accounting for 8% of the study population. The most commonly reported ADR was myalgia or arthralgia, which was found in 10 cases (5%). Other ADRs identified in this retrospective review included treatment failure, nausea, vomiting, abdominal discomfort, abnormal liver enzymes, nasopharyngitis, and pruritis (Table 4). Of note, treatment failure was determined on a case-by-case basis but was generally defined as a failure to reach LDL-C goal (< 100 mg/dL or < 70 mg/dL), despite titration of atorvastatin. Interacting medications were identified in 30.7% of patients; however, no reported ADRs were associated with interacting medications. The most common drug interaction was concomitant niacin, followed by antiarrhythmics (ie, amiodarone, diltiazem, etc), and fibrates (ie, gemfibrozil, fenofibrate). All potentially interacting medications identified in this retrospective chart review are compiled in Table 5.
No significant difference between mean pre- and postinterchange lipid panel values was identified in this retrospective chart review (Table 6). In addition, no significant difference was detected in pre- and post-interchange AST, ALT, and CPK values (Table 7). However, a statistically significant increase in ALP was detected, with a mean ALP of 73.33 IU/L prior to interchange and 83.64 IU/L postinterchange (P < .0001).
Discussion
The goal of this retrospective observation was to ensure that safety and efficacy were not compromised as a result of this cost-saving therapeutic interchange. No differences in liver enzymes (safety) and lipid control (effectiveness) were observed in this study. There were no statistically significant changes to the lipid panel or liver panel detected with the exception of ALP. The reason for this statistically significant increase is unknown; however, it may support the hypothesis of variation in hepatocellular effects between the statins due to lipophilic properties.3,6 In general, liver enzymes can be affected by extrahepatic functions. Serum ALP and other liver enzymes can be affected by bone disease, abdominal adiposity, alcoholism, and other concomitant diseases.10 No comorbid conditions were assessed, thus differences in liver enzymes may not be fully attributable to statin therapy. This retrospective review found no clinically significant effect correlated with the increase in ALP.
The results of this analysis are congruent with similar therapeutic interchange studies, which resulted in cost savings without compromising safety or efficacy.9,11 Unlike other therapeutic interchange studies, this study analyzed both safety and lipid-lowering efficacy outcomes, instead of focusing solely on changes in LDL-C lowering, total cost savings, and/or adherence.12,13 By including the entire lipid panel and liver panel into the review, this study conducted a more inclusive review of interchangeability with statins, addressing issues such as HDL-C lowering, TG changes, and liver enzyme fluctuation on conversion. There had not been a sufficient time to assess efficacy in terms of CV outcomes.
Related: Poor Outcomes for African Americans in Cardiac Rehabilitation
Two adverse events alluded to therapeutic failure as a reason for discontinuing atorvastatin. In the previous ATP III lipid guidelines, therapeutic failure was achieved when patients did not reach their LDL-C goals despite appropriate titration of statin therapy.2 However, the ACC/AHA lipid guidelines have done away with lipid goals as a measurement of treatment therapy, focusing rather on evidence-based high- or moderate-intensity statin therapy that has been proven in clinical trials to reduce mortality and CV events.1 Although measurement of efficacy via lipid panel values is no longer a guideline recommendation, the results of this chart review have shown no difference in lipid values as a result of the interchange, confirming the interchangeability of rosuvastatin and atorvastatin at their equivalent doses.
Limitations
The interchange of rosuvastatin to atorvastatin was a policy change affecting all patients within the NF/SGVHS. In order to reflect true population data and more accurately predict the effects of such a policy change, this study used intention-to-treat analysis, including all patients, even patients who were found to be nonadherent. This study is also limited by sample size (N = 202). Additionally, the generalizability of these findings may be limited. The study population was mostly males aged > 65 years with an average BMI of 32.4. Researchers did not compile comorbidity, race, or concomitant medication data. Additionally, the duration of statin therapy prior to laboratory value collection was undefined.
A retrospective chart review lends itself to limitations in data collection. Medication adherence is a factor that is assumed to have a significant effect on the results of this interchange. In this review, adherence was assessed via refill history. Researchers were unable to confirm actual consumption of the medication.
Additionally, researchers did not analyze comorbid conditions, which may have had an effect on lipid panel and liver panel values. For those veterans who discontinued atorvastatin therapy, the reason for discontinuation was often not documented. Thus, researchers were unable to assess reasons for discontinuation.
Conclusion
The results generated from a review of the therapeutic exchange of rosuvastatin to atorvastatin within a veteran population affirm that the interchange was not associated with any differences in safety or lipid control, but did result in significant drug cost savings. This study provides support for health care systems considering therapeutic interchange with high-intensity statins safely and effectively.
Acknowledgements
This material is the result of work supported with resources and the use of facilities at the North Florida/South Georgia Veterans Health System in Gainesville, Florida. The authors would like to acknowledge Kim Hoang, PharmD, for her contributions to this project.
Author disclosures
The authors report no actual or potential conflicts of interest with regard to this article.
Disclaimer
The opinions expressed herein are those of the authors and do not necessarily reflect those of Federal Practitioner, Frontline Medical Communications Inc., the U.S. Government, or any of its agencies. This article may discuss unlabeled or investigational use of certain drugs. Please review the complete prescribing information for specific drugs or drug combinations—including indications, contraindications, warnings, and adverse effects—before administering pharmacologic therapy to patients.
1. Stone NJ, Robinson JG, Lichtenstein AH, et al; American College of Cardiology/American Heart Association Task Force on Practice Guidelines. 2013 ACC/AHA guideline on the treatment of blood cholesterol to reduce atherosclerotic cardiovascular risk in adults: a report of the American College of Cardiology/American Heart Association Task Force on Practice Guidelines. J Am Coll Cardiol. 2014;63(25 pt B):2889-2934.
2. Grundy SM, Cleeman JI, Merz CN, et al; National Heart, Lung, and Blood Institute; American College of Cardiology Foundation; American Heart Association. Implications of recent clinical trials for the National Cholesterol Education Program Adult Treatment Panel III guidelines. Circulation. 2004;110(2):227-239.
3. McKenney JM. Pharmacologic characteristics of statins. Clin Cardiol. 2003;26(4 suppl 3):III32-III38.
4. Pfizer. Lipitor [package insert]. New York, NY: Pfizer; 2015.
5. Crestor [package insert]. Wilmington, DE:AstraZeneca; 2015.
6. Rosenson RS. Current overview of statin-induced myopathy. Am J Med. 2004;116(6):408-416.
7. FDA approves first generic version of cholesterol-lowering drug Lipitor [news release]. U.S. Food and Drug Administration; November 30, 2011. http://www.fda.gov/NewsEvents/Newsroom/PressAnnouncements/ucm281817.htm. Accessed November 11, 2015.
8. U.S. Department of Veterans Affairs. VHA Pharmacy Benefits Management Services, Medical Advisory Panel and VISN Pharmacist Executives. Interchange to generic atorvastatin-recommendations. Atorvastatin Conversion Guidance. 2012. U.S. Department of Veterans Affairs intranet website. https://vaww.cmopnational.va.gov/cmop/PBM/Clinical%20Guidance/Therapeutic%20Interchange%20Guidance/Atorvastatin%20Conversion%20Guidance%20(PBM-MAP-VPE)-Final.docx. Accessed November 16, 2015.
9. Pratt DS, Kaplan MM. Evaluation of Liver Function. In: Longo DL, Fauci AS, Kasper DL, Hauser SL, Jameson JL, Loscalzo J, eds. Harrison's Principles of Internal Medicine. 18th ed. New York: McGraw Hill Professional Publishing; 2011:2527-2530.
10. Taylor AJ, Grace K, Swiecki J, et al. Lipid-lowering efficacy, safety, and costs of a large-scale therapeutic statin formulary conversion program. Pharmacotherapy . 2001;21(9):1130-1139.
11. Billups SJ, Plushner SL, Olson KI, Koehler TJ, Kerzee J. Clinical and economic outcomes of conversion of simvastatin to lovastatin in a group-model health maintenance organization. J Manag Care Pharm. 2005;11(8):681-686.
12. Schachtner JM, Guharoy R, Medicis JJ, Newman N, Speizer R. Prevalence and cost savings of therapeutic interchange among U.S. hospitals. Am J Health Syst Pharm. 2002;59(6):529-533.
13. Hilleman DE, Wurdeman RL, Lenz TL. Therapeutic change of HMG-CoA reductase inhibitors in patients with coronary artery disease. Pharmacotherapy. 2001;21(4):410-415.
Treatment Failure With Atorvastatin After Change From Rosuvastatin to Atorvastatin
Due to the growing number of drug shortages and increasing cost of medications, large-scale formulary conversions are becoming more common and necessary for pharmacies to stay within their budget allocations. Statins are widely recognized as first-line therapy for cholesterol lowering and have been proven to reduce cardiovascular morbidity and mortality.1-5 In addition to statin therapy, weight loss and lifestyle changes are often necessary to meet optimum low-density lipoprotein cholesterol (LDL-C) goals.6 According to the Adult Treatment Panel III (ATP III) guidelines, the optimum LDL-C for each patient varies based on the presence of coronary artery disease (CAD), CAD risk equivalents, and other risk factors.7 Patients with CAD or CAD risk equivalents have an LDL-C goal of < 100 mg/dL. Those with multiple risk factors have an LDL-C goal of < 130 mg/dL, and those with 0 to 1 risk factors have an LDL-C goal of < 160 mg/dL.1-3,7,8
Numerous trials have compared the safety and efficacy of the 3-hydroxy-3-methylglutaryl-coenzyme A inhibitors, stating that rosuvastatin 5 to 10 mg per day is equivalent to 20 mg per day of atorvastatin in terms of its ability to lower LDL-C levels.7,9-14 The LUNAR (Limiting Under treatment of lipids in Acute coronary syndrome with Rosuvastatin) study compared the efficacy of rosuvastatin with that of atorvastatin in decreasing LDL-C in patients with acute coronary syndrome.8 Rosuvastatin 40 mg was significantly more successful in lowering LDL-C and increasing high-density lipoprotein cholesterol (HDL-C) compared with atorvastatin 80-mg daily therapy.
In October 2012, the national VA Pharmacy Benefits Management (PBM) Services released guidance regarding the conversion from rosuvastatin to atorvastatin, including the dosing conversion (Table 1), stating that rosuvastatin 5 mg daily should be considered equivalent and converted to atorvastatin 20 mg daily. In general, adverse events (AEs), such as increased liver enzymes, myopathies, and increased creatinine phosphokinase (CPK), are considered a class effect of the statins.13,14
Related: Statins showed no benefit in reducing risk of recurrent VTE
The recent 2013 American College of Cardiology/American Heart Association (ACC/AHA) Blood Cholesterol Guideline on the Treatment of Blood Cholesterol to Reduce Atherosclerotic Cardiovascular Risk in Adults has identified a large number of patients as candidates for high-intensity statins, which the authors defined as atorvastatin and rosuvastatin.4 These guidelines do not recommend LDL-C goals and instead use a risk calculator to determine which intensity of statin therapy is appropriate for certain patients. This change in practice will lead to a higher volume of high-intensity statin prescriptions and higher drug costs for some medical centers. Given the volume of prescriptions and the increased use of large-scale formulary conversions to reduce costs, more research is warranted to ensure equivalent dosing. With more data available and equivalent dosing defined, pharmacists may be better able to improve clinical results in patients that are included in these large-scale formulary conversions.
Methods
A retrospective chart review was performed on all LDL-C levels in patients receiving atorvastatin therapy due to the formulary conversion from rosuvastatin to atorvastatin at the Huntington VAMC (HVAMC) in Huntington, West Virginia, per the guidance published by the national VA PBM Services. The number of patients not at their LDL-C goal (as defined by ATP III guidelines) as a result of atorvastatin therapy was determined. Furthermore, AEs due to atorvastatin therapy such as increased liver enzymes, myopathy, and increased CPK were identified and analyzed.
The primary endpoint of this study focused on the rate of treatment failure in LDL-C reduction with atorvastatin treatment in patients previously at their LDL-C goal, as defined by the ATP III guidelines, with rosuvastatin therapy. Secondary endpoints included rate of AEs due to atorvastatin therapy, percentage increase in CPK and liver enzymes as a result of atorvastatin therapy, and percentage LDL-C, HDL-C, total cholesterol (TC), and triglyceride (TGs) changes since conversion from rosuvastatin to atorvastatin.
Patients were included in the study if they were aged 18 to 89 years, previously at LDL-C goal with rosuvastatin therapy for at least 3 months, had never previously received atorvastatin, were converted to atorvastatin therapy as a result of a large-scale formulary conversion at HVAMC, and had a fasting lipid panel completed 1 to 6 months after conversion. Patients were excluded from the study if they received other lipid-lowering medications (eg, bile acid sequestrants, fibrates, niacin, or ezetimibe) in the 12 months before or after receiving statin therapy, had previously documented AEs (eg, myopathy, increased liver enzymes, increased CPK as a result of statin therapy, or history of known homozygous familial hypercholesterolemia) current active liver disease (ALT > 2x ULN [upper limit of normal]), unexplained CPK ≥ 3x ULN, serum creatinine (SCr) > 2 mg/dL, or history of alcohol or drug abuse within the last 5 years.
Results
Three hundred twenty-three patients were identified and reviewed as converted from rosuvastatin to atorvastatin during the study period with no prior use of atorvastatin. Of the 323 charts that were reviewed, 195 patients met the study inclusion criteria and were analyzed for rate of treatment failure in terms of lipid goals and rate of AEs. Twenty of 195 patients (10.3%) were no longer at their LDL-C goal after conversion from rosuvastatin to atorvastatin. Of those 195 patients, 29 (14.9%) experienced an adverse drug reaction (ADR) as a result of atorvastatin treatment that was severe enough to result in discontinuation of the drug and switching the patient back to the originally prescribed dose of rosuvastatin. Figure 1 illustrates the number of patients and documented atorvastatin ADRs. The most common ADR documented to atorvastatin was myalgias (8.2%).
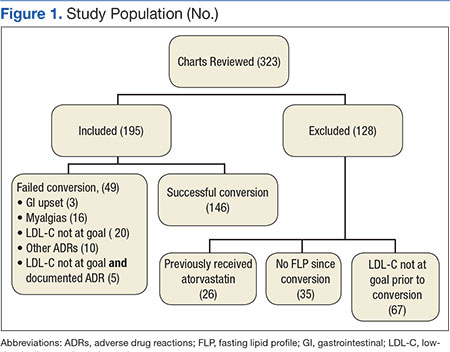
The average change in lipid levels was calculated and atorvastatin therapy was found to result in clinically insignificant changes to the lipid panel (Table 2). A 2-tailed paired t test was used to assess the statistical significance of these changes. Atorvastatin therapy resulted in an average decrease of LDL-C by 5.0 mg/dL (P < .01) in comparison to previous therapy with equivalent rosuvastatin dose. Other noted changes to lipid profile after formulary conversion included TG reduction by 2 mg/dL (P = .69), TC increased by 0.58 mg/dL (P = .80), and HDL-C reduction by 4.66 mg/dL (P < .01).
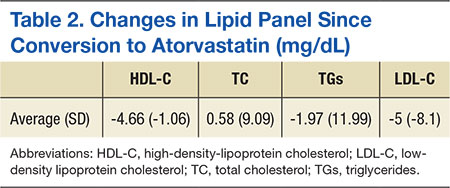
Although the decrease in LDL-C and HDL-C as a result of the formulary change was found to be statistically significant, they are not thought to result in a clinical difference. Clinically and statistically insignificant changes in liver enzymes and CPK were also discovered as a result of atorvastatin therapy conversion (Table 3). Atorvastatin therapy resulted in an averaged decrease of aspartate aminotransferase by 2.2 IU/L (P = .19) and an increase in alanine aminotransferase by 1.4 IU/L (P = .47). Average change in CPK was -6 IU/L (P = 89).
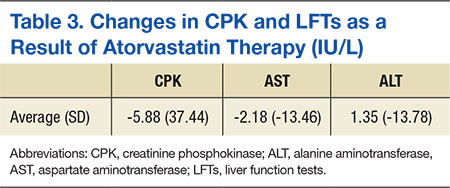
Related: New Guideline on Dyslipidemia: Less Is More
Discussion
Lipid levels were found to be mostly unchanged and remained at therapy goals, demonstrating use and appropriate equivalent dosing of rosuvastatin and atorvastatin following the formulary conversion defined in Table 1. Documented ADRs were minimal, indicating the ingredient conversion was well tolerated overall by our patients. Following the release of the 2013ACC/AHA guidelines, many patients in the VA required treatment with high-potency statins such as rosuvastatin and atorvastatin. Given the volume of statin prescriptions in the VA and the significant potential for providing the most cost-efficient lipid therapy (Table 4), the formulary conversion from rosuvastatin to atorvastatin was warranted.
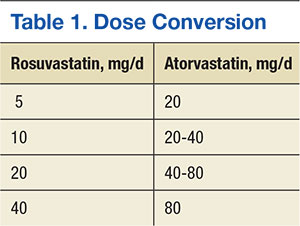
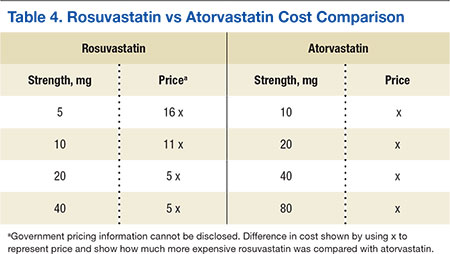
Limitations
There are several limitations for extrapolating results from this study to the general population. Due to the retrospective design of the study, no formal assessment of adherence was conducted. A prospective trial, with a researcher monitoring refills and tablet counts would be more accurate to ensure patients adherence with statin therapy.
Many of the patients that were included in the formulary conversion did not have follow-up laboratory work at the time of this study and were therefore excluded, leading to a smaller study population. A larger study population with a similar study design may be able to detect more significant correlations.
There are also several potential complications in regard to formulary conversions, including the inability to ensure the exact period that the patient switched therapies. During the conversion of rosuvastatin to atorvastatin at HVAMC, an attempt was made to minimize this confounder by converting patients on request for a refill of their rosuvastatin therapy. Last, all 185 patients that were studied were male; therefore, it is difficult to extrapolate these results for female patients.
Conclusions
This study shows that the conversion of patients from rosuvastatin therapy to atorvastatin was effective when it targeted a specific LDL-C goal or specific reduction in LDL-C. A similar conversion would likely lead to lower drug costs for many other health systems. Additional studies will be necessary given the recent changes in the national lipid guidelines. Furthermore, studies will be needed to assess concrete clinical endpoints (cardiovascular mortality, all-cause mortality, and cardiac events).
Related: Poor Outcomes for African Americans in Cardiac Rehabilitation
Author disclosures
The authors report no actual or potential conflicts of interest with regard to this article.
Disclaimer
The opinions expressed herein are those of the authors and do not necessarily reflect those of Federal Practitioner, Frontline Medical Communications Inc., the U.S. Government, or any of its agencies. This article may discuss unlabeled or investigational use of certain drugs. Please review the complete prescribing information for specific drugs or drug combinations—including indications, contraindications, warnings, and adverse effects—before administering pharmacologic therapy to patients.
1. Krasuski RA, Doeppenschmidt D, Henry JS, et al. Conversion to atorvastatin in patients intolerant or refractory to simvastatin therapy: the CAPISH study. Mayo Clin Proc. 2005;80(9):1163-1168.
2. Clearfield MB, Amerena J, Bassand JP, et al. Comparison of the efficacy and safety of rosuvastatin 10 mg and atorvastatin 20 mg in high-risk patients with hypercholesterolemia--Prospective study to evaluate the Use of Low doses of the Statins Atorvastatin and Rosuvastatin (PULSAR). Trials. 2006;7:35.
3. Park JS, Kim YJ, Choi JY, et al. Comparative study of low doses of rosuvastatin and atorvastatin on lipid and glycemic control in patients with metabolic syndrome and hypercholesterolemia. Korean J Intern Med. 2010;25(1):27-35.
4. Stone NJ, Robinson JG, Lichtenstein AH, et al; American College of Cardiology/American Heart Association Task Force on Practice Guidelines. 2013 ACC/AHA guideline on the treatment of blood cholesterol to reduce atherosclerotic cardiovascular risk in adults: a report of the American College of Cardiology/American Heart Association Task Force on Practice Guidelines. J Am Coll Cardiol. 2014;63(25, pt B):2889-2934.
5. Schuster H, Barter PJ, Stender S, et al; Effective Reductions in Cholesterol Using Rosuvastatin Therapy I study group. Effects of switching statin on achievement of lipid goals: Measuring Effective Reductions in Cholesterol Using Rosuvastatin Therapy (MERCURY I) study. Am Heart J. 2004;147(4):705-713.
6. Ballantyne CM, Bertolami M, Garcia HR, et al. Achieving LDL cholesterol, non-HDL cholesterol and apolipoprotein B target levels in high-risk patients: Measuring effective Reductions in Cholesterol Using Rosuvastatin therapY (MERCURY) II. Am Heart J. 2006;151(5):975.e1-975.e9.
7. Expert Panel on Detection, Evaluation, and Treatment of High Blood Cholesterol in Adults. Executive Summary of the Third Report of the National Cholesterol Education Program (NCEP) Expert Panel on Detection, Evaluation, and Treatment of High Blood Cholesterol In Adults (Adult Treatment Panel III). JAMA. 2001;285(19):2486-2497.
8. Pitt B, Loscalzo J, Monyak J, Miller E, Raichlen J. Comparison of lipid-modifying efficacy of rosuvastatin versus atorvastatin in patients with acute coronary syndrome (from the LUNAR study). Am J Cardiol. 2012;109(9);1239-1246.
9. Takagi H, Niwa M, Mizuno Y, Yamamoto H, Goto SN, Umemoto T. Effects of rosuvastatin versus atorvastatin on small dense low-density lipoprotein: a meta-analysis of randomized trials. Heart Vessels. 2014;29(3);287-299.
10. Fox KM, Gandhi SK, Ohsfeldt RL, Davidson MH. Comparison of low-density lipoprotein cholesterol reduction after switching patients on other statins to rosuvastatin or simvastatin in a real-world clinical practice setting. Am J Manag Care. 2007;13(suppl 10):S270-S275.
11. Taylor AJ, Grace K, Swiecki J, et al. Lipid-lowering efficacy, safety, and costs of a large-scale therapeutic statin formulary conversion program. Pharmacotherapy. 2001;21(9):1130-1139.
12. Bullano MF, Kamat S, Wertz DA, et al. Effectiveness of rosuvastatin versus atorvastatin in reducing lipid levels and achieving low-density-lipoprotein cholesterol goals in a usual care setting. Am J Health Syst Pharm. 2007;64(3):276-284.
13. Palmer MK, Nicholls SJ, Lundman P, Barter PJ, Karison BW. Achievement of LDL-C goals depends on baseline LDL-C and choice and dose of statin: an analysis from the VOYAGER database. Eur J Prev Cardiol. 2013;20(6):1080-1087.
14. Berne C, Siewert-Delle A; URANUS study investigators. Comparison of rosuvastatin and atorvastatin for lipid lowering in patients with type 2 diabetes mellitus: results from the URANUS study. Cardiovasc Diabetol. 2005;4:7.
Due to the growing number of drug shortages and increasing cost of medications, large-scale formulary conversions are becoming more common and necessary for pharmacies to stay within their budget allocations. Statins are widely recognized as first-line therapy for cholesterol lowering and have been proven to reduce cardiovascular morbidity and mortality.1-5 In addition to statin therapy, weight loss and lifestyle changes are often necessary to meet optimum low-density lipoprotein cholesterol (LDL-C) goals.6 According to the Adult Treatment Panel III (ATP III) guidelines, the optimum LDL-C for each patient varies based on the presence of coronary artery disease (CAD), CAD risk equivalents, and other risk factors.7 Patients with CAD or CAD risk equivalents have an LDL-C goal of < 100 mg/dL. Those with multiple risk factors have an LDL-C goal of < 130 mg/dL, and those with 0 to 1 risk factors have an LDL-C goal of < 160 mg/dL.1-3,7,8
Numerous trials have compared the safety and efficacy of the 3-hydroxy-3-methylglutaryl-coenzyme A inhibitors, stating that rosuvastatin 5 to 10 mg per day is equivalent to 20 mg per day of atorvastatin in terms of its ability to lower LDL-C levels.7,9-14 The LUNAR (Limiting Under treatment of lipids in Acute coronary syndrome with Rosuvastatin) study compared the efficacy of rosuvastatin with that of atorvastatin in decreasing LDL-C in patients with acute coronary syndrome.8 Rosuvastatin 40 mg was significantly more successful in lowering LDL-C and increasing high-density lipoprotein cholesterol (HDL-C) compared with atorvastatin 80-mg daily therapy.
In October 2012, the national VA Pharmacy Benefits Management (PBM) Services released guidance regarding the conversion from rosuvastatin to atorvastatin, including the dosing conversion (Table 1), stating that rosuvastatin 5 mg daily should be considered equivalent and converted to atorvastatin 20 mg daily. In general, adverse events (AEs), such as increased liver enzymes, myopathies, and increased creatinine phosphokinase (CPK), are considered a class effect of the statins.13,14
Related: Statins showed no benefit in reducing risk of recurrent VTE
The recent 2013 American College of Cardiology/American Heart Association (ACC/AHA) Blood Cholesterol Guideline on the Treatment of Blood Cholesterol to Reduce Atherosclerotic Cardiovascular Risk in Adults has identified a large number of patients as candidates for high-intensity statins, which the authors defined as atorvastatin and rosuvastatin.4 These guidelines do not recommend LDL-C goals and instead use a risk calculator to determine which intensity of statin therapy is appropriate for certain patients. This change in practice will lead to a higher volume of high-intensity statin prescriptions and higher drug costs for some medical centers. Given the volume of prescriptions and the increased use of large-scale formulary conversions to reduce costs, more research is warranted to ensure equivalent dosing. With more data available and equivalent dosing defined, pharmacists may be better able to improve clinical results in patients that are included in these large-scale formulary conversions.
Methods
A retrospective chart review was performed on all LDL-C levels in patients receiving atorvastatin therapy due to the formulary conversion from rosuvastatin to atorvastatin at the Huntington VAMC (HVAMC) in Huntington, West Virginia, per the guidance published by the national VA PBM Services. The number of patients not at their LDL-C goal (as defined by ATP III guidelines) as a result of atorvastatin therapy was determined. Furthermore, AEs due to atorvastatin therapy such as increased liver enzymes, myopathy, and increased CPK were identified and analyzed.
The primary endpoint of this study focused on the rate of treatment failure in LDL-C reduction with atorvastatin treatment in patients previously at their LDL-C goal, as defined by the ATP III guidelines, with rosuvastatin therapy. Secondary endpoints included rate of AEs due to atorvastatin therapy, percentage increase in CPK and liver enzymes as a result of atorvastatin therapy, and percentage LDL-C, HDL-C, total cholesterol (TC), and triglyceride (TGs) changes since conversion from rosuvastatin to atorvastatin.
Patients were included in the study if they were aged 18 to 89 years, previously at LDL-C goal with rosuvastatin therapy for at least 3 months, had never previously received atorvastatin, were converted to atorvastatin therapy as a result of a large-scale formulary conversion at HVAMC, and had a fasting lipid panel completed 1 to 6 months after conversion. Patients were excluded from the study if they received other lipid-lowering medications (eg, bile acid sequestrants, fibrates, niacin, or ezetimibe) in the 12 months before or after receiving statin therapy, had previously documented AEs (eg, myopathy, increased liver enzymes, increased CPK as a result of statin therapy, or history of known homozygous familial hypercholesterolemia) current active liver disease (ALT > 2x ULN [upper limit of normal]), unexplained CPK ≥ 3x ULN, serum creatinine (SCr) > 2 mg/dL, or history of alcohol or drug abuse within the last 5 years.
Results
Three hundred twenty-three patients were identified and reviewed as converted from rosuvastatin to atorvastatin during the study period with no prior use of atorvastatin. Of the 323 charts that were reviewed, 195 patients met the study inclusion criteria and were analyzed for rate of treatment failure in terms of lipid goals and rate of AEs. Twenty of 195 patients (10.3%) were no longer at their LDL-C goal after conversion from rosuvastatin to atorvastatin. Of those 195 patients, 29 (14.9%) experienced an adverse drug reaction (ADR) as a result of atorvastatin treatment that was severe enough to result in discontinuation of the drug and switching the patient back to the originally prescribed dose of rosuvastatin. Figure 1 illustrates the number of patients and documented atorvastatin ADRs. The most common ADR documented to atorvastatin was myalgias (8.2%).
The average change in lipid levels was calculated and atorvastatin therapy was found to result in clinically insignificant changes to the lipid panel (Table 2). A 2-tailed paired t test was used to assess the statistical significance of these changes. Atorvastatin therapy resulted in an average decrease of LDL-C by 5.0 mg/dL (P < .01) in comparison to previous therapy with equivalent rosuvastatin dose. Other noted changes to lipid profile after formulary conversion included TG reduction by 2 mg/dL (P = .69), TC increased by 0.58 mg/dL (P = .80), and HDL-C reduction by 4.66 mg/dL (P < .01).
Although the decrease in LDL-C and HDL-C as a result of the formulary change was found to be statistically significant, they are not thought to result in a clinical difference. Clinically and statistically insignificant changes in liver enzymes and CPK were also discovered as a result of atorvastatin therapy conversion (Table 3). Atorvastatin therapy resulted in an averaged decrease of aspartate aminotransferase by 2.2 IU/L (P = .19) and an increase in alanine aminotransferase by 1.4 IU/L (P = .47). Average change in CPK was -6 IU/L (P = 89).
Related: New Guideline on Dyslipidemia: Less Is More
Discussion
Lipid levels were found to be mostly unchanged and remained at therapy goals, demonstrating use and appropriate equivalent dosing of rosuvastatin and atorvastatin following the formulary conversion defined in Table 1. Documented ADRs were minimal, indicating the ingredient conversion was well tolerated overall by our patients. Following the release of the 2013ACC/AHA guidelines, many patients in the VA required treatment with high-potency statins such as rosuvastatin and atorvastatin. Given the volume of statin prescriptions in the VA and the significant potential for providing the most cost-efficient lipid therapy (Table 4), the formulary conversion from rosuvastatin to atorvastatin was warranted.
Limitations
There are several limitations for extrapolating results from this study to the general population. Due to the retrospective design of the study, no formal assessment of adherence was conducted. A prospective trial, with a researcher monitoring refills and tablet counts would be more accurate to ensure patients adherence with statin therapy.
Many of the patients that were included in the formulary conversion did not have follow-up laboratory work at the time of this study and were therefore excluded, leading to a smaller study population. A larger study population with a similar study design may be able to detect more significant correlations.
There are also several potential complications in regard to formulary conversions, including the inability to ensure the exact period that the patient switched therapies. During the conversion of rosuvastatin to atorvastatin at HVAMC, an attempt was made to minimize this confounder by converting patients on request for a refill of their rosuvastatin therapy. Last, all 185 patients that were studied were male; therefore, it is difficult to extrapolate these results for female patients.
Conclusions
This study shows that the conversion of patients from rosuvastatin therapy to atorvastatin was effective when it targeted a specific LDL-C goal or specific reduction in LDL-C. A similar conversion would likely lead to lower drug costs for many other health systems. Additional studies will be necessary given the recent changes in the national lipid guidelines. Furthermore, studies will be needed to assess concrete clinical endpoints (cardiovascular mortality, all-cause mortality, and cardiac events).
Related: Poor Outcomes for African Americans in Cardiac Rehabilitation
Author disclosures
The authors report no actual or potential conflicts of interest with regard to this article.
Disclaimer
The opinions expressed herein are those of the authors and do not necessarily reflect those of Federal Practitioner, Frontline Medical Communications Inc., the U.S. Government, or any of its agencies. This article may discuss unlabeled or investigational use of certain drugs. Please review the complete prescribing information for specific drugs or drug combinations—including indications, contraindications, warnings, and adverse effects—before administering pharmacologic therapy to patients.
1. Krasuski RA, Doeppenschmidt D, Henry JS, et al. Conversion to atorvastatin in patients intolerant or refractory to simvastatin therapy: the CAPISH study. Mayo Clin Proc. 2005;80(9):1163-1168.
2. Clearfield MB, Amerena J, Bassand JP, et al. Comparison of the efficacy and safety of rosuvastatin 10 mg and atorvastatin 20 mg in high-risk patients with hypercholesterolemia--Prospective study to evaluate the Use of Low doses of the Statins Atorvastatin and Rosuvastatin (PULSAR). Trials. 2006;7:35.
3. Park JS, Kim YJ, Choi JY, et al. Comparative study of low doses of rosuvastatin and atorvastatin on lipid and glycemic control in patients with metabolic syndrome and hypercholesterolemia. Korean J Intern Med. 2010;25(1):27-35.
4. Stone NJ, Robinson JG, Lichtenstein AH, et al; American College of Cardiology/American Heart Association Task Force on Practice Guidelines. 2013 ACC/AHA guideline on the treatment of blood cholesterol to reduce atherosclerotic cardiovascular risk in adults: a report of the American College of Cardiology/American Heart Association Task Force on Practice Guidelines. J Am Coll Cardiol. 2014;63(25, pt B):2889-2934.
5. Schuster H, Barter PJ, Stender S, et al; Effective Reductions in Cholesterol Using Rosuvastatin Therapy I study group. Effects of switching statin on achievement of lipid goals: Measuring Effective Reductions in Cholesterol Using Rosuvastatin Therapy (MERCURY I) study. Am Heart J. 2004;147(4):705-713.
6. Ballantyne CM, Bertolami M, Garcia HR, et al. Achieving LDL cholesterol, non-HDL cholesterol and apolipoprotein B target levels in high-risk patients: Measuring effective Reductions in Cholesterol Using Rosuvastatin therapY (MERCURY) II. Am Heart J. 2006;151(5):975.e1-975.e9.
7. Expert Panel on Detection, Evaluation, and Treatment of High Blood Cholesterol in Adults. Executive Summary of the Third Report of the National Cholesterol Education Program (NCEP) Expert Panel on Detection, Evaluation, and Treatment of High Blood Cholesterol In Adults (Adult Treatment Panel III). JAMA. 2001;285(19):2486-2497.
8. Pitt B, Loscalzo J, Monyak J, Miller E, Raichlen J. Comparison of lipid-modifying efficacy of rosuvastatin versus atorvastatin in patients with acute coronary syndrome (from the LUNAR study). Am J Cardiol. 2012;109(9);1239-1246.
9. Takagi H, Niwa M, Mizuno Y, Yamamoto H, Goto SN, Umemoto T. Effects of rosuvastatin versus atorvastatin on small dense low-density lipoprotein: a meta-analysis of randomized trials. Heart Vessels. 2014;29(3);287-299.
10. Fox KM, Gandhi SK, Ohsfeldt RL, Davidson MH. Comparison of low-density lipoprotein cholesterol reduction after switching patients on other statins to rosuvastatin or simvastatin in a real-world clinical practice setting. Am J Manag Care. 2007;13(suppl 10):S270-S275.
11. Taylor AJ, Grace K, Swiecki J, et al. Lipid-lowering efficacy, safety, and costs of a large-scale therapeutic statin formulary conversion program. Pharmacotherapy. 2001;21(9):1130-1139.
12. Bullano MF, Kamat S, Wertz DA, et al. Effectiveness of rosuvastatin versus atorvastatin in reducing lipid levels and achieving low-density-lipoprotein cholesterol goals in a usual care setting. Am J Health Syst Pharm. 2007;64(3):276-284.
13. Palmer MK, Nicholls SJ, Lundman P, Barter PJ, Karison BW. Achievement of LDL-C goals depends on baseline LDL-C and choice and dose of statin: an analysis from the VOYAGER database. Eur J Prev Cardiol. 2013;20(6):1080-1087.
14. Berne C, Siewert-Delle A; URANUS study investigators. Comparison of rosuvastatin and atorvastatin for lipid lowering in patients with type 2 diabetes mellitus: results from the URANUS study. Cardiovasc Diabetol. 2005;4:7.
Implications of Vancomycin Troughs Drawn Earlier Than Current Guidelines
Vancomycin was isolated in the 1950s, but due to impurities causing adverse events and semisynthetic penicillin production, its use was greatly reduced.1,2 However, this medication gained in popularity 30 years later as a first-line treatment for methicillin-resistant Staphylococcus aureus infections.
In 2009 the Infectious Diseases Society of America (IDSA), American Society of Health System Pharmacists, and Society of Infectious Diseases Pharmacists developed a consensus review of the therapeutic monitoring and dosing of vancomycin in adult patients.3 Trough serum concentration levels are recommended as the most accurate and convenient method to monitor vancomycin. Per IDSA guidelines, an optimal trough is intended to be high enough to clear infections (> 10 mg/L) and prevent the development of vancomycin intermediate and resistant bacteria. Troughs should be obtained just before the next dose in steady-state conditions (starting just before the fourth dose) in patients with normal renal function.
Since the development of these guidelines, vancomycin trough levels are often drawn early.4-7 This may lead to an overestimation of the true trough concentration. A study by Morrison and colleagues in Boston, Massachusetts, found that 41.3% of vancomycin troughs were drawn early, and this resulted in statistically significant increases in the vancomycin concentrations, the rate of vancomycin regimen adjustments (decrease, discontinuation, or holding of dose), and the repeat vancomycin level orders compared with correctly timed troughs.5 It was noted by the study authors that lowering the daily dose of vancomycin based on early trough levels could lead to an underdosing of vancomycin and an increase in intermediate or resistant bacteria.
Related: IDWEEK: Antibiotic ‘time-out’ cut vancomycin use
The prevalence and implications of early trough samples have been measured at only 1 facility, and it is unknown whether these data can be reproduced elsewhere.5 Thus, this study sought to determine the prevalence and corresponding clinical actions of early trough levels at the Captain James A. Lovell Federal Health Care Center (JALFHCC). This is a unique facility that in 2010 combined a VA hospital with a DoD hospital. This facility cares for 67,000 military and retiree beneficiaries each year from southwestern Wisconsin and northwestern Illinois.The primary objective of this study was to measure the rate of early troughs drawn and their resultant effect on vancomycin regimens compared with correctly timed troughs. Secondarily, this study sought to compare the rate of repeated vancomycin trough levels in early vs correctly timed measurements.
Methods
This retrospective cohort analysis compared the outcomes of early and correctly timed vancomycin troughs. This study was approved by the Edward Hines, Jr. VA Hospital and JALFHCC Institutional Review Board. Veteran patients aged ≥ 18 years, hospitalized at JALFHCC, and receiving IV vancomycin at dosing intervals of 8, 12, 24, and 48 hours with measured trough levels between July 1, 2009, and July 1, 2013, were included in this study. Patients were excluded from analysis if vancomycin was given at any schedule other than the previously stated frequencies, they received hemodialysis during the treatment period, or their insurance coverage was through TRICARE (these patients had either active-duty or retired active-duty status).
Potentially eligible patients were identified via a Computerized Patient Records System (CPRS) search for laboratory vancomycin level measurements. The search supplied the researcher with the patient name, vancomycin level date and time, type of vancomycin level (trough or random), and vancomycin concentration. With this information, further data were gathered through CPRS: demographics, type of clinical infection, desired trough level (inferred if not listed in CPRS note), and vancomycin administration time (through the bar code medication administration system [BCMA] in CPRS). This analysis was of troughs, and multiple troughs may have originated from the same patient.
An early trough was defined as a trough taken more than 2 hours earlier than the next theoretical administration time or anytime before the third dose. After a trough was determined to be early or on time, the clinical actions taken during the dosing interval following sample collection were documented. A dose was considered to be held if stated in the BCMA or in a CPRS provider note. A dose was considered to be decreased with a change in frequency or strength that resulted in an overall daily dose decrease. A recollected vancomycin trough was counted within 24 hours of the trough or per a note in CPRS. Finally, observations that noted trends in vancomycin trough management were recorded.
The chi-square test with a significance criterion of 0.05 was used to compare early and on time troughs. Based on the results from the Boston, Massachusetts, study and 1 other study, about 780 vancomycin troughs would be required to meet significance in the primary outcome.5,6
Results
A total of 474 patient charts were reviewed, and 278 met inclusion criteria (196 were excluded). Of the included patients, 799 trough levels were analyzed. Of these, 377 (42.2%) were drawn early. There was no significant difference in the baseline characteristics of the early group vs the correctly timed group (Table 1). Of the early troughs, 190 (56.3%) were drawn prior to the third dose of vancomycin. It was observed that a large portion of these troughs occurred after a vancomycin dose adjustment.
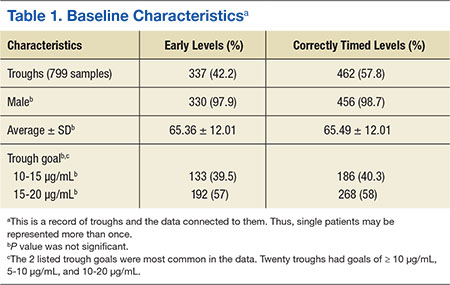
Clinical actions taken after sampling occurred at a rate of 14.5% in the early group and 22.9% in the correctly timed group (P = .003; Table 2). Early troughs led to a 7.7% rate of trough recollection, which was significantly greater than the 1.5% rate in the correctly timed group (P < .001). An analysis of each factor resulting in a clinical action illustrated that the rates of daily dose decrease and discontinued dose were similar between the groups (Table 3). However, the rate of held doses was 8.3% in the early group and 17.1% in the correctly timed group.
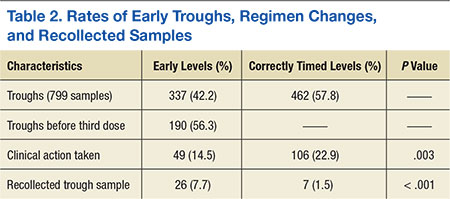
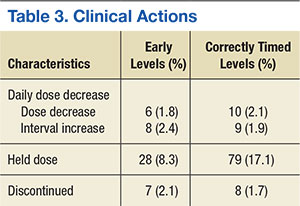
This research process yielded some observations. Occasionally a trough was drawn after vancomycin therapy was discontinued and when there was no concern for nephrotoxicity. After the guidelines were published, providers continued to document in CPRS notes to check troughs before the third dose. This incidence decreased over time. Troughs were taken often in patients who were receiving a short course of therapy or who were hemodynamically stable. Finally, documentation of vancomycin regimen changes occasionally did not match the record in the BCMA (in these situations, the BCMA record was used for this study).
Related: Assessment of High Staphylococcus aureus MIC and Poor Patient Outcomes
Discussion
A large portion of trough levels at the JALFHCC were drawn early and did not adhere to the 2009 consensus guidelines. The rates of early troughs in this study and in the Boston, Massachusetts, study are similar.5 However, the 2 studies differed in 1 significant aspect: Clinical actions were taken less often in the early group at JALFHCC, whereas they were taken more often in the early group in the Boston, Massachusetts, study. This dissimilarity could be attributed to a difference in software between the hospitals. In the previous study, trough levels and the time that they were drawn were not displayed together. Thus, clinicians may have been less likely to gauge whether a trough was early. Since this information is available at the JALFHCC, clinicians may have been aware that the trough was early and avoided adjusting treatment (such as holding a dose, as illustrated in the data) based on a falsely elevated trough. This point is further supported by significantly greater amounts of recollected troughs in the early group, suggesting an understanding that the trough was early.
The low trough recollection rate of 7.7% of all early samples could be due to several factors that would prevent a trough redraw. First, medication discontinuation resulting from course completion or sensitivity results would not require further trough monitoring. Second, practitioners may assess the early sample as insignificantly different from a correctly timed one and elect not to redraw the trough. Sometimes a trough was drawn at the correct time, but the time was recorded incorrectly. In this situation, a new trough level would not be necessary. Finally, a lack of sufficient staffing during nights and weekends may result in a delay in interpreting results leading to a missed opportunity for recollection. Additionally, some troughs may not have been redrawn based on a practitioner’s opinion that a trough was not significantly early and did not represent skewed results. Sometimes an incorrect recording of trough draw time reflected that it was taken after vancomycin dosing when it was not.
Specific observations regarding the timing of the trough indicate other possible concerns and areas for improvement. First, providers must cancel future trough orders concurrently with canceling treatment. Second, at the time of publication of the consensus, some providers were slow adopters of the new guidelines. Finally, the IDSA guidelines state that frequent monitoring for short course, lower intensity therapy, or in patients who are hemodynamically stable is not recommended.3 However, troughs were sometimes measured 2 to 3 times weekly in these patients.
Related: Results mixed in hospital efforts to tackle antimicrobial resistance
The data and observations lead to the conclusion that although providers may be able to discern between early and correctly timed troughs, they were not consistently adherent to the 2009 IDSA guidelines. It has been shown that pharmacy involvement of Medicare patients with infections in the intensive care unit has led to better clinical and monetary outcomes.8 Therefore, continued efforts by clinical pharmacists to monitor trough timing can be used to improve adherence and decrease costs (each trough is estimated to cost $16.97).
A study conducted in Australia demonstrated that pharmacist-led education of vancomycin dosing and monitoring (including when to measure a trough level) among prescribers and nurses led to improved adherence to the current guidelines and a greater number of patients treated within desired therapeutic ranges.9 In addition, a small study at the Atlanta VAMC in Georgia demonstrated that education of nurses, lab personnel, residents, ward clerks, and pharmacists led to a greater number of appropriately timed vancomycin and aminoglycoside levels.10 Thus, an interdisciplinary review of the current IDSA guidelines and review on the publication of the anticipated updated vancomycin guidelines should be provided to hospital personnel to aid in adoption of current dosing and monitoring recommendations.11
Limitations
This study is limited by the 4-year span of time that it encompassed, which may give a skewed depiction of current practices. Another limitation is that patients with fluctuating renal function were included in the analysis. Instead of selecting a random level order, a trough level order was sometimes selected for these patients. This could lead to a lower actual rate of early troughs. A third limitation is that this was a small and unblinded study. Also, the actual trough levels and the resulting changes that were made to specific regimens were not recorded. Thus, these data do not indicate whether the changes that were made reflected guideline recommendations. Finally, some clinical actions were taken after the dosing interval following the trough. This was often a result of off-hours lab results or waiting on attending physician or infectious disease guidance. These data were not included in the analysis.
Conclusion
Vancomycin troughs were often drawn too early and resulted in an increased rate of trough recollection. In an attempt to improve adherence to the current and the upcoming revised version of the IDSA consensus statement, it is recommended to educate and reeducate providers through interdisciplinary-led review sessions.
Author disclosures
The authors report no actual or potential conflicts of interest with regard to this article.
Disclaimer
The opinions expressed herein are those of the authors and do not necessarily reflect those of Federal Practitioner, Frontline Medical Communications Inc., the U.S. Government, or any of its agencies. This article may discuss unlabeled or investigational use of certain drugs. Please review the complete prescribing information for specific drugs or drug combinations—including indications, contraindications, warnings, and adverse effects—before administering pharmacologic therapy to patients.
1. Moellering RC Jr. Vancomycin: a 50-year reassessment. Clin Infect Dis. 2006;42(suppl 1):S3-S4.
2. Levine DP. Vancomycin: a history. Clin Infect Dis. 2006;42(suppl 1):S5-S12.
3. Rybak MJ, Lomaestro BM, Rotschafer JC, et al. Therapeutic monitoring of vancomycin in adults summary of consensus recommendations from the American Society of Health-System Pharmacists, the Infectious Diseases Society of America, and the Society of Infectious Diseases Pharmacists. Pharmacotherapy. 2009;29(11):1275-1279.
4. Davis SL, Scheetz MH, Bosso JA, Goff DA, Rybak MJ. Adherence to the 2009 consensus guidelines for vancomycin dosing and monitoring practices: a cross-sectional survey of U.S. hospitals. Pharmacotherapy. 2013;33(12):1256-1263.
5. Morrison AP, Melanson SEF, Carty MG, Bates DW, Szumita PM, Tanasijevic MJ. What proportion of vancomycin trough levels are drawn too early? Frequency and impact on clinical actions. Am J Clin Pathol. 2012;137(3):472-478.
6. Traugott KA, Maxwell PR, Green K, Frei C, Lewis JS 2nd. Effects of therapeutic drug monitoring criteria in a computerized prescriber-order-entry system on the appropriateness of vancomycin level orders. Am J Health Syst Pharm. 2011;68(4):347-352.
7. Melanson SE, Mijailovic AS, Wright AP, Szumita PM, Bates DW, Tanasijevic MJ. An intervention to improve the timing of vancomycin levels. Am J Clin Pathol. 2013;140(6):801-806.
8. MacLaren R, Bond CA, Martin SJ, Fike D. Clinical and economic outcomes of involving pharmacists in the direct care of critically ill patients with infections. Crit Care Med. 2008;36(12):3184-3189.
9. Phillips CJ, Doan H, Quinn S, Kirkpatrick CM, Gordon DL, Doogue MP. An educational intervention to improve vancomycin prescribing and monitoring. Int J Antimicrob Agents. 2013;41(4):393-394.
10. Carroll DJ, Austin GE, Stajich GV, Miyrhaya RK, Murphy JE, Ward ES. Effect of education on the appropriateness of serum drug concentration determination. Ther Drug Monit. 1992;14(1):81-84.
11. Infectious Diseases Society of America (IDSA). IDSA practice guidelines: antimicrobial agent use. IDSA Website. 2015. http://www.idsociety.org/Antimicrobial_Agents. Accessed November 16, 2015.
Vancomycin was isolated in the 1950s, but due to impurities causing adverse events and semisynthetic penicillin production, its use was greatly reduced.1,2 However, this medication gained in popularity 30 years later as a first-line treatment for methicillin-resistant Staphylococcus aureus infections.
In 2009 the Infectious Diseases Society of America (IDSA), American Society of Health System Pharmacists, and Society of Infectious Diseases Pharmacists developed a consensus review of the therapeutic monitoring and dosing of vancomycin in adult patients.3 Trough serum concentration levels are recommended as the most accurate and convenient method to monitor vancomycin. Per IDSA guidelines, an optimal trough is intended to be high enough to clear infections (> 10 mg/L) and prevent the development of vancomycin intermediate and resistant bacteria. Troughs should be obtained just before the next dose in steady-state conditions (starting just before the fourth dose) in patients with normal renal function.
Since the development of these guidelines, vancomycin trough levels are often drawn early.4-7 This may lead to an overestimation of the true trough concentration. A study by Morrison and colleagues in Boston, Massachusetts, found that 41.3% of vancomycin troughs were drawn early, and this resulted in statistically significant increases in the vancomycin concentrations, the rate of vancomycin regimen adjustments (decrease, discontinuation, or holding of dose), and the repeat vancomycin level orders compared with correctly timed troughs.5 It was noted by the study authors that lowering the daily dose of vancomycin based on early trough levels could lead to an underdosing of vancomycin and an increase in intermediate or resistant bacteria.
Related: IDWEEK: Antibiotic ‘time-out’ cut vancomycin use
The prevalence and implications of early trough samples have been measured at only 1 facility, and it is unknown whether these data can be reproduced elsewhere.5 Thus, this study sought to determine the prevalence and corresponding clinical actions of early trough levels at the Captain James A. Lovell Federal Health Care Center (JALFHCC). This is a unique facility that in 2010 combined a VA hospital with a DoD hospital. This facility cares for 67,000 military and retiree beneficiaries each year from southwestern Wisconsin and northwestern Illinois.The primary objective of this study was to measure the rate of early troughs drawn and their resultant effect on vancomycin regimens compared with correctly timed troughs. Secondarily, this study sought to compare the rate of repeated vancomycin trough levels in early vs correctly timed measurements.
Methods
This retrospective cohort analysis compared the outcomes of early and correctly timed vancomycin troughs. This study was approved by the Edward Hines, Jr. VA Hospital and JALFHCC Institutional Review Board. Veteran patients aged ≥ 18 years, hospitalized at JALFHCC, and receiving IV vancomycin at dosing intervals of 8, 12, 24, and 48 hours with measured trough levels between July 1, 2009, and July 1, 2013, were included in this study. Patients were excluded from analysis if vancomycin was given at any schedule other than the previously stated frequencies, they received hemodialysis during the treatment period, or their insurance coverage was through TRICARE (these patients had either active-duty or retired active-duty status).
Potentially eligible patients were identified via a Computerized Patient Records System (CPRS) search for laboratory vancomycin level measurements. The search supplied the researcher with the patient name, vancomycin level date and time, type of vancomycin level (trough or random), and vancomycin concentration. With this information, further data were gathered through CPRS: demographics, type of clinical infection, desired trough level (inferred if not listed in CPRS note), and vancomycin administration time (through the bar code medication administration system [BCMA] in CPRS). This analysis was of troughs, and multiple troughs may have originated from the same patient.
An early trough was defined as a trough taken more than 2 hours earlier than the next theoretical administration time or anytime before the third dose. After a trough was determined to be early or on time, the clinical actions taken during the dosing interval following sample collection were documented. A dose was considered to be held if stated in the BCMA or in a CPRS provider note. A dose was considered to be decreased with a change in frequency or strength that resulted in an overall daily dose decrease. A recollected vancomycin trough was counted within 24 hours of the trough or per a note in CPRS. Finally, observations that noted trends in vancomycin trough management were recorded.
The chi-square test with a significance criterion of 0.05 was used to compare early and on time troughs. Based on the results from the Boston, Massachusetts, study and 1 other study, about 780 vancomycin troughs would be required to meet significance in the primary outcome.5,6
Results
A total of 474 patient charts were reviewed, and 278 met inclusion criteria (196 were excluded). Of the included patients, 799 trough levels were analyzed. Of these, 377 (42.2%) were drawn early. There was no significant difference in the baseline characteristics of the early group vs the correctly timed group (Table 1). Of the early troughs, 190 (56.3%) were drawn prior to the third dose of vancomycin. It was observed that a large portion of these troughs occurred after a vancomycin dose adjustment.
Clinical actions taken after sampling occurred at a rate of 14.5% in the early group and 22.9% in the correctly timed group (P = .003; Table 2). Early troughs led to a 7.7% rate of trough recollection, which was significantly greater than the 1.5% rate in the correctly timed group (P < .001). An analysis of each factor resulting in a clinical action illustrated that the rates of daily dose decrease and discontinued dose were similar between the groups (Table 3). However, the rate of held doses was 8.3% in the early group and 17.1% in the correctly timed group.
This research process yielded some observations. Occasionally a trough was drawn after vancomycin therapy was discontinued and when there was no concern for nephrotoxicity. After the guidelines were published, providers continued to document in CPRS notes to check troughs before the third dose. This incidence decreased over time. Troughs were taken often in patients who were receiving a short course of therapy or who were hemodynamically stable. Finally, documentation of vancomycin regimen changes occasionally did not match the record in the BCMA (in these situations, the BCMA record was used for this study).
Related: Assessment of High Staphylococcus aureus MIC and Poor Patient Outcomes
Discussion
A large portion of trough levels at the JALFHCC were drawn early and did not adhere to the 2009 consensus guidelines. The rates of early troughs in this study and in the Boston, Massachusetts, study are similar.5 However, the 2 studies differed in 1 significant aspect: Clinical actions were taken less often in the early group at JALFHCC, whereas they were taken more often in the early group in the Boston, Massachusetts, study. This dissimilarity could be attributed to a difference in software between the hospitals. In the previous study, trough levels and the time that they were drawn were not displayed together. Thus, clinicians may have been less likely to gauge whether a trough was early. Since this information is available at the JALFHCC, clinicians may have been aware that the trough was early and avoided adjusting treatment (such as holding a dose, as illustrated in the data) based on a falsely elevated trough. This point is further supported by significantly greater amounts of recollected troughs in the early group, suggesting an understanding that the trough was early.
The low trough recollection rate of 7.7% of all early samples could be due to several factors that would prevent a trough redraw. First, medication discontinuation resulting from course completion or sensitivity results would not require further trough monitoring. Second, practitioners may assess the early sample as insignificantly different from a correctly timed one and elect not to redraw the trough. Sometimes a trough was drawn at the correct time, but the time was recorded incorrectly. In this situation, a new trough level would not be necessary. Finally, a lack of sufficient staffing during nights and weekends may result in a delay in interpreting results leading to a missed opportunity for recollection. Additionally, some troughs may not have been redrawn based on a practitioner’s opinion that a trough was not significantly early and did not represent skewed results. Sometimes an incorrect recording of trough draw time reflected that it was taken after vancomycin dosing when it was not.
Specific observations regarding the timing of the trough indicate other possible concerns and areas for improvement. First, providers must cancel future trough orders concurrently with canceling treatment. Second, at the time of publication of the consensus, some providers were slow adopters of the new guidelines. Finally, the IDSA guidelines state that frequent monitoring for short course, lower intensity therapy, or in patients who are hemodynamically stable is not recommended.3 However, troughs were sometimes measured 2 to 3 times weekly in these patients.
Related: Results mixed in hospital efforts to tackle antimicrobial resistance
The data and observations lead to the conclusion that although providers may be able to discern between early and correctly timed troughs, they were not consistently adherent to the 2009 IDSA guidelines. It has been shown that pharmacy involvement of Medicare patients with infections in the intensive care unit has led to better clinical and monetary outcomes.8 Therefore, continued efforts by clinical pharmacists to monitor trough timing can be used to improve adherence and decrease costs (each trough is estimated to cost $16.97).
A study conducted in Australia demonstrated that pharmacist-led education of vancomycin dosing and monitoring (including when to measure a trough level) among prescribers and nurses led to improved adherence to the current guidelines and a greater number of patients treated within desired therapeutic ranges.9 In addition, a small study at the Atlanta VAMC in Georgia demonstrated that education of nurses, lab personnel, residents, ward clerks, and pharmacists led to a greater number of appropriately timed vancomycin and aminoglycoside levels.10 Thus, an interdisciplinary review of the current IDSA guidelines and review on the publication of the anticipated updated vancomycin guidelines should be provided to hospital personnel to aid in adoption of current dosing and monitoring recommendations.11
Limitations
This study is limited by the 4-year span of time that it encompassed, which may give a skewed depiction of current practices. Another limitation is that patients with fluctuating renal function were included in the analysis. Instead of selecting a random level order, a trough level order was sometimes selected for these patients. This could lead to a lower actual rate of early troughs. A third limitation is that this was a small and unblinded study. Also, the actual trough levels and the resulting changes that were made to specific regimens were not recorded. Thus, these data do not indicate whether the changes that were made reflected guideline recommendations. Finally, some clinical actions were taken after the dosing interval following the trough. This was often a result of off-hours lab results or waiting on attending physician or infectious disease guidance. These data were not included in the analysis.
Conclusion
Vancomycin troughs were often drawn too early and resulted in an increased rate of trough recollection. In an attempt to improve adherence to the current and the upcoming revised version of the IDSA consensus statement, it is recommended to educate and reeducate providers through interdisciplinary-led review sessions.
Author disclosures
The authors report no actual or potential conflicts of interest with regard to this article.
Disclaimer
The opinions expressed herein are those of the authors and do not necessarily reflect those of Federal Practitioner, Frontline Medical Communications Inc., the U.S. Government, or any of its agencies. This article may discuss unlabeled or investigational use of certain drugs. Please review the complete prescribing information for specific drugs or drug combinations—including indications, contraindications, warnings, and adverse effects—before administering pharmacologic therapy to patients.
1. Moellering RC Jr. Vancomycin: a 50-year reassessment. Clin Infect Dis. 2006;42(suppl 1):S3-S4.
2. Levine DP. Vancomycin: a history. Clin Infect Dis. 2006;42(suppl 1):S5-S12.
3. Rybak MJ, Lomaestro BM, Rotschafer JC, et al. Therapeutic monitoring of vancomycin in adults summary of consensus recommendations from the American Society of Health-System Pharmacists, the Infectious Diseases Society of America, and the Society of Infectious Diseases Pharmacists. Pharmacotherapy. 2009;29(11):1275-1279.
4. Davis SL, Scheetz MH, Bosso JA, Goff DA, Rybak MJ. Adherence to the 2009 consensus guidelines for vancomycin dosing and monitoring practices: a cross-sectional survey of U.S. hospitals. Pharmacotherapy. 2013;33(12):1256-1263.
5. Morrison AP, Melanson SEF, Carty MG, Bates DW, Szumita PM, Tanasijevic MJ. What proportion of vancomycin trough levels are drawn too early? Frequency and impact on clinical actions. Am J Clin Pathol. 2012;137(3):472-478.
6. Traugott KA, Maxwell PR, Green K, Frei C, Lewis JS 2nd. Effects of therapeutic drug monitoring criteria in a computerized prescriber-order-entry system on the appropriateness of vancomycin level orders. Am J Health Syst Pharm. 2011;68(4):347-352.
7. Melanson SE, Mijailovic AS, Wright AP, Szumita PM, Bates DW, Tanasijevic MJ. An intervention to improve the timing of vancomycin levels. Am J Clin Pathol. 2013;140(6):801-806.
8. MacLaren R, Bond CA, Martin SJ, Fike D. Clinical and economic outcomes of involving pharmacists in the direct care of critically ill patients with infections. Crit Care Med. 2008;36(12):3184-3189.
9. Phillips CJ, Doan H, Quinn S, Kirkpatrick CM, Gordon DL, Doogue MP. An educational intervention to improve vancomycin prescribing and monitoring. Int J Antimicrob Agents. 2013;41(4):393-394.
10. Carroll DJ, Austin GE, Stajich GV, Miyrhaya RK, Murphy JE, Ward ES. Effect of education on the appropriateness of serum drug concentration determination. Ther Drug Monit. 1992;14(1):81-84.
11. Infectious Diseases Society of America (IDSA). IDSA practice guidelines: antimicrobial agent use. IDSA Website. 2015. http://www.idsociety.org/Antimicrobial_Agents. Accessed November 16, 2015.
Shared Medical Appointments and Their Effects on Achieving Diabetes Mellitus Goals in a Veteran Population
In 2012, 9.3% of the U.S. population had diabetes mellitus (DM).1 According to the American Diabetes Association, in 2012, the total cost of diagnosed DM in the U.S. was $245 billion.2 Diabetes mellitus is a leading cause of blindness, end-stage renal disease, and amputation in the U.S.3 Up to 80% of patients with DM will develop or die of macrovascular disease, such as heart attack or stroke.3
Diabetes mellitus is a chronic disease of epidemic proportion with management complexity that threatens to overwhelm providers in the acute care and primary care settings. Limited specialist availability and increased wait times continue to afflict the VA health care system, prompting efforts to increase health care provider (HCP) access and improve clinic efficiency.4 One of the methods proposed to increase HCP access and maximize clinic efficiency is the shared medical appointment (SMA).5,6
The SMA was designed to improve access and quality of care through enhanced education and support. With the number of people living with chronic diseases on the rise, the current patient-provider model is unrealistic in today’s health care environment. Shared medical appointments offer a unique format for providing evidence-based chronic disease management in which patients and a multidisciplinary team of providers collaborate toward education, discussion, and medication management in a supportive environment.7 Research has suggested that SMAs are a successful way to manage type 2 DM (T2DM).8,9 However, there is uncertainty regarding the optimal model design. The goals of this study were to evaluate whether the diabetes SMA at the Adam Benjamin, Jr. (ABJ) community-based outpatient clinic (CBOC) was an effective practice model for achieving improvements in glycemic control and to use subgroup analyses to elucidate unique characteristics about SMAs that may have been correlated with clinical success. This study may provide valuable information for other facilities considering SMAs.
Overview
The Jesse Brown VAMC (JBVAMC) and the ABJ CBOC implemented a T2DM-focused SMA in 2011. The ABJ CBOC multidisciplinary SMA team consisted of a medical administration service clerk, a registered dietician, a certified DM educator, a registered nurse, a nurse practitioner (NP), and a clinical pharmacy specialist (CPS). This team collaborated to deliver high-quality care to patients with poorly controlled T2DM to improve their glycemic control as well as clinical knowledge of their disease. A private conference room at the ABJ CBOC served as the location for the SMAs. This room was divided into 2 adjacent areas: One area with tables was organized in a semicircle to promote group discussion as well as minimize isolated conversations; the other area had computer terminals to facilitate individualized medication management. Other equipment included a scale for obtaining patient weights and various audio-visual devices.
The ABJ CBOC offered monthly SMAs. The team made several attempts to maximize SMA show rates, as previous studies indicated that low SMA show rates were a barrier to success.3,4,7-9 One review reported no-show rates as high as 70% in certain group visit models.4 About 2 weeks prior to a session, prospective SMA patients received automated and customized preappointment letters. Automated and customized phone call reminders were made to prospective SMA patients a few days before each session. As many as 18 patients participated in a single ABJ SMA.
The ABJ SMAs lasted from 60 to 90 minutes, depending on the level of patient participation and the size of the group. The first half of the SMA was dedicated to a group discussion, which involved the SMA team, the patient, and the patient’s family (if desired). The topic of conversation was typically guided by patient curiosity and knowledge deficits in a spontaneous and free-flowing manner; for this reason, these sessions were considered to be open.
The team also engaged in more structured focused sessions, which limited the spontaneous flow of conservation and narrowed the scope to provide targeted education about various aspects of T2DM care. During focused sessions, services such as dental, optometry, podiatry, MOVE! (a VA self-management weight reduction program), and nutrition also participated. Focused sessions addressed topics such as hypoglycemia management, eating around the holidays, sick-day management of T2DM, grocery shopping, exercise, oral health, eye care, and foot care. The specialty services were encouraged to be creative and interactive during the SMA. Many of these services used supportive literature, demonstrations, diagrams, and props to enrich the educational experience. Group discussion typically lasted 30 to 40 minutes; after which patients met individually with either a CPS or NP for medication management.
Medication management focused on optimizing T2DM therapy (both oral and injectable) to improve glycemic control. Interventions outside of T2DM therapy (eg, cholesterol, hypertension, and other risk reduction modalities) were not made, due to time constraints. Once a patient demonstrated improved working knowledge of T2DM and a clinically significant reduction in their glycosylated hemoglobin A1c (A1c) they were discharged from SMAs at the discretion of the SMA team. There was no set minimum or maximum duration for the SMAs.
Methods
This study was a retrospective chart review conducted at the JBVAMC and was approved by the institutional review board and the research and development committee. Patient confidentiality was maintained by identifying patients by means other than name or unique identifiers. Protected health information was accessible only by the aforementioned investigators. There was no direct patient contact during this study.
Patient lists were generated from the computerized patient record system (CPRS). Patients were tracked up to 6 months after SMA discharge or until the last SMA in which they participated. The control group was matched according to location, age, glycemic control, and time. The control group never attended an ABJ SMA but may have received regular care through their primary care provider, CPS, or endocrinologist. Prospective control group patients were randomized and reviewed sequentially to obtain the matched cohort.
The study took place at ABJ, an outpatient clinic serving veterans in northwest Indiana and surrounding areas. Inclusion criteria for the SMA group were patients with T2DM, aged ≥ 45 years, with an A1c ≥ 8.5% seen at ABJ for T2DM from May 1, 2011, to June 30, 2013. The control group included patients with T2DM, aged ≥ 45 years, with an A1c > 9% who never attended SMAs but may have received regular care at ABJ during the study period. The SMA group’s inclusion criteria threshold for A1c was lower in order to maximize sample size. The control group’s inclusion criteria threshold for A1c was higher due to use of a default reminder report called “A1c > 9%” to generate patient lists. Patients were excluded from the study if they did not meet inclusion criteria.
Baseline datum was the most recent parameter available in CPRS prior to enrollment. The endpoint datum was the parameter nearest the time of SMA discharge or the first available parameter within 6 months from the date of discharge. In the control group, the baseline datum was the initial parameter during the study period and the endpoint datum was the closest measure to 4 months after baseline. Four months was chosen to allow for at least 1 A1c measurement during the study period. In addition, it was estimated (prior to collecting any data) that 4 months was the average time a patient participated in SMAs. Serial A1c measurements were defined as values obtained at SMA discharge and 3- and 6-months postdischarge. These parameters were used to evaluate the sustainability of improvements in glycemic control. All values falling outside of these defined parameters were excluded.
Related: Experiences of Veterans With Diabetes From Shared Medical Appointments
The data analysis compared A1c change from baseline to endpoint for the SMA and control groups. Data collection included baseline characteristics, SMA show rate, number of SMA patients seen by a CPS or NP, number and type of SMA interventions made by a CPS or NP, and the number and type of non-SMA interventions made during the study period. Intervention types were medications: added, discontinued, or titrated; and other, defined as referrals made to specialty services (such as dental, optometry, and podiatry).
Secondary endpoints included the number of SMAs and glycemic improvement, SMA format style (open- vs focused session) and glycemic improvement, SMA provider (CPS vs NP) and glycemic improvement, the change in A1c stratified by baseline A1c (A1c ≥ 10% vs < 10%), the change in actual body weight (ABW) and body mass index (BMI), and maintenance of A1c (3- and 6-months postdischarge).
The primary endpoint was evaluated using a 2-sample Student t test. Secondary endpoints were evaluated using the independent t test. Statistical significance was defined as P < .05.
Results
A total of 129 unique patients were scheduled for SMAs, 62 of which met inclusion criteria and were included in the SMA group. During enrollment, 67 patients were excluded: 55 never participated in SMAs, 6 had baseline A1c values < 8.5%, 4 had insufficient data, and 2 were aged < 45 years. A total of 29 SMAs were conducted during the study period, and patients attended an average of 3.15 ± 2.14 (SD) SMAs. The average attendance at each SMA was 7.1 ± 2.62 (SD) patients. For the control group, 754 unique patients were identified and randomized. A total of 90 charts were sequentially reviewed in order to obtain the 62 patients for the control group.
Baseline characteristics were balanced between groups. However, there were more women in the SMA group vs the control group (Table 1). Within the control group, there were a total of 107 appointments that addressed T2DM, which averaged 1.72 ± 1.51 (SD) appointments per patient. The total number of interventions made in the SMA group was 192: 64.6% (124) by a CPS and 35.4% (68) by a NP. For the CPS, the most frequent intervention was medication titration (69.5%), followed by other (23.5%), medication addition (4%), and medication discontinuation (3%). Of note, 53.2% (33) of the SMA patients were seen an average of 1.2 times by non-SMA providers. The SMA patients had a total of 45 non-SMA interventions (0.73 per patient) during the study period.
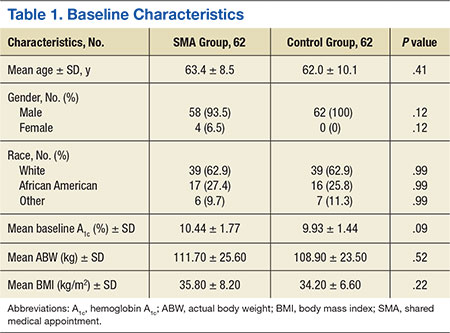
For the primary endpoint, the SMA group had a 1.48% ± 0.02 (SD) reduction in A1c compared with a 0.6% ± 0.02 (SD) decrease in the control group (P = .01). When evaluating mean changes in A1c by the number of SMAs attended, it was noted that participation in ≥ 6 SMAs led to the greatest reduction in A1c of 2.08%. In the SMA group, it was noted that patients with higher A1c values at baseline demonstrated greater improvements in glycemic control compared with patients with lower baseline A1c values. The mean change in A1c, stratified by baseline A1c, was -2.26% for those with baseline A1c values ≥ 10% and -0.87% for those with baseline A1c values < 10%.
In evaluating the format style, open- vs focused-session, it was observed that participation in focused sessions led to greater improvements in glycemic control. Furthermore, when stratified by provider, greater improvements in glycemic control were demonstrated when medication management was completed by a CPS vs a NP (Table 2). The average number of interventions per SMA patient was 3.1 ± 2.22 (SD). For the control group, the total number of interventions made was 86, with an average of 1.37 ± 1.51 (SD) per patient. The overall show rate was 49% ± 16 (SD), 52% ± 16 (SD) for open visits, and 46% ± 15 (SD) for focused visits. The mean change in ABW and BMI from baseline to endpoint was no different between the SMA and control groups (Table 3). The SMA group participants demonstrated a decrease in A1c at 3 months postdischarge, and a moderate increase in A1c was noted at 6 months postdischarge.
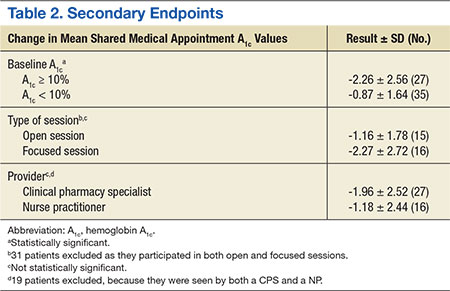
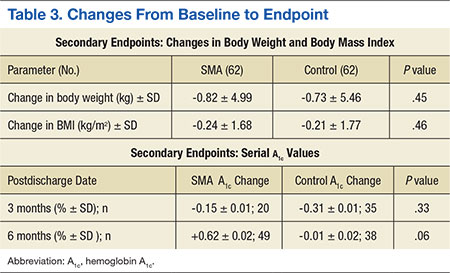
Discussion
Shared medical appointments provide an effective alternative to standards of care in order to obtain improvements in glycemic control. Consistent with previous studies, this study reported significant improvements in glycemic control in the SMA group vs the control group. This study also elucidated unique characteristics about SMAs that may have been correlated with clinical success.
Although the greatest improvements in glycemic control were noted for those who participated in ≥ 6 SMAs, it was observed that participation in only 1 SMA also led to improvements. For a site with limited staff and a high volume of patients waiting to participate in SMAs, it may be mutually beneficial to offer only 1 SMA per patient. In addition, patients with ≥ 10% A1c at baseline demonstrated greater improvements in glycemic control compared to those with < 10% A1c at baseline. The reasons the higher baseline A1c subgroup responded to interventions more robustly are unclear and likely multifactorial. Nonetheless, factors such as psychosocial influences (eg, peer pressure to get healthy) may have increased motivation to prevent complications and improved medication adherence in the setting of closer follow-up. Additionally, hyperresponsiveness to drug therapy may have played a role. Regardless, for new SMA programs interested in making an immediate impact, it may be advantageous to initially select patients with very poorly controlled DM.
A unique aspect of the ABJ SMA was the variety of focused sessions offered. Previous studies did not demonstrate such a variety of focused sessions, nor did they evaluate the impact of a focused visit on the patient’s T2DM control. Participation in focused ABJ SMA sessions may have led to improved T2DM control, which may be attributed to the value patients assigned to specialty care and an increased motivation to get healthy.
Related: SGLT2 Inhibitors for Type 2 Diabetes Mellitus Treatment
Another factor that may have led to improved T2DM control was CPS involvement with medication management. The presence of a NP was highly valued, both from a group discussion and medication management standpoint; still, it is a good idea to involve a CPS who has a strong command of DM pharmacotherapy. One shortcoming of this SMA program was the inability for patients to maintain glycemic improvements 6 months after discharge. This pitfall was likely the result of suboptimal coordination of care after SMA discharge and may be avoided by asking the medical administration service clerk to promptly schedule discharged SMA patients for a general medicine clinic T2DM follow-up.The SMA patients had more T2DM interventions within the same time frame compared with the control patients. Although not causative, the increased number of interventions in addition to the bolstered support of the SMA may have correlated with glycemic improvements.
An important finding of this study was the SMA show rate and how it compared with attendance rates found in other group models. The favorable ABJ SMA show rate could have been due to the rigorous attention paid to reminder letters and phone calls. The literature has not established a standard approach to increasing SMA show rates; however, the current data suggest that increased reminders may have increased attendance.
Limitations
This study had several limitations. The external validity was weakened by the modest sample size and the homogenous baseline characteristics of those enrolled. Another limitation was inconsistent documentation of laboratory parameters. The inability to obtain A1c values exactly at enrollment and discharge could have potentially skewed the results. In addition, incomplete documentation of interventions for dual-care patients (ie, those who obtained care outside of the VA) was an unavoidable challenge. Last, this study did not perform an assessment of SMA patient satisfaction, cost-benefit, or safety.
Conclusion
The ABJ SMA was an effective addition to standards of care in order to achieve improvements in glycemic control in a veteran population with poorly controlled T2DM. Furthermore,the data suggest that a successful program should be multidisciplinary, select poorly controlled patients, offer focused sessions, have a CPS participate in medication management, and encourage patients to complete ≥ 6 sessions. Future studies should be conducted to include more diverse patients to see whether the efficacy of this SMA format is maintained.
A safety analysis should also be conducted to ensure that the SMA format is not only effective, but also a safe means to manage medical conditions. In addition, the scope of the ABJ SMAs should be expanded to allow for evaluation of other diseases. An evaluation of patient satisfaction and cost-benefit could provide additional support for the implementation of SMAs, as improvements in quality of life and cost savings are endpoints to be desired.
Author disclosures
The authors report no actual or potential conflicts of interest with regard to this article.
Disclaimer
The opinions expressed herein are those of the authors and do not necessarily reflect those of Federal Practitioner, Frontline Medical Communications Inc., the U.S. Government, or any of its agencies. This article may discuss unlabeled or investigational use of certain drugs. Please review complete prescribing information for specific drugs or drug combinations—including indications, contraindications, warnings, and adverse effects—before administering pharmacologic therapy to patients.
1. Centers for Disease Control and Prevention. National Diabetes Statistics Report: Estimate of Diabetes and Its Burden in the United States, 2014. Atlanta, GA: U.S. Department of Health and Human Services; 2014.
2. American Diabetes Association. Economic costs of diabetes in the U.S. in 2012. Diabetes Care. 2013;36(4):1033-1046.
3. Kirsh SR, Watts S, Pascuzzi K, et al. Shared medical appointments based on the chronic care model: a quality improvement project to address the challenges of patients with diabetes with high cardiovascular risk. Qual Saf Health Care. 2007;16(5):349-353.
4. Jaber R, Braksmajer A, Trilling JS. Group visits: a qualitative review of current research. J Am Board Fam Med. 2006;19(3):276-290.
5. Klein S. The Veterans Health Administration: implementing patient-centered medical homes in the nation's largest integrated delivery system. Commonwealth Fund Website. http://www.common wealthfund.org/publications/case-studies/2011 /sep/va-medical-homes. Published September 2011. Accessed November 11, 2015.
6. U.S. Department of Veterans Affairs. VA Shared Medical Appointments for Patients With Diabetes: Maximizing Patient & Provider Expertise to Strengthen Patient Management. Washington, DC: U.S. Department of Veterans Affairs; 2008.
7. Bronson DL, Maxwell RA. Shared medical appointments: increasing patient access without increasing physician hours. Cleve Clin J Med. 2004;71(5):369-370, 372, 374 passim.
8. Cohen LB, Taveira T, Khatana SA, Dooley AG, Pirraglia PA, Wu WC. Pharmacist-led shared medical appointments for multiple cardiovascular risk reduction in patients with type 2 diabetes. Diabetes Educ. 2011;37(6):801-812.
9. Naik AD, Palmer N, Petersen NJ, et al. Comparative effectiveness of goal setting in diabetes mellitus group clinics: randomized clinical trial. Arch Intern Med. 2011;171(5):453-459.
In 2012, 9.3% of the U.S. population had diabetes mellitus (DM).1 According to the American Diabetes Association, in 2012, the total cost of diagnosed DM in the U.S. was $245 billion.2 Diabetes mellitus is a leading cause of blindness, end-stage renal disease, and amputation in the U.S.3 Up to 80% of patients with DM will develop or die of macrovascular disease, such as heart attack or stroke.3
Diabetes mellitus is a chronic disease of epidemic proportion with management complexity that threatens to overwhelm providers in the acute care and primary care settings. Limited specialist availability and increased wait times continue to afflict the VA health care system, prompting efforts to increase health care provider (HCP) access and improve clinic efficiency.4 One of the methods proposed to increase HCP access and maximize clinic efficiency is the shared medical appointment (SMA).5,6
The SMA was designed to improve access and quality of care through enhanced education and support. With the number of people living with chronic diseases on the rise, the current patient-provider model is unrealistic in today’s health care environment. Shared medical appointments offer a unique format for providing evidence-based chronic disease management in which patients and a multidisciplinary team of providers collaborate toward education, discussion, and medication management in a supportive environment.7 Research has suggested that SMAs are a successful way to manage type 2 DM (T2DM).8,9 However, there is uncertainty regarding the optimal model design. The goals of this study were to evaluate whether the diabetes SMA at the Adam Benjamin, Jr. (ABJ) community-based outpatient clinic (CBOC) was an effective practice model for achieving improvements in glycemic control and to use subgroup analyses to elucidate unique characteristics about SMAs that may have been correlated with clinical success. This study may provide valuable information for other facilities considering SMAs.
Overview
The Jesse Brown VAMC (JBVAMC) and the ABJ CBOC implemented a T2DM-focused SMA in 2011. The ABJ CBOC multidisciplinary SMA team consisted of a medical administration service clerk, a registered dietician, a certified DM educator, a registered nurse, a nurse practitioner (NP), and a clinical pharmacy specialist (CPS). This team collaborated to deliver high-quality care to patients with poorly controlled T2DM to improve their glycemic control as well as clinical knowledge of their disease. A private conference room at the ABJ CBOC served as the location for the SMAs. This room was divided into 2 adjacent areas: One area with tables was organized in a semicircle to promote group discussion as well as minimize isolated conversations; the other area had computer terminals to facilitate individualized medication management. Other equipment included a scale for obtaining patient weights and various audio-visual devices.
The ABJ CBOC offered monthly SMAs. The team made several attempts to maximize SMA show rates, as previous studies indicated that low SMA show rates were a barrier to success.3,4,7-9 One review reported no-show rates as high as 70% in certain group visit models.4 About 2 weeks prior to a session, prospective SMA patients received automated and customized preappointment letters. Automated and customized phone call reminders were made to prospective SMA patients a few days before each session. As many as 18 patients participated in a single ABJ SMA.
The ABJ SMAs lasted from 60 to 90 minutes, depending on the level of patient participation and the size of the group. The first half of the SMA was dedicated to a group discussion, which involved the SMA team, the patient, and the patient’s family (if desired). The topic of conversation was typically guided by patient curiosity and knowledge deficits in a spontaneous and free-flowing manner; for this reason, these sessions were considered to be open.
The team also engaged in more structured focused sessions, which limited the spontaneous flow of conservation and narrowed the scope to provide targeted education about various aspects of T2DM care. During focused sessions, services such as dental, optometry, podiatry, MOVE! (a VA self-management weight reduction program), and nutrition also participated. Focused sessions addressed topics such as hypoglycemia management, eating around the holidays, sick-day management of T2DM, grocery shopping, exercise, oral health, eye care, and foot care. The specialty services were encouraged to be creative and interactive during the SMA. Many of these services used supportive literature, demonstrations, diagrams, and props to enrich the educational experience. Group discussion typically lasted 30 to 40 minutes; after which patients met individually with either a CPS or NP for medication management.
Medication management focused on optimizing T2DM therapy (both oral and injectable) to improve glycemic control. Interventions outside of T2DM therapy (eg, cholesterol, hypertension, and other risk reduction modalities) were not made, due to time constraints. Once a patient demonstrated improved working knowledge of T2DM and a clinically significant reduction in their glycosylated hemoglobin A1c (A1c) they were discharged from SMAs at the discretion of the SMA team. There was no set minimum or maximum duration for the SMAs.
Methods
This study was a retrospective chart review conducted at the JBVAMC and was approved by the institutional review board and the research and development committee. Patient confidentiality was maintained by identifying patients by means other than name or unique identifiers. Protected health information was accessible only by the aforementioned investigators. There was no direct patient contact during this study.
Patient lists were generated from the computerized patient record system (CPRS). Patients were tracked up to 6 months after SMA discharge or until the last SMA in which they participated. The control group was matched according to location, age, glycemic control, and time. The control group never attended an ABJ SMA but may have received regular care through their primary care provider, CPS, or endocrinologist. Prospective control group patients were randomized and reviewed sequentially to obtain the matched cohort.
The study took place at ABJ, an outpatient clinic serving veterans in northwest Indiana and surrounding areas. Inclusion criteria for the SMA group were patients with T2DM, aged ≥ 45 years, with an A1c ≥ 8.5% seen at ABJ for T2DM from May 1, 2011, to June 30, 2013. The control group included patients with T2DM, aged ≥ 45 years, with an A1c > 9% who never attended SMAs but may have received regular care at ABJ during the study period. The SMA group’s inclusion criteria threshold for A1c was lower in order to maximize sample size. The control group’s inclusion criteria threshold for A1c was higher due to use of a default reminder report called “A1c > 9%” to generate patient lists. Patients were excluded from the study if they did not meet inclusion criteria.
Baseline datum was the most recent parameter available in CPRS prior to enrollment. The endpoint datum was the parameter nearest the time of SMA discharge or the first available parameter within 6 months from the date of discharge. In the control group, the baseline datum was the initial parameter during the study period and the endpoint datum was the closest measure to 4 months after baseline. Four months was chosen to allow for at least 1 A1c measurement during the study period. In addition, it was estimated (prior to collecting any data) that 4 months was the average time a patient participated in SMAs. Serial A1c measurements were defined as values obtained at SMA discharge and 3- and 6-months postdischarge. These parameters were used to evaluate the sustainability of improvements in glycemic control. All values falling outside of these defined parameters were excluded.
Related: Experiences of Veterans With Diabetes From Shared Medical Appointments
The data analysis compared A1c change from baseline to endpoint for the SMA and control groups. Data collection included baseline characteristics, SMA show rate, number of SMA patients seen by a CPS or NP, number and type of SMA interventions made by a CPS or NP, and the number and type of non-SMA interventions made during the study period. Intervention types were medications: added, discontinued, or titrated; and other, defined as referrals made to specialty services (such as dental, optometry, and podiatry).
Secondary endpoints included the number of SMAs and glycemic improvement, SMA format style (open- vs focused session) and glycemic improvement, SMA provider (CPS vs NP) and glycemic improvement, the change in A1c stratified by baseline A1c (A1c ≥ 10% vs < 10%), the change in actual body weight (ABW) and body mass index (BMI), and maintenance of A1c (3- and 6-months postdischarge).
The primary endpoint was evaluated using a 2-sample Student t test. Secondary endpoints were evaluated using the independent t test. Statistical significance was defined as P < .05.
Results
A total of 129 unique patients were scheduled for SMAs, 62 of which met inclusion criteria and were included in the SMA group. During enrollment, 67 patients were excluded: 55 never participated in SMAs, 6 had baseline A1c values < 8.5%, 4 had insufficient data, and 2 were aged < 45 years. A total of 29 SMAs were conducted during the study period, and patients attended an average of 3.15 ± 2.14 (SD) SMAs. The average attendance at each SMA was 7.1 ± 2.62 (SD) patients. For the control group, 754 unique patients were identified and randomized. A total of 90 charts were sequentially reviewed in order to obtain the 62 patients for the control group.
Baseline characteristics were balanced between groups. However, there were more women in the SMA group vs the control group (Table 1). Within the control group, there were a total of 107 appointments that addressed T2DM, which averaged 1.72 ± 1.51 (SD) appointments per patient. The total number of interventions made in the SMA group was 192: 64.6% (124) by a CPS and 35.4% (68) by a NP. For the CPS, the most frequent intervention was medication titration (69.5%), followed by other (23.5%), medication addition (4%), and medication discontinuation (3%). Of note, 53.2% (33) of the SMA patients were seen an average of 1.2 times by non-SMA providers. The SMA patients had a total of 45 non-SMA interventions (0.73 per patient) during the study period.
For the primary endpoint, the SMA group had a 1.48% ± 0.02 (SD) reduction in A1c compared with a 0.6% ± 0.02 (SD) decrease in the control group (P = .01). When evaluating mean changes in A1c by the number of SMAs attended, it was noted that participation in ≥ 6 SMAs led to the greatest reduction in A1c of 2.08%. In the SMA group, it was noted that patients with higher A1c values at baseline demonstrated greater improvements in glycemic control compared with patients with lower baseline A1c values. The mean change in A1c, stratified by baseline A1c, was -2.26% for those with baseline A1c values ≥ 10% and -0.87% for those with baseline A1c values < 10%.
In evaluating the format style, open- vs focused-session, it was observed that participation in focused sessions led to greater improvements in glycemic control. Furthermore, when stratified by provider, greater improvements in glycemic control were demonstrated when medication management was completed by a CPS vs a NP (Table 2). The average number of interventions per SMA patient was 3.1 ± 2.22 (SD). For the control group, the total number of interventions made was 86, with an average of 1.37 ± 1.51 (SD) per patient. The overall show rate was 49% ± 16 (SD), 52% ± 16 (SD) for open visits, and 46% ± 15 (SD) for focused visits. The mean change in ABW and BMI from baseline to endpoint was no different between the SMA and control groups (Table 3). The SMA group participants demonstrated a decrease in A1c at 3 months postdischarge, and a moderate increase in A1c was noted at 6 months postdischarge.
Discussion
Shared medical appointments provide an effective alternative to standards of care in order to obtain improvements in glycemic control. Consistent with previous studies, this study reported significant improvements in glycemic control in the SMA group vs the control group. This study also elucidated unique characteristics about SMAs that may have been correlated with clinical success.
Although the greatest improvements in glycemic control were noted for those who participated in ≥ 6 SMAs, it was observed that participation in only 1 SMA also led to improvements. For a site with limited staff and a high volume of patients waiting to participate in SMAs, it may be mutually beneficial to offer only 1 SMA per patient. In addition, patients with ≥ 10% A1c at baseline demonstrated greater improvements in glycemic control compared to those with < 10% A1c at baseline. The reasons the higher baseline A1c subgroup responded to interventions more robustly are unclear and likely multifactorial. Nonetheless, factors such as psychosocial influences (eg, peer pressure to get healthy) may have increased motivation to prevent complications and improved medication adherence in the setting of closer follow-up. Additionally, hyperresponsiveness to drug therapy may have played a role. Regardless, for new SMA programs interested in making an immediate impact, it may be advantageous to initially select patients with very poorly controlled DM.
A unique aspect of the ABJ SMA was the variety of focused sessions offered. Previous studies did not demonstrate such a variety of focused sessions, nor did they evaluate the impact of a focused visit on the patient’s T2DM control. Participation in focused ABJ SMA sessions may have led to improved T2DM control, which may be attributed to the value patients assigned to specialty care and an increased motivation to get healthy.
Related: SGLT2 Inhibitors for Type 2 Diabetes Mellitus Treatment
Another factor that may have led to improved T2DM control was CPS involvement with medication management. The presence of a NP was highly valued, both from a group discussion and medication management standpoint; still, it is a good idea to involve a CPS who has a strong command of DM pharmacotherapy. One shortcoming of this SMA program was the inability for patients to maintain glycemic improvements 6 months after discharge. This pitfall was likely the result of suboptimal coordination of care after SMA discharge and may be avoided by asking the medical administration service clerk to promptly schedule discharged SMA patients for a general medicine clinic T2DM follow-up.The SMA patients had more T2DM interventions within the same time frame compared with the control patients. Although not causative, the increased number of interventions in addition to the bolstered support of the SMA may have correlated with glycemic improvements.
An important finding of this study was the SMA show rate and how it compared with attendance rates found in other group models. The favorable ABJ SMA show rate could have been due to the rigorous attention paid to reminder letters and phone calls. The literature has not established a standard approach to increasing SMA show rates; however, the current data suggest that increased reminders may have increased attendance.
Limitations
This study had several limitations. The external validity was weakened by the modest sample size and the homogenous baseline characteristics of those enrolled. Another limitation was inconsistent documentation of laboratory parameters. The inability to obtain A1c values exactly at enrollment and discharge could have potentially skewed the results. In addition, incomplete documentation of interventions for dual-care patients (ie, those who obtained care outside of the VA) was an unavoidable challenge. Last, this study did not perform an assessment of SMA patient satisfaction, cost-benefit, or safety.
Conclusion
The ABJ SMA was an effective addition to standards of care in order to achieve improvements in glycemic control in a veteran population with poorly controlled T2DM. Furthermore,the data suggest that a successful program should be multidisciplinary, select poorly controlled patients, offer focused sessions, have a CPS participate in medication management, and encourage patients to complete ≥ 6 sessions. Future studies should be conducted to include more diverse patients to see whether the efficacy of this SMA format is maintained.
A safety analysis should also be conducted to ensure that the SMA format is not only effective, but also a safe means to manage medical conditions. In addition, the scope of the ABJ SMAs should be expanded to allow for evaluation of other diseases. An evaluation of patient satisfaction and cost-benefit could provide additional support for the implementation of SMAs, as improvements in quality of life and cost savings are endpoints to be desired.
Author disclosures
The authors report no actual or potential conflicts of interest with regard to this article.
Disclaimer
The opinions expressed herein are those of the authors and do not necessarily reflect those of Federal Practitioner, Frontline Medical Communications Inc., the U.S. Government, or any of its agencies. This article may discuss unlabeled or investigational use of certain drugs. Please review complete prescribing information for specific drugs or drug combinations—including indications, contraindications, warnings, and adverse effects—before administering pharmacologic therapy to patients.
1. Centers for Disease Control and Prevention. National Diabetes Statistics Report: Estimate of Diabetes and Its Burden in the United States, 2014. Atlanta, GA: U.S. Department of Health and Human Services; 2014.
2. American Diabetes Association. Economic costs of diabetes in the U.S. in 2012. Diabetes Care. 2013;36(4):1033-1046.
3. Kirsh SR, Watts S, Pascuzzi K, et al. Shared medical appointments based on the chronic care model: a quality improvement project to address the challenges of patients with diabetes with high cardiovascular risk. Qual Saf Health Care. 2007;16(5):349-353.
4. Jaber R, Braksmajer A, Trilling JS. Group visits: a qualitative review of current research. J Am Board Fam Med. 2006;19(3):276-290.
5. Klein S. The Veterans Health Administration: implementing patient-centered medical homes in the nation's largest integrated delivery system. Commonwealth Fund Website. http://www.common wealthfund.org/publications/case-studies/2011 /sep/va-medical-homes. Published September 2011. Accessed November 11, 2015.
6. U.S. Department of Veterans Affairs. VA Shared Medical Appointments for Patients With Diabetes: Maximizing Patient & Provider Expertise to Strengthen Patient Management. Washington, DC: U.S. Department of Veterans Affairs; 2008.
7. Bronson DL, Maxwell RA. Shared medical appointments: increasing patient access without increasing physician hours. Cleve Clin J Med. 2004;71(5):369-370, 372, 374 passim.
8. Cohen LB, Taveira T, Khatana SA, Dooley AG, Pirraglia PA, Wu WC. Pharmacist-led shared medical appointments for multiple cardiovascular risk reduction in patients with type 2 diabetes. Diabetes Educ. 2011;37(6):801-812.
9. Naik AD, Palmer N, Petersen NJ, et al. Comparative effectiveness of goal setting in diabetes mellitus group clinics: randomized clinical trial. Arch Intern Med. 2011;171(5):453-459.
Complete Closing Wedge Osteotomy for Correction of Blount Disease (Tibia Vara): A Technique
Blount disease (tibia vara) is an angular tibia deformity that includes varus, increased posterior slope, and internal rotation. This deformity was first described in 1922 by Erlacher1 in Germany. In 1937, Walter Blount2 reported on it in the United States. It is the most common cause of pathologic genu varum in adolescence and childhood.
An oblique incomplete closing wedge osteotomy of the proximal tibial metaphysis was described by Wagner3 for the treatment of unicompartmental osteoarthrosis of the knee in adults. Laurencin and colleagues4 applied this technique to the treatment of pediatric tibia vara with favorable results. They spared the medial cortex of the tibia in their incomplete closing wedge osteotomy technique. In each of the 9 cases we treated and describe here, we accidentally completed the tibial osteotomy when attempting the Laurencin technique. Given that the osteotomy was completed, we modified the Laurencin technique by using a 6-hole, 4.5-mm compression plate rather than a 5-hole semitubular plate, and added a large oblique screw from the medial side to compress the osteotomy site and to protect the plate from fracture. In addition, in 2 patients who weighed more than 250 pounds, we used an external fixator for additional stability. In this article, we report the outcomes of correcting adolescent tibia vara with a complete closing wedge tibial osteotomy and an oblique fibular osteotomy.
Materials and Methods
This study was approved by the Institutional Review Board at Pennsylvania State University. Between 2009 and 2012, we performed 9 complete oblique proximal tibial lateral closing wedge osteotomies on 8 patients (2 girls, 6 boys). In each case, the primary diagnosis was Blount disease. One patient also had renal dysplasia and was receiving dialysis. Mean age at time of operation was 15 years (range, 13-17 years). Mean preoperative weight was 215 pounds (range, 119-317 lb). Mean weight gain at follow-up was 4.39 pounds (range, –10 to 19 lb). Mean body mass index (BMI) was 38 (range, 25-48) (Table). All patients had varus angulation of the proximal tibia before surgery. Mean preoperative varus on standing films was 22° (range, 10°-36°). Because of the patients’ size, we used standing long-leg radiographs, on individual cassettes, for each leg.
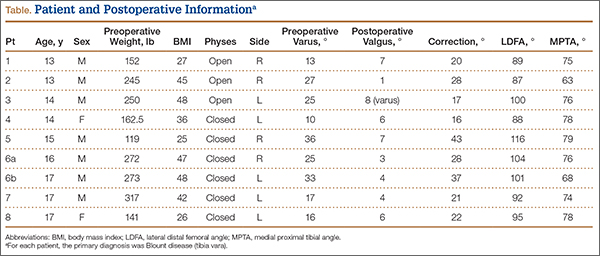
Surgical Technique
Before surgery, we use paper cutouts to template the osteotomy wedge. We also use perioperative antibiotics and a standard time-out. For visualization of the entire leg for accurate correction, we prepare and drape the entire leg. A sterile tourniquet is used. At the midshaft of the fibula, a 4-cm incision is made, and dissection is carefully carried down to the fibula. Subperiosteal dissection is performed about the fibula, allowing adequate clearance for an oblique osteotomy. The osteotomy removes about 1 cm of fibula, which is to be used as bone graft for the tibial osteotomy. In addition, a lateral compartment fasciotomy is performed to prevent swelling-related complications. The wound is irrigated and injected with bupivacaine and closed in routine fashion.
We then make an inverted hockey-stick incision over the proximal tibia, centered down to the tibial tubercle. After dissecting down to the anterior compartment, we perform a fasciotomy of about 8 cm to accommodate swelling. Subperiosteal dissection is then performed around the proximal tibia. The medial soft tissues are left attached to increase blood supply and healing. During subperiosteal dissection, soft elevators are used to gently retract the lateral soft tissues along with the inferior and posterior structures. We use fluoroscopic imaging to guide the osteotomy as well as screw and plate placement. We use a 6-hole, 4.5-mm compression plate and screws for fixation. The 2 proximal screws of the plate are predrilled in place to allow for application of the plate after completion of the osteotomy. The plate is then rotated out of position on 1 screw, and the osteotomy is identified under fluoroscopy with the appropriate position distal to the second hole of the 6-hole plate.
An oscillating saw and osteotomes are used to perform the oblique osteotomy. The pre-estimated bone wedge is removed. Wedge size is adjusted, if needed. The bone wedge is morselized for bone graft. The osteotomy is then closed, correcting both varus and internal tibial torsion. Our goal is 5° valgus. After correction is obtained, the plate is placed, and the proximal screw is snugly seated. Three cortical screws are placed distally to hold the plate in place under compression mode, and a cancellous screw is placed superiorly at the proximal portion of the plate for additional fixation. The screw placed proximal to the osteotomy site is a fully threaded cortical screw with excellent compression. Correction and proper placement of hardware are verified with fluoroscopy.
The wound is irrigated and injected with bupivacaine. Bone graft is then placed at the osteotomy site. Additional bone graft is placed posteriorly between the osteotomy site and the muscle mass to stimulate additional healing. Another screw is placed obliquely from the medial side across the osteotomy site to provide additional fixation (Figure 1).
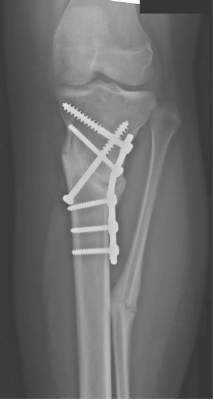
A deep drain is placed and connected to bulb suction for 24 hours after surgery. The wound is then closed in routine fashion. In 2 patients who weighed more than 250 pounds, we used an external fixator for additional stability (Figure 2).
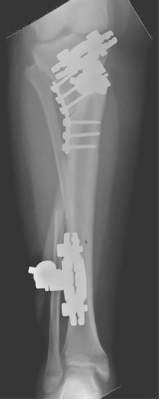
Postoperative Care
The incisions are dressed with antibiotic ointment and 4×4-in bandages and then wrapped with sterile cotton under-cast padding. The leg is placed into a well-padded cylinder cast with the knee flexed 10°. The leg is aligned to about 5° valgus. The cast is then split on the side and spread to allow for swelling and to prevent compartment syndrome.5 We also use a drain hooked to bulb suction, which is removed 24 hours after surgery. Toe-touch weight-bearing with crutches is allowed immediately after surgery. The cast is removed at 6 weeks, and a hinged range-of-motion knee brace is worn for another 6 weeks. All patients are allowed to resume normal activity after 4 months. In our 2 external-fixator cases, a cast was not used, and toe-touch weight-bearing and knee motion were allowed immediately. The external fixators were removed at about 10 weeks.
Results
Mean postoperative mechanical femoral-tibial angle was 3°, and mean correction was 26° (range, 16°-43°) (Table). Lateral distal femoral angle did not show significant femoral deformity in our sample. Mean medial proximal tibial angle was 74° (range, 63°-79°). In each case, the varus deformity was primarily in the tibia. Mean tourniquet time was 88 minutes (range, 50-119 min). Our complication rate was 11% (1 knee). In our first case, in which we did not use an extra medial screw, the 4.5-mm plate fractured at the osteotomy site 2.5 months after surgery. The 250-pound patient subsequently lost 17° of correction, and valgus alignment was not achieved. Preoperative varus was 25°, and postoperative alignment was 8° varus. This plate fracture led us to use an extra medial screw for additional stability in all subsequent cases and to consider using an external fixator for patients weighing more than 250 pounds. After the first case, there were no other plate fractures. A potential problem with closing wedge osteotomy is shortening, but varus correction restores some length. Mean postoperative leg-length difference was 10 mm (range, 0-16 mm). No patient complained of leg-length difference during the postoperative follow-up.
Eight and a half months after surgery, 1 patient had hardware removed, at the family’s request. No patient experienced perioperative infection or neurovascular damage. Our overall patient population was obese—mean BMI was 38 (range, 25-48), and mean postoperative weight was 219 pounds. Three of our 8 patients were overweight (BMI, 25-30), and 5 were obese (BMI, >30). For prevention of plate failure, we recommend using an extra oblique screw in all patients and considering an external fixator for patients who weigh more than 250 pounds.
Discussion
Correction of adolescent tibia vara can be challenging because of patient obesity. The technique described here—a modification of the technique of Laurencin and colleagues4—is practical and reproducible in this population. The goals in performing osteotomy are to correct the deformity, restore joint alignment, preserve leg length, and prevent recurrent deformity and other complications, such as neurovascular injury, nonunion, and infection.3,6-8 Our technique minimizes the risk for these complications. For example, the fasciotomy provides excellent decompression of the anterior and lateral compartments, minimizing neurovascular ischemia and the risk for compartment syndrome. During cast placement, splitting and spreading reduce the risk for compartment syndrome as well.5
Wagner3,9 demonstrated the utility of a closing wedge proximal tibial osteotomy in adults. Laurencin and colleagues4 showed this technique is effective in correcting tibia vara in a pediatric population. However, they did not specify patient weight and used a small semitubular plate for fixation, and some of their patients had infantile Blount disease. We modified the technique in 3 ways. First, we performed a complete osteotomy. Second, because our patients were adolescents and very large, we used a 6-hole, 4.5-mm compression plate and screws. Third, we used an external fixator for increased stability in patients who weighed more than 250 pounds.
The reported technique, using an oblique metaphyseal closing wedge osteotomy with internal fixation in obese patients, is practical, safe, and reliable. This technique is a useful alternative to an external fixator. We used it on 9 knees with tibia vara, and it was completely successful in 8 cases and partially successful in 1 (hardware breakage occurred). An external fixator was used to prevent hardware breakage in 2 patients who weighed more than 250 pounds. This technique is a valuable treatment option for surgical correction, especially in obese patients.
1. Erlacher P. Deformierende Prozesse der Epiphysengegend bei Kindem. Archiv Orthop Unfall-Chir. 1922;20:81-96.
2. Blount WP. Tibia vara. J Bone Joint Surg. 1937;29:1-28.
3. Wagner H. Principles of corrective osteotomies in osteoarthrosis of the knee. In: Weal UH, ed. Joint Preserving Procedures of the Lower Extremity. New York, NY: Springer; 1980:77-102.
4. Laurencin CT, Ferriter PJ, Millis MB. Oblique proximal tibial osteotomy for the correction of tibia vara in the young. Clin Orthop Relat Res. 1996;(327):218-224.
5. Garfin SR, Mubarak SJ, Evans KL, Hargens AR, Akeson WH. Quantification of intracompartmental pressure and volume under plaster casts. J Bone Joint Surg Am. 1981;63(3):449-453.
6. Mycoskie PJ. Complications of osteotomies about the knee in children. Orthopedics. 1981;4(9):1005-1015.
7. Matsen FA, Staheli LT. Neurovascular complications following tibial osteotomy in children. A case report. Clin Orthop Relat Res. 1975;(110):210-214.
8. Steel HH, Sandrew RE, Sullivan PD. Complications of tibial osteotomy in children for genu varum or valgum. Evidence that neurological changes are due to ischemia. J Bone Joint Surg Am. 1971;53(8):1629-1635.
9. Wagner H. The displacement osteotomy as a correction principle. In: Heirholzer G, Muller KH, eds. Corrective Osteotomies of the Lower Extremity After Trauma. Berlin, Germany: Springer; 1985:141-150.
Blount disease (tibia vara) is an angular tibia deformity that includes varus, increased posterior slope, and internal rotation. This deformity was first described in 1922 by Erlacher1 in Germany. In 1937, Walter Blount2 reported on it in the United States. It is the most common cause of pathologic genu varum in adolescence and childhood.
An oblique incomplete closing wedge osteotomy of the proximal tibial metaphysis was described by Wagner3 for the treatment of unicompartmental osteoarthrosis of the knee in adults. Laurencin and colleagues4 applied this technique to the treatment of pediatric tibia vara with favorable results. They spared the medial cortex of the tibia in their incomplete closing wedge osteotomy technique. In each of the 9 cases we treated and describe here, we accidentally completed the tibial osteotomy when attempting the Laurencin technique. Given that the osteotomy was completed, we modified the Laurencin technique by using a 6-hole, 4.5-mm compression plate rather than a 5-hole semitubular plate, and added a large oblique screw from the medial side to compress the osteotomy site and to protect the plate from fracture. In addition, in 2 patients who weighed more than 250 pounds, we used an external fixator for additional stability. In this article, we report the outcomes of correcting adolescent tibia vara with a complete closing wedge tibial osteotomy and an oblique fibular osteotomy.
Materials and Methods
This study was approved by the Institutional Review Board at Pennsylvania State University. Between 2009 and 2012, we performed 9 complete oblique proximal tibial lateral closing wedge osteotomies on 8 patients (2 girls, 6 boys). In each case, the primary diagnosis was Blount disease. One patient also had renal dysplasia and was receiving dialysis. Mean age at time of operation was 15 years (range, 13-17 years). Mean preoperative weight was 215 pounds (range, 119-317 lb). Mean weight gain at follow-up was 4.39 pounds (range, –10 to 19 lb). Mean body mass index (BMI) was 38 (range, 25-48) (Table). All patients had varus angulation of the proximal tibia before surgery. Mean preoperative varus on standing films was 22° (range, 10°-36°). Because of the patients’ size, we used standing long-leg radiographs, on individual cassettes, for each leg.
Surgical Technique
Before surgery, we use paper cutouts to template the osteotomy wedge. We also use perioperative antibiotics and a standard time-out. For visualization of the entire leg for accurate correction, we prepare and drape the entire leg. A sterile tourniquet is used. At the midshaft of the fibula, a 4-cm incision is made, and dissection is carefully carried down to the fibula. Subperiosteal dissection is performed about the fibula, allowing adequate clearance for an oblique osteotomy. The osteotomy removes about 1 cm of fibula, which is to be used as bone graft for the tibial osteotomy. In addition, a lateral compartment fasciotomy is performed to prevent swelling-related complications. The wound is irrigated and injected with bupivacaine and closed in routine fashion.
We then make an inverted hockey-stick incision over the proximal tibia, centered down to the tibial tubercle. After dissecting down to the anterior compartment, we perform a fasciotomy of about 8 cm to accommodate swelling. Subperiosteal dissection is then performed around the proximal tibia. The medial soft tissues are left attached to increase blood supply and healing. During subperiosteal dissection, soft elevators are used to gently retract the lateral soft tissues along with the inferior and posterior structures. We use fluoroscopic imaging to guide the osteotomy as well as screw and plate placement. We use a 6-hole, 4.5-mm compression plate and screws for fixation. The 2 proximal screws of the plate are predrilled in place to allow for application of the plate after completion of the osteotomy. The plate is then rotated out of position on 1 screw, and the osteotomy is identified under fluoroscopy with the appropriate position distal to the second hole of the 6-hole plate.
An oscillating saw and osteotomes are used to perform the oblique osteotomy. The pre-estimated bone wedge is removed. Wedge size is adjusted, if needed. The bone wedge is morselized for bone graft. The osteotomy is then closed, correcting both varus and internal tibial torsion. Our goal is 5° valgus. After correction is obtained, the plate is placed, and the proximal screw is snugly seated. Three cortical screws are placed distally to hold the plate in place under compression mode, and a cancellous screw is placed superiorly at the proximal portion of the plate for additional fixation. The screw placed proximal to the osteotomy site is a fully threaded cortical screw with excellent compression. Correction and proper placement of hardware are verified with fluoroscopy.
The wound is irrigated and injected with bupivacaine. Bone graft is then placed at the osteotomy site. Additional bone graft is placed posteriorly between the osteotomy site and the muscle mass to stimulate additional healing. Another screw is placed obliquely from the medial side across the osteotomy site to provide additional fixation (Figure 1).
A deep drain is placed and connected to bulb suction for 24 hours after surgery. The wound is then closed in routine fashion. In 2 patients who weighed more than 250 pounds, we used an external fixator for additional stability (Figure 2).
Postoperative Care
The incisions are dressed with antibiotic ointment and 4×4-in bandages and then wrapped with sterile cotton under-cast padding. The leg is placed into a well-padded cylinder cast with the knee flexed 10°. The leg is aligned to about 5° valgus. The cast is then split on the side and spread to allow for swelling and to prevent compartment syndrome.5 We also use a drain hooked to bulb suction, which is removed 24 hours after surgery. Toe-touch weight-bearing with crutches is allowed immediately after surgery. The cast is removed at 6 weeks, and a hinged range-of-motion knee brace is worn for another 6 weeks. All patients are allowed to resume normal activity after 4 months. In our 2 external-fixator cases, a cast was not used, and toe-touch weight-bearing and knee motion were allowed immediately. The external fixators were removed at about 10 weeks.
Results
Mean postoperative mechanical femoral-tibial angle was 3°, and mean correction was 26° (range, 16°-43°) (Table). Lateral distal femoral angle did not show significant femoral deformity in our sample. Mean medial proximal tibial angle was 74° (range, 63°-79°). In each case, the varus deformity was primarily in the tibia. Mean tourniquet time was 88 minutes (range, 50-119 min). Our complication rate was 11% (1 knee). In our first case, in which we did not use an extra medial screw, the 4.5-mm plate fractured at the osteotomy site 2.5 months after surgery. The 250-pound patient subsequently lost 17° of correction, and valgus alignment was not achieved. Preoperative varus was 25°, and postoperative alignment was 8° varus. This plate fracture led us to use an extra medial screw for additional stability in all subsequent cases and to consider using an external fixator for patients weighing more than 250 pounds. After the first case, there were no other plate fractures. A potential problem with closing wedge osteotomy is shortening, but varus correction restores some length. Mean postoperative leg-length difference was 10 mm (range, 0-16 mm). No patient complained of leg-length difference during the postoperative follow-up.
Eight and a half months after surgery, 1 patient had hardware removed, at the family’s request. No patient experienced perioperative infection or neurovascular damage. Our overall patient population was obese—mean BMI was 38 (range, 25-48), and mean postoperative weight was 219 pounds. Three of our 8 patients were overweight (BMI, 25-30), and 5 were obese (BMI, >30). For prevention of plate failure, we recommend using an extra oblique screw in all patients and considering an external fixator for patients who weigh more than 250 pounds.
Discussion
Correction of adolescent tibia vara can be challenging because of patient obesity. The technique described here—a modification of the technique of Laurencin and colleagues4—is practical and reproducible in this population. The goals in performing osteotomy are to correct the deformity, restore joint alignment, preserve leg length, and prevent recurrent deformity and other complications, such as neurovascular injury, nonunion, and infection.3,6-8 Our technique minimizes the risk for these complications. For example, the fasciotomy provides excellent decompression of the anterior and lateral compartments, minimizing neurovascular ischemia and the risk for compartment syndrome. During cast placement, splitting and spreading reduce the risk for compartment syndrome as well.5
Wagner3,9 demonstrated the utility of a closing wedge proximal tibial osteotomy in adults. Laurencin and colleagues4 showed this technique is effective in correcting tibia vara in a pediatric population. However, they did not specify patient weight and used a small semitubular plate for fixation, and some of their patients had infantile Blount disease. We modified the technique in 3 ways. First, we performed a complete osteotomy. Second, because our patients were adolescents and very large, we used a 6-hole, 4.5-mm compression plate and screws. Third, we used an external fixator for increased stability in patients who weighed more than 250 pounds.
The reported technique, using an oblique metaphyseal closing wedge osteotomy with internal fixation in obese patients, is practical, safe, and reliable. This technique is a useful alternative to an external fixator. We used it on 9 knees with tibia vara, and it was completely successful in 8 cases and partially successful in 1 (hardware breakage occurred). An external fixator was used to prevent hardware breakage in 2 patients who weighed more than 250 pounds. This technique is a valuable treatment option for surgical correction, especially in obese patients.
1. Erlacher P. Deformierende Prozesse der Epiphysengegend bei Kindem. Archiv Orthop Unfall-Chir. 1922;20:81-96.
2. Blount WP. Tibia vara. J Bone Joint Surg. 1937;29:1-28.
3. Wagner H. Principles of corrective osteotomies in osteoarthrosis of the knee. In: Weal UH, ed. Joint Preserving Procedures of the Lower Extremity. New York, NY: Springer; 1980:77-102.
4. Laurencin CT, Ferriter PJ, Millis MB. Oblique proximal tibial osteotomy for the correction of tibia vara in the young. Clin Orthop Relat Res. 1996;(327):218-224.
5. Garfin SR, Mubarak SJ, Evans KL, Hargens AR, Akeson WH. Quantification of intracompartmental pressure and volume under plaster casts. J Bone Joint Surg Am. 1981;63(3):449-453.
6. Mycoskie PJ. Complications of osteotomies about the knee in children. Orthopedics. 1981;4(9):1005-1015.
7. Matsen FA, Staheli LT. Neurovascular complications following tibial osteotomy in children. A case report. Clin Orthop Relat Res. 1975;(110):210-214.
8. Steel HH, Sandrew RE, Sullivan PD. Complications of tibial osteotomy in children for genu varum or valgum. Evidence that neurological changes are due to ischemia. J Bone Joint Surg Am. 1971;53(8):1629-1635.
9. Wagner H. The displacement osteotomy as a correction principle. In: Heirholzer G, Muller KH, eds. Corrective Osteotomies of the Lower Extremity After Trauma. Berlin, Germany: Springer; 1985:141-150.
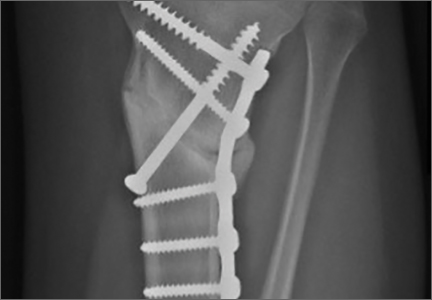
A Review of Patient Adherence to Topical Therapies for Treatment of Atopic Dermatitis
Atopic dermatitis (AD) is a chronic inflammatory skin disease that typically begins in early childhood (Figure). It is one of the most commonly diagnosed dermatologic conditions, affecting up to 25% of children and 2% to 3% of adults in the United States.1,2 The mainstays of treatment for AD are topical emollients and topical medications, of which corticosteroids are most commonly prescribed.3 Although treatments for AD generally are straightforward and efficacious when used correctly, poor adherence to treatment often prevents patients from achieving disease control.4 Patient adherence to therapy is a familiar challenge in dermatology, especially for diseases like AD that require long-term treatment with topical medications.4,5 In some instances, poor adherence may be misconstrued as poor response to treatment, which may lead to escalation to more powerful and potentially dangerous systemic medications.6 Ensuring good adherence to treatment leads to better outcomes and disease control, averts unnecessary treatment, prevents disease complications, improves quality of life, and decreases treatment cost.4,5 This article provides a review of the literature on patient adherence to topical therapies for AD as well as a discussion of methods to improve patient adherence to treatment in the clinical setting.

Methods
A PubMed search of articles indexed for MEDLINE from January 2005 to May 2015 was conducted to identify studies that focused on treatment adherence in AD using the search terms atopic dermatitis and medication adherence and atopic dermatitis and patient compliance After excluding duplicate results and those that were not in the English language, a final list of clinical trials that investigated patient adherence/compliance to topical medications for the treatment of AD was extracted for evaluation.
Results
Our review of the literature yielded 7 quantitative studies that evaluated adherence to topical medications in AD using electronic monitoring and/or self-reporting (Table).7-13 Participant demographics, disease severity, drug and vehicle used, duration of treatment, and number of follow-up visits varied. All studies used medication event monitoring system caps on medication jars to objectively track patient adherence by recording the date and time when the cap was removed. To assess disease response, the studies used such measures as the Investigator Global Assessment scale, Eczema Area and Severity Index score, or other visual analog scales.
In all of the studies, treatment proved effective and disease severity declined from baseline regardless of the rate of adherence, with benefit continuing after treatment had ended.7-13 Some results suggested that better adherence increased treatment efficacy and reduced disease severity.8,9 However, one 10-day trial found no difference in severity and efficacy among participants who applied the medication at least once daily, missed applications some days, or applied the medication more than twice daily.13
Study participants typically overestimated their adherence to treatment compared to actual adherence rates, with most reporting near 100% adherence.7-9,11,12 Average measured adherence rates ranged from 32% to 93% (Table). Adherence rates typically were highest at the beginning of the study and decreased as the study continued.7-13 The study with the best average adherence rate of 93% had the shortest treatment period of 3 days,11 and the study with the lowest average adherence rate of 32% had the longest treatment period of 8 weeks.7 The study with the lowest adherence rate was the only study wherein participants were blinded to their enrollment in the study, which would most closely mimic adherence rates in clinical practice.7 The participants in the other studies were not aware that their adherence was being monitored, but their behavior may have been influenced since they were aware of their enrollment in the study.
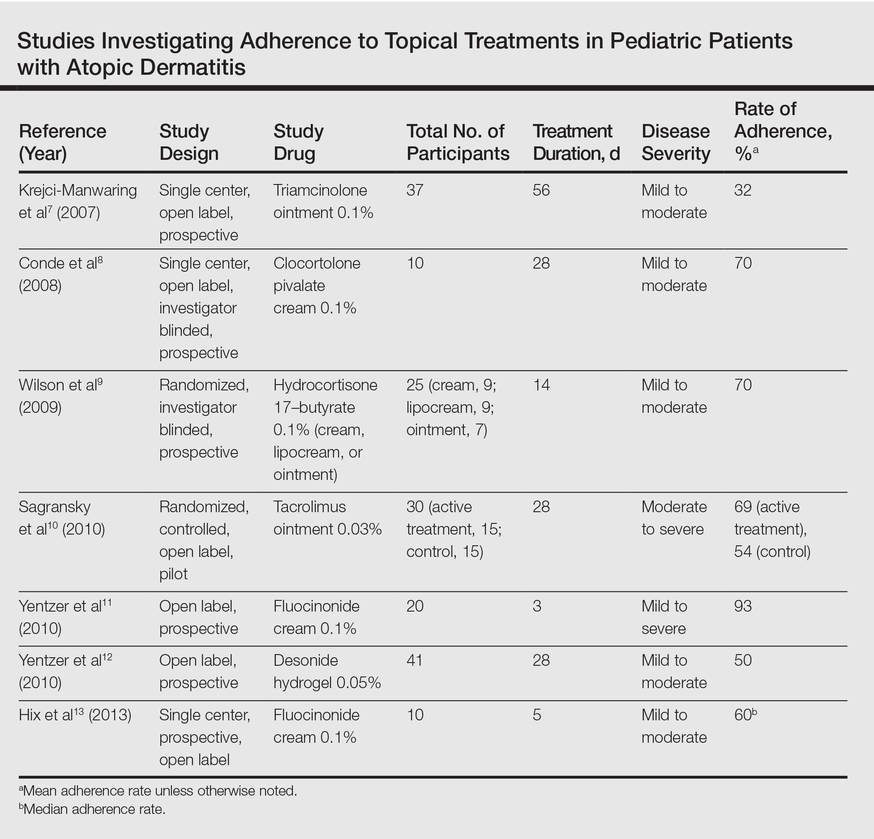
Many variables affect treatment adherence in patients with AD. Average adherence rates were significantly higher (P=.03) in participants with greater disease severity.7 There is conflicting evidence regarding the role of medication vehicle in treatment adherence. While Wilson et al9 did not find any difference in adherence based on medication vehicle, Yentzer et al12 found vehicle characteristics and medication side effects were among patients’ top-ranked concerns about using topical medications. Sagransky et al10 compared treatment adherence between 2 groups of AD patients: one control group received a standard-of-care 4-week follow-up, and an active group received an additional 1-week follow-up. The mean adherence rate of the treatment group was 69% compared with 54% in the control group.10
Comment
Poor adherence to treatment is a pervasive problem in patients with AD. Our review of the literature confirmed that patients generally are not accurate historians of their medication usage, often reporting near-perfect treatment adherence even when actual adherence is poor. Rates of adherence from clinical trials are likely higher than those seen in clinical practice due in part to study incentives and differences between how patients in a study are treated compared to those in a physician’s clinic; for example, research study participants often have additional follow-up visits compared to those being treated in the clinical population and by virtue of being enrolled in a study are aware that their behavior is being monitored, which can increase treatment adherence.7
The dogma suggesting that tachyphylaxis can occur with long-term use of topical corticosteroids is not supported by clinical trials.14 Furthermore, in our review of the literature patient adherence was highest in the shortest study11 and lowest in the longest study.7 Given that AD patients cannot benefit from a treatment if they do not use it, the supposed decrease in efficacy of topical corticosteroids over time may be because patients fail to use them consistently.
Our review of the literature was limited by the small body of research that exists on treatment adherence in AD patients, especially relating to topical medications, and did not reveal any studies evaluating systemic medications in AD. Of the studies we examined, sample sizes were small and treatment and follow-up periods were short. Our review only covered adherence to prescribed topical medications in AD, chiefly corticosteroids; thus, we did not evaluate adherence to other therapies (eg, emollients) in this patient population.
The existing research also is limited by the relative paucity of data showing a correlation between improved adherence to topical treatment and improved disease outcomes, which may be due to the methodological limitations of the study designs that have been used; for instance, studies may use objective monitors to describe daily adherence to treatment, but disease severity typically is measured over longer periods of time, usually every few weeks or months. Short-term data may not be an accurate demonstration of how participants’ actual treatment adherence impacts disease outcome, as the data does not account for more complex adherence factors; for example, participants who achieve good disease control using topical corticosteroids for an 8-week study period may actually demonstrate poor treatment adherence overall, as topical corticosteroids have good short-term efficacy and the patient may have stopped using the product after the first few weeks of the treatment period. In contrast, poorly adherent patients may never use the medication well enough to achieve improvement and may continue low-level use throughout the study period. Therefore, studies that measure disease severity at more regular intervals are required to show the true effect of treatment adherence on disease outcomes.
Since AD mainly affects children, family issues can pose special challenges to attaining good treatment adherence.15,16 The physician–patient (or parent) relationship and the family’s perception of the patient’s disease severity are strong predictors of adherence to topical treatment.16 Potential barriers to adherence in the pediatric population are caregivers with negative beliefs about treatment, the time-consuming nature of applying topical therapies, or a child who is uncooperative.15,17 In the treatment of infants, critical factors are caregiver availability and beliefs and fears about medications and their side effects, while in the teenage population, the desire to “fit in” and oppositional behavior can lead to poor adherence to treatment.17 Regardless of age, other barriers to treatment adherence are forgetfulness, belief that the drug is not working, and the messiness of treatment.17
Educational tools (eg, action plans, instructions about how to apply topical medications correctly) may be underutilized in patients with AD. If consistently implemented, these tools could have a positive impact on adherence to medication in patients with AD. For example, written action plans pioneered in the asthma community have shown to improve quality of life and reduce disease severity and may offer the same benefits for AD patients due to the similarities of the diseases.18 Since AD patients and their caregivers often are not well versed in how to apply topical medications correctly, efforts to educate patients could potentially increase adherence to treatment. In one study, AD patients began to use medications more effectively after applying a fluorescent cream to reveal affected areas they had missed, and clinicians were able to provide additional instruction based on the findings.19
Adherence to topical treatments among AD patients is a multifactorial issue. Regimens often are complex and inconvenient due to the need for multiple medications, the topical nature of the products, and the need for frequent application. To optimize prescription treatments, patients also must be diligent with preventive measures such as application of topical emollients and use of bathing techniques (eg, bleach baths). A way to overcome treatment complexity and increase adherence may be to provide a written action plan and involve the patient and caregiver in the plan’s development. If a drug formulation is not aesthetically acceptable to the patient (eg, the greasiness of an ointment), allowing the patient to choose the medication vehicle may increase satisfaction and use.12 Fear of steroid side effects also is common among patients and caregivers and could be overcome with education about the product.20
Conclusion
Treatment adherence can have a dramatic effect on diseases outcomes and can be particularly challenging in AD due to the use of topical medications with complex treatment regimens. Additionally, a large majority of patients with AD are children, from infants to teenagers, adding another layer of treatment challenges. Further research is needed to more definitively develop effective methods for enhancing treatment adherence in this patient population. Although enormous amounts of money are being spent to develop improved treatments for AD, we may be able to achieve far more benefit at a much lower cost by figuring out how to get patients to adhere to the treatments that are already available.
- Eichenfield LF, Tom WL, Chamlin SL, et al. Guidelines of care for the management of atopic dermatitis: section 1. diagnosis and assessment of atopic dermatitis. J Am Acad Dermatol. 2014;70:338-351.
- Landis ET, Davis SA, Taheri A, et al. Top dermatologic diagnoses by age. Dermatol Online J. 2014;20:22368.
- Eichenfield LF, Tom WL, Berger TG, et al. Guidelines of care for the management of atopic dermatitis: section 2. management and treatment of atopic dermatitis with topical therapies. J Am Acad Dermatol. 2014;71:116-132.
- Lee IA, Maibach HI. Pharmionics in dermatology: a review of topical medication adherence. Am J Clin Dermatol. 2006;7:231-236.
- Tan X, Feldman SR, Chang J, et al. Topical drug delivery systems in dermatology: a review of patient adherence issues. Expert Opin Drug Deliv. 2012;9:1263-1271.
- Sidbury R, Davis DM, Cohen DE, et al. Guidelines of care for the management of atopic dermatitis: section 3. Management and treatment with phototherapy and systemic agents. J Am Acad Dermatol. 2014;71:327-349.
- Krejci-Manwaring J, Tusa MG, Carroll C, et al. Stealth monitoring of adherence to topical medication: adherence is very poor in children with atopic dermatitis. J Am Acad Dermatol. 2007;56:211-216.
- Conde JF, Kaur M, Fleischer AB Jr, et al. Adherence to clocortolone pivalate cream 0.1% in a pediatric population with atopic dermatitis. Cutis. 2008;81:435-441.
- Wilson R, Camacho F, Clark AR, et al. Adherence to topical hydrocortisone 17-butyrate 0.1% in different vehicles in adults with atopic dermatitis. J Am Acad Dermatol. 2009;60:166-168.
- Sagransky MJ, Yentzer BA, Williams LL, et al. A randomized controlled pilot study of the effects of an extra office visit on adherence and outcomes in atopic dermatitis. Arch Dermatol. 2010;146:1428-1430.
- Yentzer BA, Ade RA, Fountain JM, et al. Improvement in treatment adherence with a 3-day course of fluocinonide cream 0.1% for atopic dermatitis. Cutis. 2010;86:208-213.
- Yentzer BA, Camacho FT, Young T, et al. Good adherence and early efficacy using desonide hydrogel for atopic dermatitis: results from a program addressing patient compliance. J Drugs Dermatol. 2010;9:324-329.
- Hix E, Gustafson CJ, O’Neill JL, et al. Adherence to a five day treatment course of topical fluocinonide 0.1% cream in atopic dermatitis. Dermatol Online J. 2013;19:20029.
- Taheri A, Cantrell J, Feldman SR. Tachyphylaxis to topical glucocorticoids; what is the evidence? Dermatol Online J. 2013;19:18954.
- Santer M, Burgess H, Yardley L, et al. Managing childhood eczema: qualitative study exploring carers’ experiences of barriers and facilitators to treatment adherence. J Adv Nurs. 2013;69:2493-2501.
- Ohya Y, Williams H, Steptoe A, et al. Psychosocial factors and adherence to treatment advice in childhood atopic dermatitis. J Invest Dermatol. 2001;117:852-857.
- Ou HT, Feldman SR, Balkrishnan R. Understanding and improving treatment adherence in pediatric patients. Semin Cutan Med Surg. 2010;29:137-140.
- Chisolm SS, Taylor SL, Balkrishnan R, et al. Written action plans: potential for improving outcomes in children with atopic dermatitis. J Am Acad Dermatol. 2008;59:677-683.
- Ulff E, Maroti M, Serup J. Fluorescent cream used as an educational intervention to improve the effectiveness of self-application by patients with atopic dermatitis. J Dermatolog Treat. 2013;24:268-271.
- Aubert-Wastiaux H, Moret L, Le Rhun A, et al. Topical corticosteroid phobia in atopic dermatitis: a study of its nature, origins and frequency. Br J Dermatol. 2011;165:808-814.
Atopic dermatitis (AD) is a chronic inflammatory skin disease that typically begins in early childhood (Figure). It is one of the most commonly diagnosed dermatologic conditions, affecting up to 25% of children and 2% to 3% of adults in the United States.1,2 The mainstays of treatment for AD are topical emollients and topical medications, of which corticosteroids are most commonly prescribed.3 Although treatments for AD generally are straightforward and efficacious when used correctly, poor adherence to treatment often prevents patients from achieving disease control.4 Patient adherence to therapy is a familiar challenge in dermatology, especially for diseases like AD that require long-term treatment with topical medications.4,5 In some instances, poor adherence may be misconstrued as poor response to treatment, which may lead to escalation to more powerful and potentially dangerous systemic medications.6 Ensuring good adherence to treatment leads to better outcomes and disease control, averts unnecessary treatment, prevents disease complications, improves quality of life, and decreases treatment cost.4,5 This article provides a review of the literature on patient adherence to topical therapies for AD as well as a discussion of methods to improve patient adherence to treatment in the clinical setting.
Methods
A PubMed search of articles indexed for MEDLINE from January 2005 to May 2015 was conducted to identify studies that focused on treatment adherence in AD using the search terms atopic dermatitis and medication adherence and atopic dermatitis and patient compliance After excluding duplicate results and those that were not in the English language, a final list of clinical trials that investigated patient adherence/compliance to topical medications for the treatment of AD was extracted for evaluation.
Results
Our review of the literature yielded 7 quantitative studies that evaluated adherence to topical medications in AD using electronic monitoring and/or self-reporting (Table).7-13 Participant demographics, disease severity, drug and vehicle used, duration of treatment, and number of follow-up visits varied. All studies used medication event monitoring system caps on medication jars to objectively track patient adherence by recording the date and time when the cap was removed. To assess disease response, the studies used such measures as the Investigator Global Assessment scale, Eczema Area and Severity Index score, or other visual analog scales.
In all of the studies, treatment proved effective and disease severity declined from baseline regardless of the rate of adherence, with benefit continuing after treatment had ended.7-13 Some results suggested that better adherence increased treatment efficacy and reduced disease severity.8,9 However, one 10-day trial found no difference in severity and efficacy among participants who applied the medication at least once daily, missed applications some days, or applied the medication more than twice daily.13
Study participants typically overestimated their adherence to treatment compared to actual adherence rates, with most reporting near 100% adherence.7-9,11,12 Average measured adherence rates ranged from 32% to 93% (Table). Adherence rates typically were highest at the beginning of the study and decreased as the study continued.7-13 The study with the best average adherence rate of 93% had the shortest treatment period of 3 days,11 and the study with the lowest average adherence rate of 32% had the longest treatment period of 8 weeks.7 The study with the lowest adherence rate was the only study wherein participants were blinded to their enrollment in the study, which would most closely mimic adherence rates in clinical practice.7 The participants in the other studies were not aware that their adherence was being monitored, but their behavior may have been influenced since they were aware of their enrollment in the study.
Many variables affect treatment adherence in patients with AD. Average adherence rates were significantly higher (P=.03) in participants with greater disease severity.7 There is conflicting evidence regarding the role of medication vehicle in treatment adherence. While Wilson et al9 did not find any difference in adherence based on medication vehicle, Yentzer et al12 found vehicle characteristics and medication side effects were among patients’ top-ranked concerns about using topical medications. Sagransky et al10 compared treatment adherence between 2 groups of AD patients: one control group received a standard-of-care 4-week follow-up, and an active group received an additional 1-week follow-up. The mean adherence rate of the treatment group was 69% compared with 54% in the control group.10
Comment
Poor adherence to treatment is a pervasive problem in patients with AD. Our review of the literature confirmed that patients generally are not accurate historians of their medication usage, often reporting near-perfect treatment adherence even when actual adherence is poor. Rates of adherence from clinical trials are likely higher than those seen in clinical practice due in part to study incentives and differences between how patients in a study are treated compared to those in a physician’s clinic; for example, research study participants often have additional follow-up visits compared to those being treated in the clinical population and by virtue of being enrolled in a study are aware that their behavior is being monitored, which can increase treatment adherence.7
The dogma suggesting that tachyphylaxis can occur with long-term use of topical corticosteroids is not supported by clinical trials.14 Furthermore, in our review of the literature patient adherence was highest in the shortest study11 and lowest in the longest study.7 Given that AD patients cannot benefit from a treatment if they do not use it, the supposed decrease in efficacy of topical corticosteroids over time may be because patients fail to use them consistently.
Our review of the literature was limited by the small body of research that exists on treatment adherence in AD patients, especially relating to topical medications, and did not reveal any studies evaluating systemic medications in AD. Of the studies we examined, sample sizes were small and treatment and follow-up periods were short. Our review only covered adherence to prescribed topical medications in AD, chiefly corticosteroids; thus, we did not evaluate adherence to other therapies (eg, emollients) in this patient population.
The existing research also is limited by the relative paucity of data showing a correlation between improved adherence to topical treatment and improved disease outcomes, which may be due to the methodological limitations of the study designs that have been used; for instance, studies may use objective monitors to describe daily adherence to treatment, but disease severity typically is measured over longer periods of time, usually every few weeks or months. Short-term data may not be an accurate demonstration of how participants’ actual treatment adherence impacts disease outcome, as the data does not account for more complex adherence factors; for example, participants who achieve good disease control using topical corticosteroids for an 8-week study period may actually demonstrate poor treatment adherence overall, as topical corticosteroids have good short-term efficacy and the patient may have stopped using the product after the first few weeks of the treatment period. In contrast, poorly adherent patients may never use the medication well enough to achieve improvement and may continue low-level use throughout the study period. Therefore, studies that measure disease severity at more regular intervals are required to show the true effect of treatment adherence on disease outcomes.
Since AD mainly affects children, family issues can pose special challenges to attaining good treatment adherence.15,16 The physician–patient (or parent) relationship and the family’s perception of the patient’s disease severity are strong predictors of adherence to topical treatment.16 Potential barriers to adherence in the pediatric population are caregivers with negative beliefs about treatment, the time-consuming nature of applying topical therapies, or a child who is uncooperative.15,17 In the treatment of infants, critical factors are caregiver availability and beliefs and fears about medications and their side effects, while in the teenage population, the desire to “fit in” and oppositional behavior can lead to poor adherence to treatment.17 Regardless of age, other barriers to treatment adherence are forgetfulness, belief that the drug is not working, and the messiness of treatment.17
Educational tools (eg, action plans, instructions about how to apply topical medications correctly) may be underutilized in patients with AD. If consistently implemented, these tools could have a positive impact on adherence to medication in patients with AD. For example, written action plans pioneered in the asthma community have shown to improve quality of life and reduce disease severity and may offer the same benefits for AD patients due to the similarities of the diseases.18 Since AD patients and their caregivers often are not well versed in how to apply topical medications correctly, efforts to educate patients could potentially increase adherence to treatment. In one study, AD patients began to use medications more effectively after applying a fluorescent cream to reveal affected areas they had missed, and clinicians were able to provide additional instruction based on the findings.19
Adherence to topical treatments among AD patients is a multifactorial issue. Regimens often are complex and inconvenient due to the need for multiple medications, the topical nature of the products, and the need for frequent application. To optimize prescription treatments, patients also must be diligent with preventive measures such as application of topical emollients and use of bathing techniques (eg, bleach baths). A way to overcome treatment complexity and increase adherence may be to provide a written action plan and involve the patient and caregiver in the plan’s development. If a drug formulation is not aesthetically acceptable to the patient (eg, the greasiness of an ointment), allowing the patient to choose the medication vehicle may increase satisfaction and use.12 Fear of steroid side effects also is common among patients and caregivers and could be overcome with education about the product.20
Conclusion
Treatment adherence can have a dramatic effect on diseases outcomes and can be particularly challenging in AD due to the use of topical medications with complex treatment regimens. Additionally, a large majority of patients with AD are children, from infants to teenagers, adding another layer of treatment challenges. Further research is needed to more definitively develop effective methods for enhancing treatment adherence in this patient population. Although enormous amounts of money are being spent to develop improved treatments for AD, we may be able to achieve far more benefit at a much lower cost by figuring out how to get patients to adhere to the treatments that are already available.
- Eichenfield LF, Tom WL, Chamlin SL, et al. Guidelines of care for the management of atopic dermatitis: section 1. diagnosis and assessment of atopic dermatitis. J Am Acad Dermatol. 2014;70:338-351.
- Landis ET, Davis SA, Taheri A, et al. Top dermatologic diagnoses by age. Dermatol Online J. 2014;20:22368.
- Eichenfield LF, Tom WL, Berger TG, et al. Guidelines of care for the management of atopic dermatitis: section 2. management and treatment of atopic dermatitis with topical therapies. J Am Acad Dermatol. 2014;71:116-132.
- Lee IA, Maibach HI. Pharmionics in dermatology: a review of topical medication adherence. Am J Clin Dermatol. 2006;7:231-236.
- Tan X, Feldman SR, Chang J, et al. Topical drug delivery systems in dermatology: a review of patient adherence issues. Expert Opin Drug Deliv. 2012;9:1263-1271.
- Sidbury R, Davis DM, Cohen DE, et al. Guidelines of care for the management of atopic dermatitis: section 3. Management and treatment with phototherapy and systemic agents. J Am Acad Dermatol. 2014;71:327-349.
- Krejci-Manwaring J, Tusa MG, Carroll C, et al. Stealth monitoring of adherence to topical medication: adherence is very poor in children with atopic dermatitis. J Am Acad Dermatol. 2007;56:211-216.
- Conde JF, Kaur M, Fleischer AB Jr, et al. Adherence to clocortolone pivalate cream 0.1% in a pediatric population with atopic dermatitis. Cutis. 2008;81:435-441.
- Wilson R, Camacho F, Clark AR, et al. Adherence to topical hydrocortisone 17-butyrate 0.1% in different vehicles in adults with atopic dermatitis. J Am Acad Dermatol. 2009;60:166-168.
- Sagransky MJ, Yentzer BA, Williams LL, et al. A randomized controlled pilot study of the effects of an extra office visit on adherence and outcomes in atopic dermatitis. Arch Dermatol. 2010;146:1428-1430.
- Yentzer BA, Ade RA, Fountain JM, et al. Improvement in treatment adherence with a 3-day course of fluocinonide cream 0.1% for atopic dermatitis. Cutis. 2010;86:208-213.
- Yentzer BA, Camacho FT, Young T, et al. Good adherence and early efficacy using desonide hydrogel for atopic dermatitis: results from a program addressing patient compliance. J Drugs Dermatol. 2010;9:324-329.
- Hix E, Gustafson CJ, O’Neill JL, et al. Adherence to a five day treatment course of topical fluocinonide 0.1% cream in atopic dermatitis. Dermatol Online J. 2013;19:20029.
- Taheri A, Cantrell J, Feldman SR. Tachyphylaxis to topical glucocorticoids; what is the evidence? Dermatol Online J. 2013;19:18954.
- Santer M, Burgess H, Yardley L, et al. Managing childhood eczema: qualitative study exploring carers’ experiences of barriers and facilitators to treatment adherence. J Adv Nurs. 2013;69:2493-2501.
- Ohya Y, Williams H, Steptoe A, et al. Psychosocial factors and adherence to treatment advice in childhood atopic dermatitis. J Invest Dermatol. 2001;117:852-857.
- Ou HT, Feldman SR, Balkrishnan R. Understanding and improving treatment adherence in pediatric patients. Semin Cutan Med Surg. 2010;29:137-140.
- Chisolm SS, Taylor SL, Balkrishnan R, et al. Written action plans: potential for improving outcomes in children with atopic dermatitis. J Am Acad Dermatol. 2008;59:677-683.
- Ulff E, Maroti M, Serup J. Fluorescent cream used as an educational intervention to improve the effectiveness of self-application by patients with atopic dermatitis. J Dermatolog Treat. 2013;24:268-271.
- Aubert-Wastiaux H, Moret L, Le Rhun A, et al. Topical corticosteroid phobia in atopic dermatitis: a study of its nature, origins and frequency. Br J Dermatol. 2011;165:808-814.
Practice Points
- When used correctly, topical treatments for atopic dermatitis (AD) generally are straightforward and efficacious, but poor adherence to treatment can prevent patients from achieving disease control.
- Patients tend to overestimate their adherence to topical treatment regimens for AD compared to actual adherence rates.
- Improved treatment adherence in this patient population may be achieved by allowing patients to choose their preferred topical vehicle and providing patient education about how to apply medications effectively; for pediatric patients, AD action plans also may be useful.

Pharmacotherapy for Tobacco Use and COPD
Up to one‐third of the 700,000 patients admitted annually for an exacerbation of chronic obstructive pulmonary disease (COPD) continue to smoke tobacco.[1, 2] Smokers with COPD are at high risk for poor health outcomes directly attributable to tobacco‐related conditions, including progression of lung disease and cardiovascular diseases.[3, 4, 5] Treatment for tobacco addiction is the most essential intervention for these patients.
Hospital admission has been suggested as an opportune time for the initiation of smoking cessation.[6] Hospitalized patients are already in a smoke‐free environment, and have access to physicians, nurses, and pharmacists who can prescribe medications for support.[7] Documenting smoking status and offering smoking cessation treatment during and after discharge are quality metrics required by the Joint Commission, and recommended by the National Quality Forum.[8, 9] Hospitals have made significant efforts to comply with these requirements.[10]
Limited data exist regarding the effectiveness and utilization of treatments known to reduce cigarette use among COPD patients in nontrial environments. Prescribing patterns of medications for smoking cessation in the real world following admission for COPD are not well studied. We sought to examine the utilization of inpatient brief tobacco counseling and postdischarge pharmacotherapy following discharge for exacerbation of COPD, as well as to (1) examine the association of postdischarge pharmacotherapy with self‐reported smoking cessation at 6 to 12 months and (2) assess differences in effectiveness between cessation medications prescribed.
METHODS
We conducted a cohort study of current smokers discharged following a COPD exacerbation within the Veterans Affairs (VA) Veterans Integrated Service Network (VISN)‐20. This study was approved by the VA Puget Sound Health Care System Institutional Review Board (#00461).
We utilized clinical information from the VISN‐20 data warehouse that collects data using the VA electronic medical record, including demographics, prescription medications, hospital admissions, hospital and outpatient diagnoses, and dates of death, and is commonly used for research. In addition, we utilized health factors, coded electronic entries describing patient health behaviors that are entered by nursing staff at the time of a patient encounter, and the text of chart notes that were available for electronic query.
Study Cohort
We identified all smokers aged 40 years hospitalized between 2005 and 2012 with either a primary discharge diagnosis of COPD based on International Classification of Diseases, 9th Revision codes (491, 492, 493.2, and 496) or an admission diagnosis from the text of the admit notes indicating an exacerbation of COPD. We limited to patients aged 40 years to improve the specificity of the diagnosis of COPD, and we selected the first hospitalization that met inclusion criteria. We excluded subjects who died within 6 months of discharge (Figure 1).
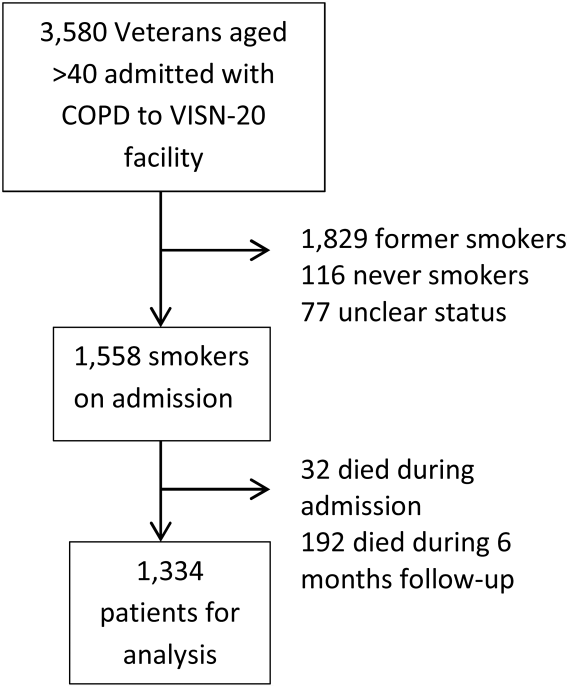
To establish tobacco status, we built on previously developed and validated methodology,[11] and performed truncated natural language processing using phrases in the medical record that reflected patients' tobacco status, querying all notes from the day of admission up to 6 months prior. If no tobacco status was indicated in the notes, we identified the status encoded by the most recent health factor. We manually examined the results of the natural language processing and the determination of health factors to confirm the tobacco status. Manual review was undertaken by 1 of 2 trained study personnel. In the case of an ambiguous or contradictory status, an additional team member reviewed the information to attempt to make a determination. If no determination could be made, the record was coded to unknown. This method allowed us to identify a baseline status for all but 77 of the 3580 patients admitted for COPD.
Outcome and Exposure
The outcome was tobacco status at 6 to 12 months after discharge. Using the same methods developed for identification of baseline smoking status, we obtained smoking status for each subject up to 12 months postdischarge. If multiple notes and encounters were available indicating smoking status, we chose the latest within 12 months of discharge. Subjects lacking a follow‐up status were presumed to be smokers, a common assumption.[12] The 6 to 12month time horizon was chosen as these are the most common time points used to examine a sustained change in tobacco status,[13, 14, 15] and allowed for adequate time for treatment and clinical follow‐up.
Our primary exposure was any smoking cessation medication or combination dispensed within 90 days of discharge. This time horizon for treatment was chosen due to recent studies indicating this is a meaningful period for postdischarge treatment.[14] We assessed the use of nicotine patch, short‐acting nicotine, varenicline, buproprion, or any combination. Accurate data on the prescription and dispensing of these medications were available from the VA pharmacy record. Secondary exposure was the choice of medication dispensed among treated patients. We assessed additional exposures including receipt of cessation medications within 48 hours of discharge, treatment in the year prior to admission, and predischarge counseling. Predischarge counseling was determined as having occurred if nurses documented that they completed a discharge process focused on smoking cessation. Referral to a quit line is part of this process; however, due to the confidential nature of these interactions, generally low use of this service, and lack of linkage to the VA electronic health record, it was not considered in the analysis.
Confounders
Potential confounders were assessed in the year prior to admission up to discharge from the index hospitalization, with the use of mechanical or noninvasive ventilation assessed during the hospitalization. We adjusted for variables chosen a priori for their known or expected association with smoking cessation including demographics, Charlson Comorbidity Index,[16] markers of COPD severity (need for invasive or noninvasive mechanical ventilation during index hospitalization, use of oral steroids, long‐acting inhaled bronchodilators, and/or canister count of short‐acting bronchodilators in the year prior to admission), history of drug or alcohol abuse, homelessness, depression, psychosis, post‐traumatic stress disorder, lung cancer, coronary artery disease, and under‐ or overweight status. Nurse‐based counseling prior to discharge was included as a variable for adjustment for our primary and secondary predictors to assess the influence of pharmacotherapy specifically. Due to 3.1% missingness in body mass index, multiple imputation with chained equations was used to impute missing values, with 10 imputations performed. The imputation was performed using a linear regression model containing all variables included in the final model, grouped by facility.
Statistical Analysis
All analyses were performed using Stata 13 (StataCorp, College Station, TX) software. 2 tests and t tests were used to assess for unadjusted bivariate associations. Using the pooled imputed datasets, we performed multivariable logistic regression to compare odds ratios for a change in smoking status, adjusting the estimates of coefficients and standard errors by applying combination rules to the 10 completed‐data estimates.[17] We analyzed our primary and secondary predictors, adjusting for the confounders chosen a priori, clustered by facility with robust standard errors. An level of <0.05 was considered significant.
Sensitivity Analysis
We assumed that subjects missing a follow‐up status were ongoing smokers. However, given the high mortality rate observed in our cohort, we were concerned that some subjects lacking a follow‐up status may have died, missing the opportunity to have a quit attempt recorded. Therefore, we performed sensitivity analysis excluding subjects who died during the 6 to 12 months of follow‐up, repeating the imputation and analysis as described above. In addition, due to concern for indication bias in the choice of medication used for our secondary analysis, we performed propensity score matching for treatment with each medication in comparison to nicotine patch, using the teffects command, with 3 nearest neighbor matches. We included additional comorbidities in the propensity score matching.[18]
RESULTS
Among these 1334 subjects at 6 to 12 months of follow‐up, 63.7% reported ongoing smoking, 19.8% of patients reported quitting, and 17.5% of patients had no reported status and were presumed to be smokers. Four hundred fifty (33.7%) patients were dispensed a smoking cessation medication within 90 days of discharge. Patients who were dispensed medications were younger and more likely to be female. Nearly all patients who received medications also received documented predischarge counseling (94.6%), as did the majority of patients who did not receive medications (83.8%) (Table 1).
| Variable | No Medication Dispensed, n = 884, No. (%) | Medication Dispensed, n = 450, No. (%) | P Value |
|---|---|---|---|
| |||
| Not smoking at 612 months | 179 (20.2) | 85 (18.9) | 0.56 |
| Brief counseling at discharge | 742 (83.8%) | 424 (94.6%) | <0.001* |
| Age | 64.49.13 (4094) | 61.07.97 (4185) | <0.001* |
| Male | 852 (96.3) | 423 (94.0) | 0.05* |
| Race | 0.12 | ||
| White | 744 (84.2) | 377 (83.8) | |
| Black | 41 (4.6) | 12 (2.7) | |
| Other/unknown | 99 (11.1) | 61 (13.6) | |
| BMI | 28.09.5 (12.669.0) | 28.910.8 (14.860.0) | 0.15 |
| Homeless | 68 (7.7) | 36 (8.0) | 0.84 |
| Psychiatric conditions/substance abuse | |||
| History of alcohol abuse | 205 (23.2) | 106 (23.6) | 0.88 |
| History of drug abuse | 110 (12.4) | 72 (16.0) | 0.07 |
| Depression | 39 (4.4) | 29 (6.4) | 0.11 |
| Psychosis | 201 (22.7) | 88 (19.6) | 0.18 |
| PTSD | 146 (16.5) | 88 (19.6) | 0.17 |
| Comorbidities | |||
| Coronary artery disease | 254 (28.7) | 110 (24.4) | 0.10 |
| Cerebrovascular accident | 80 (9.0) | 28 (2.2) | 0.86 |
| Obstructive sleep apnea | 42 (4.8) | 23 (5.1) | 0.77 |
| Lung cancer | 21 (2.4) | 10 (2.2) | 0.86 |
| Charlson Comorbidity Index | 2.251.93 (014) | 2.111.76 (010) | 0.49 |
| Markers of COPD severity | |||
| Mechanical ventilation during admission | 28 (3.2) | 14 (3.1) | 0.96 |
| NIPPV during admission | 97 (11.0) | 51 (11.3) | 0.84 |
| Oral steroids prescribed in the past year | 334 (37.8) | 154 (34.2) | 0.20 |
| Treatment with tiotropium in the past year | 97 (11.0) | 55 (12.2) | 0.50 |
| Treatment with LABA in the past year | 264 (29.9) | 155 (34.4) | 0.09 |
| Canisters of SABA used in past year | 6.639.8, (084) | 7.469.63 (045) | 0.14 |
| Canisters of ipratropium used in past year | 6.458.81 (054) | 6.869.08 (064) | 0.42 |
| Died during 612 months of follow‐up | 78 (8.8) | 28 (6.6) | 0.10 |
Of patients dispensed a study medication, 246 (18.4% of patients, 54.7% of all medications dispensed) were dispensed medications within 48 hours of discharge (Table 2). Of the patients dispensed medication, the majority received nicotine patches alone (Table 3), and 18.9% of patients received combination therapy, with the majority receiving nicotine patch and short‐acting nicotine replacement therapy (NRT) or patch and buproprion. A significant number of patients were prescribed medications within 90 days of discharge, but did not have them dispensed within that timeframe (n = 224, 16.8%).
| Medication Dispensed | No. (%) | % Quit (Unadjusted) | OR (95% CI) | P Value |
|---|---|---|---|---|
| ||||
| No medications dispensed | 884 (66.3) | 20.2 | Referent | |
| Any medication from | ||||
| Discharge to 90 days | 450 (33.7) | 18.9 | 0.88 (0.741.04) | 0.137 |
| Within 48 hours of discharge | 246 (18.4) | 18.3 | 0.87 (0.661.14) | 0.317 |
| Treated in the year prior to admission | 221 (16.6) | 19.6 | Referent | |
| Treated in the year prior to admission + 090 days postdischarge | 152 (11.4) | 18.4 | 0.95 (0.791.13) | 0.534 |
| No nurse‐provided counseling prior to discharge | 169 (12.7) | 20.5 | Referent | |
| Nurse‐provided counseling prior to discharge | 1,165 (87.3) | 19.5 | 0.95 (0.661.36) | 0.774 |
| Medication Dispensed | No. (%) | % Quit (Unadjusted) | OR (95% CI) | P Value |
|---|---|---|---|---|
| ||||
| Nicotine patch | 242 (53.8) | 18.6 | Referent | |
| Monotherapy with | ||||
| Varenicline | 36 (8.0) | 30.6 | 2.44 (1.484.05) | 0.001 |
| Short‐acting NRT | 34 (7.6) | 11.8 | 0.66 (0.510.85) | 0.001 |
| Buproprion | 55 (12.2) | 21.8 | 1.05 (0.671.62) | 0.843 |
| Combination therapy | 85 (18.9) | 15.7 | 0.94 (0.711.24) | 0.645 |
Association of Treatment With Study Medications and Quitting Smoking
In adjusted analyses, the odds of quitting smoking at 6 to 12 months were not greater among patients who were dispensed a study medication within 90 days of discharge (odds ratio [OR]: 0.88, 95% confidence interval [CI]: 0.74‐1.04). We found no association between counseling provided at discharge and smoking cessation (OR: 0.95, 95% CI: 0.0.66‐1.), adjusted for the receipt of medications. There was no difference in quit rate between patients dispensed medication within 48 hours of discharge, or between patients treated in the year prior to admission and again postdischarge (Table 2).
We then assessed differences in effectiveness between specific medications among the 450 patients who were dispensed medications. Using nicotine patch alone as the referent group, patients treated with varenicline demonstrated greater odds of smoking cessation (OR: 2.44, 95% CI: 1.48‐4.05). Patients treated with short‐acting NRT alone were less likely to report smoking cessation (OR: 0.66, 95% CI: 0.51‐0.85). Patients treated with buproprion or combination therapy were no more likely to report cessation (Table 3). When sensitivity analysis was performed using propensity score matching with additional variables included, there were no significant differences in the observed associations.
Our overall mortality rate observed at 1 year was 19.5%, nearly identical to previous cohort studies of patients admitted for COPD.[19, 20] Because of the possibility of behavioral differences on the part of patients and physicians regarding subjects with a limited life expectancy, we performed sensitivity analysis limited to the patients who survived to at least 12 months of follow‐up. One hundred six patients (7.9%) died during 6 to 12 months of follow‐up. There was no change in inference for our primary exposure (OR: 0.95, 95% CI: 0.79‐1.14) or any of the secondary exposures examined.
DISCUSSION
In this observational study, postdischarge pharmacotherapy within 90 days of discharge was provided to a minority of high‐risk smokers admitted for COPD, and was not associated with smoking cessation at 6 to 12 months. In comparison to nicotine patch alone, varenicline was associated with a higher odds of cessation, with decreased odds of cessation among patients treated with short‐acting NRT alone. The overall quit rate was significant at 19.8%, and is consistent with annual quit rates observed among patients with COPD in other settings,[21, 22] but is far lower than quit rates observed after admission for acute myocardial infarction.[23, 24, 25] Although the proportion of patients treated at the time of discharge or within 90 days was low, our findings are in keeping with previous studies, which demonstrated low rates of pharmacologic treatment following hospitalization, averaging 14%.[26] Treatment for tobacco use is likely underutilized for this group of high‐risk smokers. However, a significant proportion of patients who were prescribed medications in the postdischarge period did not have medications filled. This likely reflects both the rapid changes in motivation that characterize quit attempts,[27] as well as efforts on the part of primary care physicians to make these medications available to facilitate future quit attempts.
There are several possible explanations for the findings in our study. Pharmaceutical therapies were not provided at random. The provision of pharmacotherapy and the ultimate success of a quit attempt reflects a complex interaction of patient beliefs concerning medications, level of addiction and motivation, physician behavior and knowledge, and organizational factors. Organizational factors such as the structure of electronic discharge orders and the availability of decision support materials may influence a physician's likelihood of prescribing medications, the choice of medication prescribed, and therefore the adequacy of control of withdrawal symptoms. NRT is often under dosed to control ongoing symptoms,[28] and needs to be adjusted until relief is obtained, providing an additional barrier to effectiveness during the transition out of the hospital. Because most smokers with COPD are highly addicted to nicotine,[29] high‐dose NRT, combination therapy, or varenicline would be necessary to adequately control symptoms.[30] However, a significant minority of patients received short‐acting NRT alone.
Despite a high observed efficacy in recent trials,[31, 32] few subjects in our study received varenicline. This may be related to both secular trends and administrative barriers to the use of varenicline in the VA system. Use of this medication was limited among patients with psychiatric disorders due to safety concerns. These concerns have since been largely disproven, but may have limited access to this medication.[33, 34, 35] Although we adjusted for a history of mental illness, patients who received varenicline may have had more past quit attempts and less active mental illness, which may be associated with improved cessation rates. Despite the high prevalence of mental illness we observed, this is typical of the population of smokers, with studies indicating nearly one‐third of smokers overall suffer from mental illness.[36]
Although the majority of our patients received a brief, nurse‐based counseling intervention, there is considerable concern about the overall effectiveness of a single predischarge interaction to produce sustained smoking cessation among highly addicted smokers.[37, 38, 39, 40] The Joint Commission has recently restructured the requirements for smoking cessation treatment for hospitalized patients, and it is now up to hospitals to implement treatment mechanisms that not only meet the national requirements, but also provide a meaningful clinical effect. Though the optimum treatment for hospitalized smokers with COPD is unknown, previous positive studies of smoking cessation among hospitalized patients underscore the need for a higher‐intensity counseling intervention that begins during hospitalization and continues after discharge.[13, 41] Cessation counseling services including tobacco cessation groups and quit lines are available through the VA; however, the use of these services is typically low and requires the patient to enroll independently after discharge, an additional barrier. The lack of association between medications and smoking cessation found in our study could reflect poor effectiveness of medications in the absence of a systematic counseling intervention. Alternatively, the association may be explained that patients who were more highly addicted and perhaps less motivated to quit received tobacco cessation medications more often, but were also less likely to stop tobacco use, a form of indication bias.
Our study has several limitations. We do not have addiction or motivation levels for a cessation attempt, a potential unmeasured confounder. Although predictive of quit attempts, motivation factors are less predictive of cessation maintenance, and may therefore have an unclear effect on our outcome.[42, 43] Our outcome was gathered as part of routine clinical care, which may have introduced bias if patients over‐reported cessation because of social desirability. In healthcare settings, however, this form of assessing smoking status is generally valid.[44] Exposure to counseling or medications obtained outside of the VA system would not have been captured. Given the financial incentive, we believe it is unlikely that many patients admitted to a VA medical center obtained medications elsewhere.[45] The diagnosis of COPD was made administratively. However, all subjects were admitted for an exacerbation, which is associated with more severe COPD by Global Initiative for Obstructive Lung Disease (GOLD) stage.[46] Patients with more severe COPD are often excluded from studies of smoking cessation due to concerns of high dropout and lower prevalence of smoking among patients with GOLD stage IV disease,[47, 48] making this a strength of our study. Subjects who died may have quit only in extremis, or failed to document their quit attempts. However, our sensitivity analysis limited to survivors did not change the study results. There may have been some misclassification in the use of buproprion, which may also be prescribed as an antidepressant. Finally, although representative of the veterans who seek care within the VISN‐20, our patients were primarily white and male, limiting the ability to generalize outside of this group.
Our study had several strengths. We examined a large cohort of patients admitted to a complete care organization, including patients from a diverse group of VA settings comprising academically and nonacademically affiliated centers. We performed an unbiased collection of patients, including all smokers discharged for COPD. We had access to excellent completeness of medications prescribed and filled as collected within the VA system, enabling us to observe medications dispensed and prescribed at several time points. We also had near complete ascertainment of outcomes including by using natural language processing with manual confirmation of smoking status.
In summary, we found that provision of medications to treat ongoing tobacco use among patients discharged for COPD was low, and receipt of medications was not associated with a reduction in smoking tobacco at 6 to 12 months postdischarge. However, among those treated, varenicline appears to be superior to the nicotine patch, with short‐acting nicotine replacement potentially less effective, a biologically plausible finding. The motivation to quit smoking changes rapidly over time. Providing these medications in the hospital and during the time after discharge is a potential means to improve quit rates, but medications need to be paired with counseling to be most effective. Collectively, these data suggest that systems‐based interventions are needed to increase the availability of intense counseling and the use of tailored pharmacotherapy to these patients.
Acknowledgements
The authors acknowledge Mr. Robert Plumley, who performed the data extraction and natural language processing necessary to complete this project.
Disclosures: Dr. Melzer conceived of the research question and performed background reading, analyses, primary drafting, and final revision of the manuscript. Drs. Collins and Feemster participated in finalizing the research question, developing the cohort, performing data collection, and revising the manuscript. Dr. Au provided the database for analysis, helped finalize the research question, and assisted in interpretation of the data and revision of the manuscript. Dr. Au has personally reviewed the data, understands the statistical methods employed, and confirms an understanding of this analysis, that the methods are clearly described, and that they are a fair way to report the results. This material is based upon work supported in part by the Department of Veterans Affairs, Veterans Health Administration, Office of Research and Development, who provided access to data, office space, and programming and data management. The views expressed in this article are those of the authors and do not necessarily reflect the position or policy of the Department of Veterans Affairs, the United States government, or the National Institutes of Health. Dr. Au is an unpaid research consultant for Analysis Group. None of the other authors have any conflicts of interest to disclose. Dr. Melzer is supported by an institutional F‐32 (HL007287‐36) through the University of Washington Department of Pulmonary and Critical Care. Dr. Feemster is supported by an National Institutes of Health, National Heart, Lung, and Blood Institute, K23 Mentored Career Development Award (HL111116). Partial support of this project was provided by Gilead Sciences with research funding to the Seattle Institute for Biomedical and Clinical Research. Additional support was received through the VA Health Services Research and Development. A portion of this work was presented in abstract form at the American Thoracic Society International Meeting, May 2015, in Denver, Colorado.
- , , , , , . Patients hospitalized for COPD have a high prevalence of modifiable risk factors for exacerbation (EFRAM study). Eur Respir J. 2000;16(6):1037–1042.
- , , , et al. Analysis of hospitalizations for COPD exacerbation: opportunities for improving care. COPD. 2010;7(2):85–92.
- , , , . Mortality in COPD: role of comorbidities. Eur Respir J. 2006;28(6):1245–1257.
- , , , . Cardiovascular comorbidity in COPD: systematic literature review. Chest. 2013;144(4):1163–1178.
- . Engaging patients and clinicians in treating tobacco addiction. JAMA Intern Med. 2014;174(8):1299–1300.
- , . Smokers who are hospitalized: a window of opportunity for cessation interventions. Prev Med. 1992;21(2):262–269.
- , , , . Interventions for smoking cessation in hospitalised patients. Cochrane Database Syst Rev. 2012;5:CD001837.
- Specifications Manual for National Hospital Inpatient Quality Measures. Available at: http://www.jointcommission.org/specifications_manual_for_national_hospital_inpatient_quality_measures.aspx. Accessed January 15, 2015.
- Treating Tobacco Use and Dependence. April 2013. Agency for Healthcare Research and Quality, Rockford, MD. Available at: http://www.ahrq.gov/professionals/clinicians‐providers/guidelines‐recommendations/tobacco/clinicians/update/index.html. Accessed January 15, 2015.
- , , , . Smoking cessation advice rates in US hospitals. Arch Intern Med. 2011;171(18):1682–1684.
- , , , et al. Validating smoking data from the Veteran's Affairs Health Factors dataset, an electronic data source. Nicotine Tob Res. 2011;13(12):1233–1239.
- , , , et al. Do u smoke after txt? Results of a randomised trial of smoking cessation using mobile phone text messaging. Tob Control. 2005;14(4):255–261.
- , , , . The effectiveness of smoking cessation groups offered to hospitalised patients with symptoms of exacerbations of chronic obstructive pulmonary disease (COPD). Clin Respir J. 2008;2(3):158–165.
- , , , et al. Sustained care intervention and postdischarge smoking cessation among hospitalized adults: a randomized clinical trial. JAMA. 2014;312(7):719–728.
- , , , et al. Bupropion for smokers hospitalized with acute cardiovascular disease. Am J Med. 2006;119(12):1080–1087.
- , , . Adapting a clinical comorbidity index for use with ICD‐9‐CM administrative databases. J Clin Epidemiol. 1992;45(6):613–619.
- . Multiple Imputation for Nonresponse in Surveys. New York, NY: Wiley; 1987.
- , , , et al. Methods for constructing and assessing propensity scores. Health Serv Res. 2014;49(5):1701–1720.
- , , . Mortality and mortality‐related factors after hospitalization for acute exacerbation of COPD. Chest. 2003;124(2):459–467.
- , , , et al. Mortality after hospitalization for COPD. Chest. 2002;121(5):1441–1448.
- , , , , , . State quitlines and cessation patterns among adults with selected chronic diseases in 15 states, 2005–2008. Prev Chronic Dis. 2012;9(10):120105.
- , , . The effects of counseling on smoking cessation among patients hospitalized with chronic obstructive pulmonary disease: a randomized clinical trial. Int J Addict. 1991;26(1):107–119.
- , , , et al. Predictors of smoking cessation after a myocardial infarction: the role of institutional smoking cessation programs in improving success. Arch Intern Med. 2008;168(18):1961–1967.
- , , , , , . Post‐myocardial infarction smoking cessation counseling: associations with immediate and late mortality in older Medicare patients. Am J Med. 2005;118(3):269–275.
- , , , . Smoking cessation after acute myocardial infarction: effects of a nurse‐‐managed intervention. Ann Intern Med. 1990;113(2):118–123.
- , , , et al. Smoking care provision in hospitals: a review of prevalence. Nicotine Tob Res. 2008;10(5):757–774.
- , , , . Intentions to quit smoking change over short periods of time. Addict Behav. 2005;30(4):653–662.
- , , , , . Association of amount and duration of NRT use in smokers with cigarette consumption and motivation to stop smoking: a national survey of smokers in England. Addict Behav. 2015;40(0):33–38.
- , . Smoking prevalence, behaviours, and cessation among individuals with COPD or asthma. Respir Med. 2011;105(3):477–484.
- , , , et al. American College of Chest Physicians. Tobacco Dependence Treatment ToolKit. 3rd ed. Available at: http://tobaccodependence.chestnet.org. Accessed January 29, 2015.
- , , , , , . Effects of varenicline on smoking cessation in patients with mild to moderate COPD: a randomized controlled trial. Chest. 2011;139(3):591–599.
- , , , et al. Varenicline versus transdermal nicotine patch for smoking cessation: results from a randomised open‐label trial. Thorax. 2008;63(8):717–724.
- , , , , . Psychiatric adverse events in randomized, double‐blind, placebo‐controlled clinical trials of varenicline. Drug Saf. 2010;33(4):289–301.
- . Studies linking smoking‐cessation drug with suicide risk spark concerns. JAMA. 2009;301(10):1007–1008.
- , , , et al. A randomized, double‐blind, placebo‐controlled study evaluating the safety and efficacy of varenicline for smoking cessation in patients with schizophrenia or schizoaffective disorder. J Clin Psychiatry. 2012;73(5):654–660.
- , , . Smoking and mental illness: results from population surveys in Australia and the United States. BMC Public Health. 2009;9(1):285.
- , , , . Implementation and effectiveness of a brief smoking‐cessation intervention for hospital patients. Med Care. 2000;38(5):451–459.
- , , , et al. Clinical trial comparing nicotine replacement therapy (NRT) plus brief counselling, brief counselling alone, and minimal intervention on smoking cessation in hospital inpatients. Thorax. 2003;58(6):484–488.
- , , , et al. Dissociation between hospital performance of the smoking cessation counseling quality metric and cessation outcomes after myocardial infarction. Arch Intern Med. 2008;168(19):2111–2117.
- , , , , . Smoking cessation in hospitalized patients: Results of a randomized trial. Arch Intern Med. 1997;157(4):409–415.
- , , , , . Intensive smoking cessation counseling versus minimal counseling among hospitalized smokers treated with transdermal nicotine replacement: a randomized trial. Am J Med. 2003;114(7):555–562.
- , , , et al. Motivational factors predict quit attempts but not maintenance of smoking cessation: findings from the International Tobacco Control Four country project. Nicotine Tob Res. 2010;12(suppl):S4–S11.
- , , , , . Predictors of attempts to stop smoking and their success in adult general population samples: a systematic review. Addiction. 2011;106(12):2110–2121.
- , , , et al. Validity of self‐reported smoking status among participants in a lung cancer screening trial. Cancer Epidemiol Biomarkers Prev. 2006;15(10):1825–1828.
- , , , . VHA enrollees' health care coverage and use of care. Med Care Res Rev. 2003;60(2):253–67.
- , , , , . Association between lung function and exacerbation frequency in patients with COPD. Int J Chron Obstruct Pulmon Dis. 2010;5:435–444.
- , , , et al. Smoking cessation in patients with chronic obstructive pulmonary disease: a double‐blind, placebo‐controlled, randomised trial. Lancet. 2001;357(9268):1571–1575.
- , , . Nurse‐conducted smoking cessation in patients with COPD using nicotine sublingual tablets and behavioral support. Chest. 2006;130(2):334–342.
Up to one‐third of the 700,000 patients admitted annually for an exacerbation of chronic obstructive pulmonary disease (COPD) continue to smoke tobacco.[1, 2] Smokers with COPD are at high risk for poor health outcomes directly attributable to tobacco‐related conditions, including progression of lung disease and cardiovascular diseases.[3, 4, 5] Treatment for tobacco addiction is the most essential intervention for these patients.
Hospital admission has been suggested as an opportune time for the initiation of smoking cessation.[6] Hospitalized patients are already in a smoke‐free environment, and have access to physicians, nurses, and pharmacists who can prescribe medications for support.[7] Documenting smoking status and offering smoking cessation treatment during and after discharge are quality metrics required by the Joint Commission, and recommended by the National Quality Forum.[8, 9] Hospitals have made significant efforts to comply with these requirements.[10]
Limited data exist regarding the effectiveness and utilization of treatments known to reduce cigarette use among COPD patients in nontrial environments. Prescribing patterns of medications for smoking cessation in the real world following admission for COPD are not well studied. We sought to examine the utilization of inpatient brief tobacco counseling and postdischarge pharmacotherapy following discharge for exacerbation of COPD, as well as to (1) examine the association of postdischarge pharmacotherapy with self‐reported smoking cessation at 6 to 12 months and (2) assess differences in effectiveness between cessation medications prescribed.
METHODS
We conducted a cohort study of current smokers discharged following a COPD exacerbation within the Veterans Affairs (VA) Veterans Integrated Service Network (VISN)‐20. This study was approved by the VA Puget Sound Health Care System Institutional Review Board (#00461).
We utilized clinical information from the VISN‐20 data warehouse that collects data using the VA electronic medical record, including demographics, prescription medications, hospital admissions, hospital and outpatient diagnoses, and dates of death, and is commonly used for research. In addition, we utilized health factors, coded electronic entries describing patient health behaviors that are entered by nursing staff at the time of a patient encounter, and the text of chart notes that were available for electronic query.
Study Cohort
We identified all smokers aged 40 years hospitalized between 2005 and 2012 with either a primary discharge diagnosis of COPD based on International Classification of Diseases, 9th Revision codes (491, 492, 493.2, and 496) or an admission diagnosis from the text of the admit notes indicating an exacerbation of COPD. We limited to patients aged 40 years to improve the specificity of the diagnosis of COPD, and we selected the first hospitalization that met inclusion criteria. We excluded subjects who died within 6 months of discharge (Figure 1).
To establish tobacco status, we built on previously developed and validated methodology,[11] and performed truncated natural language processing using phrases in the medical record that reflected patients' tobacco status, querying all notes from the day of admission up to 6 months prior. If no tobacco status was indicated in the notes, we identified the status encoded by the most recent health factor. We manually examined the results of the natural language processing and the determination of health factors to confirm the tobacco status. Manual review was undertaken by 1 of 2 trained study personnel. In the case of an ambiguous or contradictory status, an additional team member reviewed the information to attempt to make a determination. If no determination could be made, the record was coded to unknown. This method allowed us to identify a baseline status for all but 77 of the 3580 patients admitted for COPD.
Outcome and Exposure
The outcome was tobacco status at 6 to 12 months after discharge. Using the same methods developed for identification of baseline smoking status, we obtained smoking status for each subject up to 12 months postdischarge. If multiple notes and encounters were available indicating smoking status, we chose the latest within 12 months of discharge. Subjects lacking a follow‐up status were presumed to be smokers, a common assumption.[12] The 6 to 12month time horizon was chosen as these are the most common time points used to examine a sustained change in tobacco status,[13, 14, 15] and allowed for adequate time for treatment and clinical follow‐up.
Our primary exposure was any smoking cessation medication or combination dispensed within 90 days of discharge. This time horizon for treatment was chosen due to recent studies indicating this is a meaningful period for postdischarge treatment.[14] We assessed the use of nicotine patch, short‐acting nicotine, varenicline, buproprion, or any combination. Accurate data on the prescription and dispensing of these medications were available from the VA pharmacy record. Secondary exposure was the choice of medication dispensed among treated patients. We assessed additional exposures including receipt of cessation medications within 48 hours of discharge, treatment in the year prior to admission, and predischarge counseling. Predischarge counseling was determined as having occurred if nurses documented that they completed a discharge process focused on smoking cessation. Referral to a quit line is part of this process; however, due to the confidential nature of these interactions, generally low use of this service, and lack of linkage to the VA electronic health record, it was not considered in the analysis.
Confounders
Potential confounders were assessed in the year prior to admission up to discharge from the index hospitalization, with the use of mechanical or noninvasive ventilation assessed during the hospitalization. We adjusted for variables chosen a priori for their known or expected association with smoking cessation including demographics, Charlson Comorbidity Index,[16] markers of COPD severity (need for invasive or noninvasive mechanical ventilation during index hospitalization, use of oral steroids, long‐acting inhaled bronchodilators, and/or canister count of short‐acting bronchodilators in the year prior to admission), history of drug or alcohol abuse, homelessness, depression, psychosis, post‐traumatic stress disorder, lung cancer, coronary artery disease, and under‐ or overweight status. Nurse‐based counseling prior to discharge was included as a variable for adjustment for our primary and secondary predictors to assess the influence of pharmacotherapy specifically. Due to 3.1% missingness in body mass index, multiple imputation with chained equations was used to impute missing values, with 10 imputations performed. The imputation was performed using a linear regression model containing all variables included in the final model, grouped by facility.
Statistical Analysis
All analyses were performed using Stata 13 (StataCorp, College Station, TX) software. 2 tests and t tests were used to assess for unadjusted bivariate associations. Using the pooled imputed datasets, we performed multivariable logistic regression to compare odds ratios for a change in smoking status, adjusting the estimates of coefficients and standard errors by applying combination rules to the 10 completed‐data estimates.[17] We analyzed our primary and secondary predictors, adjusting for the confounders chosen a priori, clustered by facility with robust standard errors. An level of <0.05 was considered significant.
Sensitivity Analysis
We assumed that subjects missing a follow‐up status were ongoing smokers. However, given the high mortality rate observed in our cohort, we were concerned that some subjects lacking a follow‐up status may have died, missing the opportunity to have a quit attempt recorded. Therefore, we performed sensitivity analysis excluding subjects who died during the 6 to 12 months of follow‐up, repeating the imputation and analysis as described above. In addition, due to concern for indication bias in the choice of medication used for our secondary analysis, we performed propensity score matching for treatment with each medication in comparison to nicotine patch, using the teffects command, with 3 nearest neighbor matches. We included additional comorbidities in the propensity score matching.[18]
RESULTS
Among these 1334 subjects at 6 to 12 months of follow‐up, 63.7% reported ongoing smoking, 19.8% of patients reported quitting, and 17.5% of patients had no reported status and were presumed to be smokers. Four hundred fifty (33.7%) patients were dispensed a smoking cessation medication within 90 days of discharge. Patients who were dispensed medications were younger and more likely to be female. Nearly all patients who received medications also received documented predischarge counseling (94.6%), as did the majority of patients who did not receive medications (83.8%) (Table 1).
| Variable | No Medication Dispensed, n = 884, No. (%) | Medication Dispensed, n = 450, No. (%) | P Value |
|---|---|---|---|
| |||
| Not smoking at 612 months | 179 (20.2) | 85 (18.9) | 0.56 |
| Brief counseling at discharge | 742 (83.8%) | 424 (94.6%) | <0.001* |
| Age | 64.49.13 (4094) | 61.07.97 (4185) | <0.001* |
| Male | 852 (96.3) | 423 (94.0) | 0.05* |
| Race | 0.12 | ||
| White | 744 (84.2) | 377 (83.8) | |
| Black | 41 (4.6) | 12 (2.7) | |
| Other/unknown | 99 (11.1) | 61 (13.6) | |
| BMI | 28.09.5 (12.669.0) | 28.910.8 (14.860.0) | 0.15 |
| Homeless | 68 (7.7) | 36 (8.0) | 0.84 |
| Psychiatric conditions/substance abuse | |||
| History of alcohol abuse | 205 (23.2) | 106 (23.6) | 0.88 |
| History of drug abuse | 110 (12.4) | 72 (16.0) | 0.07 |
| Depression | 39 (4.4) | 29 (6.4) | 0.11 |
| Psychosis | 201 (22.7) | 88 (19.6) | 0.18 |
| PTSD | 146 (16.5) | 88 (19.6) | 0.17 |
| Comorbidities | |||
| Coronary artery disease | 254 (28.7) | 110 (24.4) | 0.10 |
| Cerebrovascular accident | 80 (9.0) | 28 (2.2) | 0.86 |
| Obstructive sleep apnea | 42 (4.8) | 23 (5.1) | 0.77 |
| Lung cancer | 21 (2.4) | 10 (2.2) | 0.86 |
| Charlson Comorbidity Index | 2.251.93 (014) | 2.111.76 (010) | 0.49 |
| Markers of COPD severity | |||
| Mechanical ventilation during admission | 28 (3.2) | 14 (3.1) | 0.96 |
| NIPPV during admission | 97 (11.0) | 51 (11.3) | 0.84 |
| Oral steroids prescribed in the past year | 334 (37.8) | 154 (34.2) | 0.20 |
| Treatment with tiotropium in the past year | 97 (11.0) | 55 (12.2) | 0.50 |
| Treatment with LABA in the past year | 264 (29.9) | 155 (34.4) | 0.09 |
| Canisters of SABA used in past year | 6.639.8, (084) | 7.469.63 (045) | 0.14 |
| Canisters of ipratropium used in past year | 6.458.81 (054) | 6.869.08 (064) | 0.42 |
| Died during 612 months of follow‐up | 78 (8.8) | 28 (6.6) | 0.10 |
Of patients dispensed a study medication, 246 (18.4% of patients, 54.7% of all medications dispensed) were dispensed medications within 48 hours of discharge (Table 2). Of the patients dispensed medication, the majority received nicotine patches alone (Table 3), and 18.9% of patients received combination therapy, with the majority receiving nicotine patch and short‐acting nicotine replacement therapy (NRT) or patch and buproprion. A significant number of patients were prescribed medications within 90 days of discharge, but did not have them dispensed within that timeframe (n = 224, 16.8%).
| Medication Dispensed | No. (%) | % Quit (Unadjusted) | OR (95% CI) | P Value |
|---|---|---|---|---|
| ||||
| No medications dispensed | 884 (66.3) | 20.2 | Referent | |
| Any medication from | ||||
| Discharge to 90 days | 450 (33.7) | 18.9 | 0.88 (0.741.04) | 0.137 |
| Within 48 hours of discharge | 246 (18.4) | 18.3 | 0.87 (0.661.14) | 0.317 |
| Treated in the year prior to admission | 221 (16.6) | 19.6 | Referent | |
| Treated in the year prior to admission + 090 days postdischarge | 152 (11.4) | 18.4 | 0.95 (0.791.13) | 0.534 |
| No nurse‐provided counseling prior to discharge | 169 (12.7) | 20.5 | Referent | |
| Nurse‐provided counseling prior to discharge | 1,165 (87.3) | 19.5 | 0.95 (0.661.36) | 0.774 |
| Medication Dispensed | No. (%) | % Quit (Unadjusted) | OR (95% CI) | P Value |
|---|---|---|---|---|
| ||||
| Nicotine patch | 242 (53.8) | 18.6 | Referent | |
| Monotherapy with | ||||
| Varenicline | 36 (8.0) | 30.6 | 2.44 (1.484.05) | 0.001 |
| Short‐acting NRT | 34 (7.6) | 11.8 | 0.66 (0.510.85) | 0.001 |
| Buproprion | 55 (12.2) | 21.8 | 1.05 (0.671.62) | 0.843 |
| Combination therapy | 85 (18.9) | 15.7 | 0.94 (0.711.24) | 0.645 |
Association of Treatment With Study Medications and Quitting Smoking
In adjusted analyses, the odds of quitting smoking at 6 to 12 months were not greater among patients who were dispensed a study medication within 90 days of discharge (odds ratio [OR]: 0.88, 95% confidence interval [CI]: 0.74‐1.04). We found no association between counseling provided at discharge and smoking cessation (OR: 0.95, 95% CI: 0.0.66‐1.), adjusted for the receipt of medications. There was no difference in quit rate between patients dispensed medication within 48 hours of discharge, or between patients treated in the year prior to admission and again postdischarge (Table 2).
We then assessed differences in effectiveness between specific medications among the 450 patients who were dispensed medications. Using nicotine patch alone as the referent group, patients treated with varenicline demonstrated greater odds of smoking cessation (OR: 2.44, 95% CI: 1.48‐4.05). Patients treated with short‐acting NRT alone were less likely to report smoking cessation (OR: 0.66, 95% CI: 0.51‐0.85). Patients treated with buproprion or combination therapy were no more likely to report cessation (Table 3). When sensitivity analysis was performed using propensity score matching with additional variables included, there were no significant differences in the observed associations.
Our overall mortality rate observed at 1 year was 19.5%, nearly identical to previous cohort studies of patients admitted for COPD.[19, 20] Because of the possibility of behavioral differences on the part of patients and physicians regarding subjects with a limited life expectancy, we performed sensitivity analysis limited to the patients who survived to at least 12 months of follow‐up. One hundred six patients (7.9%) died during 6 to 12 months of follow‐up. There was no change in inference for our primary exposure (OR: 0.95, 95% CI: 0.79‐1.14) or any of the secondary exposures examined.
DISCUSSION
In this observational study, postdischarge pharmacotherapy within 90 days of discharge was provided to a minority of high‐risk smokers admitted for COPD, and was not associated with smoking cessation at 6 to 12 months. In comparison to nicotine patch alone, varenicline was associated with a higher odds of cessation, with decreased odds of cessation among patients treated with short‐acting NRT alone. The overall quit rate was significant at 19.8%, and is consistent with annual quit rates observed among patients with COPD in other settings,[21, 22] but is far lower than quit rates observed after admission for acute myocardial infarction.[23, 24, 25] Although the proportion of patients treated at the time of discharge or within 90 days was low, our findings are in keeping with previous studies, which demonstrated low rates of pharmacologic treatment following hospitalization, averaging 14%.[26] Treatment for tobacco use is likely underutilized for this group of high‐risk smokers. However, a significant proportion of patients who were prescribed medications in the postdischarge period did not have medications filled. This likely reflects both the rapid changes in motivation that characterize quit attempts,[27] as well as efforts on the part of primary care physicians to make these medications available to facilitate future quit attempts.
There are several possible explanations for the findings in our study. Pharmaceutical therapies were not provided at random. The provision of pharmacotherapy and the ultimate success of a quit attempt reflects a complex interaction of patient beliefs concerning medications, level of addiction and motivation, physician behavior and knowledge, and organizational factors. Organizational factors such as the structure of electronic discharge orders and the availability of decision support materials may influence a physician's likelihood of prescribing medications, the choice of medication prescribed, and therefore the adequacy of control of withdrawal symptoms. NRT is often under dosed to control ongoing symptoms,[28] and needs to be adjusted until relief is obtained, providing an additional barrier to effectiveness during the transition out of the hospital. Because most smokers with COPD are highly addicted to nicotine,[29] high‐dose NRT, combination therapy, or varenicline would be necessary to adequately control symptoms.[30] However, a significant minority of patients received short‐acting NRT alone.
Despite a high observed efficacy in recent trials,[31, 32] few subjects in our study received varenicline. This may be related to both secular trends and administrative barriers to the use of varenicline in the VA system. Use of this medication was limited among patients with psychiatric disorders due to safety concerns. These concerns have since been largely disproven, but may have limited access to this medication.[33, 34, 35] Although we adjusted for a history of mental illness, patients who received varenicline may have had more past quit attempts and less active mental illness, which may be associated with improved cessation rates. Despite the high prevalence of mental illness we observed, this is typical of the population of smokers, with studies indicating nearly one‐third of smokers overall suffer from mental illness.[36]
Although the majority of our patients received a brief, nurse‐based counseling intervention, there is considerable concern about the overall effectiveness of a single predischarge interaction to produce sustained smoking cessation among highly addicted smokers.[37, 38, 39, 40] The Joint Commission has recently restructured the requirements for smoking cessation treatment for hospitalized patients, and it is now up to hospitals to implement treatment mechanisms that not only meet the national requirements, but also provide a meaningful clinical effect. Though the optimum treatment for hospitalized smokers with COPD is unknown, previous positive studies of smoking cessation among hospitalized patients underscore the need for a higher‐intensity counseling intervention that begins during hospitalization and continues after discharge.[13, 41] Cessation counseling services including tobacco cessation groups and quit lines are available through the VA; however, the use of these services is typically low and requires the patient to enroll independently after discharge, an additional barrier. The lack of association between medications and smoking cessation found in our study could reflect poor effectiveness of medications in the absence of a systematic counseling intervention. Alternatively, the association may be explained that patients who were more highly addicted and perhaps less motivated to quit received tobacco cessation medications more often, but were also less likely to stop tobacco use, a form of indication bias.
Our study has several limitations. We do not have addiction or motivation levels for a cessation attempt, a potential unmeasured confounder. Although predictive of quit attempts, motivation factors are less predictive of cessation maintenance, and may therefore have an unclear effect on our outcome.[42, 43] Our outcome was gathered as part of routine clinical care, which may have introduced bias if patients over‐reported cessation because of social desirability. In healthcare settings, however, this form of assessing smoking status is generally valid.[44] Exposure to counseling or medications obtained outside of the VA system would not have been captured. Given the financial incentive, we believe it is unlikely that many patients admitted to a VA medical center obtained medications elsewhere.[45] The diagnosis of COPD was made administratively. However, all subjects were admitted for an exacerbation, which is associated with more severe COPD by Global Initiative for Obstructive Lung Disease (GOLD) stage.[46] Patients with more severe COPD are often excluded from studies of smoking cessation due to concerns of high dropout and lower prevalence of smoking among patients with GOLD stage IV disease,[47, 48] making this a strength of our study. Subjects who died may have quit only in extremis, or failed to document their quit attempts. However, our sensitivity analysis limited to survivors did not change the study results. There may have been some misclassification in the use of buproprion, which may also be prescribed as an antidepressant. Finally, although representative of the veterans who seek care within the VISN‐20, our patients were primarily white and male, limiting the ability to generalize outside of this group.
Our study had several strengths. We examined a large cohort of patients admitted to a complete care organization, including patients from a diverse group of VA settings comprising academically and nonacademically affiliated centers. We performed an unbiased collection of patients, including all smokers discharged for COPD. We had access to excellent completeness of medications prescribed and filled as collected within the VA system, enabling us to observe medications dispensed and prescribed at several time points. We also had near complete ascertainment of outcomes including by using natural language processing with manual confirmation of smoking status.
In summary, we found that provision of medications to treat ongoing tobacco use among patients discharged for COPD was low, and receipt of medications was not associated with a reduction in smoking tobacco at 6 to 12 months postdischarge. However, among those treated, varenicline appears to be superior to the nicotine patch, with short‐acting nicotine replacement potentially less effective, a biologically plausible finding. The motivation to quit smoking changes rapidly over time. Providing these medications in the hospital and during the time after discharge is a potential means to improve quit rates, but medications need to be paired with counseling to be most effective. Collectively, these data suggest that systems‐based interventions are needed to increase the availability of intense counseling and the use of tailored pharmacotherapy to these patients.
Acknowledgements
The authors acknowledge Mr. Robert Plumley, who performed the data extraction and natural language processing necessary to complete this project.
Disclosures: Dr. Melzer conceived of the research question and performed background reading, analyses, primary drafting, and final revision of the manuscript. Drs. Collins and Feemster participated in finalizing the research question, developing the cohort, performing data collection, and revising the manuscript. Dr. Au provided the database for analysis, helped finalize the research question, and assisted in interpretation of the data and revision of the manuscript. Dr. Au has personally reviewed the data, understands the statistical methods employed, and confirms an understanding of this analysis, that the methods are clearly described, and that they are a fair way to report the results. This material is based upon work supported in part by the Department of Veterans Affairs, Veterans Health Administration, Office of Research and Development, who provided access to data, office space, and programming and data management. The views expressed in this article are those of the authors and do not necessarily reflect the position or policy of the Department of Veterans Affairs, the United States government, or the National Institutes of Health. Dr. Au is an unpaid research consultant for Analysis Group. None of the other authors have any conflicts of interest to disclose. Dr. Melzer is supported by an institutional F‐32 (HL007287‐36) through the University of Washington Department of Pulmonary and Critical Care. Dr. Feemster is supported by an National Institutes of Health, National Heart, Lung, and Blood Institute, K23 Mentored Career Development Award (HL111116). Partial support of this project was provided by Gilead Sciences with research funding to the Seattle Institute for Biomedical and Clinical Research. Additional support was received through the VA Health Services Research and Development. A portion of this work was presented in abstract form at the American Thoracic Society International Meeting, May 2015, in Denver, Colorado.
- , , , , , . Patients hospitalized for COPD have a high prevalence of modifiable risk factors for exacerbation (EFRAM study). Eur Respir J. 2000;16(6):1037–1042.
- , , , et al. Analysis of hospitalizations for COPD exacerbation: opportunities for improving care. COPD. 2010;7(2):85–92.
- , , , . Mortality in COPD: role of comorbidities. Eur Respir J. 2006;28(6):1245–1257.
- , , , . Cardiovascular comorbidity in COPD: systematic literature review. Chest. 2013;144(4):1163–1178.
- . Engaging patients and clinicians in treating tobacco addiction. JAMA Intern Med. 2014;174(8):1299–1300.
- , . Smokers who are hospitalized: a window of opportunity for cessation interventions. Prev Med. 1992;21(2):262–269.
- , , , . Interventions for smoking cessation in hospitalised patients. Cochrane Database Syst Rev. 2012;5:CD001837.
- Specifications Manual for National Hospital Inpatient Quality Measures. Available at: http://www.jointcommission.org/specifications_manual_for_national_hospital_inpatient_quality_measures.aspx. Accessed January 15, 2015.
- Treating Tobacco Use and Dependence. April 2013. Agency for Healthcare Research and Quality, Rockford, MD. Available at: http://www.ahrq.gov/professionals/clinicians‐providers/guidelines‐recommendations/tobacco/clinicians/update/index.html. Accessed January 15, 2015.
- , , , . Smoking cessation advice rates in US hospitals. Arch Intern Med. 2011;171(18):1682–1684.
- , , , et al. Validating smoking data from the Veteran's Affairs Health Factors dataset, an electronic data source. Nicotine Tob Res. 2011;13(12):1233–1239.
- , , , et al. Do u smoke after txt? Results of a randomised trial of smoking cessation using mobile phone text messaging. Tob Control. 2005;14(4):255–261.
- , , , . The effectiveness of smoking cessation groups offered to hospitalised patients with symptoms of exacerbations of chronic obstructive pulmonary disease (COPD). Clin Respir J. 2008;2(3):158–165.
- , , , et al. Sustained care intervention and postdischarge smoking cessation among hospitalized adults: a randomized clinical trial. JAMA. 2014;312(7):719–728.
- , , , et al. Bupropion for smokers hospitalized with acute cardiovascular disease. Am J Med. 2006;119(12):1080–1087.
- , , . Adapting a clinical comorbidity index for use with ICD‐9‐CM administrative databases. J Clin Epidemiol. 1992;45(6):613–619.
- . Multiple Imputation for Nonresponse in Surveys. New York, NY: Wiley; 1987.
- , , , et al. Methods for constructing and assessing propensity scores. Health Serv Res. 2014;49(5):1701–1720.
- , , . Mortality and mortality‐related factors after hospitalization for acute exacerbation of COPD. Chest. 2003;124(2):459–467.
- , , , et al. Mortality after hospitalization for COPD. Chest. 2002;121(5):1441–1448.
- , , , , , . State quitlines and cessation patterns among adults with selected chronic diseases in 15 states, 2005–2008. Prev Chronic Dis. 2012;9(10):120105.
- , , . The effects of counseling on smoking cessation among patients hospitalized with chronic obstructive pulmonary disease: a randomized clinical trial. Int J Addict. 1991;26(1):107–119.
- , , , et al. Predictors of smoking cessation after a myocardial infarction: the role of institutional smoking cessation programs in improving success. Arch Intern Med. 2008;168(18):1961–1967.
- , , , , , . Post‐myocardial infarction smoking cessation counseling: associations with immediate and late mortality in older Medicare patients. Am J Med. 2005;118(3):269–275.
- , , , . Smoking cessation after acute myocardial infarction: effects of a nurse‐‐managed intervention. Ann Intern Med. 1990;113(2):118–123.
- , , , et al. Smoking care provision in hospitals: a review of prevalence. Nicotine Tob Res. 2008;10(5):757–774.
- , , , . Intentions to quit smoking change over short periods of time. Addict Behav. 2005;30(4):653–662.
- , , , , . Association of amount and duration of NRT use in smokers with cigarette consumption and motivation to stop smoking: a national survey of smokers in England. Addict Behav. 2015;40(0):33–38.
- , . Smoking prevalence, behaviours, and cessation among individuals with COPD or asthma. Respir Med. 2011;105(3):477–484.
- , , , et al. American College of Chest Physicians. Tobacco Dependence Treatment ToolKit. 3rd ed. Available at: http://tobaccodependence.chestnet.org. Accessed January 29, 2015.
- , , , , , . Effects of varenicline on smoking cessation in patients with mild to moderate COPD: a randomized controlled trial. Chest. 2011;139(3):591–599.
- , , , et al. Varenicline versus transdermal nicotine patch for smoking cessation: results from a randomised open‐label trial. Thorax. 2008;63(8):717–724.
- , , , , . Psychiatric adverse events in randomized, double‐blind, placebo‐controlled clinical trials of varenicline. Drug Saf. 2010;33(4):289–301.
- . Studies linking smoking‐cessation drug with suicide risk spark concerns. JAMA. 2009;301(10):1007–1008.
- , , , et al. A randomized, double‐blind, placebo‐controlled study evaluating the safety and efficacy of varenicline for smoking cessation in patients with schizophrenia or schizoaffective disorder. J Clin Psychiatry. 2012;73(5):654–660.
- , , . Smoking and mental illness: results from population surveys in Australia and the United States. BMC Public Health. 2009;9(1):285.
- , , , . Implementation and effectiveness of a brief smoking‐cessation intervention for hospital patients. Med Care. 2000;38(5):451–459.
- , , , et al. Clinical trial comparing nicotine replacement therapy (NRT) plus brief counselling, brief counselling alone, and minimal intervention on smoking cessation in hospital inpatients. Thorax. 2003;58(6):484–488.
- , , , et al. Dissociation between hospital performance of the smoking cessation counseling quality metric and cessation outcomes after myocardial infarction. Arch Intern Med. 2008;168(19):2111–2117.
- , , , , . Smoking cessation in hospitalized patients: Results of a randomized trial. Arch Intern Med. 1997;157(4):409–415.
- , , , , . Intensive smoking cessation counseling versus minimal counseling among hospitalized smokers treated with transdermal nicotine replacement: a randomized trial. Am J Med. 2003;114(7):555–562.
- , , , et al. Motivational factors predict quit attempts but not maintenance of smoking cessation: findings from the International Tobacco Control Four country project. Nicotine Tob Res. 2010;12(suppl):S4–S11.
- , , , , . Predictors of attempts to stop smoking and their success in adult general population samples: a systematic review. Addiction. 2011;106(12):2110–2121.
- , , , et al. Validity of self‐reported smoking status among participants in a lung cancer screening trial. Cancer Epidemiol Biomarkers Prev. 2006;15(10):1825–1828.
- , , , . VHA enrollees' health care coverage and use of care. Med Care Res Rev. 2003;60(2):253–67.
- , , , , . Association between lung function and exacerbation frequency in patients with COPD. Int J Chron Obstruct Pulmon Dis. 2010;5:435–444.
- , , , et al. Smoking cessation in patients with chronic obstructive pulmonary disease: a double‐blind, placebo‐controlled, randomised trial. Lancet. 2001;357(9268):1571–1575.
- , , . Nurse‐conducted smoking cessation in patients with COPD using nicotine sublingual tablets and behavioral support. Chest. 2006;130(2):334–342.
© 2015 Society of Hospital Medicine
