User login
Oncologists’ income and net worth rise despite pandemic
Overall, oncologists’ average annual income rose from $377,000 in 2020 to $403,000 this year.
Although many offices closed for periods during 2020, some physicians used the Paycheck Protection Program. Others found other methods to keep their earnings relatively stable, such as switching to telehealth, cutting staff, and renegotiating leases.
The overall net worth of oncologists also increased. This year, 55% reported a net worth of $1.5 million, compared to 42% last year. A contributing factor is the rise in home prices, suggested Joel Greenwald, MD, CFP, a wealth management advisor for physicians.
The rise in the stock market also played a role, he noted. “And I’ve seen clients accumulate cash, which has added to their net worth. They cut back on spending because they were worried about big declines in income and also because there was simply less to spend money on.”
The percentage of oncologists (16%) with a net worth of more than $5 million stayed pretty much the same. Oncology remained in the upper half of the list of wealthy specialties. Topping that list are dermatology (28%), orthopedics and orthopedic surgery (25%), and plastic surgery (24%).
On the flip side, the percentage of oncologists on the lower end of the net worth scale declined from last year. Oncology was the specialty with the lowest percentage of practitioners (16%) reporting a net worth of under $500,000.
Expenses and debts
Similar to reports from previous years, this latest survey found that more than half of oncologists (56%) said they are paying off a mortgage on a primary residence. About a third (32%) are paying off a car loan. Credit card debt (19%), college or medical school loans (17%), childcare (14%), and medical expenses for themselves or a loved one (12%) were also reported.
When it comes to paying off school loans, oncology was near the bottom of the list of 29 medical specialties, along with nephrology, gastroenterology, and diabetes and endocrinology. Emergency medicine topped that list, followed by family medicine, pediatrics, physical medicine, and rehabilitation (all 31%).
Although the vast majority of oncologists (94%) were able to keep up with their bills, the pandemic did take a toll on some. Six percent said that they were unable to keep up with their bills, and 3% could not meet their mortgage. This is far superior to the American population at large – a quarter of adults missed a mortgage payment or rent payment because of challenges associated with the pandemic.
Saving and losses
Most oncologists did not take any extra steps to curtail spending – 77% reported that they had not done anything to reduce major expenses. About a quarter of respondents took significant steps to lower their expenses, such as deferring or refinancing loans (11%), switching to a different type of car (6%), or moving to a different home (5%).
Savings for tax deferred accounts this year was a mixed bag. More than half (56%) of oncologists said that they put aside the same amount every month, give or take; 11% do not regularly put money into a 401(k) retirement account or tax-deferred savings account. Compared to last year, 32% put less money into their savings accounts. Having fewer patients or working fewer hours during the pandemic may have resulted in oncologists needing more of their income, or even their full income, to pay their bills.
Similar results were seen with taxable savings. Half of oncologists were putting the same amount into bank accounts; 20% reported that they do not regularly put money into this type of account. Compared to last year, 29% put less money into taxable savings.
Most oncologists (75%) reported that they did not experience any significant financial losses during the past year. This was similar to last year (77%). The percentage of those who had losses related to their practice rose from 3% to 8%. Much of this increase was due to COVID-19.
Living within their means
The vast majority of oncologists live within or below their means (94%). “There are certainly folks who believe that as long as they pay their credit card every month and contribute to their 401(k) enough to get their employer match, they’re doing okay,” said Dr. Greenwald. “I would say living within one’s means is having a 3 to 6 months’ emergency fund and saving at least 20% of gross income toward retirement.”
Although most oncologists live within their means, they also have a higher than average number of credit cards. More than half (54%) have at least five; the average American has four. Nineteen percent of oncologists reported having seven or more credit cards, and none said they had no credit cards.
Mortgage payments varied considerably among respondents, from less than $100,000 (16%) to more than half a million (21%). More than a third (37%) reported having no mortgage at all. According to the Mortgage Bankers Association, the overall average size of a home mortgage loan was $344,556 in March 2020.
For household finances, 57% reported that they pool incomes to pay the bills, regardless of how much each person earns. A quarter said that they do not have joint finances with a spouse or partner, and for 13%, the person with the higher income paid a larger share.
A version of this article first appeared on Medscape.com.
Health care workers eager for COVID booster shots
As COVID vaccine boosters move closer to reality, most physicians and nurses are ready and willing to get another shot in the arm, according to a new Medscape survey.
Altogether, 93% of physicians and 87% of nurses/advanced practice nurses (APNs) said they wanted to get a booster, although the timing of when they wanted the shots differed somewhat between the two groups surveyed Aug. 4-15.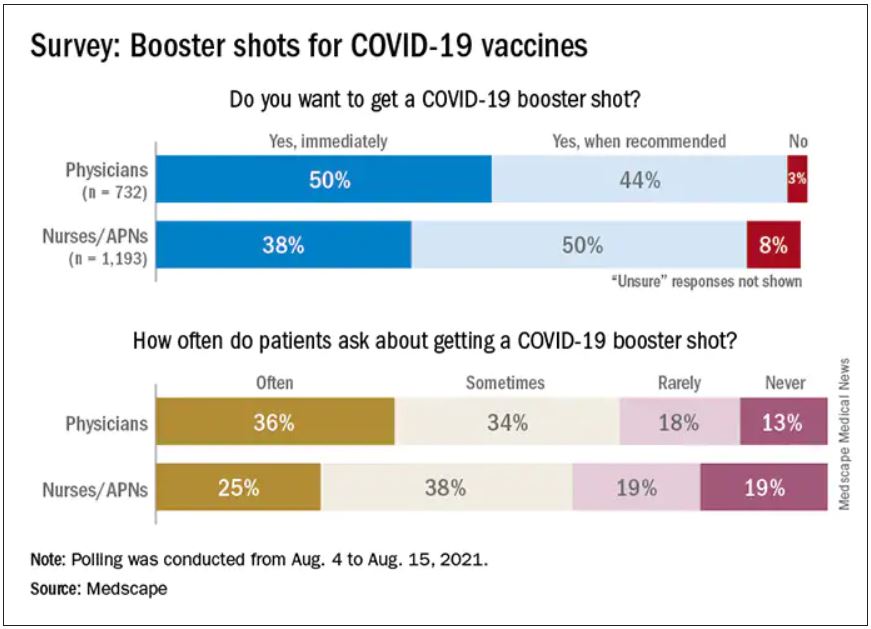
Among the 732 physicians polled, 50% wanted to get their shot immediately, compared with 38% of the 1,193 nurses/APNs who responded, while 44% of physicians and 50% of nurses/APNs said that they would wait until the vaccine booster was authorized and recommended.
At this point in time, almost all of the health care workers surveyed – 98% of physicians and 94% of nurses/APNs – have been fully vaccinated against COVID-19. A small proportion of each group, however, received the Johnson & Johnson vaccine (1% of physicians and 3% of nurses) and are not included in the current plan for booster shots.
The Medscape survey sample did include one group that is already eligible for a third dose: About 20% of physicians and 26% of nurses/ANPs said they have a condition or take a medication that compromises their immune system.
Respondents’ experiences with patient requests for boosters suggest a somewhat lower level of interest. About two-thirds of the health care workers (69% of physicians and 63% of nurses) said that patients frequently or sometimes asked about COVID boosters, compared with 13% (physicians) and 19% (nurses) who said their patients had never asked.
Interest lower among general population
In a separate survey conducted by WebMD, 82% of those who have been at least partially vaccinated said they want to get a COVID vaccine booster (14% immediately and 68% after authorization and recommendation). Of the remaining vaccinees, 7% said they do not want to get a booster and 11% were unsure.
The full sample of 592 respondents surveyed Aug. 5-10, however, included 19% who do not plan to get vaccinated and 6% who are planning to be vaccinated but have not yet done so.
The proportion of immunocompromised individuals in the two survey groups was similar, with about 25% of those in the WebMD survey reporting they have a condition or take a medication that compromises their immune system. Those respondents were more than twice as likely to want to get a booster immediately, compared to those with an uncompromised immune system (24% vs. 11%).
The distribution of vaccines received by brand was also comparable between the two groups surveyed. Of health care workers and readers, over half of each group received the Pfizer/BioNTech vaccine (59% vs. 54%), followed by Moderna (38% vs. 40%) and Johnson & Johnson (3% vs. 5%).
A version of this article first appeared on Medscape.com.
Business Education in Dermatology Residency: A Survey of Program Directors
Globally, the United States has the highest per-capita cost of health care; total costs are expected to account for approximately 20% of the nation’s gross domestic product by 2025.1 These rising costs have prompted residency programs and medical schools to incorporate business education into their curricula.2-5 Although medical training is demanding—with little room to add curricular components—these business-focused curricula have consistently received positive feedback from residents.5,6
In dermatology, more than 50% of residents opt to join a private practice upon graduation.7 In the United States, there also is an upward trend of practice acquisition and consolidation by private equity firms. Therefore, dermatology trainees are uniquely positioned to benefit from business education to make well-informed decisions about joining or starting a practice.Furthermore, whether in a private or academic setting, knowledge of foundational economics, business strategy, finance, marketing, and health care policy can equip dermatologists to more effectively advocate for local and national policies that benefit their patient population.7
We conducted a survey of dermatology program directors (PDs) to determine the availability of and perceptions regarding business education during residency training.
Materials and Methods
Institutional review board (Vanderbilt University Medical Center, Nashville, Tennessee) approval was obtained. The survey was distributed weekly during a 5-week period from July 2020 to August 2020 through the Research Electronic Data Capture survey application (www.project-redcap.org). Program director email addresses were obtained through the Accreditation Council for Graduate Medical Education (ACGME) program list. A PD was included in the survey if they were employed by an accredited US osteopathic or allopathic program and their email address was provided in the ACGME program list or on their program’s faculty web page; a PD was excluded if an email address was not provided in the ACGME program list or on their program’s faculty web page.
The 8-part questionnaire was designed to assess the following characteristics: details about the respondent’s residency program (institutional affiliation, number of residents), the respondent’s professional background (number of years as a PD, business training experience), resources for business education provided by the program, the respondent’s opinion about business education for residents, and the respondent’s perception of the most important topics to include in a dermatology curriculum’s business education component, which included economics/finance, health care policy/government, management, marketing, negotiation, private equity involvement in health care, business strategy, supply chain/operations, and technology/product development. Responses were kept anonymous. Categorical and continuous variables were analyzed with medians and proportions.
Results
Of the 139 surveys distributed, 35 were completed and returned (response rate, 25.2%). Most programs were university-affiliated (71.4%) or community-affiliated (22.9%). The median number of residents was 12. The respondents had a median of 5 years’ experience in their role. Most respondents (65.7%) had no business training, although 20.0% had completed undergraduate business coursework, and 8.6% had attended formal seminars on business topics; 5.7% were self-taught on business topics.
Business Education Availability
Approximately half (51.4%) of programs offered business training to residents, primarily through seminars or lectures (94.4%) and take-home modules (16.7%). None of the programs offered a formal gap year during which residents could pursue a professional business degree. Most respondents thought business education during residency was important (82.8%) and that programs should implement more training (57.1%). When asked whether residents were competent to handle business aspects of dermatology upon graduation, most respondents disagreed somewhat (22.9%) or were neutral (40.0%).
Topics for Business Education
The most important topics identified for inclusion in a business curriculum were economics or finance (68.6%), management (68.6%), and health care policy or government (57.1%). Other identified topics included negotiation (40.0%), private equity involvement in health care (40.0%), strategy (11.4%), supply chain or operations (11.4%), marketing (2.9%), and technology (2.9%).
Comment
Residency programs and medical schools in the United States have started to integrate formal business training into their curricula; however, the state of business training in dermatology has not been characterized. Overall, this survey revealed largely positive perceptions about business education and identified a demand for more resources.
Whereas most PDs identified business education as important, only one half (51.4%) of the representative programs offered structured training. Notably, most PDs did not agree that graduating residents were competent to handle the business demands of dermatology practice. These responses highlight a gap in the demand and resources available for business training.
Identifying Curricular Resources
During an already demanding residency, additional curricular components need to be beneficial and worthwhile. To avoid significant disruption, business training could take place in the form of online lectures or take-home modules. Most programs represented in the survey responses had an academic affiliation and therefore commonly have access to an affiliated graduate business school and/or hospital administrators who have clinical and business training.
Community dermatologists who own or run their own practice also are uniquely positioned to provide residents with practical, dermatology-specific business education. Programs can utilize their institutional and local colleagues to aid in curricular design and implementation. In addition, a potential long-term solution to obtaining resources for business education is to coordinate with a national dermatology organization to create standardized modules that are available to all residency programs.
Key Curriculum Topics
Our survey identified the most important topics to include in a business curriculum for dermatology residents. Economics and finance, management, and health care policy would be valuable to a trainee regardless of whether they ultimately choose a career in academia or private practice. A thorough understanding of complex health care policy reinforces knowledge about insurance and regional and national regulations, which could ultimately benefit patient care. As an example, the American Academy of Dermatology outlines several advocacy priorities such as Medicare reimbursement policies, access to dermatologic care through public and private insurance, medication access and pricing, and preservation of private practice in the setting of market consolidation. Having a better understanding of health care policy and business could better equip dermatologists to lead these often business-driven advocacy efforts to ultimately improve patient care and advance the specialty.8
Limitations
There were notable limitations to this survey, primarily related to its design. With a 25% response rate, there was the potential for response and selection biases; therefore, these results might not be generalizable to all programs. In addition, views held by PDs might not be consistent with those of other members of the dermatology community; for example, surveying residents, other faculty members, and dermatologists in private practice would have provided a more comprehensive characterization of the topic.
Conclusion
This study assessed residency program directors’ perceptions of business education in dermatology training. There appears to be an imbalance between the perceived importance of such education and the resources that are available to provide it. More attention is needed to address this gap to ensure that dermatologists are prepared to manage a rapidly changing health care environment. Results of this survey should encourage efforts to establish (1) a standardized, dermatology-specific business curriculum and (2) a plan to make that curriculum accessible to trainees and other members of the dermatology community.
- Branning G, Vater M. Healthcare spending: plenty of blame to go around. Am Health Drug Benefits. 2016;9:445-447.
- Bayard M, Peeples CR, Holt J, et al. An interactive approach to teaching practice management to family practice residents. Fam Med. 2003;35:622-624.
- Chan S. Management education during radiology residency: development of an educational practice. Acad Radiol. 2004;11:1308-1317.
- Ninan D, Patel D. Career and leadership education in anesthesia residency training. Cureus. 2018;10:e2546.
- Yu-Chin R. Teaching administration and management within psychiatric residency training. Acad Psychiatry. 2002;26:245-252.
- Winkelman JW, Brugnara C. Management training for pathology residents. II. experience with a focused curriculum. Am J Clin Pathol. 1994;101:564-568.
- Tan S, Seiger K, Renehan P, et al. Trends in private equity acquisition of dermatology practices in the United States. JAMA Dermatol. 2019;155:1013-1021.
- Academy advocacy priorities. American Academy of Dermatology website. Accessed August 11, 2021. www.aad.org/member/advocacy/priorities
Globally, the United States has the highest per-capita cost of health care; total costs are expected to account for approximately 20% of the nation’s gross domestic product by 2025.1 These rising costs have prompted residency programs and medical schools to incorporate business education into their curricula.2-5 Although medical training is demanding—with little room to add curricular components—these business-focused curricula have consistently received positive feedback from residents.5,6
In dermatology, more than 50% of residents opt to join a private practice upon graduation.7 In the United States, there also is an upward trend of practice acquisition and consolidation by private equity firms. Therefore, dermatology trainees are uniquely positioned to benefit from business education to make well-informed decisions about joining or starting a practice.Furthermore, whether in a private or academic setting, knowledge of foundational economics, business strategy, finance, marketing, and health care policy can equip dermatologists to more effectively advocate for local and national policies that benefit their patient population.7
We conducted a survey of dermatology program directors (PDs) to determine the availability of and perceptions regarding business education during residency training.
Materials and Methods
Institutional review board (Vanderbilt University Medical Center, Nashville, Tennessee) approval was obtained. The survey was distributed weekly during a 5-week period from July 2020 to August 2020 through the Research Electronic Data Capture survey application (www.project-redcap.org). Program director email addresses were obtained through the Accreditation Council for Graduate Medical Education (ACGME) program list. A PD was included in the survey if they were employed by an accredited US osteopathic or allopathic program and their email address was provided in the ACGME program list or on their program’s faculty web page; a PD was excluded if an email address was not provided in the ACGME program list or on their program’s faculty web page.
The 8-part questionnaire was designed to assess the following characteristics: details about the respondent’s residency program (institutional affiliation, number of residents), the respondent’s professional background (number of years as a PD, business training experience), resources for business education provided by the program, the respondent’s opinion about business education for residents, and the respondent’s perception of the most important topics to include in a dermatology curriculum’s business education component, which included economics/finance, health care policy/government, management, marketing, negotiation, private equity involvement in health care, business strategy, supply chain/operations, and technology/product development. Responses were kept anonymous. Categorical and continuous variables were analyzed with medians and proportions.
Results
Of the 139 surveys distributed, 35 were completed and returned (response rate, 25.2%). Most programs were university-affiliated (71.4%) or community-affiliated (22.9%). The median number of residents was 12. The respondents had a median of 5 years’ experience in their role. Most respondents (65.7%) had no business training, although 20.0% had completed undergraduate business coursework, and 8.6% had attended formal seminars on business topics; 5.7% were self-taught on business topics.
Business Education Availability
Approximately half (51.4%) of programs offered business training to residents, primarily through seminars or lectures (94.4%) and take-home modules (16.7%). None of the programs offered a formal gap year during which residents could pursue a professional business degree. Most respondents thought business education during residency was important (82.8%) and that programs should implement more training (57.1%). When asked whether residents were competent to handle business aspects of dermatology upon graduation, most respondents disagreed somewhat (22.9%) or were neutral (40.0%).
Topics for Business Education
The most important topics identified for inclusion in a business curriculum were economics or finance (68.6%), management (68.6%), and health care policy or government (57.1%). Other identified topics included negotiation (40.0%), private equity involvement in health care (40.0%), strategy (11.4%), supply chain or operations (11.4%), marketing (2.9%), and technology (2.9%).
Comment
Residency programs and medical schools in the United States have started to integrate formal business training into their curricula; however, the state of business training in dermatology has not been characterized. Overall, this survey revealed largely positive perceptions about business education and identified a demand for more resources.
Whereas most PDs identified business education as important, only one half (51.4%) of the representative programs offered structured training. Notably, most PDs did not agree that graduating residents were competent to handle the business demands of dermatology practice. These responses highlight a gap in the demand and resources available for business training.
Identifying Curricular Resources
During an already demanding residency, additional curricular components need to be beneficial and worthwhile. To avoid significant disruption, business training could take place in the form of online lectures or take-home modules. Most programs represented in the survey responses had an academic affiliation and therefore commonly have access to an affiliated graduate business school and/or hospital administrators who have clinical and business training.
Community dermatologists who own or run their own practice also are uniquely positioned to provide residents with practical, dermatology-specific business education. Programs can utilize their institutional and local colleagues to aid in curricular design and implementation. In addition, a potential long-term solution to obtaining resources for business education is to coordinate with a national dermatology organization to create standardized modules that are available to all residency programs.
Key Curriculum Topics
Our survey identified the most important topics to include in a business curriculum for dermatology residents. Economics and finance, management, and health care policy would be valuable to a trainee regardless of whether they ultimately choose a career in academia or private practice. A thorough understanding of complex health care policy reinforces knowledge about insurance and regional and national regulations, which could ultimately benefit patient care. As an example, the American Academy of Dermatology outlines several advocacy priorities such as Medicare reimbursement policies, access to dermatologic care through public and private insurance, medication access and pricing, and preservation of private practice in the setting of market consolidation. Having a better understanding of health care policy and business could better equip dermatologists to lead these often business-driven advocacy efforts to ultimately improve patient care and advance the specialty.8
Limitations
There were notable limitations to this survey, primarily related to its design. With a 25% response rate, there was the potential for response and selection biases; therefore, these results might not be generalizable to all programs. In addition, views held by PDs might not be consistent with those of other members of the dermatology community; for example, surveying residents, other faculty members, and dermatologists in private practice would have provided a more comprehensive characterization of the topic.
Conclusion
This study assessed residency program directors’ perceptions of business education in dermatology training. There appears to be an imbalance between the perceived importance of such education and the resources that are available to provide it. More attention is needed to address this gap to ensure that dermatologists are prepared to manage a rapidly changing health care environment. Results of this survey should encourage efforts to establish (1) a standardized, dermatology-specific business curriculum and (2) a plan to make that curriculum accessible to trainees and other members of the dermatology community.
- Branning G, Vater M. Healthcare spending: plenty of blame to go around. Am Health Drug Benefits. 2016;9:445-447.
- Bayard M, Peeples CR, Holt J, et al. An interactive approach to teaching practice management to family practice residents. Fam Med. 2003;35:622-624.
- Chan S. Management education during radiology residency: development of an educational practice. Acad Radiol. 2004;11:1308-1317.
- Ninan D, Patel D. Career and leadership education in anesthesia residency training. Cureus. 2018;10:e2546.
- Yu-Chin R. Teaching administration and management within psychiatric residency training. Acad Psychiatry. 2002;26:245-252.
- Winkelman JW, Brugnara C. Management training for pathology residents. II. experience with a focused curriculum. Am J Clin Pathol. 1994;101:564-568.
- Tan S, Seiger K, Renehan P, et al. Trends in private equity acquisition of dermatology practices in the United States. JAMA Dermatol. 2019;155:1013-1021.
- Academy advocacy priorities. American Academy of Dermatology website. Accessed August 11, 2021. www.aad.org/member/advocacy/priorities
Practice Points
- In our survey of dermatology program directors, most felt inclusion of business education in residency training was important.
- Approximately half of the dermatology programs that responded to our survey offer business training to their residents.
- Economics and finance, management, and health care policy were the most important topics identified to include in a business curriculum for dermatology residents
Pandemic demand for NPs soars, softens for primary care: Report
The COVID-19 pandemic has fueled a growing demand for nurse practitioners (NPs), while demand for primary care physicians has cooled, according to Merritt Hawkins’ annual review of physician and advanced practitioner recruiting trends.
according to the medical search firm. In the 27 prior years, physicians held the top spot. For the previous 14 years, the No. 1 position was held by family physicians.
“COVID-19 and other market forces are changing the dynamics of physician and advanced practitioner recruiting. NPs are coming into their own in a market that puts a premium on easy access to care and cost containment,” Tom Florence, president of Merritt Hawkins, said in a statement.
Primary care ‘recruiting frenzy’ over
Mr. Florence said primary care physicians remain a “vital part of team-based care and will be increasingly responsible for coordinating the care of older patients with multiple chronic conditions. But the recruiting frenzy in primary care is over.”
Merritt Hawkins says that overall COVID-19 has had a “severely inhibiting” effect on demand for physicians. The number of searches the company conducted dropped 25%, compared with 2020, and many hospitals and medical groups shut down or lost money during the pandemic.
But the drop-off in demand for physicians is likely to be temporary because the underlying dynamics driving physician supply and demand remain in place, according to the report. These include a growing and aging population, a limited supply of newly trained physicians, and an aging physician workforce.
COVID-19 will not permanently change these market conditions, and demand for physicians already is rebounding, the company said.
The 2021 review of physician and advanced practitioner recruiting is based on a representative sample of 2,458 permanent search engagements that Merritt Hawkins/AMN Healthcare’s physician staffing companies conducted or were in the process of conducting during the 12-month period from April 1, 2020, to March 31, 2021.
Among the key findings:
- 18% of Merritt Hawkins’ recruiting searches were for advanced practitioners, including NPs, physician assistants (PAs), and certified registered nurse anesthetists, up from 13% in the 2020 review. This represents the highest percentage in the 28 years the review has been conducted.
- About two-thirds (64%) of Merritt Hawkins’ search engagements were for physician specialists, including radiologists, psychiatrists, gastroenterologists, and others, “highlighting the robust demand for specialty physicians.”
- In 2021, 18% of Merritt Hawkins’ search engagements were for primary care physicians, down from 20% in 2020 and 22% in 2019, “signaling a relative decline in demand for primary care doctors.”
- Psychiatrists placed fourth on the list of most requested search engagements, a sign of continued strong demand for mental health professionals that is likely to accelerate because of COVID-19.
Starting salaries take a pandemic hit
Owing to the reduced demand for practitioners, starting salaries decreased for many types of health care professions, with the exception of NPs and PAs.
Average starting salaries for NPs showed strong growth, increasing 12% year over year, from $125,000 to $140,000. The average starting salaries for PAs also showed strong growth, increasing by 14% year over year, from $112,000 to $128,000.
Among physicians, interventional cardiologists were offered the highest average starting salaries, at $611,000, followed by orthopedic surgeons, at $546,000. Pediatricians were offered the lowest average starting salaries, at $236,000.
Merritt Hawkins said only 3% of their search engagements were for solo practice or partnership settings, “underscoring the decline of physician private practice.”
Roughly two-thirds (67%) of Merritt Hawkins’ search engagements were in communities of 100,000 people or more, indicating that demand for physicians and advanced practitioners is not limited to small or rural communities.
A version of this article first appeared on Medscape.com.
Recent Trends in Diabetes Treatment and Control in US Adults: A Geriatrician’s Point of View
Study Overview
Objective. To update national trends in the treatment and risk factor control of diabetic patients from 1999 through 2018 in the US using data from the National Health and Nutrition Examination Survey (NHANES) with the goal of identifying population subgroups with the highest probability of having untreated risk factors.
Design. The authors conducted a cross-sectional analysis of data from NHANES focusing on adults with diabetes. They examined patient characteristics and medication use over time and estimated the prevalence of risk factor control and medication use. To minimize the effects of a small sample size, the survey years were pooled into 4-year intervals. The variables studied included glycated hemoglobin (HbA1c), blood pressure, serum cholesterol, medication use, sociodemographic characteristics, and weight status. For statistical analysis, logistic and multinomial logistic regression models were used to examine factors associated with treatment in participants who did not achieve targets for glycemic, blood pressure, and lipid control. Temporal trends were estimated using 2-piece linear spline models with 1 knot at inflection points.
Setting and participants. The NHANES program began in the early 1960s to monitor the health of the US population. In 1999, the survey became a continuous program combining interviews and physical examinations. The survey examines a nationally representative sample of about 5000 persons each year. This study included 6653 participants who were nonpregnant, aged older than 20 years, reported a diagnosis of diabetes from a physician, and participated in NHANES from 1999 through 2018.
Main outcome measures. The main outcome measures were temporal trends in risk factor control (glycemic, blood pressure, or lipid levels) and medication use (glucose lowering, blood pressure lowering, or lipid lowering medications), and number as well as class of drug used, from 1999 through 2018 in diabetic adults from the US participating in NHANES.
Results. Sociodemographic characteristics of the studied diabetes population—The age and racial or ethnic distribution of participants with diabetes were stable from 1999 through 2018, whereas participants with a college degree, higher income, health insurance, obesity, or long-standing diabetes increased during the same period.
Trends in diabetes risk factor control—The trends for glycemic, blood pressure, and lipid control were nonlinear, with an inflection point around 2010. Glycemic control was defined as HbA1c less than 7%, blood pressure was considered controlled if less than 140/90 mmHg, and lipid was controlled if non-HDL cholesterol level was less than 130 mg/dL. Although these chosen targets were based on the most recent clinical guidelines, the authors declared that they observed similar trends when alternative targets were used. The level of risk factor control improved in all diabetic patients from 1999 through 2010. However, the percentage of adult diabetic participants for whom glycemic control was achieved declined from 57.4% (95% CI, 52.9-61.8) in 2007-2010 to 50.5% (95% CI, 45.8-55.3) in 2015-2018. Blood pressure control was achieved in 74.2% of participants (95% CI, 70.7-77.4) in 2011-2014 but declined to 70.4% (95% CI, 66.7-73.8) in 2015-2018. Control in lipid levels improved during the entire study period; however, the rate of improvement heavily declined after 2007 with lipid target levels attained in 52.3% of participants (95% CI, 49.2-55.3) in 2007-2014 and 55.7% (95% CI, 50.8-60.5) in 2015-2018. Finally, the percentage of participants in whom targets for all 3 risk factors were simultaneously achieved plateaued after 2010 and was 22.2% (95% CI, 17.9-27.3) in 2015-2018.
Trends in diabetes treatment—The use of glucose lowering drugs increased from 74.1% in 1999-2002 to 82.7% in 2007-2010 and then stabilized. A shift toward a safer glucose lowering treatment choice was observed with a decline in the use of older glucose lowering medications such as sulfonylureas, which increases the risk of hypoglycemia, and an increase in the use of metformin, insulin, and newer agents such as sodium-glucose cotransporter 2 inhibitors.
Similarly, blood pressure lowering medication use rose from 1999-2002 to 2007-2010 and then stabilized, with increased use of first-line recommended treatments including angiotensin-converting enzyme inhibitors or angiotensin-receptor blockers. Likewise, statin use rose from 28.4% in 1999-2002 to 56% in 2011-2014 and then stabilized. The total number of drugs used culminated in 2011-2014 with 60% of participants using more than 5 drugs and then leveled off to 57.2% in 2015-2018. Lastly, health insurance status and race or ethnicity impacted the likelihood of receiving monotherapy or combination drug therapy when targets for glycemic, blood pressure, or lipid control were not achieved.
Conclusion. Despite great progress in the control of diabetes and its associated risk factors between 1999 and 2010, this trend declined for glycemic and blood pressure control and leveled off for lipid control in adult NHANES participants with diabetes after 2010. First-line treatments for diabetes and associated risk factors remain underused, and treatment intensification may not be sufficiently considered in patients with uncontrolled risk factors despite clinical guideline recommendations. The findings of this study may portend a possible population-level increase in diabetes-related illnesses in the years to come.
Commentary
The thorough understanding of trends in management of diseases is critical to inform public health policies and planning. Well designed clinical studies heavily influence the development of public health policies and clinical guidelines, which in turn drive real-world clinical practice. In a recent analysis utilizing data from NHANES, Fang et al1 showed evidence of a general shift toward less intensive treatment of diabetes, hypertension, and hypercholesterolemia in adults living in the US during the last decade.
Similarly, in a separate study using NHANES data collected between 1999 and 2018 published in JAMA just 2 weeks after the current report, Wang et al2 confirms this declining trend in diabetes management with only 21.2% of diabetic adults simultaneously attaining glycemic, blood pressure, and lipid level targets during the same period. What led to the decline in more stringent risk factor and diabetes management since 2010 observed in these studies? One possible explanation, as suggested by Fang et al, is that major clinical trials from the late 2000s—including Action to Control Cardiovascular Risk in Diabetes, UK Prospective Diabetes Study, Action in Diabetes and Vascular Disease: Preterax and Diamicron Modified Release Controlled Evaluation, and Veterans Affairs Diabetes Trial—that assessed the effects of intensive glycemic control (with target HbA1c < 6.5%) found that intensive treatment of diabetes compared to standard care had no cardiovascular benefit albeit increasing the risk of hypoglycemia. Thus, these trial findings may have translated into suboptimal diabetes treatment observed in some NHANES participants. Wang et al propose that effective tailored approaches are needed to improve risk factor control in diabetic patients, such as enhance and maintain adherence to medications and healthy lifestyle behaviors, as well as better access to health care and therapeutic education.
The changes in recent trends in diabetes management have immense clinical implications. The authors of this study suggest a link between the recent relaxation of glycemic targets, as well as risk factor control, and a resurgence of diabetic complications such as lower limb amputation or stroke. Indeed, several recent studies indicate an upward trend or plateau in diabetic complications which had been decreasing in prevalence prior to 2010.3 For example, lower extremity amputation has surged by more than 25% between 2010 and 2015, especially in young and middle-aged adults.4 Among the arguments brought forward that this recent resurgence in amputations is directly linked to worsening glycemic control is the fact that between 2007 and 2010, when glucose levels were best controlled within the previous 30-year period, amputations were also at the lowest levels. Moreover, data from the Centers for Disease Control and Prevention also show a 55% increase in mortality (from 15.7 to 24.2 per 1000) among diabetic patients between 2010 and 2015.14 On the other hand, a growing number of studies show that an increase of inappropriate treatment intensification—reaching HbA1c levels that are way below the recommended targets—is associated with adverse consequences in diabetic patients particularly in those aged more than 65 years.5-7 These seemingly contradictory findings highlight the importance of a personalized and thoughtful approach to the management of diabetes and its risk factors. As an example, an increase in the use of newer and safer glucose lowering drugs (eg, sodium-glucose cotransporter 2 inhibitors, glucagon-like peptide 1 receptor agonists, and dipeptidyl peptidase 4 inhibitors) can help achieve better HbA1c goals with a reduced risk of hypoglycemic episodes as recently shown by a Danish study.8 In this study, the authors concluded that the reduction of the rate of hypoglycemic episodes leading to hospitalization in Denmark was directly linked to the use of these safer and newer glucose lowering drugs.
A discussion on the specifics of trends in diabetes treatment and control must include considerations in older adults aged more than 65 years who constitute more than 40% of the diabetic population. Despite the high prevalence of diabetes in this vulnerable population, such data are still insufficient in the literature and are critically needed to inform public health policies and clinical guidelines. In epidemiological studies focusing on diabetic complications from the last 10 years, concerning increases have been observed in younger9 and middle-aged adults while remaining stable in older adults. However, the risk of hypoglycemia or severe hypoglycemia remains high in older adults living in nursing facilities, even in those with an elevated HbA1c of greater than 8%.7 Moreover, in light of more relaxed HbA1c treatment goals for older frail adults as recommended by international guidelines since 2010,10,11 recent findings from the French GERODIAB cohort show an increased mortality (hazard ratio, 1.76) in type 2 diabetics aged 70 years and older with HbA1c greater than or equal to 8.6%.12 Similarly, a 5-year retrospective British study from 2018 which included patients aged 70 years and older, shows an increased overall mortality in those with HbA1c greater than 8.5%.13 Taken together, further age-stratified analysis utilizing data from large cohort studies including NHANES may help to clarify national trends in diabetes treatment and risk factor control as well as diabetic complications specific to the geriatric population. By being better informed of such trends, clinicians could then develop treatment strategies that minimize complications (eg, hypoglycemia, falls) while achieving favorable outcomes (eg, reduce hyperglycemic emergencies, improve survival) in frail older patients.
Applications for Clinical Practice
The understanding of population-wide trends in diabetes control is critical to planning public health approaches for the prevention and treatment of this disease and its complications. In older adults, the high risk of hypoglycemic events and insufficient epidemiological data on trends of diabetes control hinder diabetes management. Personalized treatment targets taking into account geriatric syndromes and general health status, as well as multidisciplinary management involving endocrinologists, geriatricians, and clinical pharmacists, are necessary to optimize care in older adults with diabetes.
1. Fang M, Wang D, Coresh J, Selvin E. Trends in Diabetes Treatment and Control in U.S. Adults, 1999-2018. N Engl J Med. 2021;384(23):2219-28. doi:10.1056/NEJMsa2032271
2. Wang L, Li X, Wang Z, et al. Trends in Prevalence of Diabetes and Control of Risk Factors in Diabetes Among US Adults, 1999-2018. JAMA. 2021. doi:10.1001/jama.2021.9883
3. Gregg EW, Hora I, Benoit SR. Resurgence in Diabetes-Related Complications. JAMA. 2019;321(19):1867-8. doi:10.1001/jama.2019.3471
4. Caruso P, Scappaticcio L, Maiorino MI, et al. Up and down waves of glycemic control and lower-extremity amputation in diabetes. Cardiovasc Diabetol. 2021;20(1):135. doi:10.1186/s12933-021-01325-3
5. Bongaerts B, Arnold SV, Charbonnel BH, et al. Inappropriate intensification of glucose-lowering treatment in older patients with type 2 diabetes: the global DISCOVER study. BMJ Open Diabetes Res Care. 2021;9(1)e001585. doi:10.1136/bmjdrc-2020-001585
6. Lipska KJ, Ross JS, Wang Y, et al. National trends in US hospital admissions for hyperglycemia and hypoglycemia among Medicare beneficiaries, 1999 to 2011. JAMA Intern Med. 2014;174(7):1116-1124. doi: 10.1001/jamainternmed.2014.1824
7. Bouillet B, Tscherter P, Vaillard L, et al. Frequent and severe hypoglycaemia detected with continuous glucose monitoring in older institutionalised patients with diabetes. Age Ageing. 2021;afab128. doi: 10.1093/ageing/afab128
8. Jensen MH, Hejlesen O, Vestergaard P. Epidemiology of hypoglycaemic episodes leading to hospitalisations in Denmark in 1998-2018. Diabetologia. 2021. doi: 10.1007/s00125-021-05507-2
9. TODAY Study Group, Bjornstad P, Drews KL, et al. Long-Term Complications in Youth-Onset Type 2 Diabetes. N Engl J Med. 2021;385(5):416-426. doi: 10.1056/NEJMoa2100165
10. Sinclair AJ, Paolisso G, Castro M, et al. European Diabetes Working Party for Older People 2011 clinical guidelines for type 2 diabetes mellitus. Executive summary. Diabetes Metab. 2011;37 Suppl 3:S27-S38. doi:10.1016/S1262-3636(11)70962-4
11. Kirkman MS, Briscoe VJ, Clark N, et al. Diabetes in older adults. Diabetes Care. 2012;35(12):2650-2664. doi: 10.2337/dc12-1801
12. Doucet J, Verny C, Balkau B, et al. Haemoglobin A1c and 5-year all-cause mortality in French type 2 diabetic patients aged 70 years and older: The GERODIAB observational cohort. Diabetes Metab. 2018;44(6):465-472. doi: 10.1016/j.diabet.2018.05.003
13. Forbes A, Murrells T, Mulnier H, Sinclair AJ. Mean HbA1c, HbA1c variability, and mortality in people with diabetes aged 70 years and older: a retrospective cohort study. Lancet Diabetes Endocrinol. 2018;6(6):476-486. doi: 10.1016/S2213-8587(18)30048-2
14. US Centers for Disease Control and Prevention. US diabetes surveillance system and diabetes atlas, 2019. https://www.cdc.gov/diabetes/data
Study Overview
Objective. To update national trends in the treatment and risk factor control of diabetic patients from 1999 through 2018 in the US using data from the National Health and Nutrition Examination Survey (NHANES) with the goal of identifying population subgroups with the highest probability of having untreated risk factors.
Design. The authors conducted a cross-sectional analysis of data from NHANES focusing on adults with diabetes. They examined patient characteristics and medication use over time and estimated the prevalence of risk factor control and medication use. To minimize the effects of a small sample size, the survey years were pooled into 4-year intervals. The variables studied included glycated hemoglobin (HbA1c), blood pressure, serum cholesterol, medication use, sociodemographic characteristics, and weight status. For statistical analysis, logistic and multinomial logistic regression models were used to examine factors associated with treatment in participants who did not achieve targets for glycemic, blood pressure, and lipid control. Temporal trends were estimated using 2-piece linear spline models with 1 knot at inflection points.
Setting and participants. The NHANES program began in the early 1960s to monitor the health of the US population. In 1999, the survey became a continuous program combining interviews and physical examinations. The survey examines a nationally representative sample of about 5000 persons each year. This study included 6653 participants who were nonpregnant, aged older than 20 years, reported a diagnosis of diabetes from a physician, and participated in NHANES from 1999 through 2018.
Main outcome measures. The main outcome measures were temporal trends in risk factor control (glycemic, blood pressure, or lipid levels) and medication use (glucose lowering, blood pressure lowering, or lipid lowering medications), and number as well as class of drug used, from 1999 through 2018 in diabetic adults from the US participating in NHANES.
Results. Sociodemographic characteristics of the studied diabetes population—The age and racial or ethnic distribution of participants with diabetes were stable from 1999 through 2018, whereas participants with a college degree, higher income, health insurance, obesity, or long-standing diabetes increased during the same period.
Trends in diabetes risk factor control—The trends for glycemic, blood pressure, and lipid control were nonlinear, with an inflection point around 2010. Glycemic control was defined as HbA1c less than 7%, blood pressure was considered controlled if less than 140/90 mmHg, and lipid was controlled if non-HDL cholesterol level was less than 130 mg/dL. Although these chosen targets were based on the most recent clinical guidelines, the authors declared that they observed similar trends when alternative targets were used. The level of risk factor control improved in all diabetic patients from 1999 through 2010. However, the percentage of adult diabetic participants for whom glycemic control was achieved declined from 57.4% (95% CI, 52.9-61.8) in 2007-2010 to 50.5% (95% CI, 45.8-55.3) in 2015-2018. Blood pressure control was achieved in 74.2% of participants (95% CI, 70.7-77.4) in 2011-2014 but declined to 70.4% (95% CI, 66.7-73.8) in 2015-2018. Control in lipid levels improved during the entire study period; however, the rate of improvement heavily declined after 2007 with lipid target levels attained in 52.3% of participants (95% CI, 49.2-55.3) in 2007-2014 and 55.7% (95% CI, 50.8-60.5) in 2015-2018. Finally, the percentage of participants in whom targets for all 3 risk factors were simultaneously achieved plateaued after 2010 and was 22.2% (95% CI, 17.9-27.3) in 2015-2018.
Trends in diabetes treatment—The use of glucose lowering drugs increased from 74.1% in 1999-2002 to 82.7% in 2007-2010 and then stabilized. A shift toward a safer glucose lowering treatment choice was observed with a decline in the use of older glucose lowering medications such as sulfonylureas, which increases the risk of hypoglycemia, and an increase in the use of metformin, insulin, and newer agents such as sodium-glucose cotransporter 2 inhibitors.
Similarly, blood pressure lowering medication use rose from 1999-2002 to 2007-2010 and then stabilized, with increased use of first-line recommended treatments including angiotensin-converting enzyme inhibitors or angiotensin-receptor blockers. Likewise, statin use rose from 28.4% in 1999-2002 to 56% in 2011-2014 and then stabilized. The total number of drugs used culminated in 2011-2014 with 60% of participants using more than 5 drugs and then leveled off to 57.2% in 2015-2018. Lastly, health insurance status and race or ethnicity impacted the likelihood of receiving monotherapy or combination drug therapy when targets for glycemic, blood pressure, or lipid control were not achieved.
Conclusion. Despite great progress in the control of diabetes and its associated risk factors between 1999 and 2010, this trend declined for glycemic and blood pressure control and leveled off for lipid control in adult NHANES participants with diabetes after 2010. First-line treatments for diabetes and associated risk factors remain underused, and treatment intensification may not be sufficiently considered in patients with uncontrolled risk factors despite clinical guideline recommendations. The findings of this study may portend a possible population-level increase in diabetes-related illnesses in the years to come.
Commentary
The thorough understanding of trends in management of diseases is critical to inform public health policies and planning. Well designed clinical studies heavily influence the development of public health policies and clinical guidelines, which in turn drive real-world clinical practice. In a recent analysis utilizing data from NHANES, Fang et al1 showed evidence of a general shift toward less intensive treatment of diabetes, hypertension, and hypercholesterolemia in adults living in the US during the last decade.
Similarly, in a separate study using NHANES data collected between 1999 and 2018 published in JAMA just 2 weeks after the current report, Wang et al2 confirms this declining trend in diabetes management with only 21.2% of diabetic adults simultaneously attaining glycemic, blood pressure, and lipid level targets during the same period. What led to the decline in more stringent risk factor and diabetes management since 2010 observed in these studies? One possible explanation, as suggested by Fang et al, is that major clinical trials from the late 2000s—including Action to Control Cardiovascular Risk in Diabetes, UK Prospective Diabetes Study, Action in Diabetes and Vascular Disease: Preterax and Diamicron Modified Release Controlled Evaluation, and Veterans Affairs Diabetes Trial—that assessed the effects of intensive glycemic control (with target HbA1c < 6.5%) found that intensive treatment of diabetes compared to standard care had no cardiovascular benefit albeit increasing the risk of hypoglycemia. Thus, these trial findings may have translated into suboptimal diabetes treatment observed in some NHANES participants. Wang et al propose that effective tailored approaches are needed to improve risk factor control in diabetic patients, such as enhance and maintain adherence to medications and healthy lifestyle behaviors, as well as better access to health care and therapeutic education.
The changes in recent trends in diabetes management have immense clinical implications. The authors of this study suggest a link between the recent relaxation of glycemic targets, as well as risk factor control, and a resurgence of diabetic complications such as lower limb amputation or stroke. Indeed, several recent studies indicate an upward trend or plateau in diabetic complications which had been decreasing in prevalence prior to 2010.3 For example, lower extremity amputation has surged by more than 25% between 2010 and 2015, especially in young and middle-aged adults.4 Among the arguments brought forward that this recent resurgence in amputations is directly linked to worsening glycemic control is the fact that between 2007 and 2010, when glucose levels were best controlled within the previous 30-year period, amputations were also at the lowest levels. Moreover, data from the Centers for Disease Control and Prevention also show a 55% increase in mortality (from 15.7 to 24.2 per 1000) among diabetic patients between 2010 and 2015.14 On the other hand, a growing number of studies show that an increase of inappropriate treatment intensification—reaching HbA1c levels that are way below the recommended targets—is associated with adverse consequences in diabetic patients particularly in those aged more than 65 years.5-7 These seemingly contradictory findings highlight the importance of a personalized and thoughtful approach to the management of diabetes and its risk factors. As an example, an increase in the use of newer and safer glucose lowering drugs (eg, sodium-glucose cotransporter 2 inhibitors, glucagon-like peptide 1 receptor agonists, and dipeptidyl peptidase 4 inhibitors) can help achieve better HbA1c goals with a reduced risk of hypoglycemic episodes as recently shown by a Danish study.8 In this study, the authors concluded that the reduction of the rate of hypoglycemic episodes leading to hospitalization in Denmark was directly linked to the use of these safer and newer glucose lowering drugs.
A discussion on the specifics of trends in diabetes treatment and control must include considerations in older adults aged more than 65 years who constitute more than 40% of the diabetic population. Despite the high prevalence of diabetes in this vulnerable population, such data are still insufficient in the literature and are critically needed to inform public health policies and clinical guidelines. In epidemiological studies focusing on diabetic complications from the last 10 years, concerning increases have been observed in younger9 and middle-aged adults while remaining stable in older adults. However, the risk of hypoglycemia or severe hypoglycemia remains high in older adults living in nursing facilities, even in those with an elevated HbA1c of greater than 8%.7 Moreover, in light of more relaxed HbA1c treatment goals for older frail adults as recommended by international guidelines since 2010,10,11 recent findings from the French GERODIAB cohort show an increased mortality (hazard ratio, 1.76) in type 2 diabetics aged 70 years and older with HbA1c greater than or equal to 8.6%.12 Similarly, a 5-year retrospective British study from 2018 which included patients aged 70 years and older, shows an increased overall mortality in those with HbA1c greater than 8.5%.13 Taken together, further age-stratified analysis utilizing data from large cohort studies including NHANES may help to clarify national trends in diabetes treatment and risk factor control as well as diabetic complications specific to the geriatric population. By being better informed of such trends, clinicians could then develop treatment strategies that minimize complications (eg, hypoglycemia, falls) while achieving favorable outcomes (eg, reduce hyperglycemic emergencies, improve survival) in frail older patients.
Applications for Clinical Practice
The understanding of population-wide trends in diabetes control is critical to planning public health approaches for the prevention and treatment of this disease and its complications. In older adults, the high risk of hypoglycemic events and insufficient epidemiological data on trends of diabetes control hinder diabetes management. Personalized treatment targets taking into account geriatric syndromes and general health status, as well as multidisciplinary management involving endocrinologists, geriatricians, and clinical pharmacists, are necessary to optimize care in older adults with diabetes.
1. Fang M, Wang D, Coresh J, Selvin E. Trends in Diabetes Treatment and Control in U.S. Adults, 1999-2018. N Engl J Med. 2021;384(23):2219-28. doi:10.1056/NEJMsa2032271
2. Wang L, Li X, Wang Z, et al. Trends in Prevalence of Diabetes and Control of Risk Factors in Diabetes Among US Adults, 1999-2018. JAMA. 2021. doi:10.1001/jama.2021.9883
3. Gregg EW, Hora I, Benoit SR. Resurgence in Diabetes-Related Complications. JAMA. 2019;321(19):1867-8. doi:10.1001/jama.2019.3471
4. Caruso P, Scappaticcio L, Maiorino MI, et al. Up and down waves of glycemic control and lower-extremity amputation in diabetes. Cardiovasc Diabetol. 2021;20(1):135. doi:10.1186/s12933-021-01325-3
5. Bongaerts B, Arnold SV, Charbonnel BH, et al. Inappropriate intensification of glucose-lowering treatment in older patients with type 2 diabetes: the global DISCOVER study. BMJ Open Diabetes Res Care. 2021;9(1)e001585. doi:10.1136/bmjdrc-2020-001585
6. Lipska KJ, Ross JS, Wang Y, et al. National trends in US hospital admissions for hyperglycemia and hypoglycemia among Medicare beneficiaries, 1999 to 2011. JAMA Intern Med. 2014;174(7):1116-1124. doi: 10.1001/jamainternmed.2014.1824
7. Bouillet B, Tscherter P, Vaillard L, et al. Frequent and severe hypoglycaemia detected with continuous glucose monitoring in older institutionalised patients with diabetes. Age Ageing. 2021;afab128. doi: 10.1093/ageing/afab128
8. Jensen MH, Hejlesen O, Vestergaard P. Epidemiology of hypoglycaemic episodes leading to hospitalisations in Denmark in 1998-2018. Diabetologia. 2021. doi: 10.1007/s00125-021-05507-2
9. TODAY Study Group, Bjornstad P, Drews KL, et al. Long-Term Complications in Youth-Onset Type 2 Diabetes. N Engl J Med. 2021;385(5):416-426. doi: 10.1056/NEJMoa2100165
10. Sinclair AJ, Paolisso G, Castro M, et al. European Diabetes Working Party for Older People 2011 clinical guidelines for type 2 diabetes mellitus. Executive summary. Diabetes Metab. 2011;37 Suppl 3:S27-S38. doi:10.1016/S1262-3636(11)70962-4
11. Kirkman MS, Briscoe VJ, Clark N, et al. Diabetes in older adults. Diabetes Care. 2012;35(12):2650-2664. doi: 10.2337/dc12-1801
12. Doucet J, Verny C, Balkau B, et al. Haemoglobin A1c and 5-year all-cause mortality in French type 2 diabetic patients aged 70 years and older: The GERODIAB observational cohort. Diabetes Metab. 2018;44(6):465-472. doi: 10.1016/j.diabet.2018.05.003
13. Forbes A, Murrells T, Mulnier H, Sinclair AJ. Mean HbA1c, HbA1c variability, and mortality in people with diabetes aged 70 years and older: a retrospective cohort study. Lancet Diabetes Endocrinol. 2018;6(6):476-486. doi: 10.1016/S2213-8587(18)30048-2
14. US Centers for Disease Control and Prevention. US diabetes surveillance system and diabetes atlas, 2019. https://www.cdc.gov/diabetes/data
Why aren’t more women doctors in the top-paying specialties?
Women compose only 6% of orthopedic surgeons, 8% of interventional cardiologists, 10% of urologists, 17% of plastic surgeons, and 18% of otolaryngologists, according to the 2020 Association of American Medical Colleges Physician Specialty Data Report.
Plastic surgeons earn an average of $526,000 annually, which is the highest-paying specialty. Otolaryngologists earn an average of $417,000 annually, and urologists earn $427,000, according to the Medscape Physician Compensation Report 2021: The Recovery Begins.
Yet, far more women are practicing in specialties that pay less. Women are the majority in pediatrics (64%), ob.gyn. (59%), internal medicine (53%), and endocrinology (51%), the AAMC data show. The exception is dermatology, which pays well and in which 51% are women. The annual average pay is $394,000.
Why are so many women avoiding the top-paying specialties?
Several physician researchers and leaders in the top-paying specialties point to four main factors: Women are attracted to specialties that have more women in faculty and leadership positions, women prioritize work-life balance over pay, women residents may be deterred from the high-paying specialties because of gender discrimination and sexual harassment, and the longer training periods for surgical specialties may be a deterrent for women who want to have children.
Lack of women leaders
The specialties with the most women tend to have the highest proportion of women in leadership positions. For example, obstetrics and gynecology had the highest proportion of women department chairs (24.1%) and vice chairs (38.8). Pediatrics had the highest proportion of women division directors (31.5%) and residency program directors (64.6%), a study shows.
Surgical specialties, on the other hand, may have a harder time attracting female residents, possibly because of a lack of women in leadership positions. A recent study that examined gender differences in attitudes toward surgery training found that women would be more likely to go into surgery if there were more surgical faculty and residents of their same gender.
An analysis of orthopedic residency programs shows that more trainees were drawn to programs that had more female faculty members, including associate professors and women in leadership positions.
Terri Malcolm, MD, a board-certified ob.gyn. and CEO/founder of Master Physician Leaders, said women need to consider whether they want to be a trailblazer in a specialty that has fewer women. “What support systems are in place to accommodate your goals, whether it’s career advancement, having a family, or mentorship? Where can you show up as your whole self and be supported in that?”
Being the only woman in a residency program can be a challenge, said Dr. Malcolm. If the residents and attendings are predominantly men, for example, they may not think about creating a call schedule that takes into account maternity leave or the fact that women tend to be caretakers for their children and parents.
The study of gender differences toward surgery training shows that 75% of women, in comparison with 46% of men, would be more willing to enter surgery if maternity leave and childcare were made available to female residents and attending physicians.
Women want work-life balance
Although both men and women want families, women still shoulder more family and childcare responsibilities. That may explain why women physicians ranked work-life balance first and compensation second in the Medscape Women Physicians 2020 Report: The Issues They Care About.
“My physician colleagues have been and are supportive of intellectual abilities, but I feel they don’t fully understand the uneven distribution of childcare issues on women,” a woman dermatologist commented.
Women may want to work fewer hours or have a more flexible schedule to take care of children. “I can count on one hand the number of women who have a part-time job in orthopedics. It’s very rare, and working part time absolutely is a barrier for someone who wants to be a surgeon,” said Julie Samora, MD, PhD, a researcher and pediatric hand surgeon at Nationwide Children’s Hospital, in Columbus, Ohio. She is also a spokesperson for the American Association of Orthopedic Surgeons.
Preeti Malani, MD, a professor of medicine who specializes in infectious diseases at the University of Michigan, chose to work full-time in academia while raising two children with her husband. In a decade, she rose through the ranks to full professor. “I took the advice of a woman who wanted to recruit me to have a full-time position with maximum flexibility rather than work part time, often for more hours and less pay. I also have tried to build my career so I was not doing all clinical work.”
Her husband is a surgeon at the University of Michigan. His schedule was not flexible, and he was unable to take on family responsibilities, said Dr. Malani. “I knew someone had to be able to grab the kids from daycare or pick them up at school if they were sick.” She also took work home and worked weekends.
Young women physicians in particular are thinking about combining parenting with work – in the Medscape report, that issue ranked third among the issues women care about. Seeing other women doctors navigate that in their particular specialty can have a positive impact.
“When I chose adolescent medicine, I remember working with a doctor in this field who talked about how much she enjoyed raising her kids even as teenagers and how much she was enjoying them as young adults. She seemed so balanced and happy in her family, and it gave me a nice feeling about the field,” said Nancy Dodson, MD, MPH, a pediatrician specializing in adolescent medicine at Pediatrics on Hudson in New York.
Rachel Zhuk, MD, a reproductive psychiatrist in New York, took a break after medical school to spend time with her newborn son. She met a woman who was also a young parent and a psychiatrist. “We were both figuring out parenting together – it was like looking into my future.” That friendship and her desire to have more time with patients influenced her decision to pursue psychiatry instead of internal medicine.
Discrimination and harassment influence specialty choice
Women doctors in the top-paying surgical and other specialties have reported experiencing more discrimination and harassment than men.
Of 927 orthopedic surgeons who responded to an AAOS survey, 66% said they experienced gender discrimination, bullying, sexual harassment, or harassment in the health care workplace. More than twice as many women (81%) experienced these behaviors as men (35%).
“This study shows that women in orthopedic surgery disproportionately experience these negative behaviors, and only a handful of institutions in the United States provide any type of training to prevent them,” said Dr. Samora, the lead author of the AAOS report.
Radiology is another male-dominated field – women represent 26% of all radiologists, the 2020 AAMC specialty report shows. A systematic review shows that 40% of women radiologists experienced gender discrimination at work, compared with 1% of men, and that 47% of women experienced sexual harassment.
Female trainees in surgery have also reported disproportionate rates of discrimination and harassment. Female general surgical residents have experienced more gender discrimination than male residents (65.1% vs. 10.0%) and more sexual harassment than male residents (19.9% vs. 3.9), a national survey indicates.
When medical students are exposed to these behaviors through personal experience, witnessing, or hearing about them, it can affect which specialty they choose. A survey of fourth-year medical students shows that far more women than men reported that exposure to gender discrimination and sexual harassment influenced their specialty choices (45.3% vs. 16.4%) and residency rankings (25.3% vs. 10.9%). Women who chose general surgery were the most likely to experience gender discrimination and sexual harassment during residency selection; women who chose psychiatry were the least likely to experience such behaviors, the report shows.
“If young trainees witness such behaviors in a specific field, they would naturally migrate toward a different specialty,” said Dr. Samora.
Trainees can also be put off by residency directors asking them inappropriate questions. Of nearly 500 female orthopedic surgeons surveyed, 62% reported that they were asked inappropriate questions during their residency interviews. “Inappropriate questions and comments directed toward women during residency interviews are clearly not conducive to women entering the field,” the authors stated. They found that little changed during the study period from 1971 to 2015.
The most frequent inappropriate questions concerned whether the prospective residents would be getting pregnant or raising children during residency and their marital status. One female orthopedic surgeon reported: “I was asked if I have children and was told that it would be too difficult to complete an orthopedic residency with children.”
The interviewers also made frequent comments about the inferiority of women to men. For example, “I was told by one program interviewer that ‘I don’t have a bias about women in medicine, I have a bias about women in orthopedic surgery,’ ” another female orthopedic surgeon commented.
Longer training
Residency training for the top-paying surgical specialties, including orthopedic surgery, plastic surgery, and otolaryngology, lasts 5-6 years. This compares with 3-4 years for the lower-paying specialties, such as pediatrics, internal medicine, and ob.gyn., according to data from the American Medical Association.
Women doctors are in their prime childbearing years during residency. Women who want to start a family will consider whether they want to get pregnant during residency or wait until they finish their training, said Dr. Malcolm.
The vast majority (84%) of 190 female orthopedic surgery trainees who responded to a survey indicated that they did not have children or were pregnant during residency. Nearly half (48%) reported that they had postponed having children because they were in training.
“The longer training is definitely a concerning issue for women of childbearing age. Many professional women are waiting to have children, for multiple reasons, but one major fear is the stigma due to taking time off from work obligations. There is a risk of irritating your peers because they may have to take on more work and cover more calls for you during your absence,” said Dr. Samora.
That fear is not unfounded. At least half of the 190 female orthopedic residents reported that they encountered bias against becoming pregnant during training from both coresidents (60%) and attendings (50%), according to the study.
Another recent survey suggests that pregnant surgical residents face several barriers during their training, including a lack of salary for extended family leave, resentment from fellow residents who need to cover for them during maternity leave, and a lack of formal lactation policies.
A few policy changes by national board organizations, including those in the surgical specialties, may make life a little easier for female trainees to have children, suggested Dr. Samora.
Residents and fellows are now allowed a minimum of 6 weeks away for medical leave or caregiving once during training, without having to use vacation or sick leave and without having to extend their training, the American Board of Medical Specialties has announced.
In addition, the American Board of Orthopaedic Surgery and the American Board of Surgery have enacted policies that allow lactating women to take a break to pump during their board exams.
A version of this article first appeared on Medscape.com.
Exploring the Utility of Artificial Intelligence During COVID-19 in Dermatology Practice
With the need to adapt to the given challenges associated with COVID-19, artificial intelligence (AI) serves as a potential tool in providing access to medical-based diagnosis in a novel way. Artificial intelligence is defined as intelligence harnessed by machines that have the ability to perform what is called cognitive thinking and to mimic the problem-solving abilities of the human mind. Virtual AI in dermatology entails neural network–based guidance that includes developing algorithms to detect skin pathology through photographs.1 To use AI in dermatology, recognition of visual patterns must be established to give diagnoses. These neural networks have been used to classify skin diseases, including cancer, actinic keratosis, and warts.2
AI for Skin Cancer
The use of AI to classify melanoma and nonmelanoma skin cancer has been studied extensively, including the following 2 research projects.
Convolutional Neural Network
In 2017, Stanford University published a study in which a deep-learning algorithm known as a convolutional neural network was used to classify skin lesions.3 The network was trained using a dataset of 129,450 clinical images of 2032 diseases. Its performance was compared to that of 21 board-certified dermatologists on biopsy-proven clinical images with 2 classifications of cases: (1) keratinocyte carcinoma as opposed to benign seborrheic keratosis and (2) malignant melanoma as opposed to benign nevi—the first representing the most common skin cancers, and the second, the deadliest skin cancers. The study showed that the machine could accurately identify and classify skin cancers compared to the work of board-certified dermatologists. The study did not include demographic information, which limits its external validity.3
Dermoscopic Image Classification
A 2019 study by Brinker and colleagues4 showed the superiority of automated dermoscopic melanoma image classifications compared to the work of board-certified dermatologists. For the study, 804 biopsy-proven images of melanoma and nevi (1:1 ratio) were randomly presented to dermatologists for their evaluation and recommended treatment (yielding 19,296 recommendations). The dermatologists classified the lesions with a sensitivity of 67.2% and specificity of 62.2%; the trained convolutional neural network attained both higher sensitivity (82.3%) and higher specificity (77.9%).4
Smartphone Diagnosis of Melanoma
An application of AI has been to use smartphone apps for the diagnosis of melanoma. The most utilized and novel algorithm-based smartphone app that assesses skin lesions for malignancy characteristics is SkinVision. With a simple download from Apple’s App Store, this technology allows a person to check their skin spots by taking a photograph and receiving algorithmic risk-assessment feedback. This inexpensive software ($51.78 a year) also allows a patient’s physician to assess the photograph and then validate their assessment by comparing it with the algorithmic analysis that the program provides.5
A review of SkinVision conducted by Thissen and colleagues6 found that, in a hypothetical population of 1000 adults of whom 3% actually had melanoma, 4 of those 30 people would not have been flagged as at “high risk” by SkinVision. There also was a high false-positive rate with the app, with more than 200 people flagged as at high risk. The analysis pegged SkinVision as having a sensitivity of 88% and specificity of 79%.6
In summary, systematic review of diagnostic accuracy has shown that, although there is accuracy in AI analyses, it should be used only as a guide for health care advice due to variability in algorithm performance.7
Utility of AI in Telehealth
Artificial intelligence algorithms could be created to ensure telehealth image accuracy, stratify risk, and track patient progress. With teledermatology visits on the rise during the COVID-19 pandemic, AI algorithms could ensure that photographs of appropriate quality are taken. Also, patients could be organized by risk factors with such algorithms, allowing physicians to save time on triage and stratification. Algorithms also could be used to track a telehealth patient’s treatment and progress.8
Furthermore, there is a need for an algorithm that has the ability to detect, quantify, and monitor changes in dermatologic conditions using images that patients have uploaded. This capability will lead to creation of a standardized quantification scale that will allow physicians to virtually track the progression of visible skin pathologies.
Hazards of Racial Bias in AI
Artificial intelligence is limited by racial disparity bias seen in computerized medicine. For years, the majority of dermatology research, especially in skin cancer, has been conducted on fairer-skinned populations. This bias has existed at the expense of darker-skinned patients, whose skin conditions and symptoms present differently,9 and reflects directly in available data sets that can be used to develop AI algorithms. Because these data are inadequate to the task, AI might misdiagnose skin cancer in people of color or miss an existing condition entirely.10 Consequently, the higher rate of skin cancer mortality that is reported in people of color is likely to persist with the rise of AI in dermatology.11 A more representative database of imaged skin lesions needs to be utilized to create a diversely representative and applicable data set for AI algorithms.12
Benefits of Conversational Agents
Another method by which AI could be incorporated into dermatology is through what is known as a conversational agent (CA)—AI software that engages in a dialogue with users by interpreting their voice and replying to them through text, image, or voice.13 Conversational agents facilitate remote patient management, allow clinicians to focus on other functions, and aid in data collection.14 A 2014 study showed that patients were significantly more likely to disclose history and emotions when informed they were interacting with a CA than with a human clinician (P=.007).15 Such benefits could be invaluable in dermatology, where emotions and patient perceptions of skin conditions play into the treatment process.
However, some evidence showed that CAs cannot respond to patients’ statements in all circumstances.16 It also is unclear how well CAs recognize nuanced statements that might signal potential harm. This fits into the greater theme of a major problem with AI: the lack of a reliable response in all circumstances.13
Final Thoughts
The practical implementations of AI in dermatology are still being explored. Given the uncertainty surrounding the COVID-19 pandemic and the future of patient care, AI might serve as an important asset in assisting with the diagnosis and treatment of dermatologic conditions, physician productivity, and patient monitoring.
- Amisha, Malik P, Pathania M, et al. Overview of artificial intelligence in medicine. J Family Med Prim Care. 2019;8:2328-2331. doi:10.4103/jfmpc.jfmpc_440_19
- Han SS, Kim MS, Lim W, et al. Classification of the clinical images for benign and malignant cutaneous tumors using a deep learning algorithm. J Invest Dermatol. 2018;138:1529-1538. doi:10.1016/j.jid.2018.01.028
- Esteva A, Kuprel B, Novoa RA, et al. Dermatologist-level classification of skin cancer with deep neural networks. Nature. 2017;542:115-118. doi:10.1038/nature21056
- Brinker TJ, Hekler A, Enk AH, et al. Deep neural networks are superior to dermatologists in melanoma image classification. Eur J Cancer. 2019;119:11-17. doi:10.1016/j.ejca.2019.05.023
- Regulated medical device for detecting skin cancer. SkinVision website. Accessed July 23, 2021. https://www.skinvision.com/hcp/
- Thissen M, Udrea A, Hacking M, et al. mHealth app for risk assessment of pigmented and nonpigmented skin lesions—a study on sensitivity and specificity in detecting malignancy. Telemed J E Health. 2017;23:948-954. doi:10.1089/tmj.2016.0259
- Freeman K, Dinnes J, Chuchu N, et al. Algorithm based smartphone apps to assess risk of skin cancer in adults: systematic review of diagnostic accuracy studies. BMJ. 2020;368:m127. doi:10.1136/bmj.m127
- Puri P, Comfere N, Pittelkow MR, et al. COVID-19: an opportunity to build dermatology’s digital future. Dermatol Ther. 2020;33:e14149. doi:10.1111/dth.14149
- Buster KJ, Stevens EI, Elmets CA. Dermatologic health disparities. Dermatol Clin. 2012;30:53-59,viii. doi:10.1016/j.det.2011.08.002
- Adamson AS, Smith A. Machine learning and health care disparities in dermatology. JAMA Dermatol. 2018;154:1247-1248. doi:10.1001/jamadermatol.2018.2348
- Agbai ON, Buster K, Sanchez M, et al. Skin cancer and photoprotection in people of color: a review and recommendations for physicians and the public. J Am Acad Dermatol. 2014;70:748-762. doi:S0190-9622(13)01296-6
- Alabdulkareem A. Artificial intelligence and dermatologists: friends or foes? J Dermatol Dermatolog Surg. 2019;23:57-60. doi:10.4103/jdds.jdds_19_19
- McGreevey JD 3rd, Hanson CW 3rd, Koppel R. Clinical, legal, and ethical aspects of artificial intelligence-assisted conversational agents in health care. JAMA. 2020;324:552-553. doi:10.1001/jama.2020.2724
- Piau A, Crissey R, Brechemier D, et al. A smartphone chatbot application to optimize monitoring of older patients with cancer. Int J Med Inform. 2019;128:18-23. doi:10.1016/j.ijmedinf.2019.05.013
- Lucas GM, Gratch J, King A, et al. It’s only a computer: virtual humans increase willingness to disclose. Comput Human Behav. 2014;37:94-100. https://doi.org/10.1016/j.chb.2014.04.043
- Miner AS, Milstein A, Schueller S, et al. Smartphone-based conversational agents and responses to questions about mental health, interpersonal violence, and physical health. JAMA Intern Med. 2016;176:619-625. doi:10.1001/jamainternmed.2016.0400
With the need to adapt to the given challenges associated with COVID-19, artificial intelligence (AI) serves as a potential tool in providing access to medical-based diagnosis in a novel way. Artificial intelligence is defined as intelligence harnessed by machines that have the ability to perform what is called cognitive thinking and to mimic the problem-solving abilities of the human mind. Virtual AI in dermatology entails neural network–based guidance that includes developing algorithms to detect skin pathology through photographs.1 To use AI in dermatology, recognition of visual patterns must be established to give diagnoses. These neural networks have been used to classify skin diseases, including cancer, actinic keratosis, and warts.2
AI for Skin Cancer
The use of AI to classify melanoma and nonmelanoma skin cancer has been studied extensively, including the following 2 research projects.
Convolutional Neural Network
In 2017, Stanford University published a study in which a deep-learning algorithm known as a convolutional neural network was used to classify skin lesions.3 The network was trained using a dataset of 129,450 clinical images of 2032 diseases. Its performance was compared to that of 21 board-certified dermatologists on biopsy-proven clinical images with 2 classifications of cases: (1) keratinocyte carcinoma as opposed to benign seborrheic keratosis and (2) malignant melanoma as opposed to benign nevi—the first representing the most common skin cancers, and the second, the deadliest skin cancers. The study showed that the machine could accurately identify and classify skin cancers compared to the work of board-certified dermatologists. The study did not include demographic information, which limits its external validity.3
Dermoscopic Image Classification
A 2019 study by Brinker and colleagues4 showed the superiority of automated dermoscopic melanoma image classifications compared to the work of board-certified dermatologists. For the study, 804 biopsy-proven images of melanoma and nevi (1:1 ratio) were randomly presented to dermatologists for their evaluation and recommended treatment (yielding 19,296 recommendations). The dermatologists classified the lesions with a sensitivity of 67.2% and specificity of 62.2%; the trained convolutional neural network attained both higher sensitivity (82.3%) and higher specificity (77.9%).4
Smartphone Diagnosis of Melanoma
An application of AI has been to use smartphone apps for the diagnosis of melanoma. The most utilized and novel algorithm-based smartphone app that assesses skin lesions for malignancy characteristics is SkinVision. With a simple download from Apple’s App Store, this technology allows a person to check their skin spots by taking a photograph and receiving algorithmic risk-assessment feedback. This inexpensive software ($51.78 a year) also allows a patient’s physician to assess the photograph and then validate their assessment by comparing it with the algorithmic analysis that the program provides.5
A review of SkinVision conducted by Thissen and colleagues6 found that, in a hypothetical population of 1000 adults of whom 3% actually had melanoma, 4 of those 30 people would not have been flagged as at “high risk” by SkinVision. There also was a high false-positive rate with the app, with more than 200 people flagged as at high risk. The analysis pegged SkinVision as having a sensitivity of 88% and specificity of 79%.6
In summary, systematic review of diagnostic accuracy has shown that, although there is accuracy in AI analyses, it should be used only as a guide for health care advice due to variability in algorithm performance.7
Utility of AI in Telehealth
Artificial intelligence algorithms could be created to ensure telehealth image accuracy, stratify risk, and track patient progress. With teledermatology visits on the rise during the COVID-19 pandemic, AI algorithms could ensure that photographs of appropriate quality are taken. Also, patients could be organized by risk factors with such algorithms, allowing physicians to save time on triage and stratification. Algorithms also could be used to track a telehealth patient’s treatment and progress.8
Furthermore, there is a need for an algorithm that has the ability to detect, quantify, and monitor changes in dermatologic conditions using images that patients have uploaded. This capability will lead to creation of a standardized quantification scale that will allow physicians to virtually track the progression of visible skin pathologies.
Hazards of Racial Bias in AI
Artificial intelligence is limited by racial disparity bias seen in computerized medicine. For years, the majority of dermatology research, especially in skin cancer, has been conducted on fairer-skinned populations. This bias has existed at the expense of darker-skinned patients, whose skin conditions and symptoms present differently,9 and reflects directly in available data sets that can be used to develop AI algorithms. Because these data are inadequate to the task, AI might misdiagnose skin cancer in people of color or miss an existing condition entirely.10 Consequently, the higher rate of skin cancer mortality that is reported in people of color is likely to persist with the rise of AI in dermatology.11 A more representative database of imaged skin lesions needs to be utilized to create a diversely representative and applicable data set for AI algorithms.12
Benefits of Conversational Agents
Another method by which AI could be incorporated into dermatology is through what is known as a conversational agent (CA)—AI software that engages in a dialogue with users by interpreting their voice and replying to them through text, image, or voice.13 Conversational agents facilitate remote patient management, allow clinicians to focus on other functions, and aid in data collection.14 A 2014 study showed that patients were significantly more likely to disclose history and emotions when informed they were interacting with a CA than with a human clinician (P=.007).15 Such benefits could be invaluable in dermatology, where emotions and patient perceptions of skin conditions play into the treatment process.
However, some evidence showed that CAs cannot respond to patients’ statements in all circumstances.16 It also is unclear how well CAs recognize nuanced statements that might signal potential harm. This fits into the greater theme of a major problem with AI: the lack of a reliable response in all circumstances.13
Final Thoughts
The practical implementations of AI in dermatology are still being explored. Given the uncertainty surrounding the COVID-19 pandemic and the future of patient care, AI might serve as an important asset in assisting with the diagnosis and treatment of dermatologic conditions, physician productivity, and patient monitoring.
- Amisha, Malik P, Pathania M, et al. Overview of artificial intelligence in medicine. J Family Med Prim Care. 2019;8:2328-2331. doi:10.4103/jfmpc.jfmpc_440_19
- Han SS, Kim MS, Lim W, et al. Classification of the clinical images for benign and malignant cutaneous tumors using a deep learning algorithm. J Invest Dermatol. 2018;138:1529-1538. doi:10.1016/j.jid.2018.01.028
- Esteva A, Kuprel B, Novoa RA, et al. Dermatologist-level classification of skin cancer with deep neural networks. Nature. 2017;542:115-118. doi:10.1038/nature21056
- Brinker TJ, Hekler A, Enk AH, et al. Deep neural networks are superior to dermatologists in melanoma image classification. Eur J Cancer. 2019;119:11-17. doi:10.1016/j.ejca.2019.05.023
- Regulated medical device for detecting skin cancer. SkinVision website. Accessed July 23, 2021. https://www.skinvision.com/hcp/
- Thissen M, Udrea A, Hacking M, et al. mHealth app for risk assessment of pigmented and nonpigmented skin lesions—a study on sensitivity and specificity in detecting malignancy. Telemed J E Health. 2017;23:948-954. doi:10.1089/tmj.2016.0259
- Freeman K, Dinnes J, Chuchu N, et al. Algorithm based smartphone apps to assess risk of skin cancer in adults: systematic review of diagnostic accuracy studies. BMJ. 2020;368:m127. doi:10.1136/bmj.m127
- Puri P, Comfere N, Pittelkow MR, et al. COVID-19: an opportunity to build dermatology’s digital future. Dermatol Ther. 2020;33:e14149. doi:10.1111/dth.14149
- Buster KJ, Stevens EI, Elmets CA. Dermatologic health disparities. Dermatol Clin. 2012;30:53-59,viii. doi:10.1016/j.det.2011.08.002
- Adamson AS, Smith A. Machine learning and health care disparities in dermatology. JAMA Dermatol. 2018;154:1247-1248. doi:10.1001/jamadermatol.2018.2348
- Agbai ON, Buster K, Sanchez M, et al. Skin cancer and photoprotection in people of color: a review and recommendations for physicians and the public. J Am Acad Dermatol. 2014;70:748-762. doi:S0190-9622(13)01296-6
- Alabdulkareem A. Artificial intelligence and dermatologists: friends or foes? J Dermatol Dermatolog Surg. 2019;23:57-60. doi:10.4103/jdds.jdds_19_19
- McGreevey JD 3rd, Hanson CW 3rd, Koppel R. Clinical, legal, and ethical aspects of artificial intelligence-assisted conversational agents in health care. JAMA. 2020;324:552-553. doi:10.1001/jama.2020.2724
- Piau A, Crissey R, Brechemier D, et al. A smartphone chatbot application to optimize monitoring of older patients with cancer. Int J Med Inform. 2019;128:18-23. doi:10.1016/j.ijmedinf.2019.05.013
- Lucas GM, Gratch J, King A, et al. It’s only a computer: virtual humans increase willingness to disclose. Comput Human Behav. 2014;37:94-100. https://doi.org/10.1016/j.chb.2014.04.043
- Miner AS, Milstein A, Schueller S, et al. Smartphone-based conversational agents and responses to questions about mental health, interpersonal violence, and physical health. JAMA Intern Med. 2016;176:619-625. doi:10.1001/jamainternmed.2016.0400
Practice Points
- Dermatologists should amass pictures of dermatologic conditions in skin of color to contribute to growing awareness and knowledge of presentation of disease in this population.
- Dermatologists should use artificial intelligence as a tool for delivering more efficient and beneficial patient care.
A sizzling hybrid meeting of the Society of Gynecologic Surgeons
The 47th Annual Scientific Meeting of the Society of Gynecologic Surgeons (SGS), like so many things in our modern world, endured many changes and had to stay nimble and evolve to changing times. In the end, however, SGS was able to adapt and succeed, just like a skilled gynecologic surgeon in the operating room, to deliver a fresh new type of meeting.
When we chose the meeting theme, “Working together: How collaboration enables us to better help our patients,” we anticipated a meeting discussing medical colleagues and consultants. In our forever-changed world, we knew we needed to reinterpret this to a broader social context. Our special lectures and panel discussions sought to open attendees’ eyes to disparities in health care for people of color and women.
While we highlighted the realities faced by colleagues in medicine, the topics addressed also were designed to grow awareness about struggles our patients encounter as well. Social disparities are sobering, long-standing, and sometimes require creative collaborations to achieve successful outcomes for all patients. The faculty of one of our postgraduate courses reviews in this special 2-part section to
The meeting also kicked off with a postgraduate course on fibroid management, with workshops on harnessing the power of social media and lessons on leadership from a female Fortune 500 CEO, Lori Ryerkerk, offered as well. As the scientific program launched, we were once again treated to strong science on gynecologic surgery, with only a small dip in abstract submissions, despite the challenges of research during a pandemic. Mark Walters, MD, gave the inaugural lecture in his name on the crucial topic of surgical education and teaching. We also heard a special report from the SGS SOCOVID research group, led by Dr. Rosanne Kho, on gynecologic surgery during the pandemic. We also convened a virtual panel for our hybrid attendees on the benefits to patients of a multidisciplinary approach to gynecologic surgery, presented here by Cecile Ferrando, MD.
As our practices continue to grow and evolve, the introduction of innovative technologies can pose a new challenge, as Miles Murphy, MD, and members of the panel on novel gynecologic office procedures will present in this series next month.
The TeLinde keynote speaker was Janet Dombrowski, who works as a coach for many surgeons in various disciplines across the country. She spoke to the resilience gained through community and collaboration.
While our meeting theme dated to the “before” pandemic era, those who were able to be in attendance in person can attest to the value we can all place now on community and personal interactions. With experience strengthened by science, I hope this meeting summary serves to highlight the many ways in which we can collaborate to improve outcomes for ourselves in medicine and for patients.
U.S. health system ranks last among 11 high-income countries
The U.S. health care system ranked last overall among 11 high-income countries in an analysis by the nonprofit Commonwealth Fund, according to a report released on Aug. 4.
The report is the seventh international comparison of countries’ health systems by the Commonwealth Fund since 2004, and the United States has ranked last in every edition, David Blumenthal, MD, president of the Commonwealth Fund, told reporters during a press briefing.
Researchers analyzed survey answers from tens of thousands of patients and physicians in 11 countries. They analyzed performance on 71 measures across five categories – access to care, care process, administrative efficiency, equity, and health care outcomes. Administrative data were gathered from the Organisation for Economic Cooperation and Development and the World Health Organization.
Among contributors to the poor showing by the United States is that half (50%) of lower-income U.S. adults and 27% of higher-income U.S. adults say costs keep them from getting needed health care.
“In no other country does income inequality so profoundly limit access to care,” Dr. Blumenthal said.
In the United Kingdom, only 12% with lower incomes and 7% with higher incomes said costs kept them from care.
In a stark comparison, the researchers found that “a high-income person in the U.S. was more likely to report financial barriers than a low-income person in nearly all the other countries surveyed: Australia, Canada, France, Germany, the Netherlands, New Zealand, Norway, Sweden, Switzerland, and the U.K.”
Norway, the Netherlands, and Australia were ranked at the top overall in that order. Rounding out the 11 in overall ranking were the U.K., Germany, New Zealand, Sweden, France, Switzerland, Canada, and the United States.
“What this report tells us is that our health care system is not working for Americans, particularly those with lower incomes, who are at a severe disadvantage compared to citizens of other countries. And they are paying the price with their health and their lives,” Dr. Blumenthal said in a press release.
“To catch up with other high-income countries, the administration and Congress would have to expand access to health care, equitably, to all Americans, act aggressively to control costs, and invest in the social services we know can lead to a healthier population.”
High infant mortality, low life expectancy in U.S.
Several factors contributed to the U.S. ranking at the bottom of the outcomes category. Among them are that the United States has the highest infant mortality rate (5.7 deaths per 1,000 live births) and lowest life expectancy at age 60 (living on average 23.1 years after age 60), compared with the other countries surveyed. The U.S. rate of preventable mortality (177 deaths per 100,000 population) is more than double that of the best-performing country, Switzerland.
Lead author Eric Schneider, MD, senior vice president for policy and research at the Commonwealth Fund, pointed out that, in terms of the change in avoidable mortality over a decade, not only did the United States have the highest rate, compared with the other countries surveyed, “it also experienced the smallest decline in avoidable mortality over that 10-year period.”
The U.S. maternal mortality rate of 17.4 deaths per 100,000 live births is twice that of France, the country with the next-highest rate (7.6 deaths per 100,000 live births).
U.S. excelled in only one category
The only category in which the United States did not rank last was in “care process,” where it ranked second behind only New Zealand.
The care process category combines preventive care, safe care, coordinated care, and patient engagement and preferences. The category includes indicators such as mammography screening and influenza vaccination for older adults as well as the percentage of adults counseled by a health care provider about nutrition, smoking, or alcohol use.
The United States and Germany performed best on engagement and patient preferences, although U.S. adults have the lowest rates of continuity with the same doctor.
New Zealand and the United States ranked highest in the safe care category, with higher reported use of computerized alerts and routine review of medications.
‘Too little, too late’: Key recommendations for U.S. to improve
Reginald Williams, vice president of International Health Policy and Practice Innovations at the Commonwealth Fund, pointed out that the U.S. shortcomings in health care come despite spending more than twice as much of its GDP (17% in 2019) as the average OECD country.
“It appears that the US delivers too little of the care that is most needed and often delivers that care too late, especially for people with chronic illnesses,” he said.
He then summarized the team’s recommendations on how the United States can change course.
First is expanding insurance coverage, he said, noting that the United States is the only one of the 11 countries that lacks universal coverage and nearly 30 million people remain uninsured.
Top-performing countries in the survey have universal coverage, annual out-of-pocket caps on covered benefits, and full coverage for primary care and treatment for chronic conditions, he said.
The United States must also improve access to care, he said.
“Top-ranking countries like the Netherlands and Norway ensure timely availability to care by telephone on nights and weekends, and in-person follow-up at home, if needed,” he said.
Mr. Williams said reducing administrative burdens is also critical to free up resources for improving health. He gave an example: “Norway determines patient copayments or physician fees on a regional basis, applying standardized copayments to all physicians within a specialty in a geographic area.”
Reducing income-related barriers is important as well, he said.
The fear of unpredictably high bills and other issues prevent people in the United States from getting the care they ultimately need, he said, adding that top-performing countries invest more in social services to reduce health risks.
That could have implications for the COVID-19 response.
Responding effectively to COVID-19 requires that patients can access affordable health care services, Mr. Williams noted.
“We know from our research that more than two-thirds of U.S. adults say their potential out-of-pocket costs would figure prominently in their decisions to get care if they had coronavirus symptoms,” he said.
Dr. Schneider summed up in the press release: “This study makes clear that higher U.S. spending on health care is not producing better health especially as the U.S. continues on a path of deepening inequality. A country that spends as much as we do should have the best health system in the world. We should adapt what works in other high-income countries to build a better health care system that provides affordable, high-quality health care for everyone.”
Dr. Blumenthal, Dr. Schneider, and Mr. Williams reported no relevant financial relationships outside their employment with the Commonwealth Fund.
A version of this article first appeared on Medscape.com.
Oncologists face nightmares every day with prior authorization
Editor’s note: Prior authorization has been flagged as the biggest payer-related cause of stress for U.S. oncologists. In one survey, 75% said prior authorization was their biggest burden, followed by coverage denials and appeals (62%). Another survey found that practices spent on average 16.4 hours a week dealing with prior authorizations.
Around 5% of my emails every day are from insurance companies denying my patients the treatments I have recommended. A part of every day is spent worrying about how I’m going to cover my patients’ therapy and what I need to order to make sure it doesn’t get delayed.
Many doctors are retiring because they don’t want to deal with this anymore. There are many times that I have thought about quitting for this reason. A partner of mine had a heart attack last year. He’s a few years older than I am – in his mid-50s – and that scared me. I actually had a CT angiogram just to make sure. They told me my heart is fine, but I worry because of all these frustrations every day. And I’m not alone. For every doctor I work with, it’s the same story, and it’s just ridiculous.
For example, I had a patient with a huge breast mass. My nurse got me the prior authorization for an emergency biopsy. I got back the results for estrogen and progesterone receptor status, but not the HER2-neu results because that test required another authorization.
Authorization shouldn’t be required for every single step. I understand if maybe you need to get an authorization to do something outside the standard of care or something that is unique or unheard of, but HER2-neu biopsy is standard of care and should not require additional authorization.
And the sad part is, that patient turned out to be HER2-neu positive. She lost 4 weeks just waiting for an authorization of a test that should be a no-brainer.
We cannot even do a blood count in our office before getting authorization from some insurances. This is a very important test when we give chemotherapy, and it’s very cheap.
And then another nightmare is if you want to give a patient growth factors when you see their blood count is going down. Sometimes the insurance company will say, “When they get neutropenic fever, we’ll allow it with the next cycle.” Why do I have to wait until the patient develops such a problem to start with a treatment that could avoid it? They may end up in the hospital.
I think I’m one of the more conservative doctors; I try to do everything scientifically and only order a test or a treatment if it’s indicated. But sometimes this guidance costs more money. For example, an insurance company may say to order a CT scan first and if you don’t find your answer, then get a PET scan.
So I order a CT scan, knowing it’s not going to help, and then I tell them, “Now I need a PET scan.” That’s another week delay and an extra cost that I don’t want the system to incur.
I’ve even had some issues with lung screening scans for smokers. This screening has reduced mortality by 20%; it should be a no-brainer to encourage smokers to do it because many of them may not even need chemotherapy if you find early-stage lung cancer. And the screening is not expensive, you can do it for $90 to $100. So why do we have to get authorization for that?
Sometimes I push back and request a “peer-to-peer,” where you challenge the decision of the insurance company and speak to one of their doctors. Out of 10 doctors, maybe three or four will do the peer-to-peer. The rest will give up because it’s so frustrating.
In one case, I wanted to modify a standard regimen and give only two out of three drugs because I thought the third would be too toxic. But the insurance company wouldn’t approve the regimen because the guidelines say you have to give three drugs.
Guidelines are guidance, they should not dictate how you treat an individual patient – there should be some allowance in there for a doctor’s discretion. If not, why do we even need doctors? We could just follow treatment regimens dictated by computers. They have to allow me to personalize the care that my patient deserves and make changes so that the treatment can be tolerated.
But then, I get that one patient whom I feel I really helped and I realize, “Okay, I can help more people.”
I had this one patient, a young, 40-year-old nurse with breast cancer – also HER2-neu positive. She’d had her surgery and finished her adjuvant chemotherapy. One of the things that you do as standard of care, after a year of trastuzumab, is you start them on neratinib. There are studies that show it improves progression-free survival if you give them an extra year of this drug as an adjuvant.
I prescribed the neratinib, but the insurance company denied it because the patient “did not have positive lymph nodes and was not considered high risk.” I told them, “That’s BS, that’s not what the indication is for.” I asked for a peer-to-peer and they said the policy did not allow for peer-to-peer. So, I made a big fuss about it. We appealed, and I finally spoke to a pharmacist who worked for the insurance company. I told him, “Why did you guys deny this? It’s standard of care.” He said, “Oh, I agree with you, this will be approved. And actually, we’re going to change the policy now.”
When that pharmacist told me they were going to change the policy, it was like someone gave me 1 million dollars. Because, you know what? I didn’t just help my patient; now other patients will also get it. The hope is that if you keep fighting for something, they will change it.
I think every doctor wants to do the best for their patients. It’s not like they don’t want to, but really, I am fortunate that I have the means to do it. We’re a big practice and we have dedicated staff who can help.
If you’re a small practice, it’s almost impossible to deal with this. I have two nurse practitioners, and a lot of their work is filling out paperwork for insurance companies.
We had a colleague, a solo practitioner, who would send us his patients with complicated therapies, because he couldn’t afford the time or the effort or the risk of not getting reimbursed. His practice could have paid out $100,000 for drugs and not get a reimbursement for a few months.
Even when an insurance company does give the preauthorization, there’s always this disclaimer that it doesn’t guarantee payment. If they find in the future that your patient didn’t meet the criteria, they can still deny payment.
If the insurers refuse coverage, we really work hard at getting patients free drugs, and most of the time, we manage to do that. We either look to charitable organizations, like the Leukemia and Lymphoma Society, or we look for rare disease societies or we go to the pharmaceutical company.
For really expensive drugs, pharmaceutical companies have a program where you can enroll the patient and they can help copay or even cover the drug. For less expensive drugs, it might not be a big problem, but for a drug that can cost $18,000 to $20,000 a month, that’s a big risk to take.
It’s confusing for patients, too. They get angry and frustrated, and that’s not good for their treatment, because attitude and psychology are very important. Sometimes they yell at us because they think it’s our fault. I encourage them to call their insurance companies themselves, and some of them do.
I don’t do it with every patient, but there are some more educated patients who are advocates, and if their condition is stable, I do encourage them to call their senators or congressmen or congresswomen to complain.
I don’t mind treating complicated patients. I don’t want to say I enjoy it, but I like challenges. That’s my field, that’s medicine, that’s what I’m supposed to do. But it’s really sad and frustrating that, when you want to treat a patient, you first have to look at their insurance to see how much care you can actually give them.
Maen Hussein, MD, is physician director of finance at Florida Cancer Specialists and Research Institute, Fort Myers. He is a board member of the Florida Cancer Specialists Foundation and sits on the board of directors for the Florida Society of Clinical Oncology.
A version of this article first appeared on Medscape.com.