User login
Irritable Bowel Syndrome Risk in Acne Patients: Implications for Dermatologic Care
To the Editor:
Acne vulgaris and irritable bowel syndrome (IBS) are both associated with microbial dysbiosis and chronic inflammation.1-3 While the prevalence of IBS among patients with acne has been examined previously,4,5 there has been limited focus on the risk for new-onset IBS following acne diagnosis. Current evidence suggests isotretinoin may be associated with a lower risk for IBS compared to oral antibiotics6; however, evidence supporting this association is limited outside these cohorts, highlighting the need for further investigation. In this large-scale study, we sought to investigate the incidence of new-onset IBS among patients with acne compared with healthy controls as well as to evaluate whether oral acne treatments (ie, oral antibiotics or isotretinoin) are associated with new-onset IBS in this population.
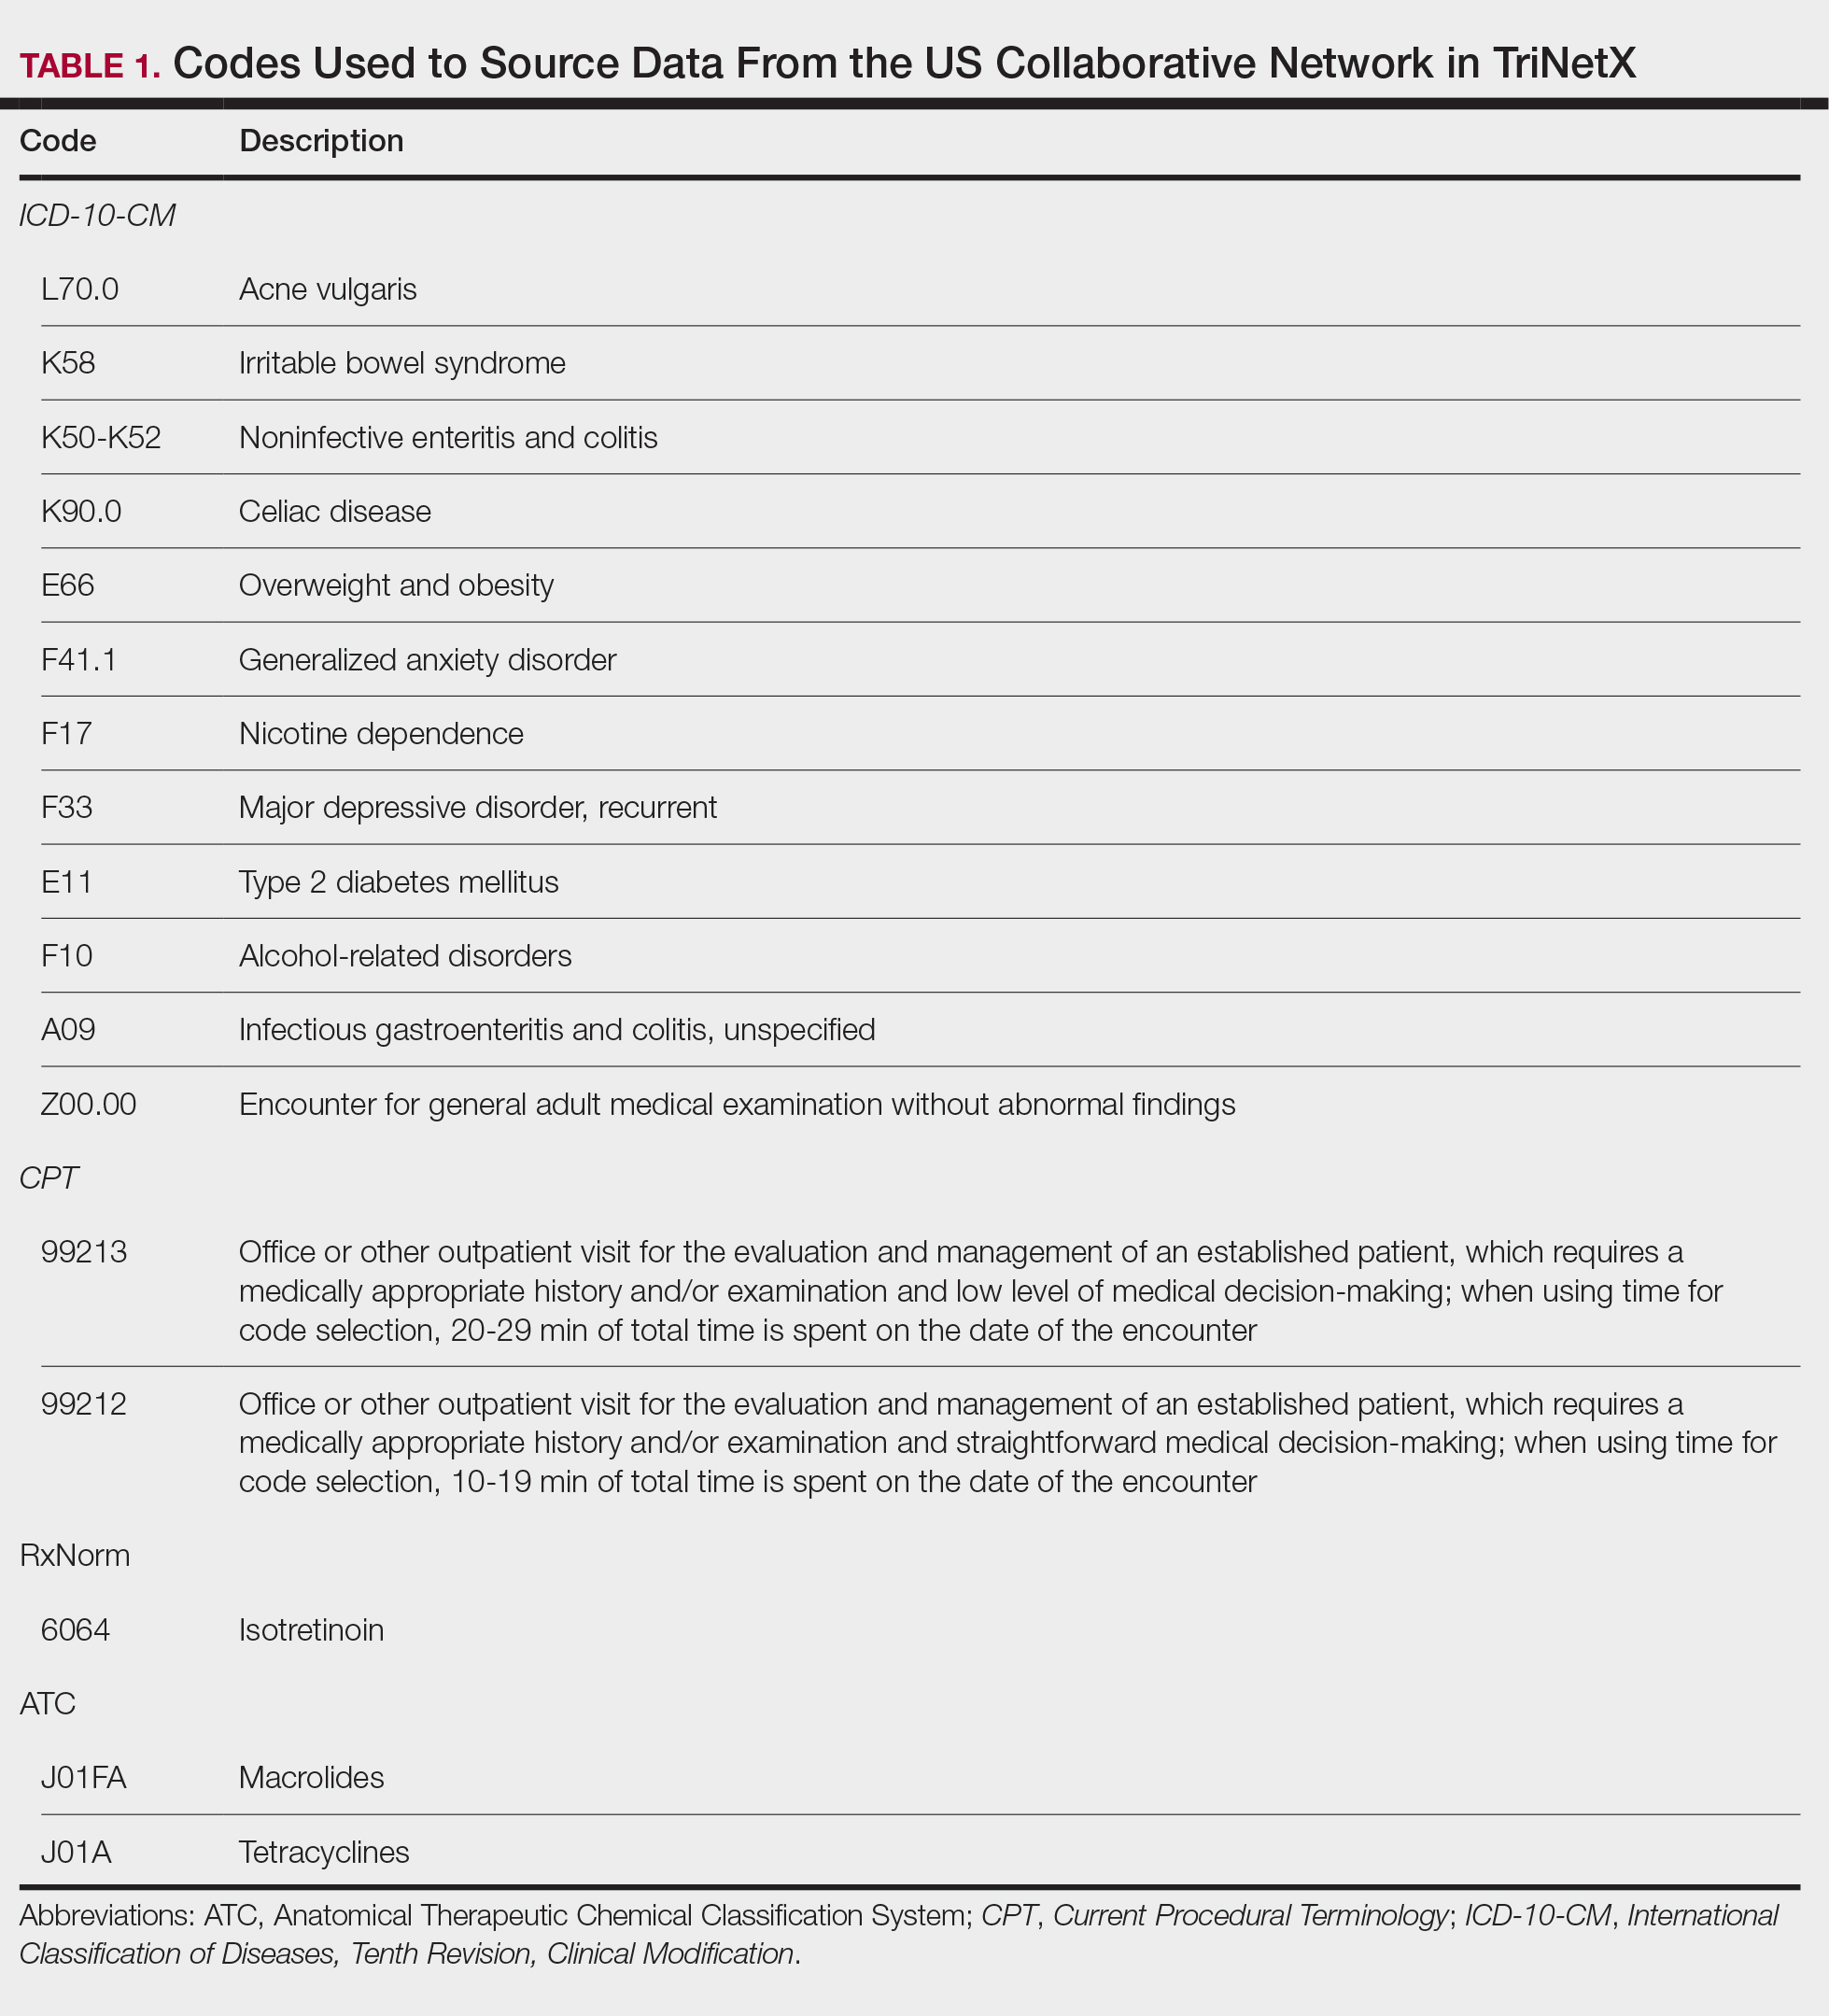
A retrospective cohort study was conducted using data from the US Collaborative Network in TriNetX from October 2014 to October 2024. Patients were identified using International Classification of Diseases, Tenth Revision, Clinical Modification codes, Current Procedural Terminology codes, Anatomical Therapeutic Chemical Classification System codes, and RxNorm codes (Table 1). These codes were selected based on prior literature review, clinical relevance, and their ability to capture diagnoses of acne and IBS as well as relevant exclusion criteria. Patients were considered eligible if they were between the ages of 18 and 90 years. Individuals with a history of IBS, inflammatory bowel disease, infectious gastroenteritis, or celiac disease were excluded from our analysis.
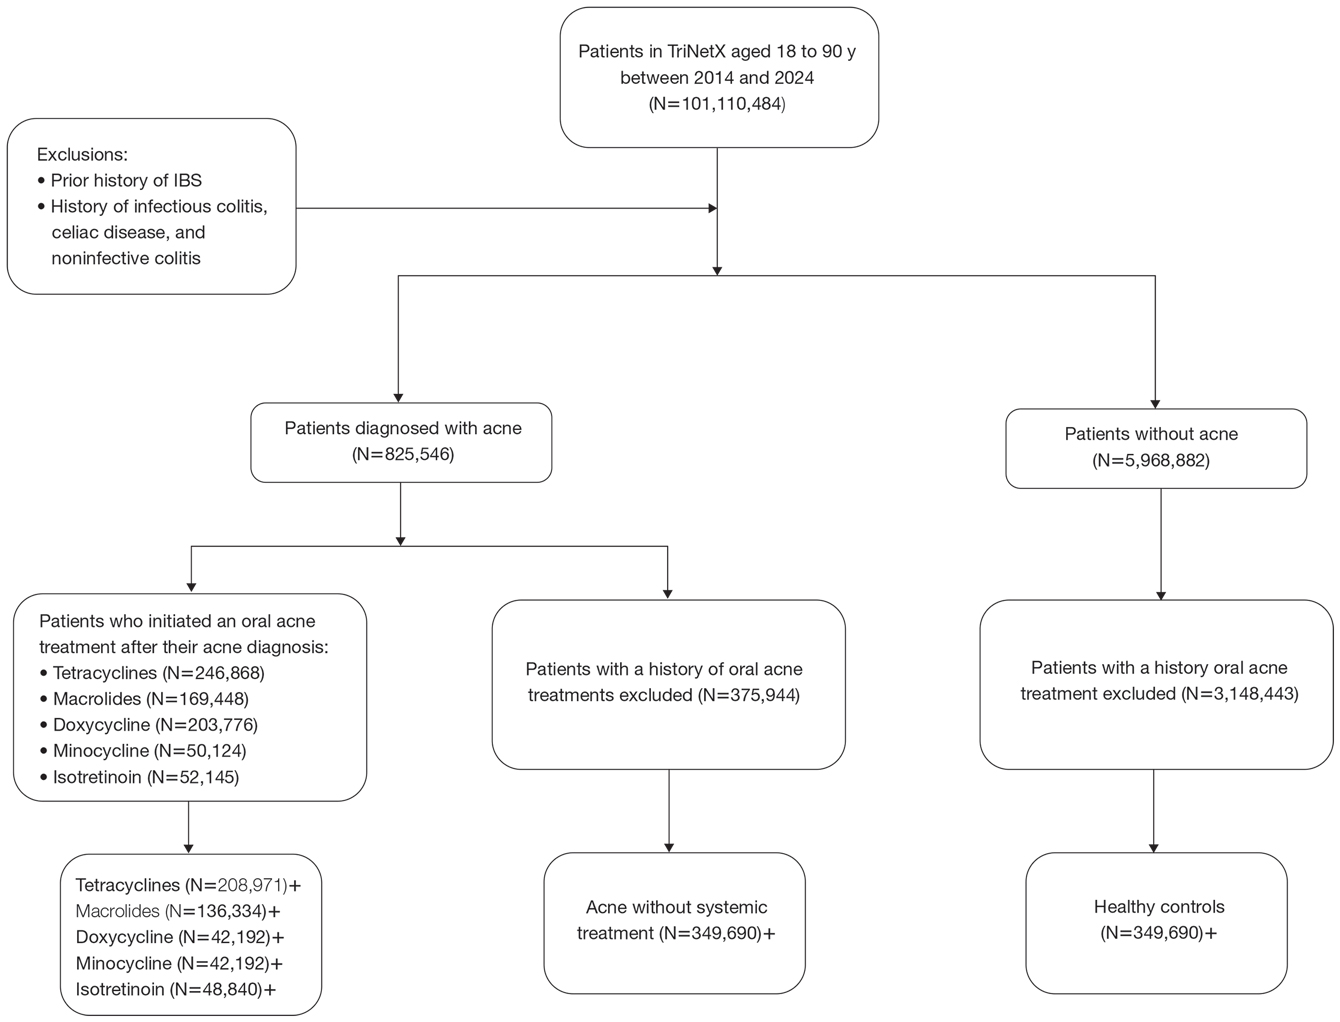
To examine potential associations between acne and IBS, 2 primary cohorts were established: patients with acne who were managed without systemic medications and healthy controls (ie, patients with no history of acne) who had no exposure to systemic acne treatments (Figure). Further, to assess the relationship between oral acne treatments (macrolides, tetracyclines, isotretinoin) and IBS, additional cohorts were created for each therapy and were compared to a cohort of patients with acne who were managed without systemic medications. To control for potential concomitant treatments, patients who had received any systemic treatment other than the specific therapy for their treatment cohort were excluded from our analysis.
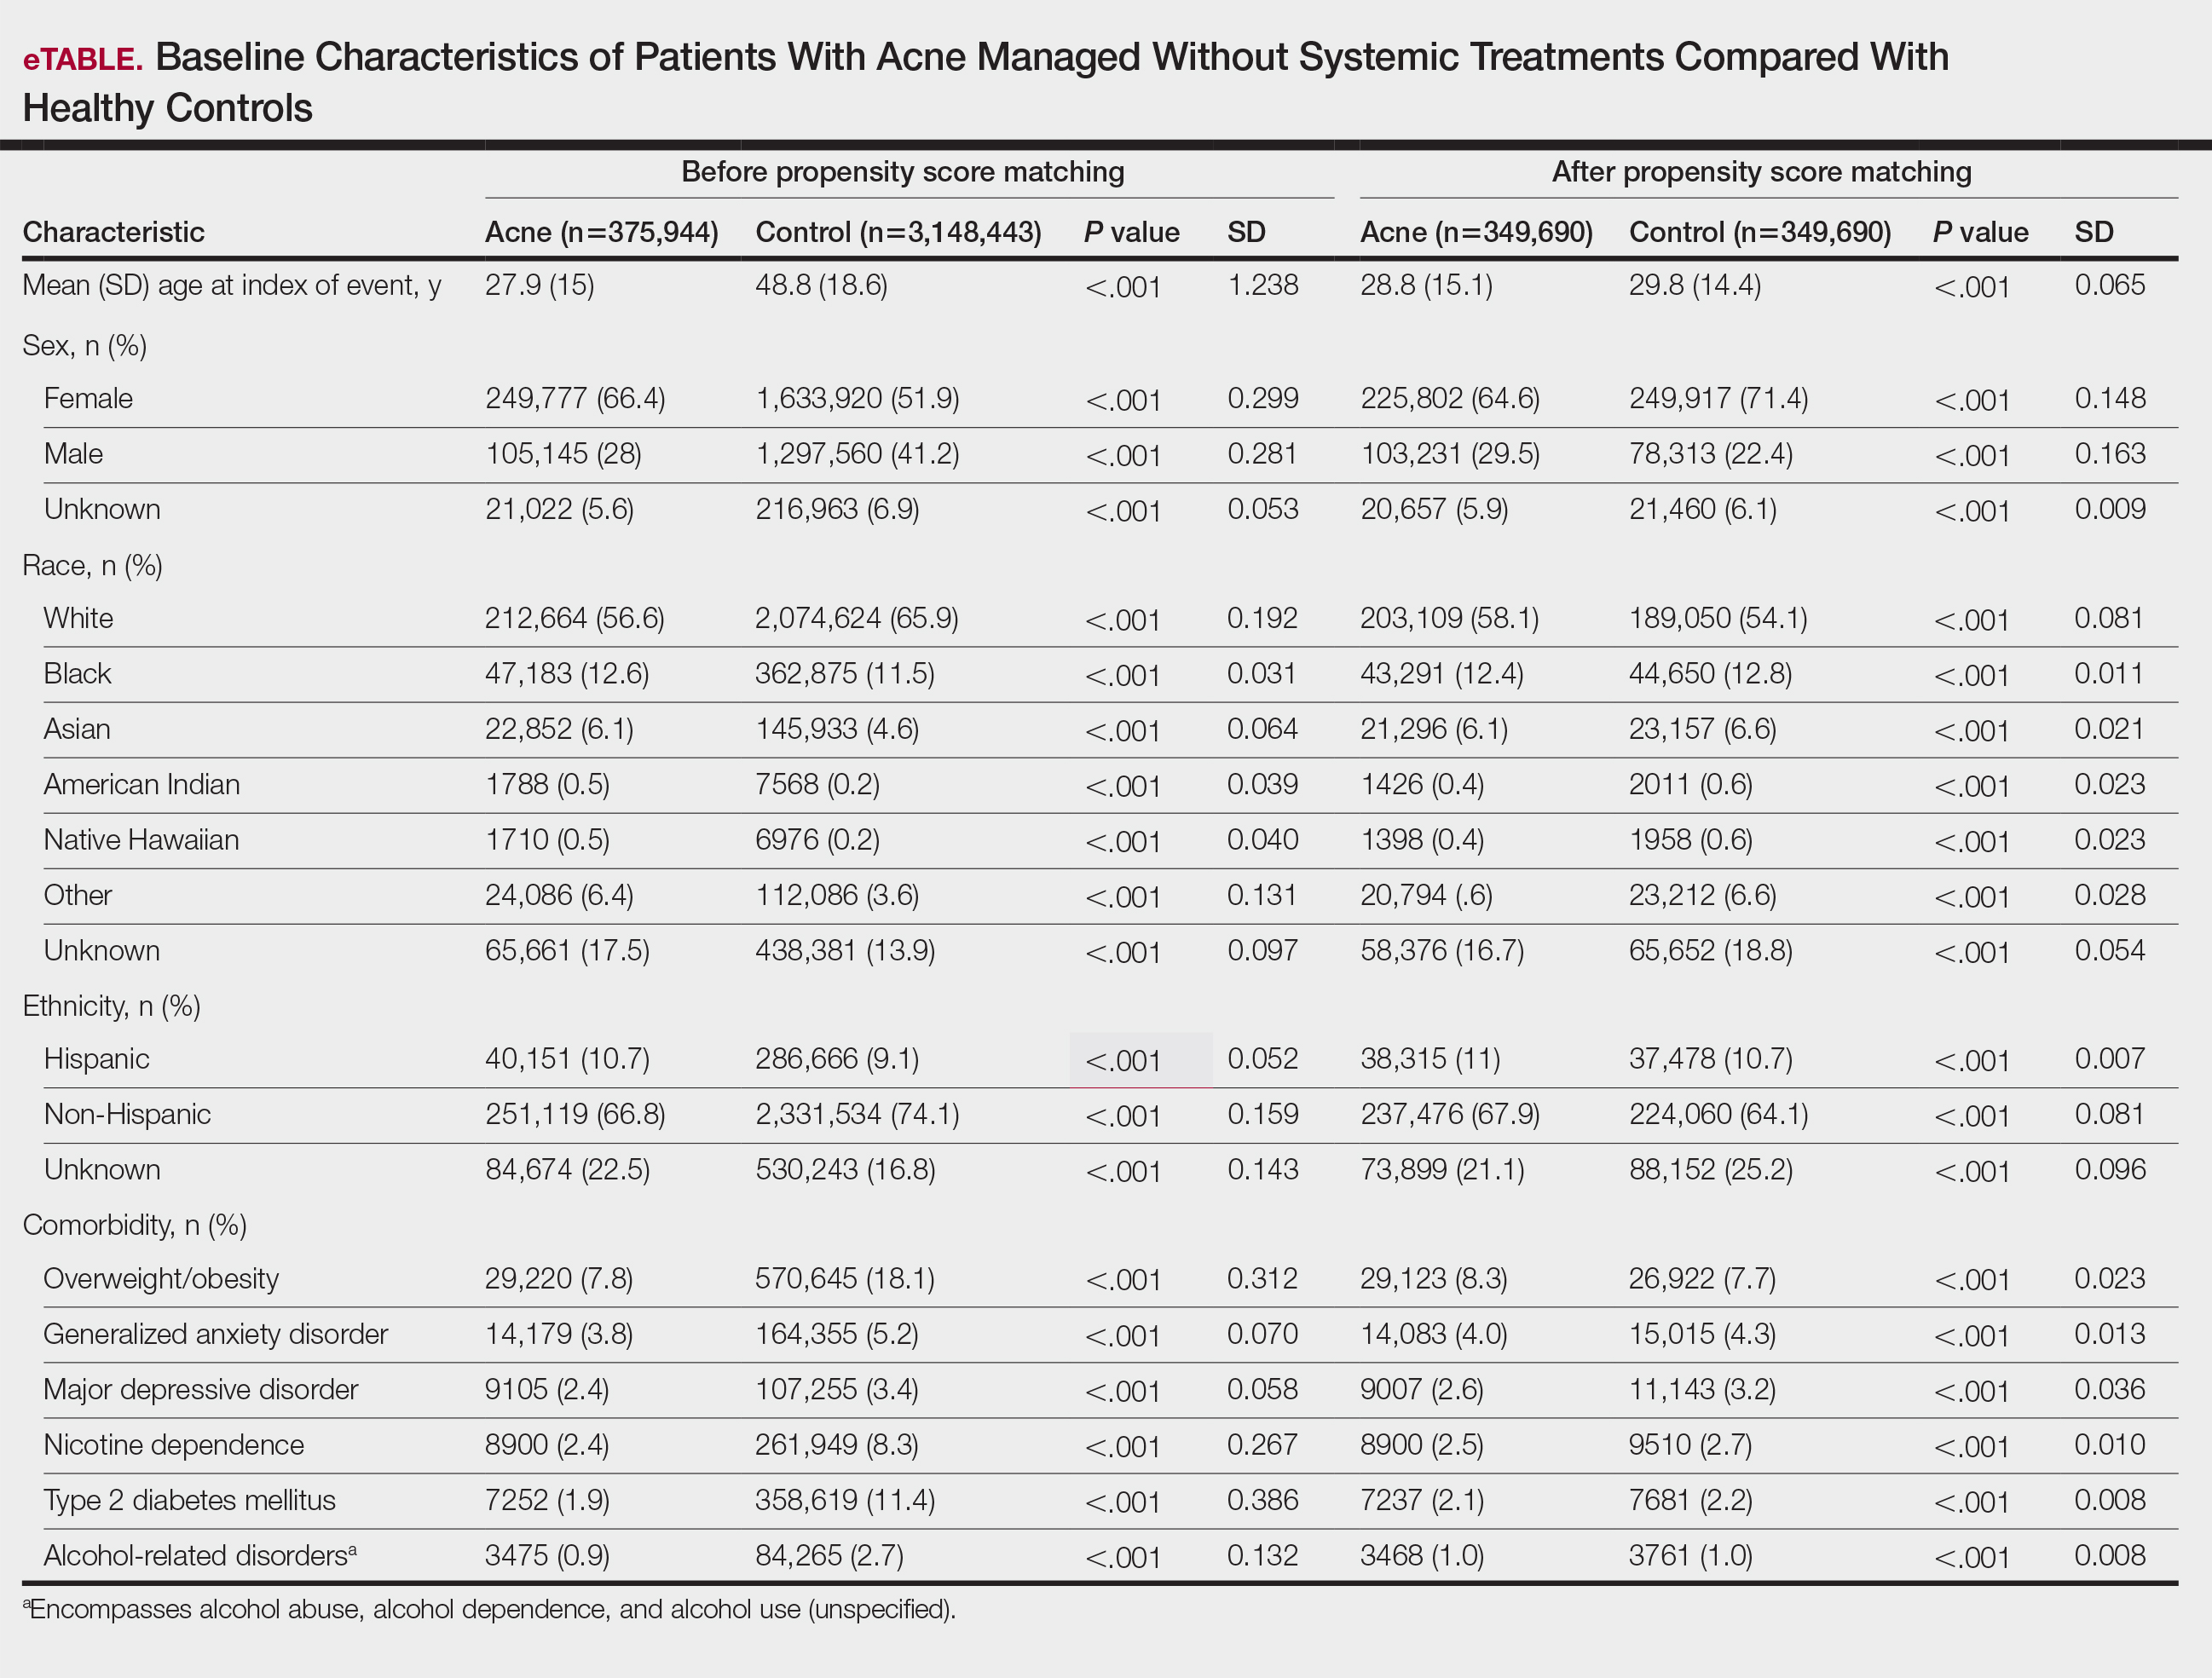
To account for potential confounders, all cohorts were 1:1 propensity score matched by demographics, tobacco and alcohol use, type 2 diabetes, obesity, anxiety, and depression (eTable). Each cohort was followed for 2 years after their index of event: the date of acne diagnosis for the acne cohort, the date of systemic treatment initiation for the treatment cohorts, and the date of the general adult encounter without abnormal findings for the control cohort. The primary outcome was the incidence of IBS, assessed by odds ratio (OR) and 95% CIs.
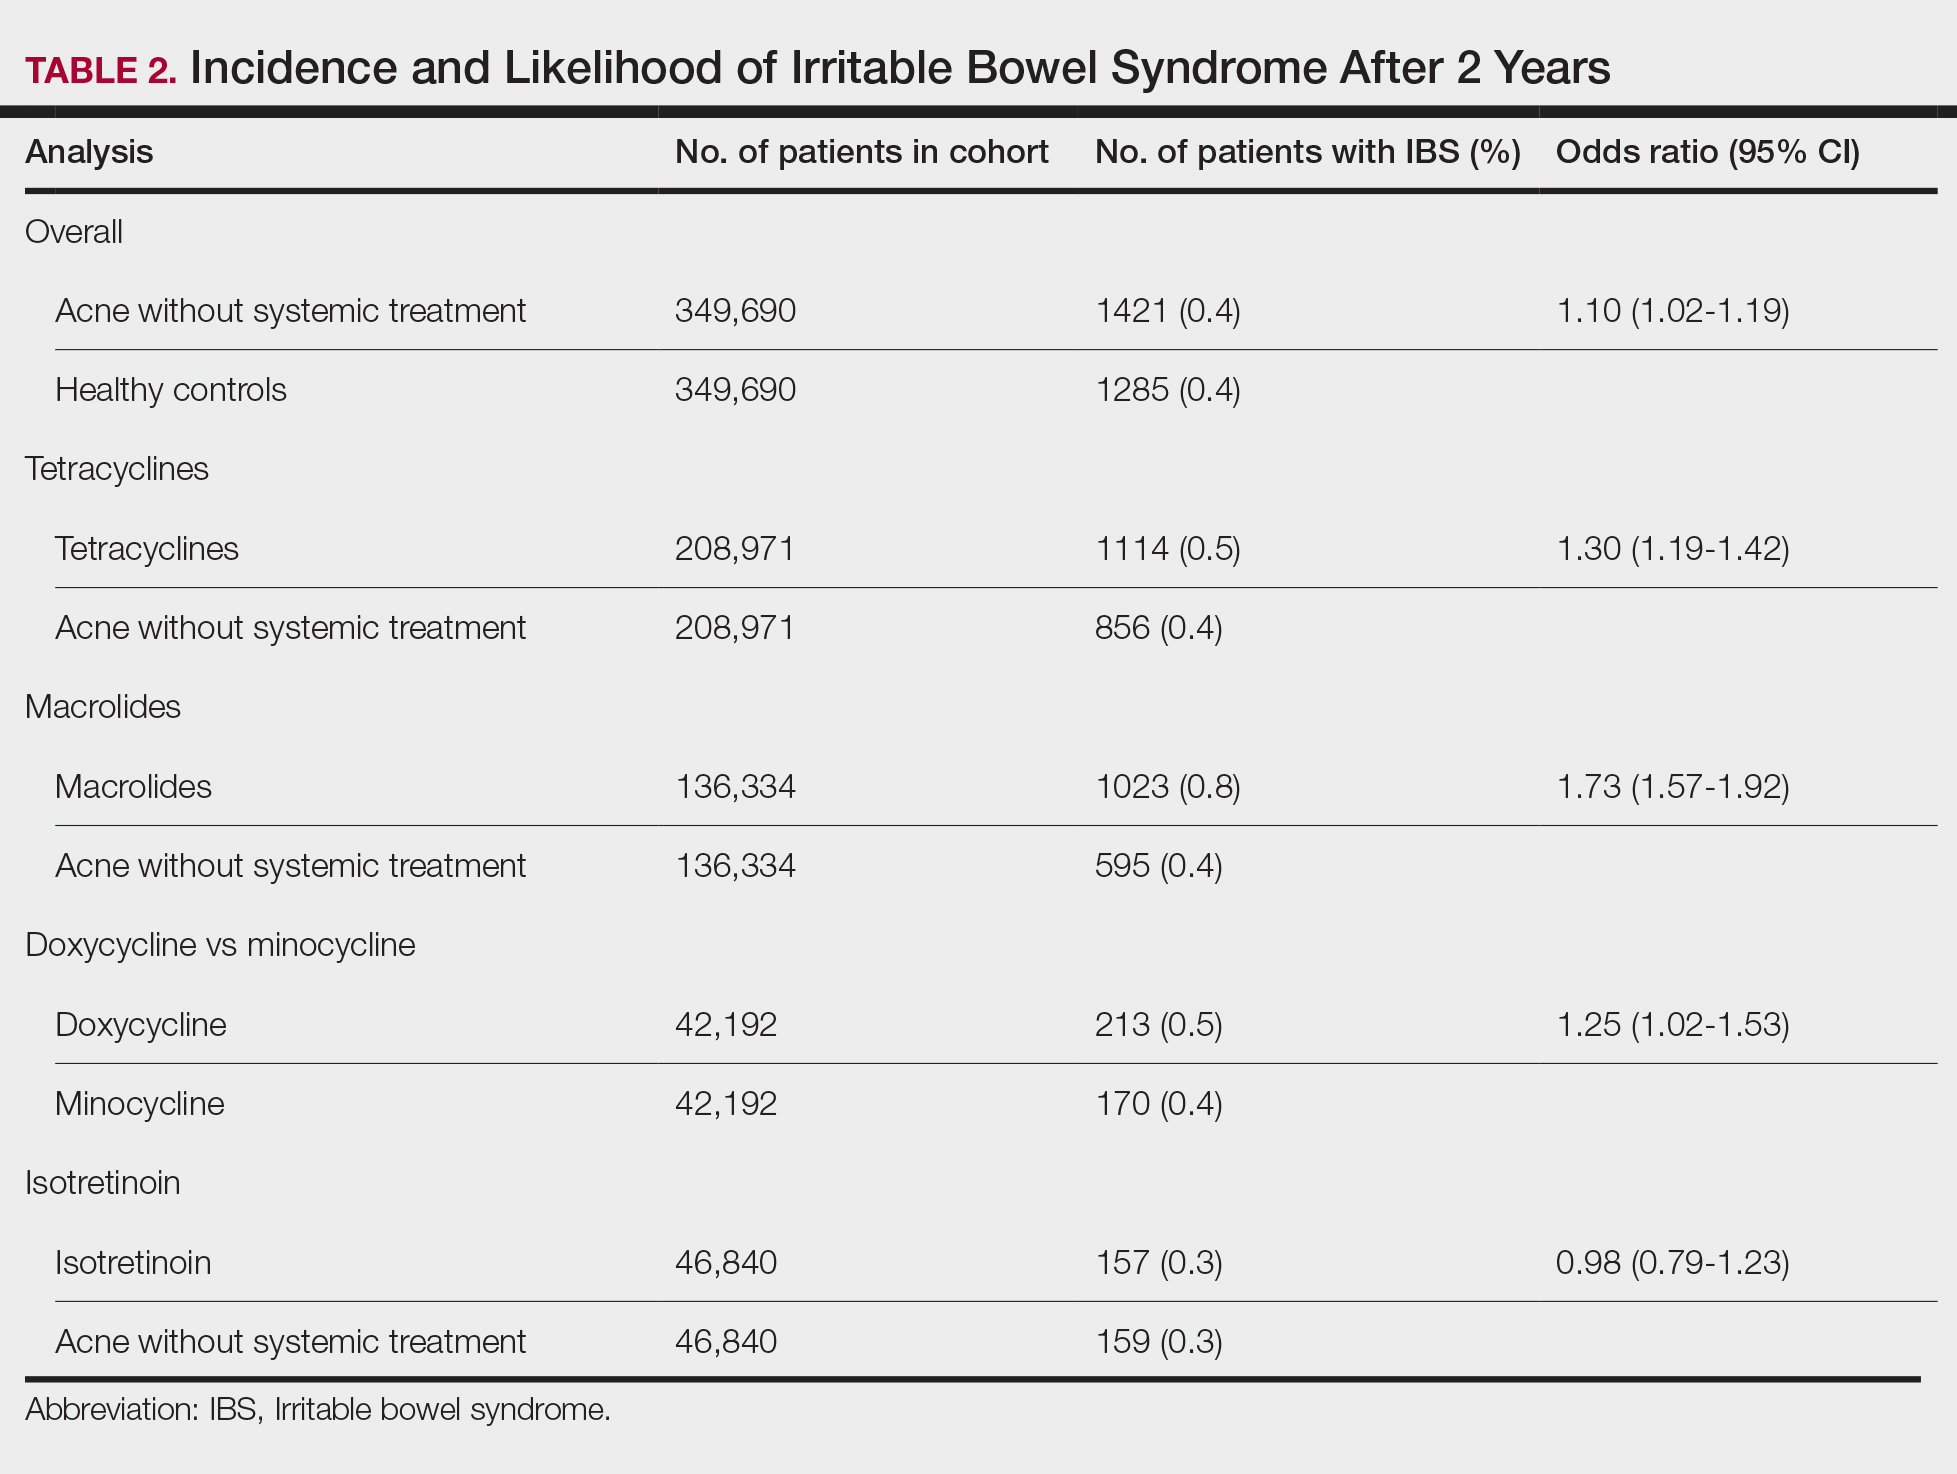
We identified 375,944 patients with acne managed without systemic treatment and 3,148,443 healthy controls who met study criteria. After the 1:1 propensity score match, each cohort included 49,690 patients (eTable). In the 2-year period after acne diagnosis, patients were more likely to develop IBS compared with controls (1421 vs 1285 [OR, 1.10; 95% CI, 1.02-1.19])(Table 2). Patients with acne who were treated with tetracyclines (n=208,971) were 30% more likely to develop IBS than those managed without systemic medications (1114 vs 856 [OR, 1.30; 95% CI, 1.19-1.42]). Within the tetracycline cohort, doxycycline-treated patients were 25% more likely to develop IBS compared with those treated with minocycline (213 vs 170 [OR, 1.25; 95% CI, 1.02-1.53]). Similarly, the use of macrolides (n=136,334) for acne treatment was significantly associated with an increased risk for IBS (1023 vs 595 [OR, 1.73; 95% CI, 1.57-1.92; P<.0001]) compared with controls. No statistically significant association was observed between isotretinoin and the incidence of IBS (Table 2).
In this large-scale cohort study, acne was associated with an increased likelihood of developing IBS within 2 years of an acne diagnosis compared with healthy controls. While a prior study also identified this association, it had a broader follow-up window ranging from 8 to 10 years.2 In contrast, our analysis specifically quantified the risk within the first 2 years of diagnosis. This distinction suggested potential for earlier IBS onset in patients with acne than has previously been recognized and may serve as an early clinical indicator for IBS risk in this population.
Our findings further suggested an association between oral tetracyclines and macrolides and an increased risk for IBS. This aligns with existing literature suggesting that oral antibiotic use can disrupt the gut microbiota and lead to potential gastrointestinal complications7 and reinforces the importance of careful antibiotic stewardship in dermatologic practice.
Although isotretinoin initially was surrounded by substantial controversy regarding its potential impact on gut health—particularly in inflammatory bowel disease8—our results do not support an increased risk for IBS among patients with acne who use isotretinoin. These findings challenge previous concerns and align with research suggesting that isotretinoin could be a safer alternative to antibiotic use for eligible patients who have a history of gastrointestinal disorders.6
This study highlights an important but underrecognized link between acne and IBS risk, emphasizing the need for early monitoring of gastrointestinal symptoms and careful antibiotic stewardship in dermatologic practice. Gastroenterology consultation may be advisable for patients with acne who have persistent gastrointestinal symptoms to facilitate a more integrated, patient-centered approach to care.
Limitations of this study include potential misclassification of International Classification of Diseases, Tenth Revision, Clinical Modification codes, selection bias, and residual confounding from unmeasured factors such as diet, lifestyle, disease severity, and treatment adherence due to the reliance on electronic health record data.
Our findings build upon prior evidence linking acne and IBS and offer important insights into the timing of this association following acne diagnosis. Future research should explore biological mechanisms underlying the gut-skin axis and evaluate targeted interventions to mitigate IBS risk in patients with acne.
Menees S, Chey W. The gut microbiome and irritable bowel syndrome. F1000Res. 2018;7:F1000 Faculty Rev-1029. doi:10.12688/f1000research.14592.1
Yu-Wen C, Chun-Ying W, Yi-Ju C. Gastrointestinal comorbidities in patients with acne vulgaris: a population-based retrospective study. JAAD Int. 2025;18:62-68. doi:10.1016/j.jdin.2024.08.022
Deng Y, Wang H, Zhou J, et al. Patients with acne vulgaris have a distinct gut microbiota in comparison with healthy controls. Acta Derm Venereol. 2018;98:783-790. doi:10.2340/00015555-2968
Demirbas¸ A, Elmas ÖF. The relationship between acne vulgaris and irritable bowel syndrome: a preliminary study. J Cosmet Dermatol. 2021;20:316-320. doi:10.1111/jocd.13481
Daye M, Cihan FG, Is¸ık B, et al. Evaluation of bowel habits in patients with acne vulgaris. Int J Clin Pract. 2021;75:e14903. doi:10.1111/ijcp.14903
Kridin K, Ludwig RJ. Isotretinoin and the risk of inflammatory bowel disease and irritable bowel syndrome: a large-scale global study. J Am Acad Dermatol. 2023;88:824-830. doi:10.1016/j.jaad.2022.12.015
Villarreal AA, Aberger FJ, Benrud R, et al. Use of broad-spectrum antibiotics and the development of irritable bowel syndrome. WMJ. 2012;111:17-20.
Yu C-L, Chou P-Y, Liang C-S, et al. Isotretinoin exposure and risk of inflammatory bowel disease: a systematic review with meta-analysis and trial sequential analysis. Am J Clin Dermatol. 2023;24:721-730. doi:10.1007/s40257-023-00765-9
To the Editor:
Acne vulgaris and irritable bowel syndrome (IBS) are both associated with microbial dysbiosis and chronic inflammation.1-3 While the prevalence of IBS among patients with acne has been examined previously,4,5 there has been limited focus on the risk for new-onset IBS following acne diagnosis. Current evidence suggests isotretinoin may be associated with a lower risk for IBS compared to oral antibiotics6; however, evidence supporting this association is limited outside these cohorts, highlighting the need for further investigation. In this large-scale study, we sought to investigate the incidence of new-onset IBS among patients with acne compared with healthy controls as well as to evaluate whether oral acne treatments (ie, oral antibiotics or isotretinoin) are associated with new-onset IBS in this population.
A retrospective cohort study was conducted using data from the US Collaborative Network in TriNetX from October 2014 to October 2024. Patients were identified using International Classification of Diseases, Tenth Revision, Clinical Modification codes, Current Procedural Terminology codes, Anatomical Therapeutic Chemical Classification System codes, and RxNorm codes (Table 1). These codes were selected based on prior literature review, clinical relevance, and their ability to capture diagnoses of acne and IBS as well as relevant exclusion criteria. Patients were considered eligible if they were between the ages of 18 and 90 years. Individuals with a history of IBS, inflammatory bowel disease, infectious gastroenteritis, or celiac disease were excluded from our analysis.
To examine potential associations between acne and IBS, 2 primary cohorts were established: patients with acne who were managed without systemic medications and healthy controls (ie, patients with no history of acne) who had no exposure to systemic acne treatments (Figure). Further, to assess the relationship between oral acne treatments (macrolides, tetracyclines, isotretinoin) and IBS, additional cohorts were created for each therapy and were compared to a cohort of patients with acne who were managed without systemic medications. To control for potential concomitant treatments, patients who had received any systemic treatment other than the specific therapy for their treatment cohort were excluded from our analysis.
To account for potential confounders, all cohorts were 1:1 propensity score matched by demographics, tobacco and alcohol use, type 2 diabetes, obesity, anxiety, and depression (eTable). Each cohort was followed for 2 years after their index of event: the date of acne diagnosis for the acne cohort, the date of systemic treatment initiation for the treatment cohorts, and the date of the general adult encounter without abnormal findings for the control cohort. The primary outcome was the incidence of IBS, assessed by odds ratio (OR) and 95% CIs.
We identified 375,944 patients with acne managed without systemic treatment and 3,148,443 healthy controls who met study criteria. After the 1:1 propensity score match, each cohort included 49,690 patients (eTable). In the 2-year period after acne diagnosis, patients were more likely to develop IBS compared with controls (1421 vs 1285 [OR, 1.10; 95% CI, 1.02-1.19])(Table 2). Patients with acne who were treated with tetracyclines (n=208,971) were 30% more likely to develop IBS than those managed without systemic medications (1114 vs 856 [OR, 1.30; 95% CI, 1.19-1.42]). Within the tetracycline cohort, doxycycline-treated patients were 25% more likely to develop IBS compared with those treated with minocycline (213 vs 170 [OR, 1.25; 95% CI, 1.02-1.53]). Similarly, the use of macrolides (n=136,334) for acne treatment was significantly associated with an increased risk for IBS (1023 vs 595 [OR, 1.73; 95% CI, 1.57-1.92; P<.0001]) compared with controls. No statistically significant association was observed between isotretinoin and the incidence of IBS (Table 2).
In this large-scale cohort study, acne was associated with an increased likelihood of developing IBS within 2 years of an acne diagnosis compared with healthy controls. While a prior study also identified this association, it had a broader follow-up window ranging from 8 to 10 years.2 In contrast, our analysis specifically quantified the risk within the first 2 years of diagnosis. This distinction suggested potential for earlier IBS onset in patients with acne than has previously been recognized and may serve as an early clinical indicator for IBS risk in this population.
Our findings further suggested an association between oral tetracyclines and macrolides and an increased risk for IBS. This aligns with existing literature suggesting that oral antibiotic use can disrupt the gut microbiota and lead to potential gastrointestinal complications7 and reinforces the importance of careful antibiotic stewardship in dermatologic practice.
Although isotretinoin initially was surrounded by substantial controversy regarding its potential impact on gut health—particularly in inflammatory bowel disease8—our results do not support an increased risk for IBS among patients with acne who use isotretinoin. These findings challenge previous concerns and align with research suggesting that isotretinoin could be a safer alternative to antibiotic use for eligible patients who have a history of gastrointestinal disorders.6
This study highlights an important but underrecognized link between acne and IBS risk, emphasizing the need for early monitoring of gastrointestinal symptoms and careful antibiotic stewardship in dermatologic practice. Gastroenterology consultation may be advisable for patients with acne who have persistent gastrointestinal symptoms to facilitate a more integrated, patient-centered approach to care.
Limitations of this study include potential misclassification of International Classification of Diseases, Tenth Revision, Clinical Modification codes, selection bias, and residual confounding from unmeasured factors such as diet, lifestyle, disease severity, and treatment adherence due to the reliance on electronic health record data.
Our findings build upon prior evidence linking acne and IBS and offer important insights into the timing of this association following acne diagnosis. Future research should explore biological mechanisms underlying the gut-skin axis and evaluate targeted interventions to mitigate IBS risk in patients with acne.
Menees S, Chey W. The gut microbiome and irritable bowel syndrome. F1000Res. 2018;7:F1000 Faculty Rev-1029. doi:10.12688/f1000research.14592.1
Yu-Wen C, Chun-Ying W, Yi-Ju C. Gastrointestinal comorbidities in patients with acne vulgaris: a population-based retrospective study. JAAD Int. 2025;18:62-68. doi:10.1016/j.jdin.2024.08.022
Deng Y, Wang H, Zhou J, et al. Patients with acne vulgaris have a distinct gut microbiota in comparison with healthy controls. Acta Derm Venereol. 2018;98:783-790. doi:10.2340/00015555-2968
Demirbas¸ A, Elmas ÖF. The relationship between acne vulgaris and irritable bowel syndrome: a preliminary study. J Cosmet Dermatol. 2021;20:316-320. doi:10.1111/jocd.13481
Daye M, Cihan FG, Is¸ık B, et al. Evaluation of bowel habits in patients with acne vulgaris. Int J Clin Pract. 2021;75:e14903. doi:10.1111/ijcp.14903
Kridin K, Ludwig RJ. Isotretinoin and the risk of inflammatory bowel disease and irritable bowel syndrome: a large-scale global study. J Am Acad Dermatol. 2023;88:824-830. doi:10.1016/j.jaad.2022.12.015
Villarreal AA, Aberger FJ, Benrud R, et al. Use of broad-spectrum antibiotics and the development of irritable bowel syndrome. WMJ. 2012;111:17-20.
Yu C-L, Chou P-Y, Liang C-S, et al. Isotretinoin exposure and risk of inflammatory bowel disease: a systematic review with meta-analysis and trial sequential analysis. Am J Clin Dermatol. 2023;24:721-730. doi:10.1007/s40257-023-00765-9

Consider Cultural Practices and Barriers to Care When Treating Alopecia Areata
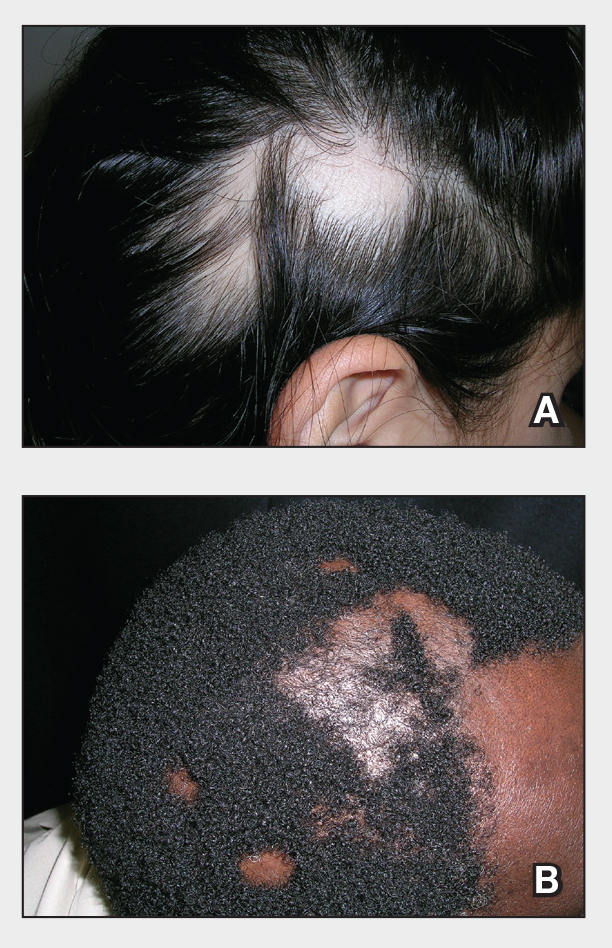
The Comparison
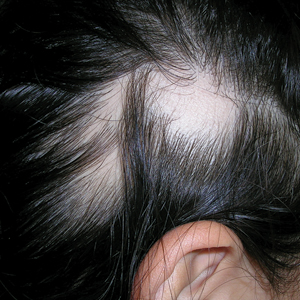
A. Alopecia areata in a young girl with a lighter skin tone. The fine white vellus hairs are signs of regrowth.
B. Alopecia areata in a 49-year-old man with tightly coiled hair and darker skin tone. Coiled white hairs are noted in the alopecia patches.
Alopecia areata (AA) is a common autoimmune condition characterized by hair loss resulting from a T cell–mediated attack on the hair follicles. It manifests as nonscarring patches of hair loss on the scalp, eyebrows, eyelashes, and beard area as well as more extensive complete loss of scalp and body hair. While AA may affect individuals of any age, most patients develop their first patch(es) of hair loss during childhood.1 The treatment landscape for AA has evolved considerably in recent years, but barriers to access to newer treatments persist.
Epidemiology
Alopecia areata is most prevalent among pediatric and adult individuals of African, Asian, or Hispanic/Latino descent.2-4 In some studies, Black individuals had higher odds and Asian individuals had lower odds of developing AA, while other studies have reported the highest standardized prevalence among Asian individuals.5 In the United States, AA affects about 1.47% of adults and as many as 0.11% of children.6-8 In Black patients, AA often manifests early with a female predominance.5
Alopecia areata frequently is associated with autoimmune comorbidities, the most common being thyroid disease.3,5 In Black patients, AA is associated with more atopic comorbidities, including asthma, atopic dermatitis, and allergic rhinitis.5
Key Clinical Features
Alopecia areata clinically manifests similarly across different skin tones; however, in patients with more tightly coiled or curly hair, the extent of scalp hair loss may be underestimated without a full examination. Culturally sensitive approaches to hair and scalp evaluation are essential, especially for Black women, whose hair care practices and scalp conditions may be overlooked or misunderstood during visits to evaluate hair loss. A thoughtful history and gentle examination of the hair and scalp that considers hair texture, cultural practices such as head coverings (eg, headwraps, turbans, hijabs), use of hair adornments (eg, clips, beads, bows), traditional braiding, and use of natural oils or herbal treatments, as well as styling methods including tight hairstyles, use of heat styling tools (eg, flat irons, curling irons), chemical application (eg, straighteners, hair color), and washing or styling frequency can improve diagnostic accuracy and help build trust in the patient-provider relationship.
Classic signs of AA visualized with dermoscopy include yellow and/or black dots on the scalp and exclamation point hairs. The appearance of fine white vellus hairs within the alopecic patches also may indicate early regrowth. On scalp trichoscopy, black dots are more prominent, and yellow dots are less prominent, in individuals with darker skin tones vs lighter skin tones.9
Worth Noting
In addition to a full examination of the scalp, documenting the extent of hair loss using validated severity scales, including the severity of alopecia tool (SALT), alopecia areata severity index (AASI), clinician-reported outcome assessment, and patient-reported outcome measures, can standardize disease severity assessment, facilitate timely insurance or medication approvals, and support objective tracking of treatment response, which may ultimately enhance access to care.10
Prompt treatment of AA is essential. Not surprisingly, patients given a diagnosis of AA may experience considerable emotional and psychological distress—regardless of the extent of the loss.11 Treatment options include mid- to high-potency topical or intralesional corticosteroids and newer and more targeted systemic options, including 3 Janus kinase (JAK) inhibitors—baricitinib, ritlecitinib, and deuruxolitinib—for more extensive disease.12 Treatment with intralesional corticosteroids may cause transient hypopigmentation, which may be more noticeable in patients with darker skin tones. Delays in treatment with JAK inhibitors can lead to a less-than-optimal response. Of the 3 JAK inhibitors that are approved by the US Food and Drug Administration for AA, only ritlecitinib is approved for children 12 years and older, leaving a therapeutic gap for younger patients that often leads to uncomfortable scalp injections, delayed or no treatment, off-label use of JAK inhibitors as well as the pairing of off-label dupilumab with oral minoxidil.12
Based on adult data, patients with severe disease and a shorter duration of hair loss (ie, <4 years) tend to respond better to JAK inhibitors than those experiencing hair loss for longer periods. Also, those with more severe AA tend to have poorer outcomes than those with less severe disease.13 If treatment proves less than optimal, wigs and hair pieces may need to be considered. It is worth noting that some insurance companies will cover the cost of wigs for patients when prescribed as cranial prostheses.
Health Disparity Highlight
Health disparities in AA can be influenced by socioeconomic status and access to care. Patients from lower-income backgrounds often face barriers to accessing dermatologic care and treatments such as JAK inhibitors, which may remain inaccessible due to high costs and insurance limitations.14 These barriers can intersect with other factors such as age, sex, and race, potentially exacerbating disparities. Women with skin of color in underserved communities may experience delayed diagnosis, limited treatment options, and greater psychosocial distress from hair loss.14 Addressing these inequities requires advocacy, education for both patients and clinicians, and improved access to treatment to ensure comprehensive care for all patients.
- Kara T, Topkarcı Z. Interactions between posttraumatic stress disorder and alopecia areata in child with trauma exposure: two case reports. Int J Trichology. 2018;10:131-134. doi:10.4103/ijt.ijt_2_18
- Sy N, Mastacouris N, Strunk A, et al. Overall and racial and ethnic subgroup prevalences of alopecia areata, alopecia totalis, and alopecia universalis. JAMA Dermatol. 2023;159:419-423.
- Lee H, Jung SJ, Patel AB, et al. Racial characteristics of alopecia areata in the United States. J Am Acad Dermatol. 2020;83:1064-1070.
- Feaster B, McMichael AJ. Epidemiology of alopecia areata in Black patients: a retrospective chart review. J Am Acad Dermatol. 2022;87:1121-1123.
- Lee HH, Gwillim E, Patel KR, et al. Epidemiology of alopecia areata, ophiasis, totalis, and universalis: a systematic review and meta-analysis. J Am Acad Dermatol. 2020;82:675-682.
- Mostaghimi A, Gao W, Ray M, et al. Trends in prevalence and incidence of alopecia areata, alopecia totalis, and alopecia universalis among adults and children in a US employer-sponsored insured population. JAMA Dermatol. 2023;159:411-418.
- Adhanom R, Ansbro B, Castelo-Soccio L. Epidemiology of pediatric alopecia areata. Pediatr Dermatol. 2025;42 suppl 1(suppl 1):12-23.
- Karampinis E, Toli O, Georgopoulou KE, et al. Exploring pediatric dermatology in skin of color: focus on dermoscopy. Life (Basel). 2024;14:1604.
- King BA, Senna MM, Ohyama M, et al. Defining severity in alopecia areata: current perspectives and a multidimensional framework. Dermatol Ther (Heidelb). 2022;12:825-834.
- Toussi A, Barton VR, Le ST, et al. Psychosocial and psychiatric comorbidities and health-related quality of life in alopecia areata: a systematic review. J Am Acad Dermatol. 2021;85:162-175.
- Kalil L, Welch D, Heath CR, et al. Systemic therapies for pediatric alopecia areata. Pediatr Dermatol. 2025;42 suppl 1:36-42.
- King BA, Craiglow BG. Janus kinase inhibitors for alopecia areata. J Am Acad Dermatol. 2023;89:S29-S32.
- Klein EJ, Taiwò D, Kakpovbia E, et al. Disparities in Janus kinase inhibitor access for alopecia areata: a retrospective analysis. Int J Womens Dermatol. 2024;10:E155.
- McKenzie PL, Maltenfort M, Bruckner AL, et al. Evaluation of the prevalence and incidence of pediatric alopecia areata using electronic health record data. JAMA Dermatol. 2022;158:547-551. doi:10.1001/jamadermatol.2022.0351
The Comparison
A. Alopecia areata in a young girl with a lighter skin tone. The fine white vellus hairs are signs of regrowth.
B. Alopecia areata in a 49-year-old man with tightly coiled hair and darker skin tone. Coiled white hairs are noted in the alopecia patches.
Alopecia areata (AA) is a common autoimmune condition characterized by hair loss resulting from a T cell–mediated attack on the hair follicles. It manifests as nonscarring patches of hair loss on the scalp, eyebrows, eyelashes, and beard area as well as more extensive complete loss of scalp and body hair. While AA may affect individuals of any age, most patients develop their first patch(es) of hair loss during childhood.1 The treatment landscape for AA has evolved considerably in recent years, but barriers to access to newer treatments persist.
Epidemiology
Alopecia areata is most prevalent among pediatric and adult individuals of African, Asian, or Hispanic/Latino descent.2-4 In some studies, Black individuals had higher odds and Asian individuals had lower odds of developing AA, while other studies have reported the highest standardized prevalence among Asian individuals.5 In the United States, AA affects about 1.47% of adults and as many as 0.11% of children.6-8 In Black patients, AA often manifests early with a female predominance.5
Alopecia areata frequently is associated with autoimmune comorbidities, the most common being thyroid disease.3,5 In Black patients, AA is associated with more atopic comorbidities, including asthma, atopic dermatitis, and allergic rhinitis.5
Key Clinical Features
Alopecia areata clinically manifests similarly across different skin tones; however, in patients with more tightly coiled or curly hair, the extent of scalp hair loss may be underestimated without a full examination. Culturally sensitive approaches to hair and scalp evaluation are essential, especially for Black women, whose hair care practices and scalp conditions may be overlooked or misunderstood during visits to evaluate hair loss. A thoughtful history and gentle examination of the hair and scalp that considers hair texture, cultural practices such as head coverings (eg, headwraps, turbans, hijabs), use of hair adornments (eg, clips, beads, bows), traditional braiding, and use of natural oils or herbal treatments, as well as styling methods including tight hairstyles, use of heat styling tools (eg, flat irons, curling irons), chemical application (eg, straighteners, hair color), and washing or styling frequency can improve diagnostic accuracy and help build trust in the patient-provider relationship.
Classic signs of AA visualized with dermoscopy include yellow and/or black dots on the scalp and exclamation point hairs. The appearance of fine white vellus hairs within the alopecic patches also may indicate early regrowth. On scalp trichoscopy, black dots are more prominent, and yellow dots are less prominent, in individuals with darker skin tones vs lighter skin tones.9
Worth Noting
In addition to a full examination of the scalp, documenting the extent of hair loss using validated severity scales, including the severity of alopecia tool (SALT), alopecia areata severity index (AASI), clinician-reported outcome assessment, and patient-reported outcome measures, can standardize disease severity assessment, facilitate timely insurance or medication approvals, and support objective tracking of treatment response, which may ultimately enhance access to care.10
Prompt treatment of AA is essential. Not surprisingly, patients given a diagnosis of AA may experience considerable emotional and psychological distress—regardless of the extent of the loss.11 Treatment options include mid- to high-potency topical or intralesional corticosteroids and newer and more targeted systemic options, including 3 Janus kinase (JAK) inhibitors—baricitinib, ritlecitinib, and deuruxolitinib—for more extensive disease.12 Treatment with intralesional corticosteroids may cause transient hypopigmentation, which may be more noticeable in patients with darker skin tones. Delays in treatment with JAK inhibitors can lead to a less-than-optimal response. Of the 3 JAK inhibitors that are approved by the US Food and Drug Administration for AA, only ritlecitinib is approved for children 12 years and older, leaving a therapeutic gap for younger patients that often leads to uncomfortable scalp injections, delayed or no treatment, off-label use of JAK inhibitors as well as the pairing of off-label dupilumab with oral minoxidil.12
Based on adult data, patients with severe disease and a shorter duration of hair loss (ie, <4 years) tend to respond better to JAK inhibitors than those experiencing hair loss for longer periods. Also, those with more severe AA tend to have poorer outcomes than those with less severe disease.13 If treatment proves less than optimal, wigs and hair pieces may need to be considered. It is worth noting that some insurance companies will cover the cost of wigs for patients when prescribed as cranial prostheses.
Health Disparity Highlight
Health disparities in AA can be influenced by socioeconomic status and access to care. Patients from lower-income backgrounds often face barriers to accessing dermatologic care and treatments such as JAK inhibitors, which may remain inaccessible due to high costs and insurance limitations.14 These barriers can intersect with other factors such as age, sex, and race, potentially exacerbating disparities. Women with skin of color in underserved communities may experience delayed diagnosis, limited treatment options, and greater psychosocial distress from hair loss.14 Addressing these inequities requires advocacy, education for both patients and clinicians, and improved access to treatment to ensure comprehensive care for all patients.
- Kara T, Topkarcı Z. Interactions between posttraumatic stress disorder and alopecia areata in child with trauma exposure: two case reports. Int J Trichology. 2018;10:131-134. doi:10.4103/ijt.ijt_2_18
- Sy N, Mastacouris N, Strunk A, et al. Overall and racial and ethnic subgroup prevalences of alopecia areata, alopecia totalis, and alopecia universalis. JAMA Dermatol. 2023;159:419-423.
- Lee H, Jung SJ, Patel AB, et al. Racial characteristics of alopecia areata in the United States. J Am Acad Dermatol. 2020;83:1064-1070.
- Feaster B, McMichael AJ. Epidemiology of alopecia areata in Black patients: a retrospective chart review. J Am Acad Dermatol. 2022;87:1121-1123.
- Lee HH, Gwillim E, Patel KR, et al. Epidemiology of alopecia areata, ophiasis, totalis, and universalis: a systematic review and meta-analysis. J Am Acad Dermatol. 2020;82:675-682.
- Mostaghimi A, Gao W, Ray M, et al. Trends in prevalence and incidence of alopecia areata, alopecia totalis, and alopecia universalis among adults and children in a US employer-sponsored insured population. JAMA Dermatol. 2023;159:411-418.
- Adhanom R, Ansbro B, Castelo-Soccio L. Epidemiology of pediatric alopecia areata. Pediatr Dermatol. 2025;42 suppl 1(suppl 1):12-23.
- Karampinis E, Toli O, Georgopoulou KE, et al. Exploring pediatric dermatology in skin of color: focus on dermoscopy. Life (Basel). 2024;14:1604.
- King BA, Senna MM, Ohyama M, et al. Defining severity in alopecia areata: current perspectives and a multidimensional framework. Dermatol Ther (Heidelb). 2022;12:825-834.
- Toussi A, Barton VR, Le ST, et al. Psychosocial and psychiatric comorbidities and health-related quality of life in alopecia areata: a systematic review. J Am Acad Dermatol. 2021;85:162-175.
- Kalil L, Welch D, Heath CR, et al. Systemic therapies for pediatric alopecia areata. Pediatr Dermatol. 2025;42 suppl 1:36-42.
- King BA, Craiglow BG. Janus kinase inhibitors for alopecia areata. J Am Acad Dermatol. 2023;89:S29-S32.
- Klein EJ, Taiwò D, Kakpovbia E, et al. Disparities in Janus kinase inhibitor access for alopecia areata: a retrospective analysis. Int J Womens Dermatol. 2024;10:E155.
- McKenzie PL, Maltenfort M, Bruckner AL, et al. Evaluation of the prevalence and incidence of pediatric alopecia areata using electronic health record data. JAMA Dermatol. 2022;158:547-551. doi:10.1001/jamadermatol.2022.0351
Erythematous Rash on the Face and Neck
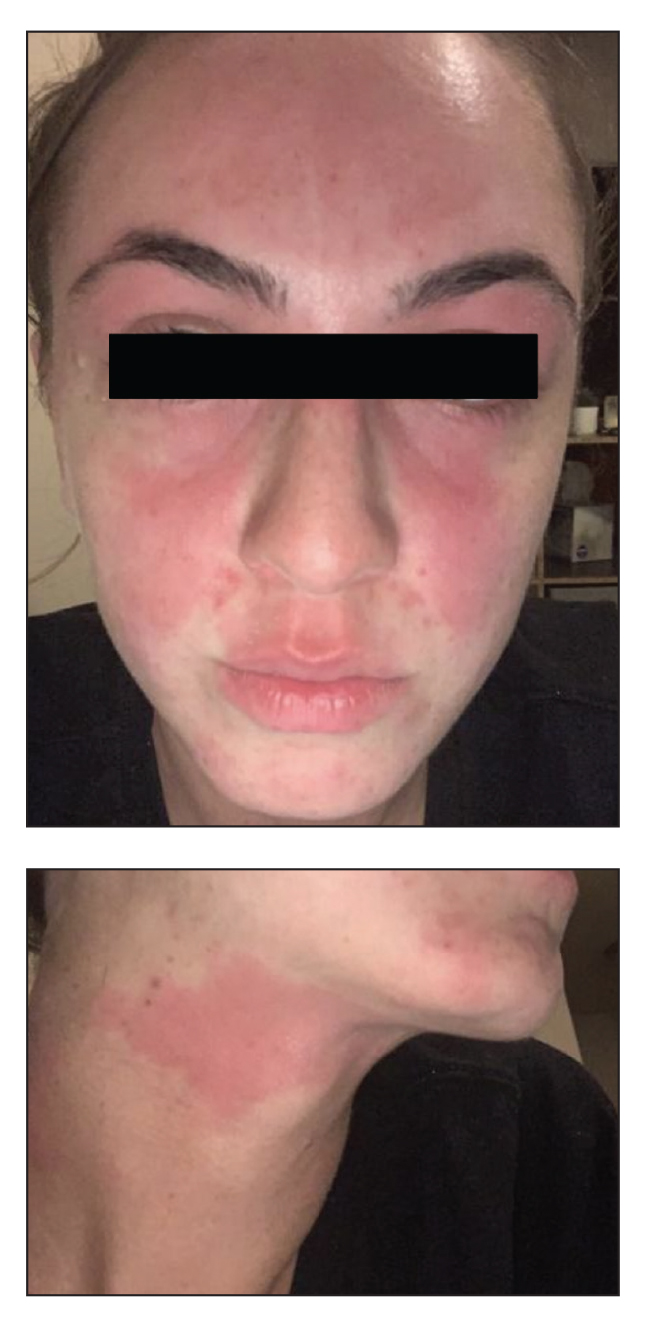
The Diagnosis: Allergic Contact Dermatitis
In our patient, the erythematous pruritic rash on the face and neck, the lack of systemic symptoms, and her history of atopic dermatitis suggested a diagnosis of allergic contact dermatitis (ACD). She underwent patch testing with standard, fragrance, and cosmetic panels in addition to 6 of her personal care products. Her first patch test, which was read on day 2, showed a positive reaction to isopropyl myristate (IPM), a penetration enhancer used in cosmetics, topical medications (eg, tretinoin), and cosmeceuticals. The reading on day 5 showed a 2+ reaction to IPM, which was found in several of her personal care products, including her shampoo, leave-in conditioner, and eczema-calming cream. Isopropyl myristate is used in these products because of its ability to enhance their penetration into the skin and also can be found in commercially used products such as hand sanitizers. The patient was given information on this allergen and how to identify and avoid triggers. At follow-up, the ACD had resolved with avoidance of IPM.
Contact dermatitis is an inflammatory skin condition that is triggered by contact with a specific causative agent. There are 2 types of contact dermatitis: irritant and allergic; the irritant type is more common (approximately 80% of cases worldwide).1 Allergic contact dermatitis is a type IV (delayed-type) hypersensitivity reaction; common causative agents include shampoos, moisturizers, makeup, certain metals (eg, nickel), fragrances, latex, and certain plants (eg, poison ivy).2 In cases of ACD, a new reaction can develop from exposure to a product that the patient has used for years. It manifests clinically as erythema, pruritus, scaling, and vesicle formation.1 Certain populations, such as those with atopic dermatitis, are more prone to developing ACD due to a breakdown of the skin barrier, frequent use of topical products, and immune dysregulation.1,2 Patch testing performed by dermatologists and allergists is the gold standard for diagnosing ACD.1,3
Annually, allergists, dermatologists, and primary care physicians see thousands of cases of contact dermatitis.1 Early recognition and appropriate treatment can help reduce the severity and duration of symptoms and improve patient outcomes. The main treatment for ACD is identification of the causative agent followed by patient education on how to identify and avoid triggers.2 Once patch testing has been completed, patients can be given access to the American Contact Dermatitis Society’s Contact Allergen Management Program (CAMP) database (https://www.contactderm.org/resources/acds-camp) to help them identify and avoid products that contain triggering allergens.
Topical corticosteroids are the first-line pharmacologic treatments for atopic dermatitis.4 When our patient presented with the facial rash, her atopic dermatitis had been well controlled with both dupilumab and topical triamcinolone. The lack of response to previously successful therapies in a new area of involvement made a flare of atopic dermatitis less likely. For flares of ACD after exposure, topical corticosteroids and topical calcineurin inhibitors can help. If needed due to severity, oral corticosteroids also can be used.1
Dermatomyositis is an inflammatory myopathy that has several skin manifestations, including a heliotrope rash and poikiloderma.5 While our patient’s rash covered the periorbital area, she did not have other classic skin findings of dermatomyositis, such as nail-fold capillary changes or poikiloderma in a shawl or holster distribution.6 She also lacked signs of systemic involvement including myositis and elevated C-reactive protein (CRP), erythrocyte sedimentation rate (ESR), and creatine kinase levels.5
Erythematotelangiectatic rosacea is characterized by telangiectasias and transient flushing and erythema on the central face.5 Rosacea typically is triggered by temperature changes, alcohol consumption, sun exposure, spicy foods, and stress5 and would be expected to involve the nose, which was not observed in our patient. The fixed nature of our patient’s patches and the absence of telangiectasias also argued against this diagnosis.
The classic cutaneous finding of systemic lupus erythematosus is a malar rash, which appears as erythematous patches or thin plaques across the bridge of the nose and over the cheeks, sparing the nasolabial folds.5 Systemic lupus erythematosus is associated with laboratory abnormalities, such as positive antinuclear antibodies and elevated CRP and ESR levels.5 Our patient had notable sparing of the nose, negative antinuclear antibodies, and normal CRP and ESR levels, making systemic lupus erythematosus unlikely. Systemic lupus erythematosus also can manifest with photosensitivity,7 and involvement of the submental skin in our patient argued against a photosensitive eruption.
- Nassau S, Fonacier L. Allergic contact dermatitis. Med Clin North Am. 2020;104:61-76. doi:10.1016/j.mcna.2019.08.012
- Fonacier LS, Sher JM. Allergic contact dermatitis. Ann Allergy Asthma Immunol. 2014;113:9-12. doi:10.1016/j.anai.2014.03.018
- Uyesugi BA, Sheehan MP. Patch testing pearls. Clin Rev Allergy Immunol. 2019;56:110-118. doi:10.1007/s12016-018-8715-y
- Kapur S, Watson W, Carr S. Atopic dermatitis. Allergy Asthma Clin Immunol. 2018;14(suppl 2):52. doi:10.1186/s13223-018-0281-6
- Naji S. Malar rash. StatPearls. Updated September 4, 2023. Accessed June 30, 2025. https://www.statpearls.com/point-of-care/24661
- Muro Y, Sugiura K, Akiyama M. Cutaneous manifestations in dermatomyositis: key clinical and serological features—a comprehensive review. Clin Rev Allergy Immunol. 2016;51:293-302. doi:10.1007 /s12016-015-8496-5
- Hannon CW, McCourt C, Lima HC, et al. Interventions for cutaneous disease in systemic lupus erythematosus. Cochrane Database Syst Rev. 2021;3(3):CD007478. doi:10.1002/14651858.CD007478.pub2
The Diagnosis: Allergic Contact Dermatitis
In our patient, the erythematous pruritic rash on the face and neck, the lack of systemic symptoms, and her history of atopic dermatitis suggested a diagnosis of allergic contact dermatitis (ACD). She underwent patch testing with standard, fragrance, and cosmetic panels in addition to 6 of her personal care products. Her first patch test, which was read on day 2, showed a positive reaction to isopropyl myristate (IPM), a penetration enhancer used in cosmetics, topical medications (eg, tretinoin), and cosmeceuticals. The reading on day 5 showed a 2+ reaction to IPM, which was found in several of her personal care products, including her shampoo, leave-in conditioner, and eczema-calming cream. Isopropyl myristate is used in these products because of its ability to enhance their penetration into the skin and also can be found in commercially used products such as hand sanitizers. The patient was given information on this allergen and how to identify and avoid triggers. At follow-up, the ACD had resolved with avoidance of IPM.
Contact dermatitis is an inflammatory skin condition that is triggered by contact with a specific causative agent. There are 2 types of contact dermatitis: irritant and allergic; the irritant type is more common (approximately 80% of cases worldwide).1 Allergic contact dermatitis is a type IV (delayed-type) hypersensitivity reaction; common causative agents include shampoos, moisturizers, makeup, certain metals (eg, nickel), fragrances, latex, and certain plants (eg, poison ivy).2 In cases of ACD, a new reaction can develop from exposure to a product that the patient has used for years. It manifests clinically as erythema, pruritus, scaling, and vesicle formation.1 Certain populations, such as those with atopic dermatitis, are more prone to developing ACD due to a breakdown of the skin barrier, frequent use of topical products, and immune dysregulation.1,2 Patch testing performed by dermatologists and allergists is the gold standard for diagnosing ACD.1,3
Annually, allergists, dermatologists, and primary care physicians see thousands of cases of contact dermatitis.1 Early recognition and appropriate treatment can help reduce the severity and duration of symptoms and improve patient outcomes. The main treatment for ACD is identification of the causative agent followed by patient education on how to identify and avoid triggers.2 Once patch testing has been completed, patients can be given access to the American Contact Dermatitis Society’s Contact Allergen Management Program (CAMP) database (https://www.contactderm.org/resources/acds-camp) to help them identify and avoid products that contain triggering allergens.
Topical corticosteroids are the first-line pharmacologic treatments for atopic dermatitis.4 When our patient presented with the facial rash, her atopic dermatitis had been well controlled with both dupilumab and topical triamcinolone. The lack of response to previously successful therapies in a new area of involvement made a flare of atopic dermatitis less likely. For flares of ACD after exposure, topical corticosteroids and topical calcineurin inhibitors can help. If needed due to severity, oral corticosteroids also can be used.1
Dermatomyositis is an inflammatory myopathy that has several skin manifestations, including a heliotrope rash and poikiloderma.5 While our patient’s rash covered the periorbital area, she did not have other classic skin findings of dermatomyositis, such as nail-fold capillary changes or poikiloderma in a shawl or holster distribution.6 She also lacked signs of systemic involvement including myositis and elevated C-reactive protein (CRP), erythrocyte sedimentation rate (ESR), and creatine kinase levels.5
Erythematotelangiectatic rosacea is characterized by telangiectasias and transient flushing and erythema on the central face.5 Rosacea typically is triggered by temperature changes, alcohol consumption, sun exposure, spicy foods, and stress5 and would be expected to involve the nose, which was not observed in our patient. The fixed nature of our patient’s patches and the absence of telangiectasias also argued against this diagnosis.
The classic cutaneous finding of systemic lupus erythematosus is a malar rash, which appears as erythematous patches or thin plaques across the bridge of the nose and over the cheeks, sparing the nasolabial folds.5 Systemic lupus erythematosus is associated with laboratory abnormalities, such as positive antinuclear antibodies and elevated CRP and ESR levels.5 Our patient had notable sparing of the nose, negative antinuclear antibodies, and normal CRP and ESR levels, making systemic lupus erythematosus unlikely. Systemic lupus erythematosus also can manifest with photosensitivity,7 and involvement of the submental skin in our patient argued against a photosensitive eruption.
- Nassau S, Fonacier L. Allergic contact dermatitis. Med Clin North Am. 2020;104:61-76. doi:10.1016/j.mcna.2019.08.012
- Fonacier LS, Sher JM. Allergic contact dermatitis. Ann Allergy Asthma Immunol. 2014;113:9-12. doi:10.1016/j.anai.2014.03.018
- Uyesugi BA, Sheehan MP. Patch testing pearls. Clin Rev Allergy Immunol. 2019;56:110-118. doi:10.1007/s12016-018-8715-y
- Kapur S, Watson W, Carr S. Atopic dermatitis. Allergy Asthma Clin Immunol. 2018;14(suppl 2):52. doi:10.1186/s13223-018-0281-6
- Naji S. Malar rash. StatPearls. Updated September 4, 2023. Accessed June 30, 2025. https://www.statpearls.com/point-of-care/24661
- Muro Y, Sugiura K, Akiyama M. Cutaneous manifestations in dermatomyositis: key clinical and serological features—a comprehensive review. Clin Rev Allergy Immunol. 2016;51:293-302. doi:10.1007 /s12016-015-8496-5
- Hannon CW, McCourt C, Lima HC, et al. Interventions for cutaneous disease in systemic lupus erythematosus. Cochrane Database Syst Rev. 2021;3(3):CD007478. doi:10.1002/14651858.CD007478.pub2
A 23-year-old woman with atopic dermatitis and seasonal allergic rhinitis presented to the dermatology department with an erythematous pruritic rash of 1 year’s duration involving the forehead, periorbital and submental skin, and neck. The patient’s atopic dermatitis was stable and had been well controlled with dupilumab and topical triamcinolone as needed for flares. The patient denied any other symptoms including fever, fatigue, and muscle weakness. Physical examination of the hands and nails revealed no abnormalities. She was treated with topical triamcinolone acetonide 0.1% without improvement. Short-term prednisone tapers fully resolved the rash, but it recurred within 5 days after discontinuation of prednisone. Results of testing for rheumatoid factor, antinuclear antibodies, complete blood count, comprehensive metabolic panel, C-reactive protein, erythrocyte sedimentation rate, and antistreptolysin O antibodies were unremarkable.

Spironolactone for Acne: Practical Strategies for Optimal Clinical Outcomes
Spironolactone for Acne: Practical Strategies for Optimal Clinical Outcomes
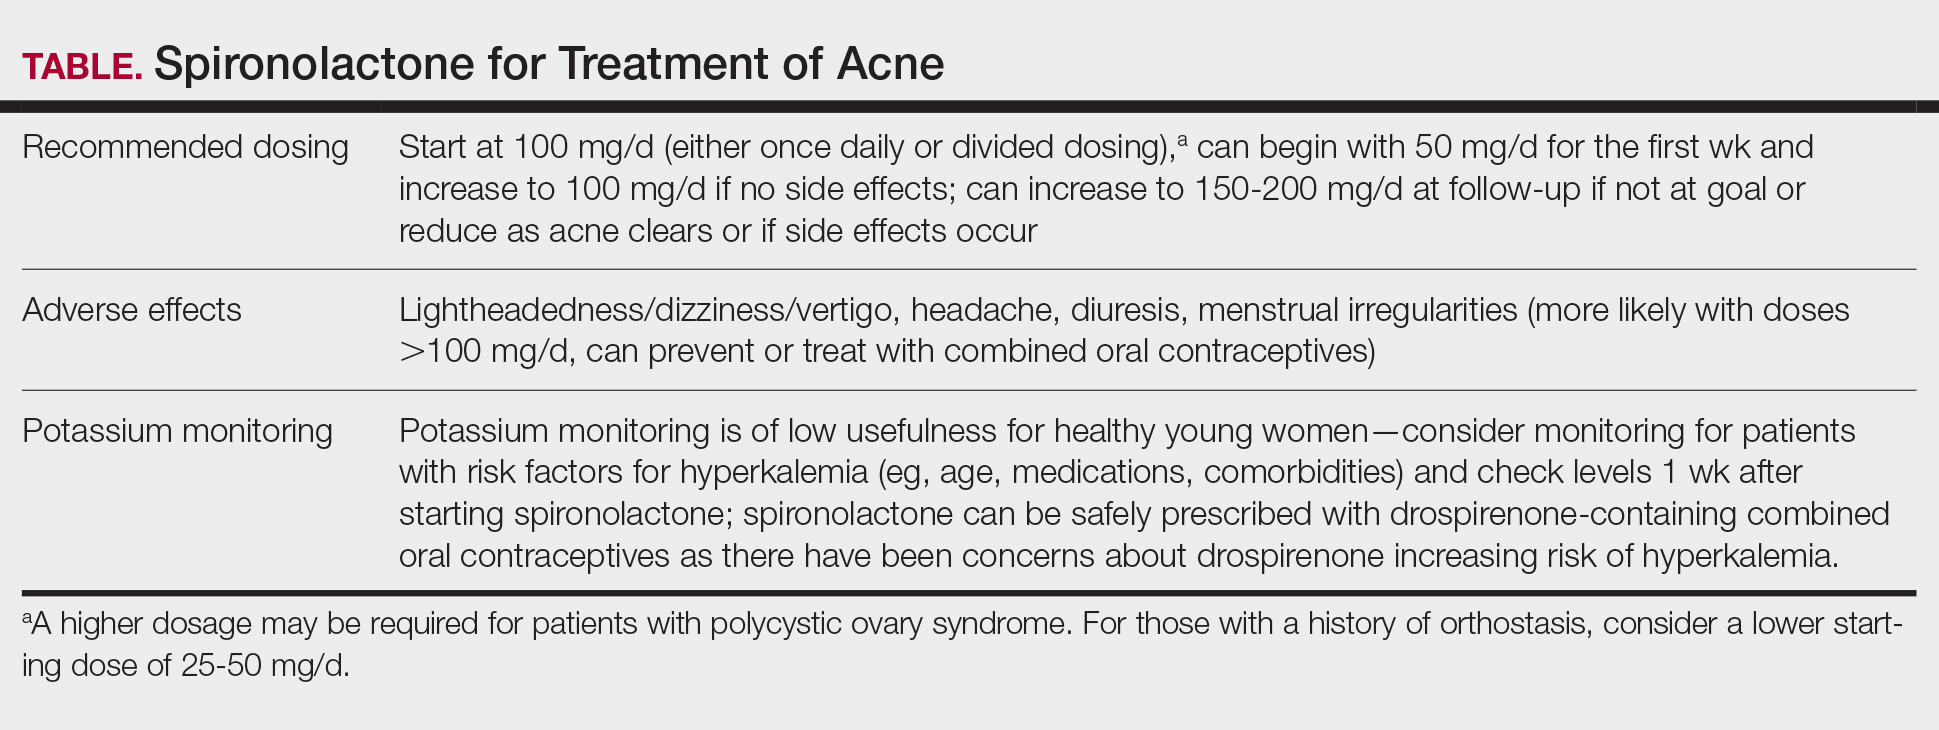
Spironolactone is increasingly used off label for acne treatment and is now being prescribed for women with acne at a frequency similar to oral antibiotics.1,2 In this article, we provide an overview of spironolactone use for acne treatment and discuss recent clinical trials and practical strategies for patient selection, dosing, adverse effect management, and monitoring (Table).
History and Mechanism of Action
Because sebaceous gland activity is an important component of acne pathogenesis and is regulated by androgens,3 there has long been interest in identifying treatment strategies that can target the role of hormones in activating the sebaceous gland. In the 1980s, it became apparent that spironolactone, originally developed as a potassium-sparing diuretic, also might possess antiandrogenic properties that could be useful in the treatment of acne.4 Spironolactone has been found to decrease testosterone production, inhibit testosterone and dihydrotestosterone binding to androgen receptors,5-8 and block 5α-reductase receptors of the sebaceous glands of skin.9
In 1984, Goodfellow et al10 conducted a trial in which 36 male and female patients with severe acne were randomized to placebo or spironolactone doses ranging from 50 to 200 mg/d. They found that spironolactone resulted in dose-dependent reductions of sebum production as well as improvement in patient- and clinician-reported assessments of acne. In 1986, another placebo-controlled crossover trial by Muhlemann et al11 provided further support for the effectiveness of spironolactone for acne. This trial randomized 21 women to placebo or spironolactone 200 mg/d and found that spironolactone was associated with statistically significant (P<.001) improvements in acne lesion counts.
Recent Observational Studies and Trials
Following these early trials, several large case series have been published describing the successful use of spironolactone for acne, including a 2020 retrospective case series from the Mayo Clinic describing 395 patients.12 The investigators found that almost 66% of patients had a complete response and almost 85% had a complete response or a partial response greater than 50%. They also found that the median time to initial response and maximal response were 3 and 5 months, respectively, and that efficacy was observed across acne subtypes, including for nodulocystic acne.12 In addition, a 2021 case series describing 403 patients treated with spironolactone found that approximately 80% had reduction or complete clearance of acne, with improvements observed for both facial and truncal acne. In this cohort, doses of 100 to 150 mg/d typically were the most successful.13 A case series of 80 adolescent females also highlighted the efficacy of spironolactone in younger populations.14
Adding to these observational data, the multicenter, phase 3, double-blind Spironolactone for Adult Female Acne (SAFA) trial included 410 women (mean age, 29.2 years) who were randomized to receive either placebo or intervention (spironolactone 50 mg/d until week 6 and 100 mg/d until week 24).15 At 24 weeks, greater improvement in quality of life and participant self-assessed improvement were observed in the spironolactone group. In addition, at 12 weeks, rates of success were higher in the spironolactone group using the Investigator Global Assessment score (adjusted odds ratio 5.18 [95% CI, 2.18- 12.28]). Those randomized to receive spironolactone also had lower rates of oral antibiotic use at 52 weeks than the placebo group did (5.8% vs 13.5%, respectively).
In the SAFA trial, spironolactone was well tolerated; the most common adverse effects relative to placebo were lightheadedness (19% for spironolactone vs 12% for placebo) and headache (20% for spironolactone vs 12% for placebo). Notably, more than 95% of patients were able to increase from 50 mg/d to 100 mg/d at week 6, with greater than 90% tolerating 100 mg/d. As observational data suggest that spironolactone takes 3 to 5 months to reach peak efficacy, these findings provide further support that starting at a dose of at least 100 mg/d is likely optimal for most patients.16
A Potential Alternative to Oral Antibiotics
Oral antibiotics such as tetracyclines have long played a central role in the treatment of acne and remain a first-line treatment option.17 In addition, many of these antibiotic courses exceed 6 months in duration.1 In fact, dermatologists prescribe more antibiotics per capita than any other specialty1,18-20; however, this can be associated with the development of antibiotic resistance,21,22 as well as other antibiotic-associated complications, including inflammatory bowel disease,23 pharyngitis,24 Clostridium difficile infections, and cancer.25-29
In addition to these concerns, many patients may prefer nonantibiotic alternatives to oral antibiotics, with more than 75% preferring a nonantibiotic option if available. For female patients with acne, antiandrogens such as spironolactone have been suggested as a potential alternative.30 A 10-year retrospective study of female patients with acne found that those who had ever received hormonal therapy (ie, spironolactone or a combined oral contraceptive) received fewer cumulative days of oral antibiotics than those who did not (226 days vs 302 days, respectively).31 In addition, while oral antibiotics were the most common initial therapy prescribed for patients, as they progressed through their treatment course, more patients ended up on hormonal therapy than oral antibiotics. This study suggests that hormonal therapy such as spironolactone could represent an alternative to the use of systemic antibiotics.31
Further supporting the role of spironolactone as an alternative to oral antibiotics, a 2018 analysis of claims data found that spironolactone may have similar effectiveness to oral antibiotics for the treatment of acne.32 After adjusting for age and topical retinoid and oral contraceptive use, this study found that there was no significant difference in the odds of being prescribed a different systemic treatment within 1 year (ie, treatment failure) among those starting spironolactone vs those starting oral tetracycline-class antibiotics as their initial therapy for acne.
A multicenter, randomized, double-blind trial (Female Acne Spironolactone vs doxyCycline Efficacy [FASCE]) also evaluated the comparative effectiveness of doxycycline 100 mg/d for 3 months followed by an oral placebo for 3 months vs spironolactone 150 mg/d for 6 months among 133 adult women with acne. This study found that spironolactone had statistically significantly greater rates of Investigator Global Assessment treatment success after 6 months (odds ratio 2.87 [95% CI, 1.38-5.99; P=.007]).33 Since spironolactone historically has been prescribed less often than oral antibiotics for women with acne, these findings support spironolactone as an underutilized treatment alternative. The ongoing Spironolactone versus Doxycycline for Acne: A Comparative Effectiveness, Noninferiority Evaluation trial—a 16-week, blinded trial comparing 100 mg/d doses of both drugs—should provide additional evidence regarding the relative role of spironolactone and oral antibiotics in the management of acne.34
Ultimately, the decision to use spironolactone or other treatments such as oral antibiotics should be based on shared decision making between clinician and patient. Spironolactone has a relatively slow onset of efficacy, and other options such as oral antibiotics might be preferred by those looking for more immediate results; however, as women with acne often have activity that persists into adulthood, spironolactone might be preferable as a long-term maintenance therapy to avoid complications of prolonged antibiotic use.35 Comorbidities also will influence the optimal choice of therapy (eg, spironolactone might be preferred in someone with inflammatory bowel disease, and oral antibiotics might be preferred in someone with orthostatic hypotension).
Patient Selection
Acne occurring along the lower face or jawline in adult women sometimes is referred to as hormonal acne, but this dogma is not particularly evidence based. An observational study of 374 patients found that almost 90% of adult women had acne involving multiple facial zones with a spectrum of facial acne severity similar to that in adolescents.36 Only a small subset of these patients (11.2%) had acne localized solely to the mandibular area. In addition, acne along the lower face is not predictive of hyperandrogenism (eg, polycystic ovary syndrome).37 Antiandrogen therapies such as spironolactone and clascoterone are effective in both men and women with acne10,38 and in adolescents and adults, suggesting that hormones play a fundamental role in all acne and that addressing this mechanism can be useful broadly. Therefore, hormonal therapies such as spironolactone should not be restricted to only adult women with acne along the lower face.
While spironolactone can be effective for acne treatment in any age group, it may be most effective for adult women with acne. In the SAFA trial, prespecified subgroup analyses showed a statistically significant (P=.005) interaction term for age (categorized as <25 years and ≥25 years), which suggested that spironolactone might be a more effective treatment for women 25 years and older.15 In addition, subgroup analyses in the aforementioned 2018 analysis of claims data found that spironolactone was more effective relative to oral antibiotics in adults vs adolescents.32 Despite these limitations, several case series have highlighted that spironolactone is effective among adolescent populations with acne. A case series of spironolactone use in 73 patients aged 19 years or younger found that 68% of patients demonstrated resolution or improvement in their acne after spironolactone treatment.39 Another case series among 80 adolescent females reported 80% of patients experiencing improvement of their acne.14
For those with more severe acne, spironolactone can be combined with other complementary treatment approaches such as topicals, oral antibiotics, or procedural modalities.40
Dosing
We recommend starting spironolactone at a dose of 100 mg/d (the patient can take 50 mg/d for 1 week, then increase to 100 mg/d if there are no adverse effects at the lower dose). In the 1984 trial by Goodfellow et al,10 participants were randomized to doses of 50 mg/d, 100 mg/d, 150 mg/d, and 200 mg/d. In this trial, efficacy assessed by objective and subjective outcomes did not plateau until doses of 100 mg/d to 150 mg/d. In addition, a case series of 403 patients found that the most successful dosage of spironolactone generally was 100 mg/d or higher.13 Most of the patients who were started at this dosage either stayed at this level or escalated, whereas patients who started at lower dosages (25-75 mg/d) frequently increased their dosage over time. The SAFA trial also highlighted that most patients can tolerate a spironolactone dose of 100 mg/d.15 For specific populations, such as patients with polycystic ovary syndrome, a higher dose (mean dosage of 143 mg/d) may be required for efficacy.41 Given the slow onset of efficacy, typically taking 3 to 5 months, and the low rate of adverse effects, we believe the optimal starting dose is 100 mg/s to 150 mg/d. If adverse effects occur or lesions clear, then the dosage may be reduced.
Adverse Effects
Spironolactone generally is well tolerated; in the SAFA and FASCE trials, fewer than 1% of participants discontinued due to adverse effects.15,33 Rates of discontinuation due to adverse effects typically have been less than 5% in case series of patients treated in routine clinical practice.12-14
Because spironolactone is a diuretic and antihypertensive, the most common adverse effects are related to these characteristics. In the SAFA trial, dizziness, lightheadedness, and vertigo were reported more commonly in the spironolactone group than in the placebo group (19% vs 12%, respectively). Similarly, headaches also were reported more frequently in the spironolactone group than in the placebo group (20% vs 12%, respectively).15 One case series found that, among the 267 patients on spironolactone whose blood pressure was monitored, the mean reduction in systolic blood pressure was 3.5 mm Hg and the mean reduction in diastolic blood pressure was 0.9 mm Hg.13 For those with baseline orthostasis or in those who experience adverse effects related to hypotension, reducing the dose often can be helpful. Of note, while doses of 100 mg/d to 150 mg/d often are the most effective, randomized trials have found that spironolactone still can be effective for acne at doses as low as 25 mg/d to 50 mg/d.10,38
Menstrual irregularities are another commonly cited adverse effect of spironolactone. While a systematic review found that 15% to 30% of patients treated with spironolactone experience menstrual irregularities, it has been difficult to evaluate whether this is due to the medication or other comorbidities, such as polycystic ovary syndrome.42 Notably, in the SAFA trial, rates of menstrual irregularities were equivalent between the spironolactone and placebo groups at a dose of 100 mg/d (32% vs 35%, respectively).15 In contrast, in the FASCE trial, menstrual irregularities were more commonly reported at a dose of 150 mg/d.33 These findings are consistent with observational data suggesting that menstrual irregularities are much more common at spironolactone doses greater than 100 mg/d.42 Additionally, some evidence supports that for some patients these menstrual irregularities may resolve within 2 to 3 months of continued treatment.43 It has been noted in several studies that menstrual irregularities are less likely to occur in patients who are using combined oral contraceptives; therefore, for patients who are amenable and have no contraindications, combined oral contraceptives can be considered to prevent or address menstrual irregularities.13,42,44
More generally, combined oral contraceptives can be an excellent combination with spironolactone, as they have complementary characteristics. Spironolactone primarily blocks the effects of androgens, while combined oral contraceptives predominantly block the production of androgens. Whereas spironolactone typically causes hypotension and menstrual irregularities, combined oral contraceptives cause hypertension and help to regulate the menstrual cycle.
Spironolactone carries an official US Food and Drug Administration warning regarding possible tumorigenicity that is based on animal studies that used up to 150 times the normal dose of spironolactone used in humans45; however, observational studies in humans have not identified such an association when spironolactone is used in normal clinical settings. A systematic review and metanalysis in 2022 reviewed data from a total population of more than 4 million individuals and found that there was no statistically significant association between spironolactone use and the risk for breast, ovarian, bladder, kidney, gastric, or esophageal cancers.46 Additional studies also found no association between spironolactone use and cancers.48 A more recent cohort study specifically among patients treated with spironolactone for acne also found no significant increased risk for breast cancer.49
Combined oral contraceptives are associated with an increased risk for venous thromboembolisms, and there have been concerns that this risk may be greater in combined oral contraceptives that contain drospirenone.50 Drospirenone is molecularly related to spironolactone, which has prompted the consideration of whether spironolactone use also conveys a risk for venous thromboembolism. Reassuringly, a retrospective study of claims data found that individuals on spironolactone were not more likely to develop a pulmonary embolism or a deep venous thrombosis than matched controls treated with tetracycline antibiotics, with a point estimate favoring decreased risk.51
Monitoring
Given that one of spironolactone’s mechanisms of action is aldosterone antagonism and thus the inhibition of potassium excretion, there have been concerns regarding risk for hyperkalemia. A retrospective study analyzing data from 2000 to 2014 found that, among 974 young women receiving spironolactone therapy, the rate of hyperkalemia was 0.72%, which is equivalent to the 0.76% baseline rate of hyperkalemia in the same population.52 Subsequent studies also have found that spironolactone does not appear to be associated with a meaningful risk for hyperkalemia among young healthy patients treated for acne.38,53 These studies suggest that routine potassium monitoring is of low usefulness for healthy young women taking spironolactone for acne. The 2024 American Academy of Dermatology guidelines on the management of acne also state that potassium monitoring is not needed in healthy patients but that potassium testing should be considered for those with risk factors for hyperkalemia (eg, older age, medical comorbidities, medications).40 Clinicians should still engage in shared decision making with patients to determine whether to check potassium. If potassium is to be monitored, it should be checked 1 to 2 weeks after spironolactone is started.45,54
Since drospirenone also has aldosterone antagonistic properties,55 there have been concerns about whether concomitant use of spironolactone and drospirenone-containing combined oral contraceptives might increase the risk for hyperkalemia.56 However, a retrospective cohort study analyzing data from more than 1 million women found that drospirenone is not any more likely than levonorgestrel to cause hyperkalemia and that there is no interaction between drospirenone and spironolactone for hyperkalemia.57 A subsequent prospective study of 27 women treated with combined oral contraceptives containing ethinyl estradiol/drospirenone and spironolactone also did not find any significant elevations in potassium.58 Data from these studies suggest that spironolactone can safely be co-administered with drospirenone-containing combined oral contraceptives.
Reproductive Risks
Despite its utility in treating acne, spironolactone should not be used during pregnancy, and appropriate pregnancy prevention is recommended. Spironolactone crosses the placenta, and some animal studies have shown feminization of male fetuses.59 While human data are limited to a few case reports that did not demonstrate an association of major malformations,60 it generally is recommended to avoid spironolactone during pregnancy. Small studies have found that spironolactone has minimal transfer to breastmilk and is not associated with adverse effects in breastfed infants.61-63 Accordingly, the World Health Organization considers spironolactone to be compatible with breastfeeding.64 Notably, spironolactone may be associated with lactation suppression65,66; therefore, it may be best if lactating patients ensure that their milk production is established prior to starting spironolactone and to increase their water intake to offset the diuretic effects.
Spironolactone also can result in gynecomastia in men and therefore typically is not prescribed for the treatment of acne in this population in oral form10; however, topical antiandrogens such as clascoterone can be used in both women and men with acne.67
Conclusion
Spironolactone is a well-tolerated and effective treatment for women with acne, both in adult and adolescent populations. It is a potentially underutilized alternative to oral antibiotics. Spironolactone also is affordable, fully covered without any requirements in almost 90% of states under Medicaid and with a monthly cost of only $4.00 when obtained through major retailers in the United States, making it an optimal long-term treatment option for many patients.52,68 We recommend a starting dose of 100 mg/d, which can be increased to 150 mg/d to 200 mg/d if needed for better acne control or decreased if adverse effects occur or acne clears. Potassium monitoring is of low usefulness in young healthy women, and studies have not identified an association between spironolactone use and increased risk for cancer.
- Barbieri JS, James WD, Margolis DJ. Trends in prescribing behavior of systemic agents used in the treatment of acne among dermatologists and nondermatologists: a retrospective analysis, 2004-2013. J Am Acad Dermatol. 2017;77:456-463.e4. doi:10.1016/j.jaad.2017.04.016
- Barbieri JS. Temporal trends in the use of systemic medications for acne from 2017 to 2020. JAMA Dermatol. 2023;159:1135-1136. doi:10.1001 /jamadermatol.2023.2363
- Strauss JS, Pochi PE, Downing DT. Acne: perspectives. J Invest Dermatol. 1974;62:321-325. doi:10.1111/1523-1747.ep12724280
- Luderschmidt C, Bidlingmaier F, Plewig G. Inhibition of sebaceous gland activity by spironolactone in Syrian hamster. J Invest Dermatol. 1982;78:253-255. doi:10.1111/1523-1747.ep12506612
- Boisselle A, Dionne FT, Tremblay RR. Interaction of spironolactone with rat skin androgen receptor. Can J Biochem. 1979;57:1042-1046. doi:10.1139/o79-131
- Menard RH, Stripp B, Gillette JR. Spironolactone and testicular cytochrome P-450: decreased testosterone formation in several species and changes in hepatic drug metabolism. Endocrinology. 1974;94:1628-1636. doi:10.1210/endo-94-6-1628
- Rifka SM, Pita JC, Vigersky RA, et al. Interaction of digitalis and spironolactone with human sex steroid receptors. J Clin Endocrinol Metab. 1978;46:338-344. doi:10.1210/jcem-46-2-338
- Corvol P, Michaud A, Menard J, et al. Antiandrogenic effect of spirolactones: mechanism of action. Endocrinology. 1975;97:52-58. doi:10.1210/endo-97-1-52
- Akamatsu H, Zouboulis CC, Orfanos CE. Spironolactone directly inhibits proliferation of cultured human facial sebocytes and acts antagonistically to testosterone and 5 alpha-dihydrotestosterone in vitro. J Invest Dermatol. 1993;100:660-662. doi:10.1111/1523-1747 .ep12472325
- Goodfellow A, Alaghband-Zadeh J, Carter G, et al. Oral spironolactone improves acne vulgaris and reduces sebum excretion. Br J Dermatol. 1984;111:209-214. doi:10.1111/j.1365-2133.1984.tb04045.x
- Muhlemann MF, Carter GD, Cream JJ, et al. Oral spironolactone: an effective treatment for acne vulgaris in women. Br J Dermatol. 1986;115:227-232. doi:10.1111/j.1365-2133.1986.tb05722.x
- Roberts EE, Nowsheen S, Davis MDP, et al. Treatment of acne with spironolactone: a retrospective review of 395 adult patients at Mayo Clinic, 2007-2017. J Eur Acad Dermatol Venereol. 2020;34:2106-2110. doi:10.1111/jdv.16302
- Garg V, Choi JK, James WD, et al. Long-term use of spironolactone for acne in women: a case series of 403 patients. J Am Acad Dermatol. 2021;84:1348-1355. doi:10.1016/j.jaad.2020.12.071
- Roberts EE, Nowsheen S, Davis DMR, et al. Use of spironolactone to treat acne in adolescent females. Pediatr Dermatol. 2021;38:72-76. doi:10.1111/pde.14391
- Santer M, Lawrence M, Renz S, et al. Effectiveness of spironolactone for women with acne vulgaris (SAFA) in England and Wales: pragmatic, multicentre, phase 3, double blind, randomised controlled trial. BMJ. 2023;381:E074349. doi:10.1136/bmj-2022-074349
- Shields A, Barbieri JS. Effectiveness of spironolactone for women with acne vulgaris (SAFA) trial: a critically appraised topic. Br J Dermatol. 2023;189:509-510. doi:10.1093/bjd/ljad270
- Xu H, Li H. Acne, the skin microbiome, and antibiotic treatment. Am J Clin Dermatol. 2019;20:335-344. doi:10.1007/s40257-018-00417-3
- Knutsen-Larson S, Dawson AL, Dunnick CA, et al. Acne vulgaris: pathogenesis, treatment, and needs assessment. Dermatol Clin. 2012;30:99-106, viii-ix. doi:10.1016/j.det.2011.09.001
- Han JJ, Faletsky A, Barbieri JS, et al. New acne therapies and updates on use of spironolactone and isotretinoin: a narrative review. Dermatol Ther (Heidelb). 2021;11:79-91.
- Centers for Disease Control and Prevention. Outpatient antibiotic prescriptions—United States, 2021. Accessed May 21, 2025. https://archive.cdc.gov/#/details?url=https://www.cdc.gov/antibiotic-use/data/report-2021.html
- Adler BL, Kornmehl H, Armstrong AW. Antibiotic resistance in acne treatment. JAMA Dermatol. 2017;153:810-811. doi:10.1001 /jamadermatol.2017.1297
- Walsh TR, Efthimiou J, Dréno B. Systematic review of antibiotic resistance in acne: an increasing topical and oral threat. Lancet Infect Dis. 2016;16:E23-E33. doi:10.1016/S1473-3099(15)00527-7
- Margolis DJ, Fanelli M, Hoffstad O, et al. Potential association between the oral tetracycline class of antimicrobials used to treat acne and inflammatory bowel disease. Am J Gastroenterol. 2010;105:2610-2616. doi:10.1038/ajg.2010.303?
- Margolis DJ, Fanelli M, Kupperman E, et al. Association of pharyngitis with oral antibiotic use for the treatment of acne: a cross-sectional and prospective cohort study. Arch Dermatol. 2012;148:326-332. doi:10.1001 /archdermatol.2011.355
- Bartlett JG, Chang TW, Gurwith M, et al. Antibiotic-associated pseudomembranous colitis due to toxin-producing clostridia. N Engl J Med. 1978;298:531-534. doi:10.1056/NEJM197803092981003
- Carroll KC, Bartlett JG. Biology of Clostridium difficile: implications for epidemiology and diagnosis. Annu Rev Microbiol. 2011;65:501-521. doi:10.1146/annurev-micro-090110-102824
- Velicer CM, Heckbert SR, Lampe JW, et al. Antibiotic use in relation to the risk of breast cancer. JAMA. 2004;291:827-835. doi:10.1001/jama.291.7.827
- Song M, Nguyen LH, Emilsson L, et al. Antibiotic use associated with risk of colorectal polyps in a nationwide study. Clin Gastroenterol Hepatol. 2021;19:1426-1435.e6. doi:10.1016/j.cgh.2020.05.036
- Cao Y, Wu K, Mehta R, et al. Long-term use of antibiotics and risk of colorectal adenoma. Gut. 2018;67:672-678. doi:10.1136 /gutjnl-2016-313413
- Del Rosso JQ, Rosen T, Palceski D, et al. Patient awareness of antimicrobial resistance and antibiotic use in acne vulgaris. J Clin Aesthetic Dermatol. 2019;12:30-41.
- Park JH, Bienenfeld A, Orlow SJ, et al. The use of hormonal antiandrogen therapy in female patients with acne: a 10-year retrospective study. Am J Clin Dermatol. 2018;19:449-455. doi:10.1007/s40257-018-0349-6
- Barbieri JS, Choi JK, Mitra N, et al. Frequency of treatment switching for spironolactone compared to oral tetracycline-class antibiotics for women with acne: a retrospective cohort study 2010-2016. J Drugs Dermatol. 2018;17:632-638.
- Dréno B, Nguyen JM, Hainaut E, et al. Efficacy of spironolactone compared with doxycycline in moderate acne in adult females: results of the multicentre, controlled, randomized, double-blind prospective and parallel Female Acne Spironolactone vs doxyCycline Efficacy (FASCE) Study. Acta Derm Venereol. 2024;104:adv26002. doi:10.2340/actadv.v104.26002
- Barbieri JS, Ellenberg S, Grice E, et al. Challenges in designing a randomized, double-blind noninferiority trial for treatment of acne: The SDACNE trial. Clin Trials. 2025;22:66-76. doi:10.1177/17407745241265094
- Collier CN, Harper JC, Cafardi JA, et al. The prevalence of acne in adults 20 years and older. J Am Acad Dermatol. 2008;58:56-59. doi:10.1016/j.jaad.2007.06.045
- Dréno B, Thiboutot D, Layton AM, et al. Large-scale international study enhances understanding of an emerging acne population: adult females. J Eur Acad Dermatol Venereol. 2015;29:1096-1106. doi:10.1111/jdv.12757
- Schmidt TH, Khanijow K, Cedars MI, et al. Cutaneous findings and systemic associations in women with polycystic ovary syndrome. JAMA Dermatol. 2016;152:391-398. doi:10.1001/jamadermatol.2015.4498
- Plante J, Robinson I, Elston D. The need for potassium monitoring in women on spironolactone for dermatologic conditions. J Am Acad Dermatol. 2022;87:1097-1099. doi:10.1016/j.jaad.2022.01.010
- Berman HS, Cheng CE, Hogeling M. Spironolactone in the treatment of adolescent acne: a retrospective review. J Am Acad Dermatol. 2021;85:269-271. doi:10.1016/j.jaad.2020.11.044
- Reynolds RV, Yeung H, Cheng CE, et al. Guidelines of care for the management of acne vulgaris. J Am Acad Dermatol. 2024;90:1006.e1-1006 .e30. doi:10.1016/j.jaad.2023.12.017
- Basu P. High-dose spironolactone for acne in patients with polycystic ovarian syndrome: a single-institution retrospective study. J Am Acad Dermatol. 2021;85:740-741.
- Layton AM, Eady EA, Whitehouse H, et al. Oral spironolactone for acne vulgaris in adult females: a hybrid systematic review. Am J Clin Dermatol. 2017;18:169-191. doi:10.1007/s40257-016-0245-x
- Yemisci A, Gorgulu A, Piskin S. Effects and side-effects of spironolactone therapy in women with acne. J Eur Acad Dermatol Venereol. 2005;19:163-166. doi:10.1111/j.1468-3083.2005.01072.x
- Patiyasikunt M, Chancheewa B, Asawanonda P, et al. Efficacy and tolerability of low-dose spironolactone and topical benzoyl peroxide in adult female acne: a randomized, double-blind, placebo-controlled trial. J Dermatol. 2020;47:1411-1416. doi:10.1111/1346-8138.15559
- Aldactone (spironolactone) tablets. Prescribing information. Pfizer; 2008. Accessed May 21, 2025. https://www.accessdata.fda.gov/drugsatfda_docs/label/2008/012151s062lbl.pdf
- Bommareddy K, Hamade H, Lopez-Olivo MA, et al. Association of spironolactone use with risk of cancer: a systematic review and meta-analysis. JAMA Dermatol. 2022;158:275-282. doi:10.1001/jamadermatol.2021.5866
- Mackenzie IS, Morant SV, Wei L, et al. Spironolactone use and risk of incident cancers: a retrospective, matched cohort study. Br J Clin Pharmacol. 2017;83:653-663. doi:10.1111/bcp.13152
- Biggar RJ, Andersen EW, Wohlfahrt J, et al. Spironolactone use and the risk of breast and gynecologic cancers. Cancer Epidemiol. 2013;37:870-875. doi:10.1016/j.canep.2013.10.004
- Garate D, Thang CJ, Golovko G, et al. A matched cohort study evaluating whether spironolactone or tetracycline-class antibiotic use among female acne patients is associated with breast cancer development risk. Arch Dermatol Res. 2024;316:196. doi:10.1007/s00403-024-02936-y
- Jick SS, Hernandez RK. Risk of nonfatal venous thromboembolism in women using oral contraceptives containing drospirenone compared with women using oral contraceptives containing levonorgestrel: casecontrol study using United States claims data. BMJ. 2011;342:d2151. doi:10.1136/bmj.d2151
- Shields A, Flood K, Barbieri JS. Spironolactone use for acne is not associated with an increased risk of venous thromboembolism: a matched, retrospective cohort study. J Am Acad Dermatol. 2023;88:1396-1397. doi:10.1016/j.jaad.2023.02.028
- Plovanich M, Weng QY, Mostaghimi A. Low usefulness of potassium monitoring among healthy young women taking spironolactone for acne. JAMA Dermatol. 2015;151:941-944. doi:10.1001 /jamadermatol.2015.34
- Thiede RM, Rastogi S, Nardone B, et al. Hyperkalemia in women with acne exposed to oral spironolactone: a retrospective study from the RADAR (Research on Adverse Drug Events and Reports) program. Int J Womens Dermatol. 2019;5:155-157. doi:10.1016/j.ijwd.2019.04.024
- Lai J, Zaenglein AL, Barbieri JS. Timing of potassium monitoring in females treated for acne with spironolactone is not optimal: a retrospective cohort study. J Am Acad Dermatol. 2024;91:982-984. doi:10.1016/j.jaad.2024.07.1446
- Muhn P, Fuhrmann U, Fritzemeier KH, et al. Drospirenone: a novel progestogen with antimineralocorticoid and antiandrogenic activity. Ann N Y Acad Sci. 1995;761:311-335. doi:10.1111/j.1749-6632.1995.tb31386.x
- Yaz (drospirenone/ethinyl estradiol) tablets. Prescribing information. Bayer HealthCare Pharmaceuticals; 2012. Accessed May 21, 2025. https://www.accessdata.fda.gov/drugsatfda_docs/label/2012/021676s012lbl.pdf
- Bird ST, Pepe SR, Etminan M, et al. The association between drospirenone and hyperkalemia: a comparative-safety study. BMC Clin Pharmacol. 2011;11:23. doi:10.1186/1472-6904-11-23
- Krunic A, Ciurea A, Scheman A. Efficacy and tolerance of acne treatment using both spironolactone and a combined contraceptive containing drospirenone. J Am Acad Dermatol. 2008;58:60-62. doi:10.1016/j.jaad.2007.09.024
- Hecker A, Hasan SH, Neumann F. Disturbances in sexual differentiation of rat foetuses following spironolactone treatment. Acta Endocrinol (Copenh). 1980;95:540-545. doi:10.1530/acta.0.0950540
- Liszewski W, Boull C. Lack of evidence for feminization of males exposed to spironolactone in utero: a systematic review. J Am Acad Dermatol. 2019;80:1147-1148. doi:10.1016/j.jaad.2018.10.023
- de Jong MFC, Riphagen IJ, Kootstra-Ros JE, et al. Potassium and magnesium in breast milk of a woman with gitelman syndrome. Kidney Int Rep. 2022;7:1720-1721. doi:10.1016/j.ekir.2022.05.006
- Reisman T, Goldstein Z. Case report: induced lactation in a transgender woman. Transgender Health. 2018;3:24-26. doi:10.1089 /trgh.2017.0044
- Phelps DL, Karim A. Spironolactone: relationship between concentrations of dethioacetylated metabolite in human serum and milk. J Pharm Sci. 1977;66:1203. doi:10.1002/jps.2600660841
- World Health Organization. Breastfeeding and maternal medication: recommendations for drugs in the eleventh WHO model list of essential drugs. February 25, 2002. Accessed May 21, 2025. https://www.who.int/publications/i/item/55732
- Butler DC, Heller MM, Murase JE. Safety of dermatologic medications in pregnancy and lactation: part II. Lactation. J Am Acad Dermatol. 2014;70:417.e1-10; quiz 427. doi:10.1016/j.jaad.2013.09.009
- Cominos DC, van der Walt A, van Rooyen AJ. Suppression of postpartum lactation with furosemide. S Afr Med J. 1976;50:251-252.
- Hebert A, Thiboutot D, Stein Gold L, et al. Efficacy and safety of topical clascoterone cream, 1%, for treatment in patients with facial acne: two phase 3 randomized clinical trials. JAMA Dermatol. 2020;156:621-630. doi:10.1001/jamadermatol.2020.0465
- Ershadi S, Choe J, Barbieri JS. Medicaid formularies for acne treatments are difficult to access and reflect inconsistent coverage policies. J Am Acad Dermatol. 2024;90:1074-1076. doi:10.1016/j.jaad.2024.01.033
Spironolactone is increasingly used off label for acne treatment and is now being prescribed for women with acne at a frequency similar to oral antibiotics.1,2 In this article, we provide an overview of spironolactone use for acne treatment and discuss recent clinical trials and practical strategies for patient selection, dosing, adverse effect management, and monitoring (Table).
History and Mechanism of Action
Because sebaceous gland activity is an important component of acne pathogenesis and is regulated by androgens,3 there has long been interest in identifying treatment strategies that can target the role of hormones in activating the sebaceous gland. In the 1980s, it became apparent that spironolactone, originally developed as a potassium-sparing diuretic, also might possess antiandrogenic properties that could be useful in the treatment of acne.4 Spironolactone has been found to decrease testosterone production, inhibit testosterone and dihydrotestosterone binding to androgen receptors,5-8 and block 5α-reductase receptors of the sebaceous glands of skin.9
In 1984, Goodfellow et al10 conducted a trial in which 36 male and female patients with severe acne were randomized to placebo or spironolactone doses ranging from 50 to 200 mg/d. They found that spironolactone resulted in dose-dependent reductions of sebum production as well as improvement in patient- and clinician-reported assessments of acne. In 1986, another placebo-controlled crossover trial by Muhlemann et al11 provided further support for the effectiveness of spironolactone for acne. This trial randomized 21 women to placebo or spironolactone 200 mg/d and found that spironolactone was associated with statistically significant (P<.001) improvements in acne lesion counts.
Recent Observational Studies and Trials
Following these early trials, several large case series have been published describing the successful use of spironolactone for acne, including a 2020 retrospective case series from the Mayo Clinic describing 395 patients.12 The investigators found that almost 66% of patients had a complete response and almost 85% had a complete response or a partial response greater than 50%. They also found that the median time to initial response and maximal response were 3 and 5 months, respectively, and that efficacy was observed across acne subtypes, including for nodulocystic acne.12 In addition, a 2021 case series describing 403 patients treated with spironolactone found that approximately 80% had reduction or complete clearance of acne, with improvements observed for both facial and truncal acne. In this cohort, doses of 100 to 150 mg/d typically were the most successful.13 A case series of 80 adolescent females also highlighted the efficacy of spironolactone in younger populations.14
Adding to these observational data, the multicenter, phase 3, double-blind Spironolactone for Adult Female Acne (SAFA) trial included 410 women (mean age, 29.2 years) who were randomized to receive either placebo or intervention (spironolactone 50 mg/d until week 6 and 100 mg/d until week 24).15 At 24 weeks, greater improvement in quality of life and participant self-assessed improvement were observed in the spironolactone group. In addition, at 12 weeks, rates of success were higher in the spironolactone group using the Investigator Global Assessment score (adjusted odds ratio 5.18 [95% CI, 2.18- 12.28]). Those randomized to receive spironolactone also had lower rates of oral antibiotic use at 52 weeks than the placebo group did (5.8% vs 13.5%, respectively).
In the SAFA trial, spironolactone was well tolerated; the most common adverse effects relative to placebo were lightheadedness (19% for spironolactone vs 12% for placebo) and headache (20% for spironolactone vs 12% for placebo). Notably, more than 95% of patients were able to increase from 50 mg/d to 100 mg/d at week 6, with greater than 90% tolerating 100 mg/d. As observational data suggest that spironolactone takes 3 to 5 months to reach peak efficacy, these findings provide further support that starting at a dose of at least 100 mg/d is likely optimal for most patients.16
A Potential Alternative to Oral Antibiotics
Oral antibiotics such as tetracyclines have long played a central role in the treatment of acne and remain a first-line treatment option.17 In addition, many of these antibiotic courses exceed 6 months in duration.1 In fact, dermatologists prescribe more antibiotics per capita than any other specialty1,18-20; however, this can be associated with the development of antibiotic resistance,21,22 as well as other antibiotic-associated complications, including inflammatory bowel disease,23 pharyngitis,24 Clostridium difficile infections, and cancer.25-29
In addition to these concerns, many patients may prefer nonantibiotic alternatives to oral antibiotics, with more than 75% preferring a nonantibiotic option if available. For female patients with acne, antiandrogens such as spironolactone have been suggested as a potential alternative.30 A 10-year retrospective study of female patients with acne found that those who had ever received hormonal therapy (ie, spironolactone or a combined oral contraceptive) received fewer cumulative days of oral antibiotics than those who did not (226 days vs 302 days, respectively).31 In addition, while oral antibiotics were the most common initial therapy prescribed for patients, as they progressed through their treatment course, more patients ended up on hormonal therapy than oral antibiotics. This study suggests that hormonal therapy such as spironolactone could represent an alternative to the use of systemic antibiotics.31
Further supporting the role of spironolactone as an alternative to oral antibiotics, a 2018 analysis of claims data found that spironolactone may have similar effectiveness to oral antibiotics for the treatment of acne.32 After adjusting for age and topical retinoid and oral contraceptive use, this study found that there was no significant difference in the odds of being prescribed a different systemic treatment within 1 year (ie, treatment failure) among those starting spironolactone vs those starting oral tetracycline-class antibiotics as their initial therapy for acne.
A multicenter, randomized, double-blind trial (Female Acne Spironolactone vs doxyCycline Efficacy [FASCE]) also evaluated the comparative effectiveness of doxycycline 100 mg/d for 3 months followed by an oral placebo for 3 months vs spironolactone 150 mg/d for 6 months among 133 adult women with acne. This study found that spironolactone had statistically significantly greater rates of Investigator Global Assessment treatment success after 6 months (odds ratio 2.87 [95% CI, 1.38-5.99; P=.007]).33 Since spironolactone historically has been prescribed less often than oral antibiotics for women with acne, these findings support spironolactone as an underutilized treatment alternative. The ongoing Spironolactone versus Doxycycline for Acne: A Comparative Effectiveness, Noninferiority Evaluation trial—a 16-week, blinded trial comparing 100 mg/d doses of both drugs—should provide additional evidence regarding the relative role of spironolactone and oral antibiotics in the management of acne.34
Ultimately, the decision to use spironolactone or other treatments such as oral antibiotics should be based on shared decision making between clinician and patient. Spironolactone has a relatively slow onset of efficacy, and other options such as oral antibiotics might be preferred by those looking for more immediate results; however, as women with acne often have activity that persists into adulthood, spironolactone might be preferable as a long-term maintenance therapy to avoid complications of prolonged antibiotic use.35 Comorbidities also will influence the optimal choice of therapy (eg, spironolactone might be preferred in someone with inflammatory bowel disease, and oral antibiotics might be preferred in someone with orthostatic hypotension).
Patient Selection
Acne occurring along the lower face or jawline in adult women sometimes is referred to as hormonal acne, but this dogma is not particularly evidence based. An observational study of 374 patients found that almost 90% of adult women had acne involving multiple facial zones with a spectrum of facial acne severity similar to that in adolescents.36 Only a small subset of these patients (11.2%) had acne localized solely to the mandibular area. In addition, acne along the lower face is not predictive of hyperandrogenism (eg, polycystic ovary syndrome).37 Antiandrogen therapies such as spironolactone and clascoterone are effective in both men and women with acne10,38 and in adolescents and adults, suggesting that hormones play a fundamental role in all acne and that addressing this mechanism can be useful broadly. Therefore, hormonal therapies such as spironolactone should not be restricted to only adult women with acne along the lower face.
While spironolactone can be effective for acne treatment in any age group, it may be most effective for adult women with acne. In the SAFA trial, prespecified subgroup analyses showed a statistically significant (P=.005) interaction term for age (categorized as <25 years and ≥25 years), which suggested that spironolactone might be a more effective treatment for women 25 years and older.15 In addition, subgroup analyses in the aforementioned 2018 analysis of claims data found that spironolactone was more effective relative to oral antibiotics in adults vs adolescents.32 Despite these limitations, several case series have highlighted that spironolactone is effective among adolescent populations with acne. A case series of spironolactone use in 73 patients aged 19 years or younger found that 68% of patients demonstrated resolution or improvement in their acne after spironolactone treatment.39 Another case series among 80 adolescent females reported 80% of patients experiencing improvement of their acne.14
For those with more severe acne, spironolactone can be combined with other complementary treatment approaches such as topicals, oral antibiotics, or procedural modalities.40
Dosing
We recommend starting spironolactone at a dose of 100 mg/d (the patient can take 50 mg/d for 1 week, then increase to 100 mg/d if there are no adverse effects at the lower dose). In the 1984 trial by Goodfellow et al,10 participants were randomized to doses of 50 mg/d, 100 mg/d, 150 mg/d, and 200 mg/d. In this trial, efficacy assessed by objective and subjective outcomes did not plateau until doses of 100 mg/d to 150 mg/d. In addition, a case series of 403 patients found that the most successful dosage of spironolactone generally was 100 mg/d or higher.13 Most of the patients who were started at this dosage either stayed at this level or escalated, whereas patients who started at lower dosages (25-75 mg/d) frequently increased their dosage over time. The SAFA trial also highlighted that most patients can tolerate a spironolactone dose of 100 mg/d.15 For specific populations, such as patients with polycystic ovary syndrome, a higher dose (mean dosage of 143 mg/d) may be required for efficacy.41 Given the slow onset of efficacy, typically taking 3 to 5 months, and the low rate of adverse effects, we believe the optimal starting dose is 100 mg/s to 150 mg/d. If adverse effects occur or lesions clear, then the dosage may be reduced.
Adverse Effects
Spironolactone generally is well tolerated; in the SAFA and FASCE trials, fewer than 1% of participants discontinued due to adverse effects.15,33 Rates of discontinuation due to adverse effects typically have been less than 5% in case series of patients treated in routine clinical practice.12-14
Because spironolactone is a diuretic and antihypertensive, the most common adverse effects are related to these characteristics. In the SAFA trial, dizziness, lightheadedness, and vertigo were reported more commonly in the spironolactone group than in the placebo group (19% vs 12%, respectively). Similarly, headaches also were reported more frequently in the spironolactone group than in the placebo group (20% vs 12%, respectively).15 One case series found that, among the 267 patients on spironolactone whose blood pressure was monitored, the mean reduction in systolic blood pressure was 3.5 mm Hg and the mean reduction in diastolic blood pressure was 0.9 mm Hg.13 For those with baseline orthostasis or in those who experience adverse effects related to hypotension, reducing the dose often can be helpful. Of note, while doses of 100 mg/d to 150 mg/d often are the most effective, randomized trials have found that spironolactone still can be effective for acne at doses as low as 25 mg/d to 50 mg/d.10,38
Menstrual irregularities are another commonly cited adverse effect of spironolactone. While a systematic review found that 15% to 30% of patients treated with spironolactone experience menstrual irregularities, it has been difficult to evaluate whether this is due to the medication or other comorbidities, such as polycystic ovary syndrome.42 Notably, in the SAFA trial, rates of menstrual irregularities were equivalent between the spironolactone and placebo groups at a dose of 100 mg/d (32% vs 35%, respectively).15 In contrast, in the FASCE trial, menstrual irregularities were more commonly reported at a dose of 150 mg/d.33 These findings are consistent with observational data suggesting that menstrual irregularities are much more common at spironolactone doses greater than 100 mg/d.42 Additionally, some evidence supports that for some patients these menstrual irregularities may resolve within 2 to 3 months of continued treatment.43 It has been noted in several studies that menstrual irregularities are less likely to occur in patients who are using combined oral contraceptives; therefore, for patients who are amenable and have no contraindications, combined oral contraceptives can be considered to prevent or address menstrual irregularities.13,42,44
More generally, combined oral contraceptives can be an excellent combination with spironolactone, as they have complementary characteristics. Spironolactone primarily blocks the effects of androgens, while combined oral contraceptives predominantly block the production of androgens. Whereas spironolactone typically causes hypotension and menstrual irregularities, combined oral contraceptives cause hypertension and help to regulate the menstrual cycle.
Spironolactone carries an official US Food and Drug Administration warning regarding possible tumorigenicity that is based on animal studies that used up to 150 times the normal dose of spironolactone used in humans45; however, observational studies in humans have not identified such an association when spironolactone is used in normal clinical settings. A systematic review and metanalysis in 2022 reviewed data from a total population of more than 4 million individuals and found that there was no statistically significant association between spironolactone use and the risk for breast, ovarian, bladder, kidney, gastric, or esophageal cancers.46 Additional studies also found no association between spironolactone use and cancers.48 A more recent cohort study specifically among patients treated with spironolactone for acne also found no significant increased risk for breast cancer.49
Combined oral contraceptives are associated with an increased risk for venous thromboembolisms, and there have been concerns that this risk may be greater in combined oral contraceptives that contain drospirenone.50 Drospirenone is molecularly related to spironolactone, which has prompted the consideration of whether spironolactone use also conveys a risk for venous thromboembolism. Reassuringly, a retrospective study of claims data found that individuals on spironolactone were not more likely to develop a pulmonary embolism or a deep venous thrombosis than matched controls treated with tetracycline antibiotics, with a point estimate favoring decreased risk.51
Monitoring
Given that one of spironolactone’s mechanisms of action is aldosterone antagonism and thus the inhibition of potassium excretion, there have been concerns regarding risk for hyperkalemia. A retrospective study analyzing data from 2000 to 2014 found that, among 974 young women receiving spironolactone therapy, the rate of hyperkalemia was 0.72%, which is equivalent to the 0.76% baseline rate of hyperkalemia in the same population.52 Subsequent studies also have found that spironolactone does not appear to be associated with a meaningful risk for hyperkalemia among young healthy patients treated for acne.38,53 These studies suggest that routine potassium monitoring is of low usefulness for healthy young women taking spironolactone for acne. The 2024 American Academy of Dermatology guidelines on the management of acne also state that potassium monitoring is not needed in healthy patients but that potassium testing should be considered for those with risk factors for hyperkalemia (eg, older age, medical comorbidities, medications).40 Clinicians should still engage in shared decision making with patients to determine whether to check potassium. If potassium is to be monitored, it should be checked 1 to 2 weeks after spironolactone is started.45,54
Since drospirenone also has aldosterone antagonistic properties,55 there have been concerns about whether concomitant use of spironolactone and drospirenone-containing combined oral contraceptives might increase the risk for hyperkalemia.56 However, a retrospective cohort study analyzing data from more than 1 million women found that drospirenone is not any more likely than levonorgestrel to cause hyperkalemia and that there is no interaction between drospirenone and spironolactone for hyperkalemia.57 A subsequent prospective study of 27 women treated with combined oral contraceptives containing ethinyl estradiol/drospirenone and spironolactone also did not find any significant elevations in potassium.58 Data from these studies suggest that spironolactone can safely be co-administered with drospirenone-containing combined oral contraceptives.
Reproductive Risks
Despite its utility in treating acne, spironolactone should not be used during pregnancy, and appropriate pregnancy prevention is recommended. Spironolactone crosses the placenta, and some animal studies have shown feminization of male fetuses.59 While human data are limited to a few case reports that did not demonstrate an association of major malformations,60 it generally is recommended to avoid spironolactone during pregnancy. Small studies have found that spironolactone has minimal transfer to breastmilk and is not associated with adverse effects in breastfed infants.61-63 Accordingly, the World Health Organization considers spironolactone to be compatible with breastfeeding.64 Notably, spironolactone may be associated with lactation suppression65,66; therefore, it may be best if lactating patients ensure that their milk production is established prior to starting spironolactone and to increase their water intake to offset the diuretic effects.
Spironolactone also can result in gynecomastia in men and therefore typically is not prescribed for the treatment of acne in this population in oral form10; however, topical antiandrogens such as clascoterone can be used in both women and men with acne.67
Conclusion
Spironolactone is a well-tolerated and effective treatment for women with acne, both in adult and adolescent populations. It is a potentially underutilized alternative to oral antibiotics. Spironolactone also is affordable, fully covered without any requirements in almost 90% of states under Medicaid and with a monthly cost of only $4.00 when obtained through major retailers in the United States, making it an optimal long-term treatment option for many patients.52,68 We recommend a starting dose of 100 mg/d, which can be increased to 150 mg/d to 200 mg/d if needed for better acne control or decreased if adverse effects occur or acne clears. Potassium monitoring is of low usefulness in young healthy women, and studies have not identified an association between spironolactone use and increased risk for cancer.
- Barbieri JS, James WD, Margolis DJ. Trends in prescribing behavior of systemic agents used in the treatment of acne among dermatologists and nondermatologists: a retrospective analysis, 2004-2013. J Am Acad Dermatol. 2017;77:456-463.e4. doi:10.1016/j.jaad.2017.04.016
- Barbieri JS. Temporal trends in the use of systemic medications for acne from 2017 to 2020. JAMA Dermatol. 2023;159:1135-1136. doi:10.1001 /jamadermatol.2023.2363
- Strauss JS, Pochi PE, Downing DT. Acne: perspectives. J Invest Dermatol. 1974;62:321-325. doi:10.1111/1523-1747.ep12724280
- Luderschmidt C, Bidlingmaier F, Plewig G. Inhibition of sebaceous gland activity by spironolactone in Syrian hamster. J Invest Dermatol. 1982;78:253-255. doi:10.1111/1523-1747.ep12506612
- Boisselle A, Dionne FT, Tremblay RR. Interaction of spironolactone with rat skin androgen receptor. Can J Biochem. 1979;57:1042-1046. doi:10.1139/o79-131
- Menard RH, Stripp B, Gillette JR. Spironolactone and testicular cytochrome P-450: decreased testosterone formation in several species and changes in hepatic drug metabolism. Endocrinology. 1974;94:1628-1636. doi:10.1210/endo-94-6-1628
- Rifka SM, Pita JC, Vigersky RA, et al. Interaction of digitalis and spironolactone with human sex steroid receptors. J Clin Endocrinol Metab. 1978;46:338-344. doi:10.1210/jcem-46-2-338
- Corvol P, Michaud A, Menard J, et al. Antiandrogenic effect of spirolactones: mechanism of action. Endocrinology. 1975;97:52-58. doi:10.1210/endo-97-1-52
- Akamatsu H, Zouboulis CC, Orfanos CE. Spironolactone directly inhibits proliferation of cultured human facial sebocytes and acts antagonistically to testosterone and 5 alpha-dihydrotestosterone in vitro. J Invest Dermatol. 1993;100:660-662. doi:10.1111/1523-1747 .ep12472325
- Goodfellow A, Alaghband-Zadeh J, Carter G, et al. Oral spironolactone improves acne vulgaris and reduces sebum excretion. Br J Dermatol. 1984;111:209-214. doi:10.1111/j.1365-2133.1984.tb04045.x
- Muhlemann MF, Carter GD, Cream JJ, et al. Oral spironolactone: an effective treatment for acne vulgaris in women. Br J Dermatol. 1986;115:227-232. doi:10.1111/j.1365-2133.1986.tb05722.x
- Roberts EE, Nowsheen S, Davis MDP, et al. Treatment of acne with spironolactone: a retrospective review of 395 adult patients at Mayo Clinic, 2007-2017. J Eur Acad Dermatol Venereol. 2020;34:2106-2110. doi:10.1111/jdv.16302
- Garg V, Choi JK, James WD, et al. Long-term use of spironolactone for acne in women: a case series of 403 patients. J Am Acad Dermatol. 2021;84:1348-1355. doi:10.1016/j.jaad.2020.12.071
- Roberts EE, Nowsheen S, Davis DMR, et al. Use of spironolactone to treat acne in adolescent females. Pediatr Dermatol. 2021;38:72-76. doi:10.1111/pde.14391
- Santer M, Lawrence M, Renz S, et al. Effectiveness of spironolactone for women with acne vulgaris (SAFA) in England and Wales: pragmatic, multicentre, phase 3, double blind, randomised controlled trial. BMJ. 2023;381:E074349. doi:10.1136/bmj-2022-074349
- Shields A, Barbieri JS. Effectiveness of spironolactone for women with acne vulgaris (SAFA) trial: a critically appraised topic. Br J Dermatol. 2023;189:509-510. doi:10.1093/bjd/ljad270
- Xu H, Li H. Acne, the skin microbiome, and antibiotic treatment. Am J Clin Dermatol. 2019;20:335-344. doi:10.1007/s40257-018-00417-3
- Knutsen-Larson S, Dawson AL, Dunnick CA, et al. Acne vulgaris: pathogenesis, treatment, and needs assessment. Dermatol Clin. 2012;30:99-106, viii-ix. doi:10.1016/j.det.2011.09.001
- Han JJ, Faletsky A, Barbieri JS, et al. New acne therapies and updates on use of spironolactone and isotretinoin: a narrative review. Dermatol Ther (Heidelb). 2021;11:79-91.
- Centers for Disease Control and Prevention. Outpatient antibiotic prescriptions—United States, 2021. Accessed May 21, 2025. https://archive.cdc.gov/#/details?url=https://www.cdc.gov/antibiotic-use/data/report-2021.html
- Adler BL, Kornmehl H, Armstrong AW. Antibiotic resistance in acne treatment. JAMA Dermatol. 2017;153:810-811. doi:10.1001 /jamadermatol.2017.1297
- Walsh TR, Efthimiou J, Dréno B. Systematic review of antibiotic resistance in acne: an increasing topical and oral threat. Lancet Infect Dis. 2016;16:E23-E33. doi:10.1016/S1473-3099(15)00527-7
- Margolis DJ, Fanelli M, Hoffstad O, et al. Potential association between the oral tetracycline class of antimicrobials used to treat acne and inflammatory bowel disease. Am J Gastroenterol. 2010;105:2610-2616. doi:10.1038/ajg.2010.303?
- Margolis DJ, Fanelli M, Kupperman E, et al. Association of pharyngitis with oral antibiotic use for the treatment of acne: a cross-sectional and prospective cohort study. Arch Dermatol. 2012;148:326-332. doi:10.1001 /archdermatol.2011.355
- Bartlett JG, Chang TW, Gurwith M, et al. Antibiotic-associated pseudomembranous colitis due to toxin-producing clostridia. N Engl J Med. 1978;298:531-534. doi:10.1056/NEJM197803092981003
- Carroll KC, Bartlett JG. Biology of Clostridium difficile: implications for epidemiology and diagnosis. Annu Rev Microbiol. 2011;65:501-521. doi:10.1146/annurev-micro-090110-102824
- Velicer CM, Heckbert SR, Lampe JW, et al. Antibiotic use in relation to the risk of breast cancer. JAMA. 2004;291:827-835. doi:10.1001/jama.291.7.827
- Song M, Nguyen LH, Emilsson L, et al. Antibiotic use associated with risk of colorectal polyps in a nationwide study. Clin Gastroenterol Hepatol. 2021;19:1426-1435.e6. doi:10.1016/j.cgh.2020.05.036
- Cao Y, Wu K, Mehta R, et al. Long-term use of antibiotics and risk of colorectal adenoma. Gut. 2018;67:672-678. doi:10.1136 /gutjnl-2016-313413
- Del Rosso JQ, Rosen T, Palceski D, et al. Patient awareness of antimicrobial resistance and antibiotic use in acne vulgaris. J Clin Aesthetic Dermatol. 2019;12:30-41.
- Park JH, Bienenfeld A, Orlow SJ, et al. The use of hormonal antiandrogen therapy in female patients with acne: a 10-year retrospective study. Am J Clin Dermatol. 2018;19:449-455. doi:10.1007/s40257-018-0349-6
- Barbieri JS, Choi JK, Mitra N, et al. Frequency of treatment switching for spironolactone compared to oral tetracycline-class antibiotics for women with acne: a retrospective cohort study 2010-2016. J Drugs Dermatol. 2018;17:632-638.
- Dréno B, Nguyen JM, Hainaut E, et al. Efficacy of spironolactone compared with doxycycline in moderate acne in adult females: results of the multicentre, controlled, randomized, double-blind prospective and parallel Female Acne Spironolactone vs doxyCycline Efficacy (FASCE) Study. Acta Derm Venereol. 2024;104:adv26002. doi:10.2340/actadv.v104.26002
- Barbieri JS, Ellenberg S, Grice E, et al. Challenges in designing a randomized, double-blind noninferiority trial for treatment of acne: The SDACNE trial. Clin Trials. 2025;22:66-76. doi:10.1177/17407745241265094
- Collier CN, Harper JC, Cafardi JA, et al. The prevalence of acne in adults 20 years and older. J Am Acad Dermatol. 2008;58:56-59. doi:10.1016/j.jaad.2007.06.045
- Dréno B, Thiboutot D, Layton AM, et al. Large-scale international study enhances understanding of an emerging acne population: adult females. J Eur Acad Dermatol Venereol. 2015;29:1096-1106. doi:10.1111/jdv.12757
- Schmidt TH, Khanijow K, Cedars MI, et al. Cutaneous findings and systemic associations in women with polycystic ovary syndrome. JAMA Dermatol. 2016;152:391-398. doi:10.1001/jamadermatol.2015.4498
- Plante J, Robinson I, Elston D. The need for potassium monitoring in women on spironolactone for dermatologic conditions. J Am Acad Dermatol. 2022;87:1097-1099. doi:10.1016/j.jaad.2022.01.010
- Berman HS, Cheng CE, Hogeling M. Spironolactone in the treatment of adolescent acne: a retrospective review. J Am Acad Dermatol. 2021;85:269-271. doi:10.1016/j.jaad.2020.11.044
- Reynolds RV, Yeung H, Cheng CE, et al. Guidelines of care for the management of acne vulgaris. J Am Acad Dermatol. 2024;90:1006.e1-1006 .e30. doi:10.1016/j.jaad.2023.12.017
- Basu P. High-dose spironolactone for acne in patients with polycystic ovarian syndrome: a single-institution retrospective study. J Am Acad Dermatol. 2021;85:740-741.
- Layton AM, Eady EA, Whitehouse H, et al. Oral spironolactone for acne vulgaris in adult females: a hybrid systematic review. Am J Clin Dermatol. 2017;18:169-191. doi:10.1007/s40257-016-0245-x
- Yemisci A, Gorgulu A, Piskin S. Effects and side-effects of spironolactone therapy in women with acne. J Eur Acad Dermatol Venereol. 2005;19:163-166. doi:10.1111/j.1468-3083.2005.01072.x
- Patiyasikunt M, Chancheewa B, Asawanonda P, et al. Efficacy and tolerability of low-dose spironolactone and topical benzoyl peroxide in adult female acne: a randomized, double-blind, placebo-controlled trial. J Dermatol. 2020;47:1411-1416. doi:10.1111/1346-8138.15559
- Aldactone (spironolactone) tablets. Prescribing information. Pfizer; 2008. Accessed May 21, 2025. https://www.accessdata.fda.gov/drugsatfda_docs/label/2008/012151s062lbl.pdf
- Bommareddy K, Hamade H, Lopez-Olivo MA, et al. Association of spironolactone use with risk of cancer: a systematic review and meta-analysis. JAMA Dermatol. 2022;158:275-282. doi:10.1001/jamadermatol.2021.5866
- Mackenzie IS, Morant SV, Wei L, et al. Spironolactone use and risk of incident cancers: a retrospective, matched cohort study. Br J Clin Pharmacol. 2017;83:653-663. doi:10.1111/bcp.13152
- Biggar RJ, Andersen EW, Wohlfahrt J, et al. Spironolactone use and the risk of breast and gynecologic cancers. Cancer Epidemiol. 2013;37:870-875. doi:10.1016/j.canep.2013.10.004
- Garate D, Thang CJ, Golovko G, et al. A matched cohort study evaluating whether spironolactone or tetracycline-class antibiotic use among female acne patients is associated with breast cancer development risk. Arch Dermatol Res. 2024;316:196. doi:10.1007/s00403-024-02936-y
- Jick SS, Hernandez RK. Risk of nonfatal venous thromboembolism in women using oral contraceptives containing drospirenone compared with women using oral contraceptives containing levonorgestrel: casecontrol study using United States claims data. BMJ. 2011;342:d2151. doi:10.1136/bmj.d2151
- Shields A, Flood K, Barbieri JS. Spironolactone use for acne is not associated with an increased risk of venous thromboembolism: a matched, retrospective cohort study. J Am Acad Dermatol. 2023;88:1396-1397. doi:10.1016/j.jaad.2023.02.028
- Plovanich M, Weng QY, Mostaghimi A. Low usefulness of potassium monitoring among healthy young women taking spironolactone for acne. JAMA Dermatol. 2015;151:941-944. doi:10.1001 /jamadermatol.2015.34
- Thiede RM, Rastogi S, Nardone B, et al. Hyperkalemia in women with acne exposed to oral spironolactone: a retrospective study from the RADAR (Research on Adverse Drug Events and Reports) program. Int J Womens Dermatol. 2019;5:155-157. doi:10.1016/j.ijwd.2019.04.024
- Lai J, Zaenglein AL, Barbieri JS. Timing of potassium monitoring in females treated for acne with spironolactone is not optimal: a retrospective cohort study. J Am Acad Dermatol. 2024;91:982-984. doi:10.1016/j.jaad.2024.07.1446
- Muhn P, Fuhrmann U, Fritzemeier KH, et al. Drospirenone: a novel progestogen with antimineralocorticoid and antiandrogenic activity. Ann N Y Acad Sci. 1995;761:311-335. doi:10.1111/j.1749-6632.1995.tb31386.x
- Yaz (drospirenone/ethinyl estradiol) tablets. Prescribing information. Bayer HealthCare Pharmaceuticals; 2012. Accessed May 21, 2025. https://www.accessdata.fda.gov/drugsatfda_docs/label/2012/021676s012lbl.pdf
- Bird ST, Pepe SR, Etminan M, et al. The association between drospirenone and hyperkalemia: a comparative-safety study. BMC Clin Pharmacol. 2011;11:23. doi:10.1186/1472-6904-11-23
- Krunic A, Ciurea A, Scheman A. Efficacy and tolerance of acne treatment using both spironolactone and a combined contraceptive containing drospirenone. J Am Acad Dermatol. 2008;58:60-62. doi:10.1016/j.jaad.2007.09.024
- Hecker A, Hasan SH, Neumann F. Disturbances in sexual differentiation of rat foetuses following spironolactone treatment. Acta Endocrinol (Copenh). 1980;95:540-545. doi:10.1530/acta.0.0950540
- Liszewski W, Boull C. Lack of evidence for feminization of males exposed to spironolactone in utero: a systematic review. J Am Acad Dermatol. 2019;80:1147-1148. doi:10.1016/j.jaad.2018.10.023
- de Jong MFC, Riphagen IJ, Kootstra-Ros JE, et al. Potassium and magnesium in breast milk of a woman with gitelman syndrome. Kidney Int Rep. 2022;7:1720-1721. doi:10.1016/j.ekir.2022.05.006
- Reisman T, Goldstein Z. Case report: induced lactation in a transgender woman. Transgender Health. 2018;3:24-26. doi:10.1089 /trgh.2017.0044
- Phelps DL, Karim A. Spironolactone: relationship between concentrations of dethioacetylated metabolite in human serum and milk. J Pharm Sci. 1977;66:1203. doi:10.1002/jps.2600660841
- World Health Organization. Breastfeeding and maternal medication: recommendations for drugs in the eleventh WHO model list of essential drugs. February 25, 2002. Accessed May 21, 2025. https://www.who.int/publications/i/item/55732
- Butler DC, Heller MM, Murase JE. Safety of dermatologic medications in pregnancy and lactation: part II. Lactation. J Am Acad Dermatol. 2014;70:417.e1-10; quiz 427. doi:10.1016/j.jaad.2013.09.009
- Cominos DC, van der Walt A, van Rooyen AJ. Suppression of postpartum lactation with furosemide. S Afr Med J. 1976;50:251-252.
- Hebert A, Thiboutot D, Stein Gold L, et al. Efficacy and safety of topical clascoterone cream, 1%, for treatment in patients with facial acne: two phase 3 randomized clinical trials. JAMA Dermatol. 2020;156:621-630. doi:10.1001/jamadermatol.2020.0465
- Ershadi S, Choe J, Barbieri JS. Medicaid formularies for acne treatments are difficult to access and reflect inconsistent coverage policies. J Am Acad Dermatol. 2024;90:1074-1076. doi:10.1016/j.jaad.2024.01.033
Spironolactone for Acne: Practical Strategies for Optimal Clinical Outcomes
Spironolactone for Acne: Practical Strategies for Optimal Clinical Outcomes
PRACTICE POINTS
- Spironolactone is an effective systemic treatment for women with acne and likely is an underutilized alternative to oral antibiotics.
- We recommend a starting dose of 100 mg/d, which is well tolerated by most patients and has superior effectiveness to lower doses.
- Potassium monitoring is of low usefulness in young healthy women, and an association between spironolactone use and increased risk for cancer has not been identified.

The Skin Microbiome in Rosacea: Mechanisms, Gut-Skin Interactions, and Therapeutic Implications
The Skin Microbiome in Rosacea: Mechanisms, Gut-Skin Interactions, and Therapeutic Implications
Rosacea is a chronic inflammatory skin condition affecting the central face—including the cheeks, nose, chin, and forehead—that causes considerable discomfort.1 Its pathogenesis involves immune dysregulation, genetic predisposition, and microbial dysbiosis.2 While immune and environmental factors are known triggers of rosacea, recent research highlights the roles of the gut and skin microbiomes in disease progression. While the skin microbiome interacts directly with the immune system to regulate inflammation and skin homeostasis, the gut microbiome also influences cutaneous inflammation, emphasizing the need to address both topical and internal microbiome imbalances.3 In this article, we review gut and skin microbial alterations in rosacea, focusing on the skin microbiome and including the gut-skin axis implications as well as therapeutic strategies aimed at microbiome balance to enhance patient outcomes.
Skin Microbiome Alterations in Rosacea
The human skin microbiome interacts with the immune system, and microbial imbalances have been shown to contribute to immune dysregulation. Several key microbial species have been identified as playing a large role in rosacea, including Demodex folliculorum, Staphylococcus epidermidis, Bacillus oleronius, and Cutibacterium acnes (Figure).
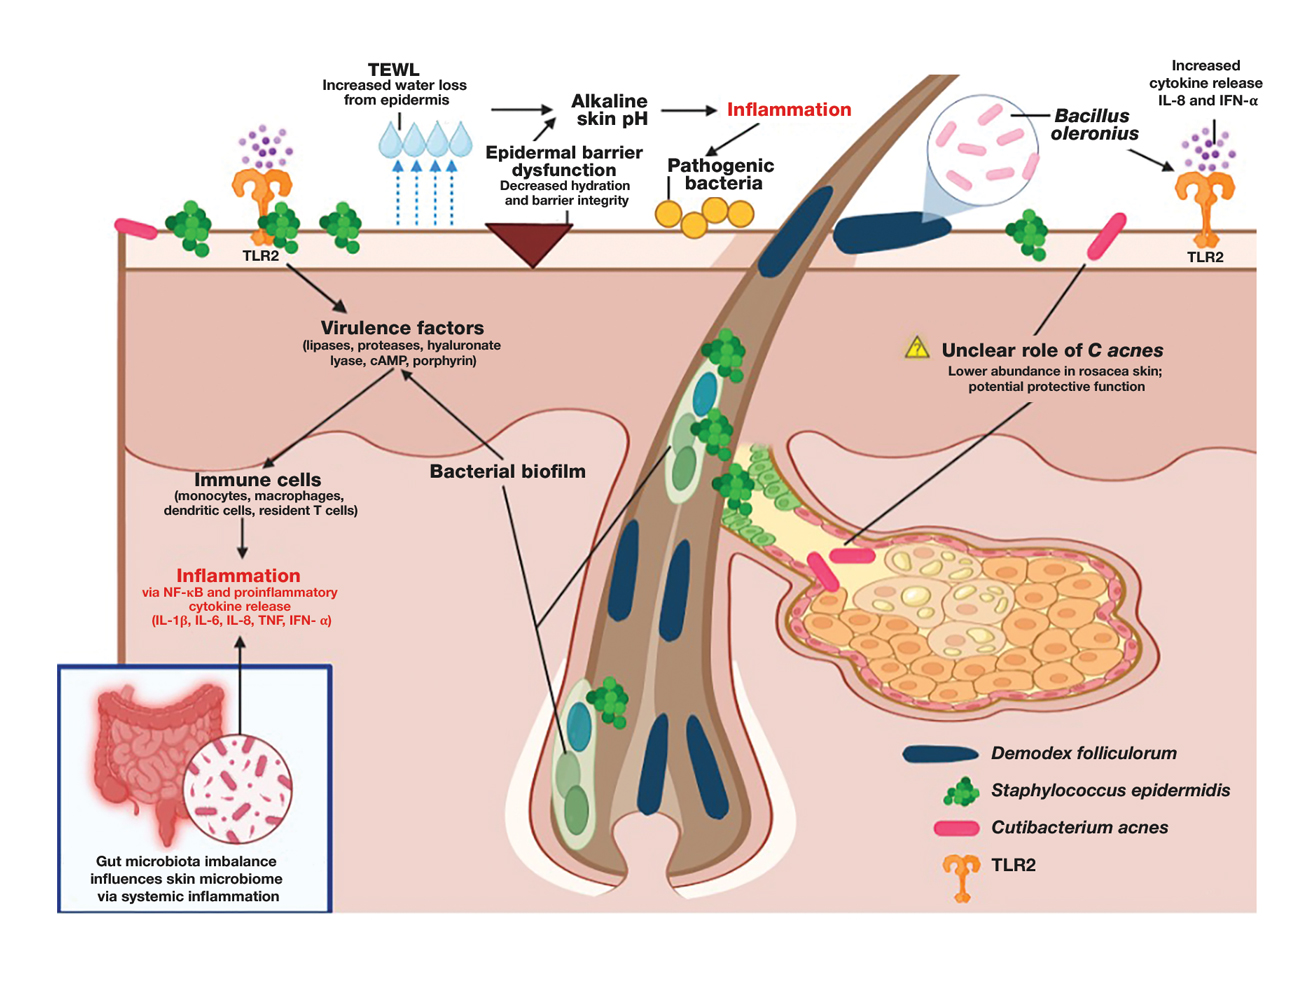
Demodex folliculorum is a microscopic mite is found in hair follicles and sebaceous glands. Patients with rosacea have higher densities of D folliculorum, which trigger follicular occlusion and immune activation.1 Bacillus oleronius be isolated from D folliculorum and can further activate toll-like receptor 2, leading to cytokine production and immune cell infiltration.3,4 Increased propagation of this mite correlates with shifts in skin microbiome composition, demonstrating increased inflammatory microbial populations.3
Staphylococcus epidermidis normally is commensal but can become pathogenic (pathobiont) in rosacea due to disruptions in the skin microenvironment, where it can form biofilms and produce virulence factors, particularly in papulopustular rosacea.5
Bacillus oleronius has been isolated from D folliculorum mites and provokes inflammatory responses in patients with rosacea by triggering toll-like receptor 2 activation and cytokine secretion.6
Cutibacterium acnes commonly is associated with acne vulgaris. Its role in rosacea is unclear, but recent research suggests it may have a protective effect. A single-arm trial investigated the effects of minocycline on rosacea and found that treatment significantly reduced C acnes but increased microbial species diversity, improving inflammation.7 One longitudinal cohort study of 12 patients with rosacea found that C acnes levels were lower in those older than 60 years. Rosacea severity increased with age and correlated with a decline in C acnes, suggesting that it may confer some protective effect in rosacea.8 This finding is supported by studies that have shown a reduction in C acnes levels in patients with rosacea compared to controls.4,8
Important mechanisms in rosacea include epidermal barrier dysfunction, transepidermal water loss, and decreased stratum corneum hydration, particularly in erythematotelangiectatic and papulopustular subtypes. The resulting alkaline skin pH contributes to barrier instability and heightened inflammation, permitting pathogenic bacteria to proliferate and disrupt skin microbial homeostasis.9 A recent study identified metabolic changes in the skin microbiome of patients with rosacea, showing that increased heme and hydrogen sulfide in rosacea skin microbiomes likely drive inflammation, while healthy skin microbiomes produce more anti-inflammatory adenosylcobalamin, thiazole, and L-isoleucine.1 These findings highlight the link between microbial imbalances and inflammation in rosacea.
The Gut-Skin Axis in Rosacea
Gut microbiota play a critical role in managing systemic inflammation, and microbial dysbiosis in the intestine can influence the skin microbiome in rosacea. Patients with rosacea who have gastrointestinal conditions such as small intestinal bacterial overgrowth and Helicobacter pylori infection experience more severe rosacea symptoms.3,10
Patients with rosacea have distinctive gut microbiota compositions, with an increased prevalence of proinflammatory bacterial species, potentially affecting the skin microbiome.8,11 Systemic antibiotics have been shown to modulate the gut microbiome, indirectly influencing the skin microbiome.11 A recent study demonstrated that doxycycline treatment in patients with rosacea altered skin microbial diversity, reducing C acnes while increasing Weissella confusa—highlighting the complicated relationship between systemic antibiotics and the gut-skin axis.8
Specific probiotics, such as Escherichia coli Nissle, when given orally shifted gut microbial balance to protective microbiota with increased Lactobacillus and Bifidobacteria species and decreased pathogenic bacteria. This improved rosacea symptoms, normalized immunoglobulin A levels, and suppressed cytokine interleukin 8 levels.10 Recent studies also suggest oral sarecycline, a narrow-spectrum antibiotic, may improve papulopustular rosacea symptoms through its anti-inflammatory effects while having minimal impact on gut microbiota diversity.11,12
Gut-derived short-chain fatty acids, which are known to regulate immune function, also have been shown to influence the composition of skin microbiota, suggesting a direct link between gut dysbiosis and skin microbial imbalances. Notably, antibiotic and probiotic treatments targeting the gut microbiome (eg, rifaximin for small intestinal bacterial overgrowth) have been associated with improvements in rosacea symptoms, further underscoring the interconnectedness of the gut-skin axis.13 Understanding how gut-derived inflammation alters the skin microbiome may provide new therapeutic avenues for restoring microbial balance and reducing rosacea severity.
Immune Dysregulation and Inflammatory Pathways
Mechanisms of microbiome-driven inflammation via the innate immune system contribute to rosacea pathogenesis. Toll-like receptor 2 is upregulated in rosacea, producing increased peptides including cathelicidins.13 When abnormally processed, cathelicidins produce proinflammatory peptides and worsen rosacea symptoms such as erythema, telangiectasias, and neutrophilic infiltration by dysregulating the immune system and the skin barrier.6
Heightened levels of cytokines interleukin 8 and interferon α have been identified in patients with rosacea. These cytokines are involved in rosacea pathogenesis, including leukocyte recruitment, angiogenesis, and tissue remodeling and further activate the inflammatory cascade.8,14
Mendelian randomization studies have provided confirmation of a causal link between skin microbiota alterations and inflammatory skin diseases including rosacea.2 Specific alterations in bacteria such as Cutibacterium and Staphylococcus microbial species have been associated with shifts in host immune gene expression, potentially predisposing individuals to abnormal immune activation and inflammation.2,8 These studies show the potential of leveraging precision medicine to design therapies that target pathways that improve microbial imbalances seen in rosacea.
Environmental and Lifestyle Factors Affecting the Skin Microbiome
Individuals with rosacea often have increased sensitivity to environmental and lifestyle stressors such as high temperatures, UV exposure, and sugar and alcohol consumption. These factors influence the composition of the skin microbiome and potentially contribute to rosacea development and disease exacerbation; therefore, trigger avoidance is an important way to manage rosacea.
High temperatures and UV exposure—Demodex activity increases in response to heat exposure and subsequently worsens rosacea symptoms, while exposure to UV radiation can change the composition of the skin microbiome by encouraging inflammatory responses such as oxidative stress reactions.4 This effect on the skin microbiome is driven partly by the increased presence of certain skin microbial species, such as S epidermidis, which secrete virulence factors at higher temperatures and further contribute to inflammation.1,4
High-glycemic diet and alcohol consumption—High-glycemic diets and alcohol intake have been associated with gut dysbiosis and increased disease severity in rosacea. Processed foods and high sugar consumption can promote proinflammatory reactions that cause skin dysbiosis and exacerbate symptoms.15 Increased consumption of anti-inflammatory foods or consumption of probiotics and prebiotics can improve microbial balance.
Therapeutic Implications
The influence of the skin and gut microbiome on rosacea have been well described in the medical literature; therefore, many therapeutic strategies aim to address microbiome dysbiosis, including the use of antibiotics, anthelmintics, and a range of topical agents as well as probiotics, microbiome-friendly skin care products, and dietary modifications.
Antibiotics and Anthelmintics—Topical and oral antibiotics such as metronidazole and doxycycline reduce microbial load and inflammation.5,7,8 Ivermectin, an anthelmintic, has demonstrated efficacy in decreasing Demodex colonization and associated inflammation by interfering with mite survival and reducing bacterial interactions on the skin.5 Recent literature also has explored next-generation antibiotics that disrupt biofilm production by bacteria, which could positively affect outcomes while safeguarding antibiotic stewardship.15 Given its targeted antimicrobial activity and low propensity for microbial resistance, sarecycline represents a promising therapeutic option for managing rosacea symptoms with reduced risk for microbiome-related adverse events.12,16
Probiotics and Skin Care Interventions—Probiotics, prebiotics, and postbiotics have emerged as promising approaches to improve rosacea outcomes. Topical probiotics have been shown to maintain skin microbiome homeostasis, reduce inflammation, and enhance epidermal barrier function, making them a promising adjunctive therapy for rosacea.17,18 Physiological pH cleansers and moisturizers formulated with microbiome-friendly ingredients may reduce transepidermal water loss and improve skin hydration, which are critical in microbial equilibrium.9 Oral administration of E coli Nissle, Lactobacillus, and Bifidobacterium have shown potential in improving microbial balance and reducing disease severity.10
Other Topical Therapies—Azelaic acid and benzoyl peroxide can improve rosacea symptoms by decreasing inflammation and also may shift the skin microbiome.19,20 Formulations of topical therapies, including microencapsulated benzoyl peroxide, show improved efficacy in targeting pathogenic bacteria while maintaining tolerability.19
Dietary Modifications—Avoiding triggers such as alcohol and high-glycemic foods can help reduce gut and skin dysbiosis.13 Polyphenol-rich foods and prebiotic fiber may promote beneficial gut and skin microbial composition and currently are being studied.13
Emerging Therapies—Long-pulsed alexandrite laser therapy has been shown to reduce facial erythema and modulate skin microbiota.21 Patients with treatment-resistant rosacea may benefit from advanced precision targeted antimicrobials.
The future of rosacea treatment may involve integrating established and emerging microbiome-targeted treatment strategies to improve short- and long-term patient outcomes in rosacea.
Conclusion
As our understanding of rosacea, its pathogenesis, and the role of the skin microbiome continues to grow, so does our ability to develop increasingly effective and well-tolerated treatments. Future research should focus on how changes to the skin microbiome can influence disease progression and treatment responses as well as potential therapies targeting the skin microbiome. Integrating precision treatments that restore microbial balance alongside more traditional therapies may improve outcomes by addressing both inflammation and epidermal barrier dysfunction. Additionally, strategies that support a healthy skin microbiome, such as microbiome-friendly skin care and topical probiotics, should be further explored to enhance long-term disease management. There remains a dearth of literature addressing how the skin microbiome of patients with rosacea can be optimized to maximize treatment, highlighting the need for more research into these interventions.
- Joura MI, Jobbágy A, Dunai ZA, et al. Characteristics of the stool, blood and skin microbiome in rosacea patients. Microorganisms. 2024;12:2667. doi:10.3390/microorganisms12122667
- Li X, Chen S, Chen S, et al. Skin microbiome and causal relationships in three dermatological diseases: evidence from Mendelian randomization and Bayesian weighting. Skin Res Technol. 2024;30:E70035. doi:10.1111/srt.70035
- GulbasC aran F, Sar.mustafa S, Ozbag. c.van O, et al. Investigation of factors associated with gut microbiota in Demodex-associated skin conditions. Turkiye Parazitol Derg. 2024;48:171-177. doi:10.4274 /tpd.galenos.2024.93064
- Xiong J, Chen S, Wang P, et al. Characterisation of the bacterial microbiome in patients with rosacea and healthy controls. Eur J Dermatol. 2023;33:612-617. doi:10.1684/ejd.2023.4619
- Nakatsuji T, Cheng JY, Butcher A, et al. Topical ivermectin treatment of rosacea changes the bacterial microbiome of the skin. J Invest Dermatol. Published online October 29, 2024. doi:10.1016 /j.jid.2024.10.592
- Mylonas A, Hawerkamp HC, Wang Y, et al. Type I IFNs link skin-associated dysbiotic commensal bacteria to pathogenic inflammation and angiogenesis in rosacea. JCI Insight. 2023;8:e151846. doi:10.1172/jci.insight.151846
- Zhang Y, Zhou Y, Humbert P, et al. Effect on the skin microbiota of oral minocycline for rosacea. Acta Derm Venereol. 2023;103:adv10331. doi:10.2340/actadv.v103.10331
- Woo YR, Lee SH, Cho SH, et al. Characterization and analysis of the skin microbiota in rosacea: impact of systemic antibiotics. J Clin Med. 2020;9:185. doi:10.3390/jcm9010185
- Marson J, Bhatia N, Graber E, et al. Supplement article: the role of epidermal barrier dysfunction and cutaneous microbiome dysbiosis in the pathogenesis and management of acne vulgaris and rosacea. J Drugs Dermatol. 2022;21:SF3502915-SF35029114. doi:10.36849 /JDD.m0922
- Manzhalii E, Hornuss D, Stremmel W. Intestinal-borne dermatoses significantly improved by oral application of Escherichia coli Nissle 1917. World J Gastroenterol. 2016;22:5415-5421. doi:10.3748 /wjg.v22.i23.5415
- Wang FY, Chi CC. Rosacea, germs, and bowels: a review on gastrointestinal comorbidities and gut-skin axis of rosacea. Adv Ther. 2021;38:1415-1424. doi:10.1007/s12325-021-01624-x
- del Rosso JQ, Draelos ZD, Effron C, et al. Oral sarecycline for treatment of papulopustular rosacea: results of a pilot study of effectiveness and safety. J Drugs Dermatol. 2021;20:426-431. doi:10.36849 /JDD.2021.5923
- Qi X, Xiao Y, Zhang X, et al. Probiotics suppress LL37-generated rosacea-like skin inflammation by modulating the TLR2/MyD88 /NF-êB signaling pathway. Food Funct. 2024;15:8916-8934. doi:10.1039 /d4fo03083d
- Pan L, Li C, Liang Z, et al. Exploring the association between skin microbiota and inflammatory skin diseases: a two-sample Mendelian randomization analysis. Arch Dermatol Res. 2024;316:677. doi:10.1007/s00403-024-03433-y
- Sánchez-Pellicer P, Eguren-Michelena C, García-Gavín J, et al. Rosacea, microbiome and probiotics: the gut-skin axis. Front Microbiol. 2024;14:1323644. doi:10.3389/fmicb.2023.1323644
- Moura IB, Grada A, Spittal W, et al. Profiling the effects of systemic antibiotics for acne, including the narrow-spectrum antibiotic sarecycline, on the human gut microbiota. Front Microbiol. 2022;13:901911. doi:10.3389/fmicb.2022.901911
- Habeebuddin M, Karnati RK, Shiroorkar PN, et al. Topical probiotics: more than a skin deep. Pharmaceutics. 2022;14:557. doi:10.3390/pharmaceutics14030557
- Knackstedt R, Knackstedt T, Gatherwright J. The role of topical probiotics in skin conditions: a systematic review of animal and human studies and implications for future therapies. Exp Dermatol. 2020; 29:15-21. doi:10.1111/exd.14032
- Nong Y, Sugarman J, York JP, et al. Effect of topical microencapsulated benzoyl peroxide on the skin microbiome in rosacea: a randomized, double-blind, crossover, vehicle-controlled clinical trial. J Clin Aesthet Dermatol. 2024;17:19-26.
- Bojar RA, Cunliffe WJ, Holland KT. Disruption of the transmembrane pH gradient—a possible mechanism for the antibacterial action of azelaic acid in Propionibacterium acnes and Staphylococcus epidermidis. J Antimicrob Chemother. 1994;34:321-330. doi:10.1093/jac/34.3.321
- Park S, Jang H, Seong SH, et al. The effects of long-pulsed alexandrite laser therapy on facial redness and skin microbiota compositions in rosacea: a prospective, multicentre, single-arm clinical trial. Photodermatol Photoimmunol Photomed. 2024;40:10.1111/phpp.12921. doi:10.1111/phpp.12921
Rosacea is a chronic inflammatory skin condition affecting the central face—including the cheeks, nose, chin, and forehead—that causes considerable discomfort.1 Its pathogenesis involves immune dysregulation, genetic predisposition, and microbial dysbiosis.2 While immune and environmental factors are known triggers of rosacea, recent research highlights the roles of the gut and skin microbiomes in disease progression. While the skin microbiome interacts directly with the immune system to regulate inflammation and skin homeostasis, the gut microbiome also influences cutaneous inflammation, emphasizing the need to address both topical and internal microbiome imbalances.3 In this article, we review gut and skin microbial alterations in rosacea, focusing on the skin microbiome and including the gut-skin axis implications as well as therapeutic strategies aimed at microbiome balance to enhance patient outcomes.
Skin Microbiome Alterations in Rosacea
The human skin microbiome interacts with the immune system, and microbial imbalances have been shown to contribute to immune dysregulation. Several key microbial species have been identified as playing a large role in rosacea, including Demodex folliculorum, Staphylococcus epidermidis, Bacillus oleronius, and Cutibacterium acnes (Figure).
Demodex folliculorum is a microscopic mite is found in hair follicles and sebaceous glands. Patients with rosacea have higher densities of D folliculorum, which trigger follicular occlusion and immune activation.1 Bacillus oleronius be isolated from D folliculorum and can further activate toll-like receptor 2, leading to cytokine production and immune cell infiltration.3,4 Increased propagation of this mite correlates with shifts in skin microbiome composition, demonstrating increased inflammatory microbial populations.3
Staphylococcus epidermidis normally is commensal but can become pathogenic (pathobiont) in rosacea due to disruptions in the skin microenvironment, where it can form biofilms and produce virulence factors, particularly in papulopustular rosacea.5
Bacillus oleronius has been isolated from D folliculorum mites and provokes inflammatory responses in patients with rosacea by triggering toll-like receptor 2 activation and cytokine secretion.6
Cutibacterium acnes commonly is associated with acne vulgaris. Its role in rosacea is unclear, but recent research suggests it may have a protective effect. A single-arm trial investigated the effects of minocycline on rosacea and found that treatment significantly reduced C acnes but increased microbial species diversity, improving inflammation.7 One longitudinal cohort study of 12 patients with rosacea found that C acnes levels were lower in those older than 60 years. Rosacea severity increased with age and correlated with a decline in C acnes, suggesting that it may confer some protective effect in rosacea.8 This finding is supported by studies that have shown a reduction in C acnes levels in patients with rosacea compared to controls.4,8
Important mechanisms in rosacea include epidermal barrier dysfunction, transepidermal water loss, and decreased stratum corneum hydration, particularly in erythematotelangiectatic and papulopustular subtypes. The resulting alkaline skin pH contributes to barrier instability and heightened inflammation, permitting pathogenic bacteria to proliferate and disrupt skin microbial homeostasis.9 A recent study identified metabolic changes in the skin microbiome of patients with rosacea, showing that increased heme and hydrogen sulfide in rosacea skin microbiomes likely drive inflammation, while healthy skin microbiomes produce more anti-inflammatory adenosylcobalamin, thiazole, and L-isoleucine.1 These findings highlight the link between microbial imbalances and inflammation in rosacea.
The Gut-Skin Axis in Rosacea
Gut microbiota play a critical role in managing systemic inflammation, and microbial dysbiosis in the intestine can influence the skin microbiome in rosacea. Patients with rosacea who have gastrointestinal conditions such as small intestinal bacterial overgrowth and Helicobacter pylori infection experience more severe rosacea symptoms.3,10
Patients with rosacea have distinctive gut microbiota compositions, with an increased prevalence of proinflammatory bacterial species, potentially affecting the skin microbiome.8,11 Systemic antibiotics have been shown to modulate the gut microbiome, indirectly influencing the skin microbiome.11 A recent study demonstrated that doxycycline treatment in patients with rosacea altered skin microbial diversity, reducing C acnes while increasing Weissella confusa—highlighting the complicated relationship between systemic antibiotics and the gut-skin axis.8
Specific probiotics, such as Escherichia coli Nissle, when given orally shifted gut microbial balance to protective microbiota with increased Lactobacillus and Bifidobacteria species and decreased pathogenic bacteria. This improved rosacea symptoms, normalized immunoglobulin A levels, and suppressed cytokine interleukin 8 levels.10 Recent studies also suggest oral sarecycline, a narrow-spectrum antibiotic, may improve papulopustular rosacea symptoms through its anti-inflammatory effects while having minimal impact on gut microbiota diversity.11,12
Gut-derived short-chain fatty acids, which are known to regulate immune function, also have been shown to influence the composition of skin microbiota, suggesting a direct link between gut dysbiosis and skin microbial imbalances. Notably, antibiotic and probiotic treatments targeting the gut microbiome (eg, rifaximin for small intestinal bacterial overgrowth) have been associated with improvements in rosacea symptoms, further underscoring the interconnectedness of the gut-skin axis.13 Understanding how gut-derived inflammation alters the skin microbiome may provide new therapeutic avenues for restoring microbial balance and reducing rosacea severity.
Immune Dysregulation and Inflammatory Pathways
Mechanisms of microbiome-driven inflammation via the innate immune system contribute to rosacea pathogenesis. Toll-like receptor 2 is upregulated in rosacea, producing increased peptides including cathelicidins.13 When abnormally processed, cathelicidins produce proinflammatory peptides and worsen rosacea symptoms such as erythema, telangiectasias, and neutrophilic infiltration by dysregulating the immune system and the skin barrier.6
Heightened levels of cytokines interleukin 8 and interferon α have been identified in patients with rosacea. These cytokines are involved in rosacea pathogenesis, including leukocyte recruitment, angiogenesis, and tissue remodeling and further activate the inflammatory cascade.8,14
Mendelian randomization studies have provided confirmation of a causal link between skin microbiota alterations and inflammatory skin diseases including rosacea.2 Specific alterations in bacteria such as Cutibacterium and Staphylococcus microbial species have been associated with shifts in host immune gene expression, potentially predisposing individuals to abnormal immune activation and inflammation.2,8 These studies show the potential of leveraging precision medicine to design therapies that target pathways that improve microbial imbalances seen in rosacea.
Environmental and Lifestyle Factors Affecting the Skin Microbiome
Individuals with rosacea often have increased sensitivity to environmental and lifestyle stressors such as high temperatures, UV exposure, and sugar and alcohol consumption. These factors influence the composition of the skin microbiome and potentially contribute to rosacea development and disease exacerbation; therefore, trigger avoidance is an important way to manage rosacea.
High temperatures and UV exposure—Demodex activity increases in response to heat exposure and subsequently worsens rosacea symptoms, while exposure to UV radiation can change the composition of the skin microbiome by encouraging inflammatory responses such as oxidative stress reactions.4 This effect on the skin microbiome is driven partly by the increased presence of certain skin microbial species, such as S epidermidis, which secrete virulence factors at higher temperatures and further contribute to inflammation.1,4
High-glycemic diet and alcohol consumption—High-glycemic diets and alcohol intake have been associated with gut dysbiosis and increased disease severity in rosacea. Processed foods and high sugar consumption can promote proinflammatory reactions that cause skin dysbiosis and exacerbate symptoms.15 Increased consumption of anti-inflammatory foods or consumption of probiotics and prebiotics can improve microbial balance.
Therapeutic Implications
The influence of the skin and gut microbiome on rosacea have been well described in the medical literature; therefore, many therapeutic strategies aim to address microbiome dysbiosis, including the use of antibiotics, anthelmintics, and a range of topical agents as well as probiotics, microbiome-friendly skin care products, and dietary modifications.
Antibiotics and Anthelmintics—Topical and oral antibiotics such as metronidazole and doxycycline reduce microbial load and inflammation.5,7,8 Ivermectin, an anthelmintic, has demonstrated efficacy in decreasing Demodex colonization and associated inflammation by interfering with mite survival and reducing bacterial interactions on the skin.5 Recent literature also has explored next-generation antibiotics that disrupt biofilm production by bacteria, which could positively affect outcomes while safeguarding antibiotic stewardship.15 Given its targeted antimicrobial activity and low propensity for microbial resistance, sarecycline represents a promising therapeutic option for managing rosacea symptoms with reduced risk for microbiome-related adverse events.12,16
Probiotics and Skin Care Interventions—Probiotics, prebiotics, and postbiotics have emerged as promising approaches to improve rosacea outcomes. Topical probiotics have been shown to maintain skin microbiome homeostasis, reduce inflammation, and enhance epidermal barrier function, making them a promising adjunctive therapy for rosacea.17,18 Physiological pH cleansers and moisturizers formulated with microbiome-friendly ingredients may reduce transepidermal water loss and improve skin hydration, which are critical in microbial equilibrium.9 Oral administration of E coli Nissle, Lactobacillus, and Bifidobacterium have shown potential in improving microbial balance and reducing disease severity.10
Other Topical Therapies—Azelaic acid and benzoyl peroxide can improve rosacea symptoms by decreasing inflammation and also may shift the skin microbiome.19,20 Formulations of topical therapies, including microencapsulated benzoyl peroxide, show improved efficacy in targeting pathogenic bacteria while maintaining tolerability.19
Dietary Modifications—Avoiding triggers such as alcohol and high-glycemic foods can help reduce gut and skin dysbiosis.13 Polyphenol-rich foods and prebiotic fiber may promote beneficial gut and skin microbial composition and currently are being studied.13
Emerging Therapies—Long-pulsed alexandrite laser therapy has been shown to reduce facial erythema and modulate skin microbiota.21 Patients with treatment-resistant rosacea may benefit from advanced precision targeted antimicrobials.
The future of rosacea treatment may involve integrating established and emerging microbiome-targeted treatment strategies to improve short- and long-term patient outcomes in rosacea.
Conclusion
As our understanding of rosacea, its pathogenesis, and the role of the skin microbiome continues to grow, so does our ability to develop increasingly effective and well-tolerated treatments. Future research should focus on how changes to the skin microbiome can influence disease progression and treatment responses as well as potential therapies targeting the skin microbiome. Integrating precision treatments that restore microbial balance alongside more traditional therapies may improve outcomes by addressing both inflammation and epidermal barrier dysfunction. Additionally, strategies that support a healthy skin microbiome, such as microbiome-friendly skin care and topical probiotics, should be further explored to enhance long-term disease management. There remains a dearth of literature addressing how the skin microbiome of patients with rosacea can be optimized to maximize treatment, highlighting the need for more research into these interventions.
- Joura MI, Jobbágy A, Dunai ZA, et al. Characteristics of the stool, blood and skin microbiome in rosacea patients. Microorganisms. 2024;12:2667. doi:10.3390/microorganisms12122667
- Li X, Chen S, Chen S, et al. Skin microbiome and causal relationships in three dermatological diseases: evidence from Mendelian randomization and Bayesian weighting. Skin Res Technol. 2024;30:E70035. doi:10.1111/srt.70035
- GulbasC aran F, Sar.mustafa S, Ozbag. c.van O, et al. Investigation of factors associated with gut microbiota in Demodex-associated skin conditions. Turkiye Parazitol Derg. 2024;48:171-177. doi:10.4274 /tpd.galenos.2024.93064
- Xiong J, Chen S, Wang P, et al. Characterisation of the bacterial microbiome in patients with rosacea and healthy controls. Eur J Dermatol. 2023;33:612-617. doi:10.1684/ejd.2023.4619
- Nakatsuji T, Cheng JY, Butcher A, et al. Topical ivermectin treatment of rosacea changes the bacterial microbiome of the skin. J Invest Dermatol. Published online October 29, 2024. doi:10.1016 /j.jid.2024.10.592
- Mylonas A, Hawerkamp HC, Wang Y, et al. Type I IFNs link skin-associated dysbiotic commensal bacteria to pathogenic inflammation and angiogenesis in rosacea. JCI Insight. 2023;8:e151846. doi:10.1172/jci.insight.151846
- Zhang Y, Zhou Y, Humbert P, et al. Effect on the skin microbiota of oral minocycline for rosacea. Acta Derm Venereol. 2023;103:adv10331. doi:10.2340/actadv.v103.10331
- Woo YR, Lee SH, Cho SH, et al. Characterization and analysis of the skin microbiota in rosacea: impact of systemic antibiotics. J Clin Med. 2020;9:185. doi:10.3390/jcm9010185
- Marson J, Bhatia N, Graber E, et al. Supplement article: the role of epidermal barrier dysfunction and cutaneous microbiome dysbiosis in the pathogenesis and management of acne vulgaris and rosacea. J Drugs Dermatol. 2022;21:SF3502915-SF35029114. doi:10.36849 /JDD.m0922
- Manzhalii E, Hornuss D, Stremmel W. Intestinal-borne dermatoses significantly improved by oral application of Escherichia coli Nissle 1917. World J Gastroenterol. 2016;22:5415-5421. doi:10.3748 /wjg.v22.i23.5415
- Wang FY, Chi CC. Rosacea, germs, and bowels: a review on gastrointestinal comorbidities and gut-skin axis of rosacea. Adv Ther. 2021;38:1415-1424. doi:10.1007/s12325-021-01624-x
- del Rosso JQ, Draelos ZD, Effron C, et al. Oral sarecycline for treatment of papulopustular rosacea: results of a pilot study of effectiveness and safety. J Drugs Dermatol. 2021;20:426-431. doi:10.36849 /JDD.2021.5923
- Qi X, Xiao Y, Zhang X, et al. Probiotics suppress LL37-generated rosacea-like skin inflammation by modulating the TLR2/MyD88 /NF-êB signaling pathway. Food Funct. 2024;15:8916-8934. doi:10.1039 /d4fo03083d
- Pan L, Li C, Liang Z, et al. Exploring the association between skin microbiota and inflammatory skin diseases: a two-sample Mendelian randomization analysis. Arch Dermatol Res. 2024;316:677. doi:10.1007/s00403-024-03433-y
- Sánchez-Pellicer P, Eguren-Michelena C, García-Gavín J, et al. Rosacea, microbiome and probiotics: the gut-skin axis. Front Microbiol. 2024;14:1323644. doi:10.3389/fmicb.2023.1323644
- Moura IB, Grada A, Spittal W, et al. Profiling the effects of systemic antibiotics for acne, including the narrow-spectrum antibiotic sarecycline, on the human gut microbiota. Front Microbiol. 2022;13:901911. doi:10.3389/fmicb.2022.901911
- Habeebuddin M, Karnati RK, Shiroorkar PN, et al. Topical probiotics: more than a skin deep. Pharmaceutics. 2022;14:557. doi:10.3390/pharmaceutics14030557
- Knackstedt R, Knackstedt T, Gatherwright J. The role of topical probiotics in skin conditions: a systematic review of animal and human studies and implications for future therapies. Exp Dermatol. 2020; 29:15-21. doi:10.1111/exd.14032
- Nong Y, Sugarman J, York JP, et al. Effect of topical microencapsulated benzoyl peroxide on the skin microbiome in rosacea: a randomized, double-blind, crossover, vehicle-controlled clinical trial. J Clin Aesthet Dermatol. 2024;17:19-26.
- Bojar RA, Cunliffe WJ, Holland KT. Disruption of the transmembrane pH gradient—a possible mechanism for the antibacterial action of azelaic acid in Propionibacterium acnes and Staphylococcus epidermidis. J Antimicrob Chemother. 1994;34:321-330. doi:10.1093/jac/34.3.321
- Park S, Jang H, Seong SH, et al. The effects of long-pulsed alexandrite laser therapy on facial redness and skin microbiota compositions in rosacea: a prospective, multicentre, single-arm clinical trial. Photodermatol Photoimmunol Photomed. 2024;40:10.1111/phpp.12921. doi:10.1111/phpp.12921
The Skin Microbiome in Rosacea: Mechanisms, Gut-Skin Interactions, and Therapeutic Implications
The Skin Microbiome in Rosacea: Mechanisms, Gut-Skin Interactions, and Therapeutic Implications
PRACTICE POINTS:
- It is important to assess both the gut and skin microbiomes in patients with rosacea (eg, incorporate evaluation of Demodex folliculorum density, take a gut-health history).
- Narrow-spectrum antibiotics such as sarecycline or anthelmintics such as topical ivermectin target pathogens while preserving beneficial flora.
- Patients with rosacea should be counseled on trigger avoidance as well as pH-balanced, microbiomefriendly skin care and lifestyle tips to strengthen the skin barrier.

Can We Successfully Adapt to Changes in Direction and Support for Acne?
Can We Successfully Adapt to Changes in Direction and Support for Acne?
How did I develop a strong interest in acne and rosacea? Interest on a personal level was with me throughout my adolescence and post-teen years as I suffered with very severe facial acne from ages 13 through 23 (1967-1977). I was sometimes called “pizza face” in high school, and biweekly trips to a dermatology office that always had a packed waiting room were of little help that I could appreciate visibly. Six straight years of extractions, intralesional injections, draining of fluctuant cysts, UVC light treatments, oral tetracycline, irritating topical formulations of benzoyl peroxide and tretinoin, and topical sulfacetamide-sulfur products resulted in minimal improvement. However, maybe all of this did something to what was happening underneath the skin surface, as I have no residual acne scars. I do recall vividly that I walked the halls in high school and college consistently affected by a very red face from the topical agents and smelling like rotten eggs from the topical sulfur application. I fortunately handled it well emotionally and socially, for which I am very thankful. Many people affected with acne do not.
In dermatology, I have always had a strong interest in pathophysiology and therapeutics, rooted I am sure in my background as a pharmacist. Although I was always interested in acne therapy, I was fully captivated by a presentation given by Dr. Jim Leyden many years ago at a small meeting in Myrtle Beach, South Carolina. He brought the subject of acne to life in a way that more than grabbed my complete attention and ignited an interest in learning everything I could about it. Over time, I was fortunate enough to work alongside Dr. Leyden and many other household names in acne at meetings and publications to further education on one of the most common disease states seen in ambulatory dermatology practices worldwide. The rest is history, leading to almost 4 decades of work in acne on many levels in dermatology, all being efforts that I am grateful for.
What I have observed to date is that we have had few revolutionary advances in acne therapy, the major one being oral isotretinoin, which was first brought to market in 1982. We are still utilizing many of the same therapeutic agents that I used back when I was treated for acne. A few new topical compounds have emerged, such as dapsone and clascoterone, and a narrow-spectrum tetracycline agent, sarecycline, also was developed. These agents do represent important advances with some specific benefits. There have been many major improvements in drug delivery formulations, including several vehicle technologies that allow augmented skin tolerability, increased efficacy, and improved stability, allowing for combination therapy products containing 2 or 3 active ingredients. A recent example is the first triple-combination topical acne therapy with excellent supporting data on speed of onset, efficacy, and safety.1
Technological advances also have aided in the development of modified- or extended-release formulations of oral antibiotics, such as doxycycline and minocycline, which allow for reduced adverse effects and lower daily dosages. Lidose formulations of isotretinoin have circumvented the need for concurrent ingestion of a high-fat meal to facilitate its absorption in the gastrointestinal tract (as required with conventional formulations). Many hours also have been spent on delivery devices and vehicles such as pumps, foams, and aqueous-based gels. Let us not forget the efforts and myriad products directed at skin care, cosmeceuticals, and physical devices (lasers and lights) for acne. Regardless of the above, we have not seen the monumental therapeutic and research revolution for acne that we have experienced more recently with biologic agents, Janus kinase inhibitors, and other modes of action for many common disease states such as atopic dermatitis, psoriasis, alopecia areata, vitiligo, hidradenitis suppurativa, prurigo nodularis, and chronic spontaneous urticaria.
Unfortunately, the slow development of advances in treatments for acne has been compounded further by the widespread availability of generic equivalents of most topical and oral therapies along with several over-the- counter topical medications. The expanded skin care and cosmeceutical product world has further diluted the perceived value of topical prescription therapies for acne. The marked difficulty in achieving and sustaining total clearance of acne, with the exception of many individuals treated with oral isotretinoin, results in many patients searching for other options, often through sources beyond dermatology practices (eg, the internet). While some of these sources may provide valid suggestions, they often are not truly substantiated by valid clinical research and are not formally regulated by the US Food and Drug Administration.
All of the above, in addition to the barriers to medication coverage put in place by third-party organizations such as pharmacy benefit managers, have contributed to the extreme slowdown in the development of new prescription therapies for acne. What this leads me to believe is that until there is a true meeting of the minds of all stakeholders on policies that facilitate access to both established and newly available acne therapies, there will be an enduring diminished incentive to support the development of newer acne treatments that will continue to spiral progressively downward. Some research on acne will always continue, such as the search for an acne vaccine and cutaneous microbiome alterations that are in progress.2,3 However, I do not see much happening in the foreseeable future. I am not inherently a pessimist or a “prophet of doom,” so I sincerely hope I am wrong.
- Stein Gold L, Baldwin H, Kircik LH, et al. Efficacy and safety of a fixed-dose clindamycin phosphate 1.2%, benzoyl peroxide 3.1%, and adapalene 0.15% gel for moderate-to-severe acne: a randomized phase II study of the first triple-combination drug. Am J Clin Dermatol. 2022;23:93-104. doi:10.1007/s40257-021-00650-3
- Keshari S, Kumar M, Balasubramaniam A, et al. Prospects of acne vaccines targeting secreted virulence factors of Cutibacterium acnes. Expert Rev Vaccines. 2019;18:433-437. doi:10.1080/14760584
- Dreno B, Dekio I, Baldwin H, et al. Acne microbiome: from phyla to phylotypes. J Eur Acad Dermatol Venereol. 2024;38:657- 664. doi:10.1111/jdv.19540 .2019.1593830
How did I develop a strong interest in acne and rosacea? Interest on a personal level was with me throughout my adolescence and post-teen years as I suffered with very severe facial acne from ages 13 through 23 (1967-1977). I was sometimes called “pizza face” in high school, and biweekly trips to a dermatology office that always had a packed waiting room were of little help that I could appreciate visibly. Six straight years of extractions, intralesional injections, draining of fluctuant cysts, UVC light treatments, oral tetracycline, irritating topical formulations of benzoyl peroxide and tretinoin, and topical sulfacetamide-sulfur products resulted in minimal improvement. However, maybe all of this did something to what was happening underneath the skin surface, as I have no residual acne scars. I do recall vividly that I walked the halls in high school and college consistently affected by a very red face from the topical agents and smelling like rotten eggs from the topical sulfur application. I fortunately handled it well emotionally and socially, for which I am very thankful. Many people affected with acne do not.
In dermatology, I have always had a strong interest in pathophysiology and therapeutics, rooted I am sure in my background as a pharmacist. Although I was always interested in acne therapy, I was fully captivated by a presentation given by Dr. Jim Leyden many years ago at a small meeting in Myrtle Beach, South Carolina. He brought the subject of acne to life in a way that more than grabbed my complete attention and ignited an interest in learning everything I could about it. Over time, I was fortunate enough to work alongside Dr. Leyden and many other household names in acne at meetings and publications to further education on one of the most common disease states seen in ambulatory dermatology practices worldwide. The rest is history, leading to almost 4 decades of work in acne on many levels in dermatology, all being efforts that I am grateful for.
What I have observed to date is that we have had few revolutionary advances in acne therapy, the major one being oral isotretinoin, which was first brought to market in 1982. We are still utilizing many of the same therapeutic agents that I used back when I was treated for acne. A few new topical compounds have emerged, such as dapsone and clascoterone, and a narrow-spectrum tetracycline agent, sarecycline, also was developed. These agents do represent important advances with some specific benefits. There have been many major improvements in drug delivery formulations, including several vehicle technologies that allow augmented skin tolerability, increased efficacy, and improved stability, allowing for combination therapy products containing 2 or 3 active ingredients. A recent example is the first triple-combination topical acne therapy with excellent supporting data on speed of onset, efficacy, and safety.1
Technological advances also have aided in the development of modified- or extended-release formulations of oral antibiotics, such as doxycycline and minocycline, which allow for reduced adverse effects and lower daily dosages. Lidose formulations of isotretinoin have circumvented the need for concurrent ingestion of a high-fat meal to facilitate its absorption in the gastrointestinal tract (as required with conventional formulations). Many hours also have been spent on delivery devices and vehicles such as pumps, foams, and aqueous-based gels. Let us not forget the efforts and myriad products directed at skin care, cosmeceuticals, and physical devices (lasers and lights) for acne. Regardless of the above, we have not seen the monumental therapeutic and research revolution for acne that we have experienced more recently with biologic agents, Janus kinase inhibitors, and other modes of action for many common disease states such as atopic dermatitis, psoriasis, alopecia areata, vitiligo, hidradenitis suppurativa, prurigo nodularis, and chronic spontaneous urticaria.
Unfortunately, the slow development of advances in treatments for acne has been compounded further by the widespread availability of generic equivalents of most topical and oral therapies along with several over-the- counter topical medications. The expanded skin care and cosmeceutical product world has further diluted the perceived value of topical prescription therapies for acne. The marked difficulty in achieving and sustaining total clearance of acne, with the exception of many individuals treated with oral isotretinoin, results in many patients searching for other options, often through sources beyond dermatology practices (eg, the internet). While some of these sources may provide valid suggestions, they often are not truly substantiated by valid clinical research and are not formally regulated by the US Food and Drug Administration.
All of the above, in addition to the barriers to medication coverage put in place by third-party organizations such as pharmacy benefit managers, have contributed to the extreme slowdown in the development of new prescription therapies for acne. What this leads me to believe is that until there is a true meeting of the minds of all stakeholders on policies that facilitate access to both established and newly available acne therapies, there will be an enduring diminished incentive to support the development of newer acne treatments that will continue to spiral progressively downward. Some research on acne will always continue, such as the search for an acne vaccine and cutaneous microbiome alterations that are in progress.2,3 However, I do not see much happening in the foreseeable future. I am not inherently a pessimist or a “prophet of doom,” so I sincerely hope I am wrong.
- Stein Gold L, Baldwin H, Kircik LH, et al. Efficacy and safety of a fixed-dose clindamycin phosphate 1.2%, benzoyl peroxide 3.1%, and adapalene 0.15% gel for moderate-to-severe acne: a randomized phase II study of the first triple-combination drug. Am J Clin Dermatol. 2022;23:93-104. doi:10.1007/s40257-021-00650-3
- Keshari S, Kumar M, Balasubramaniam A, et al. Prospects of acne vaccines targeting secreted virulence factors of Cutibacterium acnes. Expert Rev Vaccines. 2019;18:433-437. doi:10.1080/14760584
- Dreno B, Dekio I, Baldwin H, et al. Acne microbiome: from phyla to phylotypes. J Eur Acad Dermatol Venereol. 2024;38:657- 664. doi:10.1111/jdv.19540 .2019.1593830
Can We Successfully Adapt to Changes in Direction and Support for Acne?
Can We Successfully Adapt to Changes in Direction and Support for Acne?
Navigating Moonlighting Opportunities During Dermatology Training
Navigating Moonlighting Opportunities During Dermatology Training
Residents and fellows in training have to navigate time management to balance reading, hands-on training, family responsibilities, exercise, diet, and sleep requirements. In addition, they grapple with the stress of financial commitments for food, housing, clothing, family members, transportation, and student loans. A brilliant friend of mine once said that she struggled throughout residency and her early career to find balance until it finally occurred to her that, while balance was aspirational, resilience was key. All that said, residents in training may find it appealing to earn a little extra money and gain additional clinical experience through moonlighting. This article discusses some key considerations when embarking on such a decision, including the effects of moonlighting on other commitments and some logistical factors to consider.
Will Moonlighting Adversely Affect My Other Commitments?
Residency and fellowship are precious opportunities to gain medical knowledge, hone your ability to make diagnoses through complex pattern recognition, and refine the necessary surgical and interpersonal skills to carry you through a successful career. Dermatology encompasses a vast array of conditions related only by their manifestation in skin. Dermatology residents and fellows may spend fewer sleepless hours on call, but the reading requirements are massive. Our treatment armamentarium has expanded rapidly with highly effective treatments for chronic conditions that have a dramatic impact on quality of life. With so many effective agents available, the choice often relates as much to comorbidities as to disease severity and location. There is so much to learn.
While making a full commitment to acquiring the skills of an expert clinician, it is important for residents to remain aware of those who depend on you—in particular, the fleeting time you have with your growing children. They grow up fast, and your interactions with them determine who they will grow up to be. In the past, salt, silk, gold, and jewels were the world’s greatest luxuries. Now, it’s time—time with family, time for self-care, time to reflect, and time to rest and renew. Be careful how you squander time in exchange for material possessions.
What Logistical Factors Should You Consider When Embarking on Moonlighting?
There are clearly stated policies from the Accreditation Council for Graduate Medical Education for when moonlighting can occur during training.1 It should not occur during typical residency or fellowship work hours, and the individual must be in good standing academically and progressing well on their journey to becoming a competent dermatologist. They must also have the appropriate skills to practice in the field of medicine chosen for moonlighting.
Moonlighting opportunities may exist in the form of emergency department or “quick clinic” coverage, especially for the evaluation and treatment of acute minor illnesses. Fellows who have completed a dermatology residency may supervise dermatology residents in afterhours or weekend clinics, offering enhanced opportunities for autonomy, additional clinical experience, and some welcome cash. To make such clinics viable, the office space must be available; the building must be open; and the costs of the space, scheduling, reception, and security services must be covered as well as nursing support (which should be voluntary and likely will require overtime pay scales). After all of these—as well as supplies—have been paid for, what is left is what is available to distribute as pay for service. Working through these factors provides valuable experience in resource management and helps prepare trainees for the economic realities of private practice. Large organizations may be able to provide the space and support, but all of that needs to be paid for through the proceeds that come from the patient care provided. No-show rates often are quite high for after-hours and weekend clinics, but the expenses for those unfilled appointment slots remain and must be paid in full. Be sure the demand exists and that you plan appropriately with strategic overbooking based on historical data on patient mix, procedural needs, and no-show rates.
My department has supported resident and fellow requests for moonlighting opportunities in the past. The most successful model was to have a limited number of early morning appointment slots prior to the start of morning didactics. Security typically already exists, rooms are available, and patients can be seen and still get to work or get their kids to school. No-show rates remained very low for morning appointments, and strategic overbooking was unnecessary.
In contrast, evening and weekend clinics start out strong with high patient satisfaction and deteriorate fairly quickly with accelerating no-show rates. People are busy at the end of the day, and unforeseen circumstances often affect their ability to keep an appointment. Weekends are precious; potential patients may be less schedule minded in the evenings and on weekends, and the residents and fellows themselves often find it stressful to commit to giving up a chunk of weekend time on a scheduled basis.
Before you commit to a moonlighting job, be sure to weigh all of the above factors and be sure the juice is worth the squeeze.
Final Thoughts
Moonlighting opportunities are a way to acquire both clinical and management skills and can provide a welcome extra bit of cash to ease financial burdens, but these benefits should be balanced with other time commitments and overall quality of life. Time is precious—choose wisely and be sure you spend it well.
- Accreditation Council for Graduate Medical Education. Common Program Requirements (Residency). Updated September 17, 2022. https://www.acgme.org/globalassets/pfassets/programrequirements/cprresidency_2023v3.pdf
Residents and fellows in training have to navigate time management to balance reading, hands-on training, family responsibilities, exercise, diet, and sleep requirements. In addition, they grapple with the stress of financial commitments for food, housing, clothing, family members, transportation, and student loans. A brilliant friend of mine once said that she struggled throughout residency and her early career to find balance until it finally occurred to her that, while balance was aspirational, resilience was key. All that said, residents in training may find it appealing to earn a little extra money and gain additional clinical experience through moonlighting. This article discusses some key considerations when embarking on such a decision, including the effects of moonlighting on other commitments and some logistical factors to consider.
Will Moonlighting Adversely Affect My Other Commitments?
Residency and fellowship are precious opportunities to gain medical knowledge, hone your ability to make diagnoses through complex pattern recognition, and refine the necessary surgical and interpersonal skills to carry you through a successful career. Dermatology encompasses a vast array of conditions related only by their manifestation in skin. Dermatology residents and fellows may spend fewer sleepless hours on call, but the reading requirements are massive. Our treatment armamentarium has expanded rapidly with highly effective treatments for chronic conditions that have a dramatic impact on quality of life. With so many effective agents available, the choice often relates as much to comorbidities as to disease severity and location. There is so much to learn.
While making a full commitment to acquiring the skills of an expert clinician, it is important for residents to remain aware of those who depend on you—in particular, the fleeting time you have with your growing children. They grow up fast, and your interactions with them determine who they will grow up to be. In the past, salt, silk, gold, and jewels were the world’s greatest luxuries. Now, it’s time—time with family, time for self-care, time to reflect, and time to rest and renew. Be careful how you squander time in exchange for material possessions.
What Logistical Factors Should You Consider When Embarking on Moonlighting?
There are clearly stated policies from the Accreditation Council for Graduate Medical Education for when moonlighting can occur during training.1 It should not occur during typical residency or fellowship work hours, and the individual must be in good standing academically and progressing well on their journey to becoming a competent dermatologist. They must also have the appropriate skills to practice in the field of medicine chosen for moonlighting.
Moonlighting opportunities may exist in the form of emergency department or “quick clinic” coverage, especially for the evaluation and treatment of acute minor illnesses. Fellows who have completed a dermatology residency may supervise dermatology residents in afterhours or weekend clinics, offering enhanced opportunities for autonomy, additional clinical experience, and some welcome cash. To make such clinics viable, the office space must be available; the building must be open; and the costs of the space, scheduling, reception, and security services must be covered as well as nursing support (which should be voluntary and likely will require overtime pay scales). After all of these—as well as supplies—have been paid for, what is left is what is available to distribute as pay for service. Working through these factors provides valuable experience in resource management and helps prepare trainees for the economic realities of private practice. Large organizations may be able to provide the space and support, but all of that needs to be paid for through the proceeds that come from the patient care provided. No-show rates often are quite high for after-hours and weekend clinics, but the expenses for those unfilled appointment slots remain and must be paid in full. Be sure the demand exists and that you plan appropriately with strategic overbooking based on historical data on patient mix, procedural needs, and no-show rates.
My department has supported resident and fellow requests for moonlighting opportunities in the past. The most successful model was to have a limited number of early morning appointment slots prior to the start of morning didactics. Security typically already exists, rooms are available, and patients can be seen and still get to work or get their kids to school. No-show rates remained very low for morning appointments, and strategic overbooking was unnecessary.
In contrast, evening and weekend clinics start out strong with high patient satisfaction and deteriorate fairly quickly with accelerating no-show rates. People are busy at the end of the day, and unforeseen circumstances often affect their ability to keep an appointment. Weekends are precious; potential patients may be less schedule minded in the evenings and on weekends, and the residents and fellows themselves often find it stressful to commit to giving up a chunk of weekend time on a scheduled basis.
Before you commit to a moonlighting job, be sure to weigh all of the above factors and be sure the juice is worth the squeeze.
Final Thoughts
Moonlighting opportunities are a way to acquire both clinical and management skills and can provide a welcome extra bit of cash to ease financial burdens, but these benefits should be balanced with other time commitments and overall quality of life. Time is precious—choose wisely and be sure you spend it well.
- Accreditation Council for Graduate Medical Education. Common Program Requirements (Residency). Updated September 17, 2022. https://www.acgme.org/globalassets/pfassets/programrequirements/cprresidency_2023v3.pdf
- Accreditation Council for Graduate Medical Education. Common Program Requirements (Residency). Updated September 17, 2022. https://www.acgme.org/globalassets/pfassets/programrequirements/cprresidency_2023v3.pdf
Navigating Moonlighting Opportunities During Dermatology Training
Navigating Moonlighting Opportunities During Dermatology Training
PRACTICE POINTS
- Dermatology training demands extensive study and hands-on skill development, which need to be balanced with family time, finances, and self-care.
- Before moonlighting, ensure it will not compromise your family’s quality of life or your core residency/fellowship commitments and that your program’s policies permit it.
- Carefully assess logistics to determine if an afterhours or weekend clinic can be a financially viable moonlighting opportunity.
Multiple Fungating Plaques on the Face, Arms, and Legs
Multiple Fungating Plaques on the Face, Arms, and Legs
THE DIAGNOSIS: Mpox
Histologic examination demonstrated dense aggregates of necrotic cellular debris composed of karyorrhectic nuclear fragments intermixed with neutrophils, lymphocytes, and histiocytes. Eosinophilic intracytoplasmic inclusions also were observed (Figure 1). The bacterial, fungal, and mycobacterial histologic special stains and cultures were negative. Three weeks after the initial visit with dermatology, the patient was admitted to the hospital for worsening symptoms of fever, chills, and painful erythema surrounding the skin lesions. Serology and viral workup revealed a positive mpox polymerase chain reaction test, suggesting a diagnosis of mpox. Following the Centers for Disease Control and Prevention protocol, the patient was started on oral tecovirimat 200 mg twice daily for 3 weeks and intravenous infusions of cidofovir 345 mg once weekly for 2 weeks. After treatment was initiated, the skin lesions showed rapid improvement (Figure 2), and he was discharged from the hospital after finishing the second dose of cidofovir. Four months after the initial dermatology consultation, the lesions had resolved completely with residual scarring. At that time, the patient had full movement of the right eye.
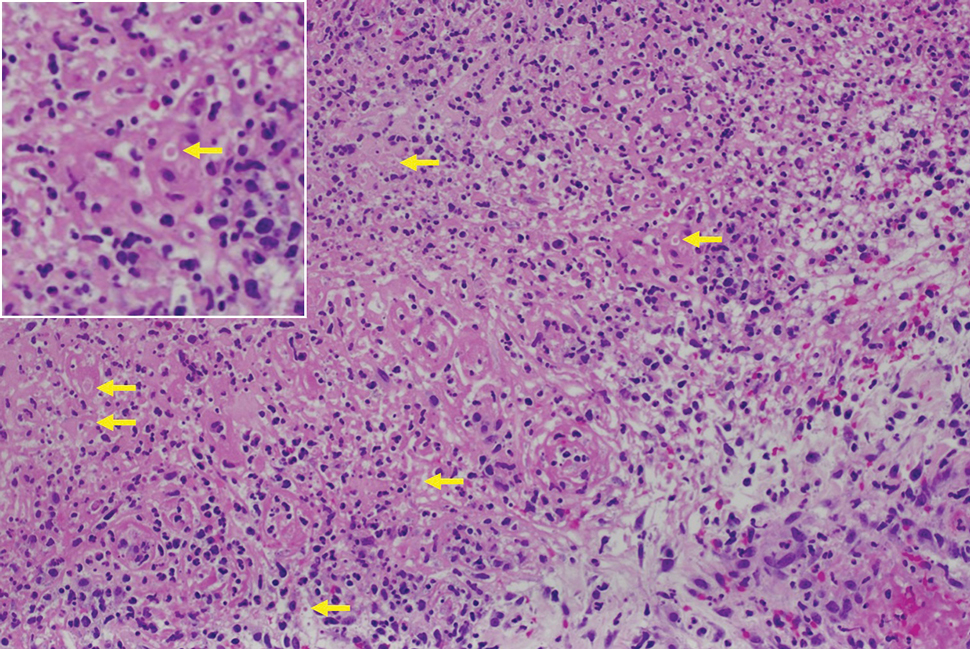
shows higher digital magnification of eosinophilic inclusions observed throughout the biopsy specimen (original magnification ×400).
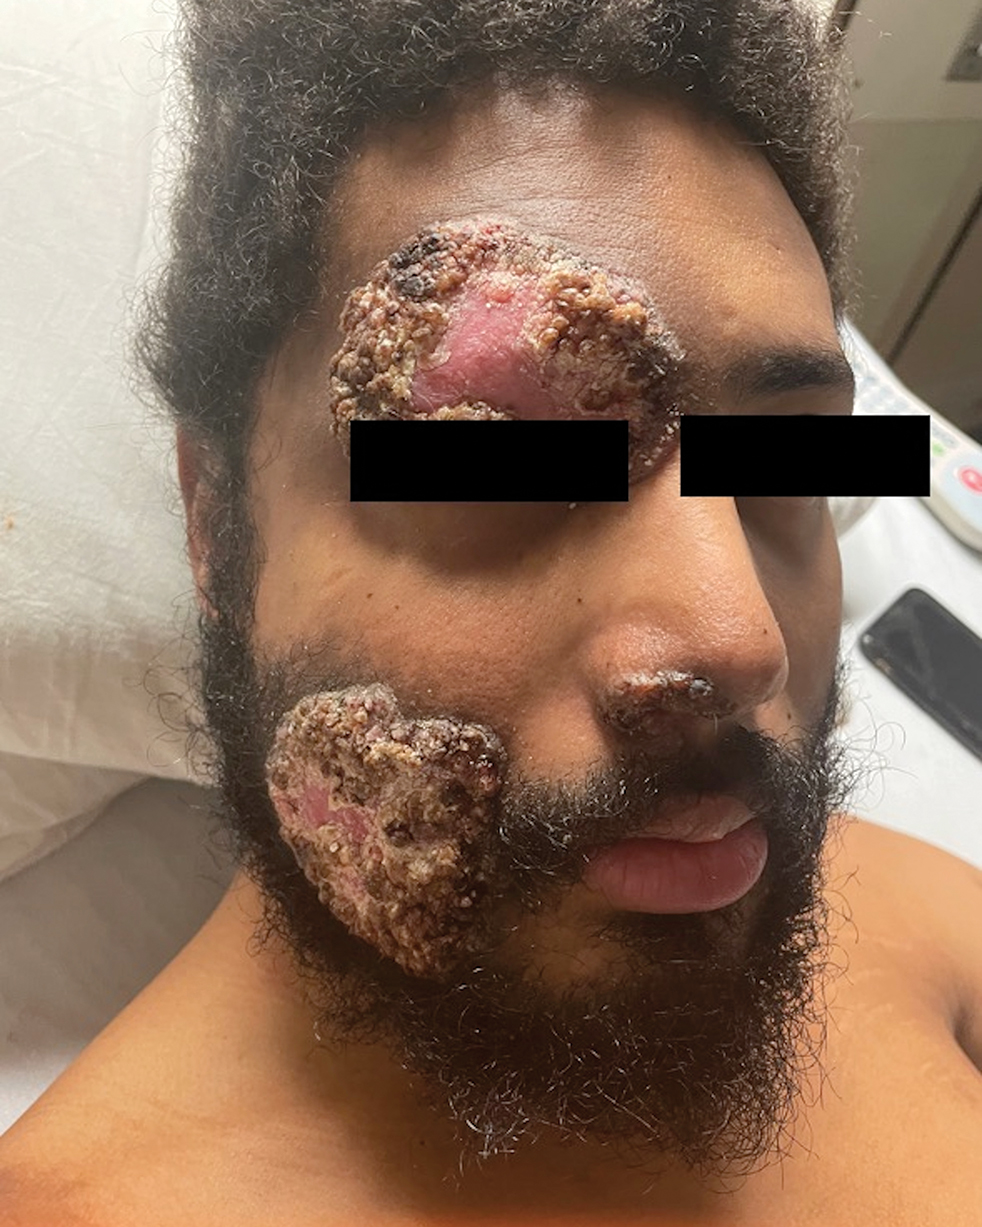
Mpox virus is a member of the Poxviridae family of zoonotic viruses, which are transmitted from animals to humans. The mpox virus is brick-shaped (rectangular) and has a genome of linear double-stranded DNA encoding 180 proteins.1 Primates and rodents are the typical host reservoirs for viral circulation of mpox.2 Animal-to-human transmission occurs through direct contact with mucous membranes, bodily fluids, or tissues of an infected animal. Human-to-human transmission occurs through direct contact with infected mucous membranes, bodily fluids, respiratory droplets, and contaminated fomites.2
Symptoms typically occur within 1 week of exposure to the mpox virus. Prodromal symptoms of fever, sore throat, body aches, and headaches last for 3 days.1 Many patients experience a facial rash that spreads to the arms and legs over a period of 2 to 4 weeks. The rash initially manifests as small papules that progress to painful pustules and vesicles measuring 0.5 to 1.0 cm in diameter.3 The mpox virus is transmitted through these skin lesions until they crust over and re-epithelialize.1 The case fatality rate for mpox infection remains low (0.18%).4
Mpox outbreaks mainly were limited to central and western Africa prior to 2022. From May 17, 2022, through October 6, 2022, 26,384 cases of mpox were reported in the United States.5 During this outbreak, immunocompromised patients diagnosed with HIV and men who have sex with men were disproportionately affected.5
Due to the similarities between the smallpox virus and other orthopoxviruses, certain smallpox vaccines have been indicated for pre-exposure prophylaxis.6 The efficacy of prophylactic vaccination is believed to stem from the production of neutralizing antibodies that are cross-protective against other orthopoxviruses, including mpox.7 The 2 vaccines approved in the United States for mpox prophylaxis are JYNNEOS and ACAM2000, which are both live attenuated vaccines. Pre-exposure prophylaxis is indicated for patients at risk for severe disease, including men who have sex with men, individuals diagnosed with HIV or other immunosuppressive disorders, and individuals with recent diagnoses of one or more sexually transmitted diseases.8
Most mpox cases resolve within 2 to 4 weeks and only require supportive care (eg, nonsteroidal anti-inflammatory drugs, topical steroids, topical anesthetics) to treat pain.8 For patients at risk for severe disease, antiviral medications are warranted. Tecovirimat, brincidofovir, and cidofovir are antiviral medications used to treat smallpox that are thought to be effective against mpox.8,9 Tecovirimat and cidofovir have been shown to be effective against mpox in animal trials, but randomized or nonrandomized trials have not been performed in humans.9-11 Tecovirimat currently is available for the treatment of severe mpox in patients who meet the Centers for Disease Control and Prevention’s Investigational New Drug protocol; for these patients, a 200-mg course is administered orally or intravenously every 12 hours for 2 weeks.8
- Lu J, Xing H, Wang C, et al. Mpox (formerly monkeypox): pathogenesis, prevention, and treatment. Signal Transduct Target Ther. 2023;8:458. doi:10.1038/s41392-023-01675-
- Lim CK, Roberts J, Moso M, et al. Mpox diagnostics: review of current and emerging technologies. J Med Virol. 2023;95:e28429. doi:10.1002/jmv.28429
- Brown K, Leggat PA. Human monkeypox: current state of knowledge and implications for the future. Trop Med Infect Dis. 2016;1:8. doi:10.3390/tropicalmed1010008
- World Health Organization. Mpox (monkeypox) World Health Organization. Published April 18, 2023. Accessed May 28, 2025. https://www.who.int/news-room/fact-sheets/detail/monkeypox
- Kava CM, Rohraff DM, Wallace B, et al. Epidemiologic features of the monkeypox outbreak and the public health response—United States, May 17–October 6, 2022. 2022:1449-1456. https://www.cdc.gov/mmwr/volumes/71/wr/mm7145a4.htm?s_cid=mm7145a4_w
- Rizk JG, Lippi G, Henry BM, et al. Prevention and treatment of monkeypox. Drugs. 2022;82:957-963. doi:10.1007/s40265-022-01742-y
- Edghill-Smith Y, Golding H, Manischewitz J, et al. Smallpox vaccine-induced antibodies are necessary and sufficient for protection against monkeypox virus. Nat Med. 2005;11:740-747. doi:10.1038 /nm1261
- Centers for Disease Control and Prevention. Mpox treatment information for healthcare professionals. Updated June 18, 2024. Accessed May 28, 2025. https://www.cdc.gov/mpox/hcp/clinical-care/?CDC_AAref_Val=https://www.cdc.gov/poxvirus/mpox/clinicians/treatment.html
- Mitja O, Ogoina D, Titanji BK, et al. Monkeypox. Lancet. 2023;401:60-74. doi:10.1016/S0140-6736(22)02075-X
- Huggins J, Goff A, Hensley L, et al. Nonhuman primates are protected from smallpox virus or monkeypox virus challenges by the antiviral drug ST-246. Antimicrob Agents Chemother. 2009;53:2620-2625. doi:10.1128/aac.00021-09
- Grosenbach DW, Honeychurch K, Rose EA, et al. Oral tecovirimat for the treatment of smallpox. N Engl J Med. 2018;379:44-53. doi:10.1056 /nejmoa1705688
THE DIAGNOSIS: Mpox
Histologic examination demonstrated dense aggregates of necrotic cellular debris composed of karyorrhectic nuclear fragments intermixed with neutrophils, lymphocytes, and histiocytes. Eosinophilic intracytoplasmic inclusions also were observed (Figure 1). The bacterial, fungal, and mycobacterial histologic special stains and cultures were negative. Three weeks after the initial visit with dermatology, the patient was admitted to the hospital for worsening symptoms of fever, chills, and painful erythema surrounding the skin lesions. Serology and viral workup revealed a positive mpox polymerase chain reaction test, suggesting a diagnosis of mpox. Following the Centers for Disease Control and Prevention protocol, the patient was started on oral tecovirimat 200 mg twice daily for 3 weeks and intravenous infusions of cidofovir 345 mg once weekly for 2 weeks. After treatment was initiated, the skin lesions showed rapid improvement (Figure 2), and he was discharged from the hospital after finishing the second dose of cidofovir. Four months after the initial dermatology consultation, the lesions had resolved completely with residual scarring. At that time, the patient had full movement of the right eye.
shows higher digital magnification of eosinophilic inclusions observed throughout the biopsy specimen (original magnification ×400).
Mpox virus is a member of the Poxviridae family of zoonotic viruses, which are transmitted from animals to humans. The mpox virus is brick-shaped (rectangular) and has a genome of linear double-stranded DNA encoding 180 proteins.1 Primates and rodents are the typical host reservoirs for viral circulation of mpox.2 Animal-to-human transmission occurs through direct contact with mucous membranes, bodily fluids, or tissues of an infected animal. Human-to-human transmission occurs through direct contact with infected mucous membranes, bodily fluids, respiratory droplets, and contaminated fomites.2
Symptoms typically occur within 1 week of exposure to the mpox virus. Prodromal symptoms of fever, sore throat, body aches, and headaches last for 3 days.1 Many patients experience a facial rash that spreads to the arms and legs over a period of 2 to 4 weeks. The rash initially manifests as small papules that progress to painful pustules and vesicles measuring 0.5 to 1.0 cm in diameter.3 The mpox virus is transmitted through these skin lesions until they crust over and re-epithelialize.1 The case fatality rate for mpox infection remains low (0.18%).4
Mpox outbreaks mainly were limited to central and western Africa prior to 2022. From May 17, 2022, through October 6, 2022, 26,384 cases of mpox were reported in the United States.5 During this outbreak, immunocompromised patients diagnosed with HIV and men who have sex with men were disproportionately affected.5
Due to the similarities between the smallpox virus and other orthopoxviruses, certain smallpox vaccines have been indicated for pre-exposure prophylaxis.6 The efficacy of prophylactic vaccination is believed to stem from the production of neutralizing antibodies that are cross-protective against other orthopoxviruses, including mpox.7 The 2 vaccines approved in the United States for mpox prophylaxis are JYNNEOS and ACAM2000, which are both live attenuated vaccines. Pre-exposure prophylaxis is indicated for patients at risk for severe disease, including men who have sex with men, individuals diagnosed with HIV or other immunosuppressive disorders, and individuals with recent diagnoses of one or more sexually transmitted diseases.8
Most mpox cases resolve within 2 to 4 weeks and only require supportive care (eg, nonsteroidal anti-inflammatory drugs, topical steroids, topical anesthetics) to treat pain.8 For patients at risk for severe disease, antiviral medications are warranted. Tecovirimat, brincidofovir, and cidofovir are antiviral medications used to treat smallpox that are thought to be effective against mpox.8,9 Tecovirimat and cidofovir have been shown to be effective against mpox in animal trials, but randomized or nonrandomized trials have not been performed in humans.9-11 Tecovirimat currently is available for the treatment of severe mpox in patients who meet the Centers for Disease Control and Prevention’s Investigational New Drug protocol; for these patients, a 200-mg course is administered orally or intravenously every 12 hours for 2 weeks.8
- Lu J, Xing H, Wang C, et al. Mpox (formerly monkeypox): pathogenesis, prevention, and treatment. Signal Transduct Target Ther. 2023;8:458. doi:10.1038/s41392-023-01675-
- Lim CK, Roberts J, Moso M, et al. Mpox diagnostics: review of current and emerging technologies. J Med Virol. 2023;95:e28429. doi:10.1002/jmv.28429
- Brown K, Leggat PA. Human monkeypox: current state of knowledge and implications for the future. Trop Med Infect Dis. 2016;1:8. doi:10.3390/tropicalmed1010008
- World Health Organization. Mpox (monkeypox) World Health Organization. Published April 18, 2023. Accessed May 28, 2025. https://www.who.int/news-room/fact-sheets/detail/monkeypox
- Kava CM, Rohraff DM, Wallace B, et al. Epidemiologic features of the monkeypox outbreak and the public health response—United States, May 17–October 6, 2022. 2022:1449-1456. https://www.cdc.gov/mmwr/volumes/71/wr/mm7145a4.htm?s_cid=mm7145a4_w
- Rizk JG, Lippi G, Henry BM, et al. Prevention and treatment of monkeypox. Drugs. 2022;82:957-963. doi:10.1007/s40265-022-01742-y
- Edghill-Smith Y, Golding H, Manischewitz J, et al. Smallpox vaccine-induced antibodies are necessary and sufficient for protection against monkeypox virus. Nat Med. 2005;11:740-747. doi:10.1038 /nm1261
- Centers for Disease Control and Prevention. Mpox treatment information for healthcare professionals. Updated June 18, 2024. Accessed May 28, 2025. https://www.cdc.gov/mpox/hcp/clinical-care/?CDC_AAref_Val=https://www.cdc.gov/poxvirus/mpox/clinicians/treatment.html
- Mitja O, Ogoina D, Titanji BK, et al. Monkeypox. Lancet. 2023;401:60-74. doi:10.1016/S0140-6736(22)02075-X
- Huggins J, Goff A, Hensley L, et al. Nonhuman primates are protected from smallpox virus or monkeypox virus challenges by the antiviral drug ST-246. Antimicrob Agents Chemother. 2009;53:2620-2625. doi:10.1128/aac.00021-09
- Grosenbach DW, Honeychurch K, Rose EA, et al. Oral tecovirimat for the treatment of smallpox. N Engl J Med. 2018;379:44-53. doi:10.1056 /nejmoa1705688
Multiple Fungating Plaques on the Face, Arms, and Legs
Multiple Fungating Plaques on the Face, Arms, and Legs
A 27-year-old man presented to his primary care physician after he was struck in the head by a tree branch while working outside. The next day, ulcerating lesions emerged on the right supraorbital ridge, along with subjective fevers, chills, fatigue, and shortness of breath. The patient reported a history of unprotected sexual intercourse with a male partner who was HIV positive. His medical history included syphilis status posttreatment with a course of 5 penicillin injections, hepatitis C, and HIV diagnosed one month prior to presentation (CD4 count, 169 cells/mm3 [reference range, 500-1500 cells/mm3]). A punch biopsy performed by the primary care physician revealed suppurative granulomatous inflammation, and the patient was prescribed antibiotics with mild improvement. He then was referred to dermatology for further evaluation of the ulcerating lesions.
Three months after the initial trauma, the patient presented to the dermatology clinic for evaluation of multiple large fungating plaques affecting multiple sites on the face (top), arms (bottom), and legs. Physical examination revealed large circinate verrucous plaques involving the right supraorbital ridge and eyelid. The patient was unable to fully open the right eye. Similar plaques also were observed on the right malar cheek, arms, and feet. Four 5-mm punch biopsies from lesions on the right elbow and left ankle were obtained with fungal and bacterial cultures.
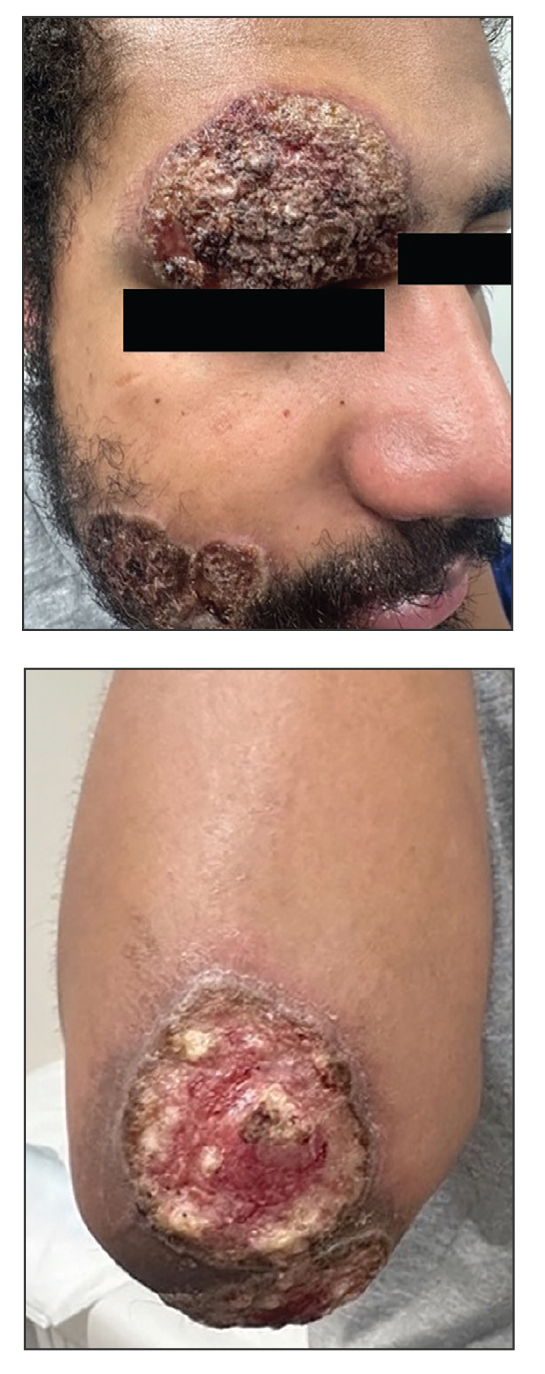

Recommendations for Empiric Antibiotic Therapy in Hidradenitis Suppurativa
Recommendations for Empiric Antibiotic Therapy in Hidradenitis Suppurativa
Hidradenitis suppurativa (HS) is a chronic scarring inflammatory skin condition of the follicular epithelium that impacts 1% to 4% of the general population (eFigure).1-3 This statistic likely is an underrepresentation of the affected population due to missed and delayed diagnoses.1 Hidradenitis suppurativa has been identified as having one of the strongest negative impacts on patients’ lives based on studied skin diseases.4 Its recurrent nature can negatively impact both the patient’s physical and mental state.3 Due to the debilitating effects of HS, we aimed to create updated recommendations for empiric antibotics based on affected anatomic locations in an effort to improve patient quality of life.
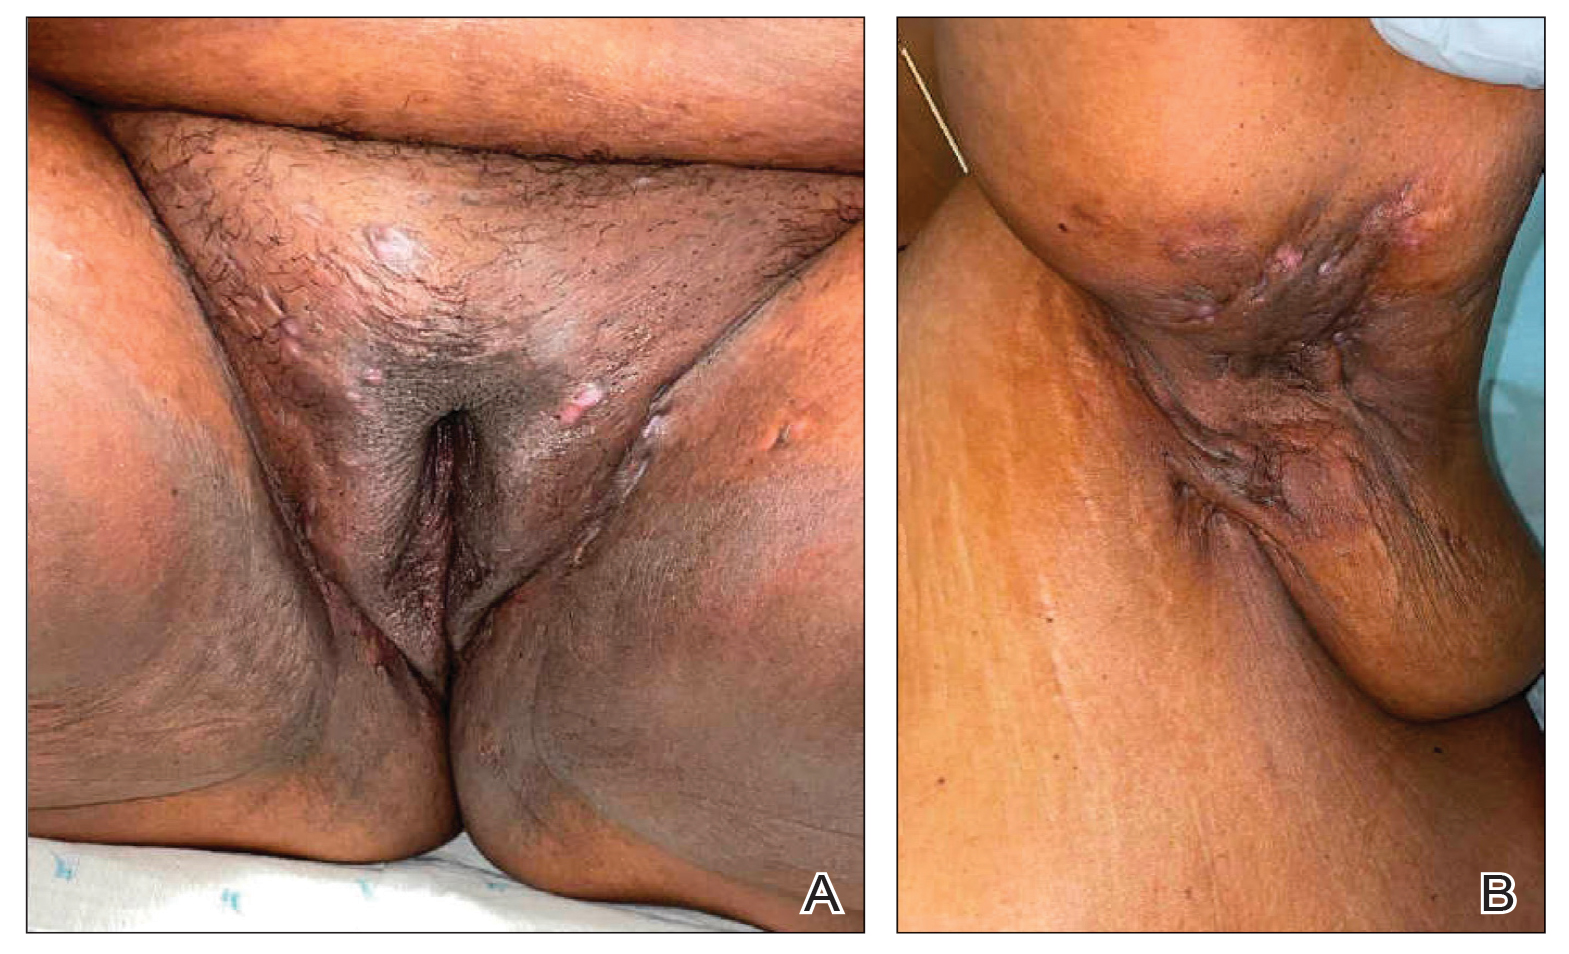
Methods
An institutional review board–approved retrospective medical chart review of 485 patients diagnosed with HS and evaluated at the University of Texas Medical Branch in Galveston from January 2006 to December 2021 was conducted. Males and females of all ages (including pregnant and pediatric patients) were included. Only patients for whom anatomic locations of HS lesions or culture sites were not documented were excluded from the analysis. Locations of cultures were categorized into 5 groups: axilla; groin; buttocks; inframammary; and multiple sites of involvement, which included any combination of 2 or more sites. Types of bacteria collected from cultures and recorded included Escherichia coli, Enterococcus species, Proteus mirabilis, Pseudomonas aeruginosa, Staphylococcus aureus, coagulase-negative staphylococci (CoNS), and other Gram-negative species. Sensitivity profiles also were analyzed for the most commonly cultured bacteria to create recommendations on antibiotic use based on the anatomic location of the lesions. Data analysis was conducted using descriptive statistics and bivariate analysis.
Results
The analysis included 485 patients comprising 600 visits. Seventy-five percent (363/485) of the study population was female. The axilla was the most common anatomic location for HS lesions followed by multiple sites of involvement. In total, 283 cultures were performed; males were 1.1 times more likely than females to be cultured. While cultures were most frequently obtained in patients with axillary lesions only (93/262 [35%]) or from multiple sites of involvement (83/179 [46%]) as this was the most common presentation of HS in our patient population, cultures were more likely to be obtained when patients presented with only buttock (32/38 [84%]) and inframammary (20/25 [80%]) lesions (Table).
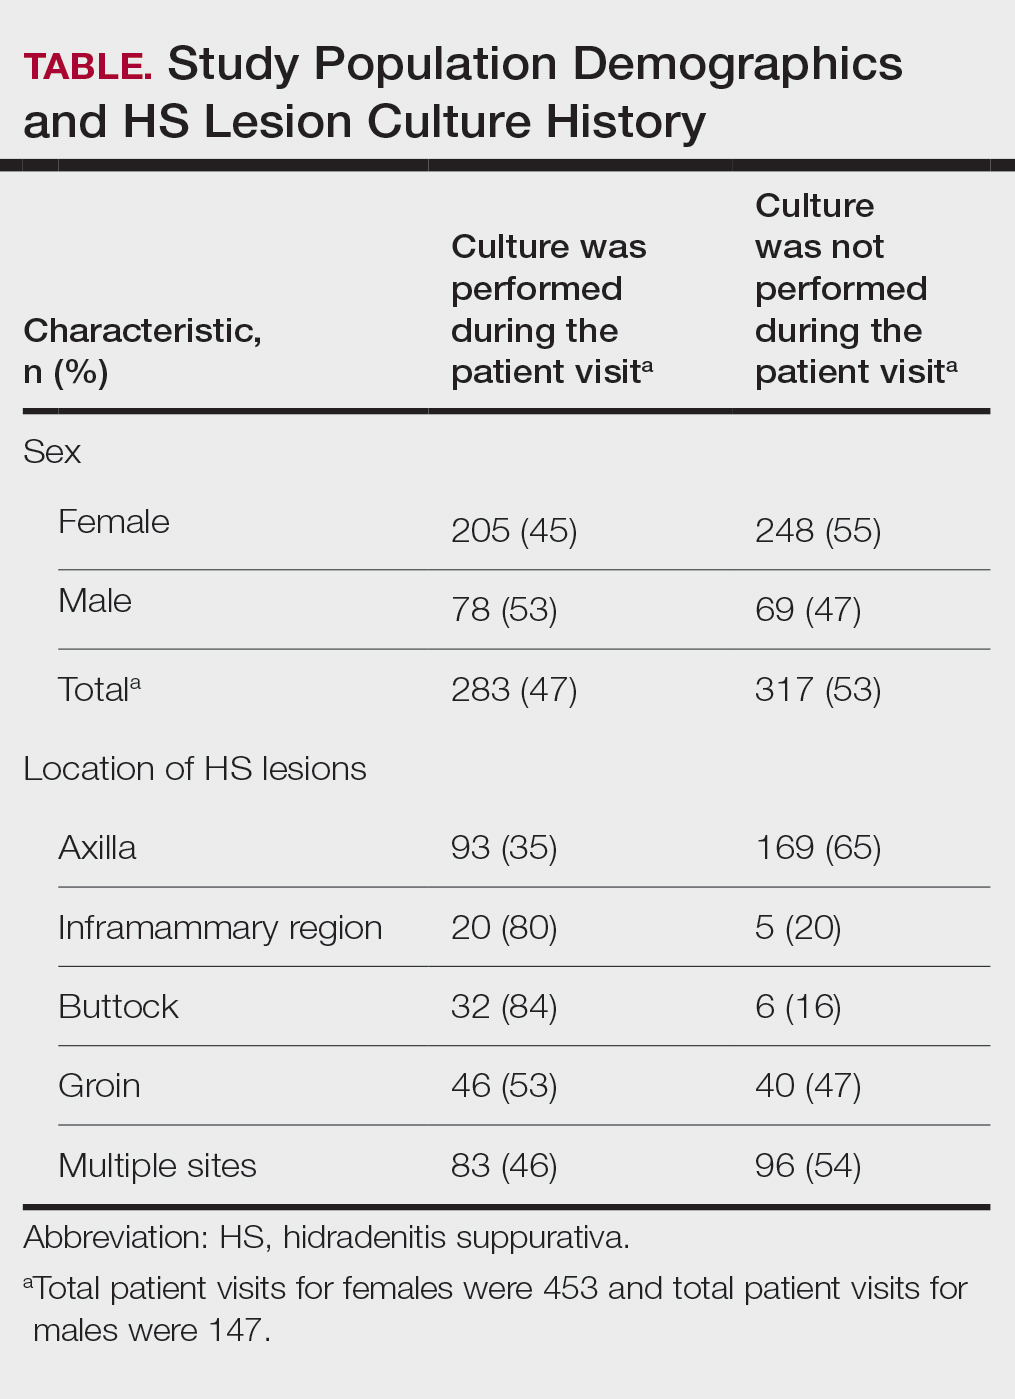
Staphylococcus aureus was the most commonly cultured bacteria in general (53/283 [19%]) as well as for HS located the axilla (24/56 [43%]) and in multiple sites (16/51 [31%]). Proteus mirabilis (29/283 [10%]) was the second most commonly cultured bacteria overall and was cultured most often in the axilla (15/56 [27%]) and inframammary region (6/14 [43%]). These were followed by beta-hemolytic Streptococcus species (26/283 [9%]) and Enterococcus species (21/283 [7%]), which was second to P mirabilis as the most commonly cultured bacteria in the inframammary region (6/14 [43%])(eTable 1).
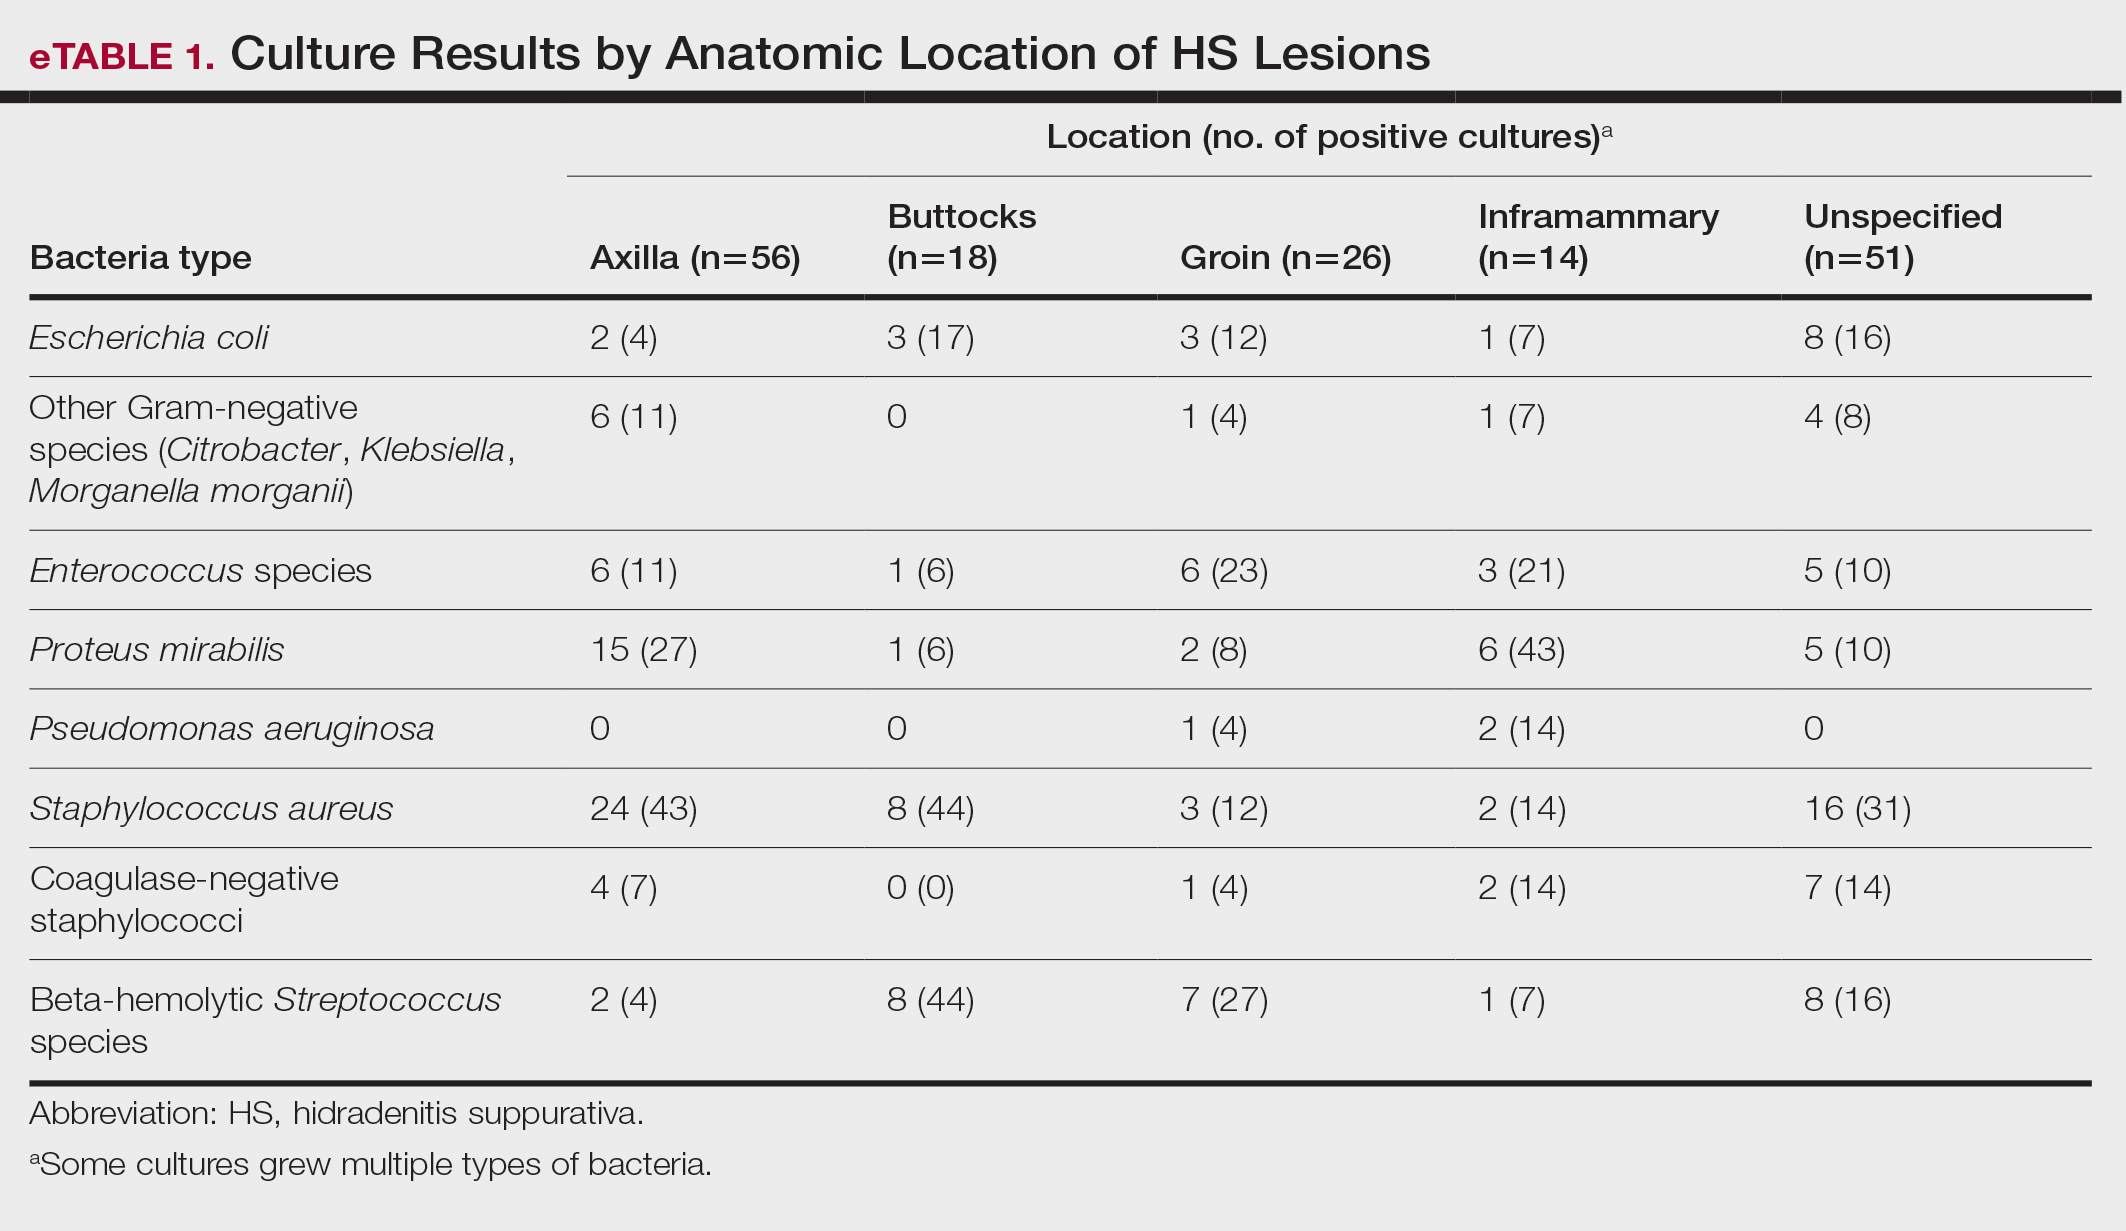
eTable 2 shows the sensitivity profiles for the most commonly cultured bacteria: S aureus, P mirabilis, and Enterococcus species. Staphylococcus aureus located in the axilla, buttocks, and groin was most sensitive to rifampin (41/44 [93%]), TMP/SMX (41/44 [93%]), and tetracycline (39/44 [89%]) and most resistant to erythromycin (26/44 [59%]) and oxacillin (24/44 [55%]). Proteus mirabilis in the inframammary region was most sensitive to ampicillin (27/27 [100%]), gentamicin (27/27 [100%]), levofloxacin (27/27 [100%]), and TMP/SMX (26/27 [96%]). Enterococcus species were most sensitive to vancomycin (20/20 [100%]) and ampicillin (19/20 [95%]) and most resistant to gentamicin (5/20 [25%]).
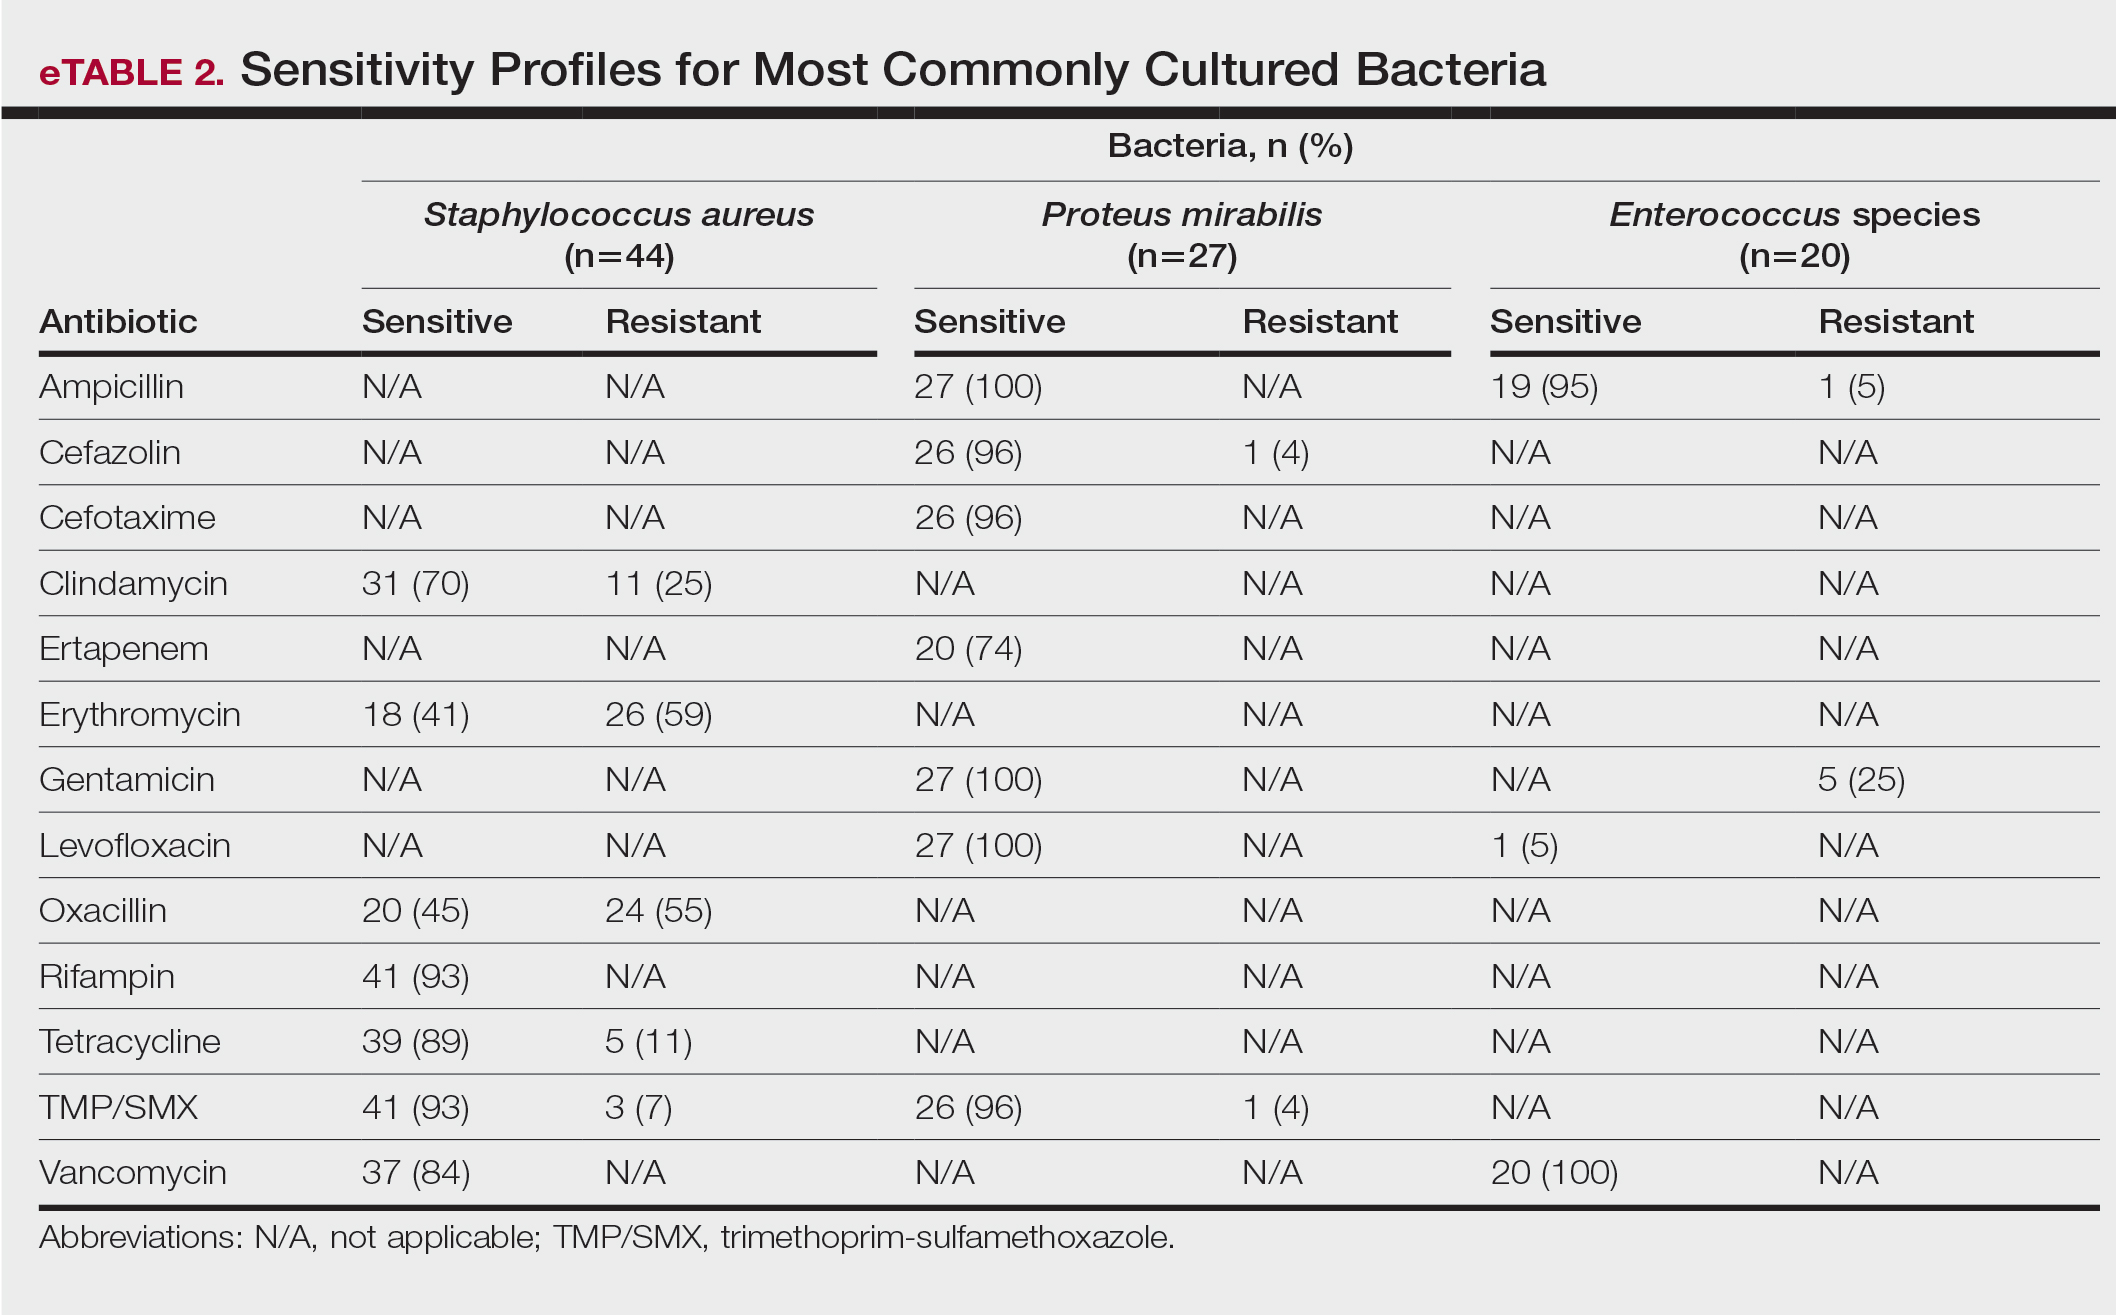
Comment
To treat HS, it is important to understand the cause of the condition. Although the pathogenesis of HS has many unknowns, bacterial colonization and biofilms are thought to play a role. Lipopolysaccharides found in the outer membrane of Gram-negative bacteria are pathogen-associated molecular patterns that present to the toll-like receptors of the human immune system. Once the toll-like receptors recognize the pathogen-associated molecular patterns, macrophages and keratinocytes are activated and release proinflammatory and anti-inflammatory cytokines and chemokines. Persistent presentation of bacteria to the immune system increases immune-cell recruitment and worsens chronic inflammation in patients with HS. Evidence has revealed that bacteria initiate and sustain the inflammation seen in patients with HS; therefore, reducing the amount of bacteria could alleviate some of the symptoms of HS.5 It is important to continue learning about the pathophysiology of this disease as well as formulating tailored treatments to minimize patient discomfort and improve quality of life.
Based on the findings of the current study and the safety profile of the medication, tetracyclines may be considered for first-line empiric therapy in patients with HS involving the axilla only, buttocks only, or multiple sites. For additional coverage of P mirabilis in the axilla or inframammary region, TMP/SMX monotherapy or tetracycline plus ampicillin may be considered. For inframammary lesions only, empiric treatment with ampicillin or TMP/ SMX is recommended. For HS lesions in the groin area, coverage of Enterococcus species with ampicillin should be considered. Patients with multiple sites of involvement that include the inframammary or groin regions similarly should receive empiric antibiotics that cover both S aureus and Gram-negative bacteria, such as TMP/SMX or tetracycline and ampicillin, respectively; if the multiple sites do not include the inframammary or groin regions, Gram-negative coverage may not be indicated. Based on our findings, standardization of treatment for patients with HS can allow for earlier and potentially more effective treatment.
In a similar study conducted in 2016, bacteria species were isolated from the axilla, groin, and gluteus/perineum in patients with HS.5 In that study, the most prominent bacteria in the axilla was CoNS; in the groin, P mirabilis and E coli; and in the gluteus/perineum, E coli and CoNS. These results differed from ours, which found S aureus as the abundant bacteria in these areas. In the 2016 study, the highest rates of resistance were found for penicillin G, erythromycin, clindamycin, and ampicillin.5 In contrast, the current study found high sensitivities for clindamycin and ampicillin, but our results support the finding of high resistance for erythromycin. These differences could be accounted for by the lower sample size of patients in the 2016 study: 68 patients were analyzed for sensitivity results, and 171 patients were analyzed for frequency of bacterial species in patients with HS.5
Our study is limited by its relatively small sample size. Additionally, all patients were seen at 1 of 2 clinic sites, located in League City and Galveston, Texas, and the data from this geographic area may not be applicable to patients seen in different climates.
Conclusion
Outcomes for patients with HS improve with early intervention; however, HS treatment may be delayed by selection of ineffective antibiotic therapy. Our study provides clinicians with recommendations for empiric antibiotic treatment based on anatomic location of HS lesions and culture sensitivity profiles. Utilizing tailored antibiotic therapy on initial clinical evaluation may increase early disease control and improve morbidity and disease outcomes, thereby increasing patient quality of life.
- Vinkel C, Thomsen SF. Hidradenitis suppurativa: causes, features, and current treatments. J Clin Aesthet Dermatol. 2018;11:17-23.
- Lee EY, Alhusayen R, Lansang P, et al. What is hidradenitis suppurativa? Can Fam Physician. 2017;63:114-120.
- Alikhan A, Lynch PJ, Eisen DB. Hidradenitis suppurativa: a comprehensive review. J Am Acad Dermatol. 2009;60:539-561; quiz 562-563.
- Yazdanyar S, Jemec GBE. Hidradenitis suppurativa: a review of cause and treatment. Curr Opin Infect Dis. 2011;24:118-123.
- Hessam S, Sand M, Georgas D, et al. Microbial profile and antimicrobial susceptibility of bacteria found in inflammatory hidradenitis suppurativa lesions. Skin Pharmacol Physiol. 2016; 29:161-167.
Hidradenitis suppurativa (HS) is a chronic scarring inflammatory skin condition of the follicular epithelium that impacts 1% to 4% of the general population (eFigure).1-3 This statistic likely is an underrepresentation of the affected population due to missed and delayed diagnoses.1 Hidradenitis suppurativa has been identified as having one of the strongest negative impacts on patients’ lives based on studied skin diseases.4 Its recurrent nature can negatively impact both the patient’s physical and mental state.3 Due to the debilitating effects of HS, we aimed to create updated recommendations for empiric antibotics based on affected anatomic locations in an effort to improve patient quality of life.
Methods
An institutional review board–approved retrospective medical chart review of 485 patients diagnosed with HS and evaluated at the University of Texas Medical Branch in Galveston from January 2006 to December 2021 was conducted. Males and females of all ages (including pregnant and pediatric patients) were included. Only patients for whom anatomic locations of HS lesions or culture sites were not documented were excluded from the analysis. Locations of cultures were categorized into 5 groups: axilla; groin; buttocks; inframammary; and multiple sites of involvement, which included any combination of 2 or more sites. Types of bacteria collected from cultures and recorded included Escherichia coli, Enterococcus species, Proteus mirabilis, Pseudomonas aeruginosa, Staphylococcus aureus, coagulase-negative staphylococci (CoNS), and other Gram-negative species. Sensitivity profiles also were analyzed for the most commonly cultured bacteria to create recommendations on antibiotic use based on the anatomic location of the lesions. Data analysis was conducted using descriptive statistics and bivariate analysis.
Results
The analysis included 485 patients comprising 600 visits. Seventy-five percent (363/485) of the study population was female. The axilla was the most common anatomic location for HS lesions followed by multiple sites of involvement. In total, 283 cultures were performed; males were 1.1 times more likely than females to be cultured. While cultures were most frequently obtained in patients with axillary lesions only (93/262 [35%]) or from multiple sites of involvement (83/179 [46%]) as this was the most common presentation of HS in our patient population, cultures were more likely to be obtained when patients presented with only buttock (32/38 [84%]) and inframammary (20/25 [80%]) lesions (Table).
Staphylococcus aureus was the most commonly cultured bacteria in general (53/283 [19%]) as well as for HS located the axilla (24/56 [43%]) and in multiple sites (16/51 [31%]). Proteus mirabilis (29/283 [10%]) was the second most commonly cultured bacteria overall and was cultured most often in the axilla (15/56 [27%]) and inframammary region (6/14 [43%]). These were followed by beta-hemolytic Streptococcus species (26/283 [9%]) and Enterococcus species (21/283 [7%]), which was second to P mirabilis as the most commonly cultured bacteria in the inframammary region (6/14 [43%])(eTable 1).
eTable 2 shows the sensitivity profiles for the most commonly cultured bacteria: S aureus, P mirabilis, and Enterococcus species. Staphylococcus aureus located in the axilla, buttocks, and groin was most sensitive to rifampin (41/44 [93%]), TMP/SMX (41/44 [93%]), and tetracycline (39/44 [89%]) and most resistant to erythromycin (26/44 [59%]) and oxacillin (24/44 [55%]). Proteus mirabilis in the inframammary region was most sensitive to ampicillin (27/27 [100%]), gentamicin (27/27 [100%]), levofloxacin (27/27 [100%]), and TMP/SMX (26/27 [96%]). Enterococcus species were most sensitive to vancomycin (20/20 [100%]) and ampicillin (19/20 [95%]) and most resistant to gentamicin (5/20 [25%]).
Comment
To treat HS, it is important to understand the cause of the condition. Although the pathogenesis of HS has many unknowns, bacterial colonization and biofilms are thought to play a role. Lipopolysaccharides found in the outer membrane of Gram-negative bacteria are pathogen-associated molecular patterns that present to the toll-like receptors of the human immune system. Once the toll-like receptors recognize the pathogen-associated molecular patterns, macrophages and keratinocytes are activated and release proinflammatory and anti-inflammatory cytokines and chemokines. Persistent presentation of bacteria to the immune system increases immune-cell recruitment and worsens chronic inflammation in patients with HS. Evidence has revealed that bacteria initiate and sustain the inflammation seen in patients with HS; therefore, reducing the amount of bacteria could alleviate some of the symptoms of HS.5 It is important to continue learning about the pathophysiology of this disease as well as formulating tailored treatments to minimize patient discomfort and improve quality of life.
Based on the findings of the current study and the safety profile of the medication, tetracyclines may be considered for first-line empiric therapy in patients with HS involving the axilla only, buttocks only, or multiple sites. For additional coverage of P mirabilis in the axilla or inframammary region, TMP/SMX monotherapy or tetracycline plus ampicillin may be considered. For inframammary lesions only, empiric treatment with ampicillin or TMP/ SMX is recommended. For HS lesions in the groin area, coverage of Enterococcus species with ampicillin should be considered. Patients with multiple sites of involvement that include the inframammary or groin regions similarly should receive empiric antibiotics that cover both S aureus and Gram-negative bacteria, such as TMP/SMX or tetracycline and ampicillin, respectively; if the multiple sites do not include the inframammary or groin regions, Gram-negative coverage may not be indicated. Based on our findings, standardization of treatment for patients with HS can allow for earlier and potentially more effective treatment.
In a similar study conducted in 2016, bacteria species were isolated from the axilla, groin, and gluteus/perineum in patients with HS.5 In that study, the most prominent bacteria in the axilla was CoNS; in the groin, P mirabilis and E coli; and in the gluteus/perineum, E coli and CoNS. These results differed from ours, which found S aureus as the abundant bacteria in these areas. In the 2016 study, the highest rates of resistance were found for penicillin G, erythromycin, clindamycin, and ampicillin.5 In contrast, the current study found high sensitivities for clindamycin and ampicillin, but our results support the finding of high resistance for erythromycin. These differences could be accounted for by the lower sample size of patients in the 2016 study: 68 patients were analyzed for sensitivity results, and 171 patients were analyzed for frequency of bacterial species in patients with HS.5
Our study is limited by its relatively small sample size. Additionally, all patients were seen at 1 of 2 clinic sites, located in League City and Galveston, Texas, and the data from this geographic area may not be applicable to patients seen in different climates.
Conclusion
Outcomes for patients with HS improve with early intervention; however, HS treatment may be delayed by selection of ineffective antibiotic therapy. Our study provides clinicians with recommendations for empiric antibiotic treatment based on anatomic location of HS lesions and culture sensitivity profiles. Utilizing tailored antibiotic therapy on initial clinical evaluation may increase early disease control and improve morbidity and disease outcomes, thereby increasing patient quality of life.
- Vinkel C, Thomsen SF. Hidradenitis suppurativa: causes, features, and current treatments. J Clin Aesthet Dermatol. 2018;11:17-23.
- Lee EY, Alhusayen R, Lansang P, et al. What is hidradenitis suppurativa? Can Fam Physician. 2017;63:114-120.
- Alikhan A, Lynch PJ, Eisen DB. Hidradenitis suppurativa: a comprehensive review. J Am Acad Dermatol. 2009;60:539-561; quiz 562-563.
- Yazdanyar S, Jemec GBE. Hidradenitis suppurativa: a review of cause and treatment. Curr Opin Infect Dis. 2011;24:118-123.
- Hessam S, Sand M, Georgas D, et al. Microbial profile and antimicrobial susceptibility of bacteria found in inflammatory hidradenitis suppurativa lesions. Skin Pharmacol Physiol. 2016; 29:161-167.
Recommendations for Empiric Antibiotic Therapy in Hidradenitis Suppurativa
Recommendations for Empiric Antibiotic Therapy in Hidradenitis Suppurativa
PRACTICE POINTS
- The inflammation seen in patients with hidradenitis suppurativa (HS) is initiated and sustained by bacteria; therefore, reducing the number of bacteria may alleviate some of the symptoms of HS.
- For HS involving the axillae or buttocks, tetracyclines should be recommended as first-line empiric therapy.
- Patients with HS with multiple sites affected that include the inframammary or groin regions should receive empiric antibiotics that cover both Staphylococcus aureus and Gram-negative bacteria, such as trimethoprim-sulfamethoxazole or tetracycline plus ampicillin.
Are Oritavancin and Dalbavancin More Cost Effective for Outpatient Parenteral Antimicrobial Therapy at a Veterans Affairs Medical Center?
Are Oritavancin and Dalbavancin More Cost Effective for Outpatient Parenteral Antimicrobial Therapy at a Veterans Affairs Medical Center?
Oritavancin and dalbavancin are long acting lipoglycopeptides indicated for the treatment of acute bacterial skin and skin structure infections (ABSSSI).1,2 Largely due to their long half-lives, prolonged tissue concentrations at sites of infection, tolerability, and minimal requirement for therapeutic drug monitoring, these agents are attractive options in outpatient settings.3,4 A 1- or 2-dose treatment of oritavancin and dalbavancin may be sufficient for conditions traditionally treated with outpatient parenteral antimicrobial therapy (OPAT) via peripherally inserted central catheter (PICC).
Limited research supports the use of dalbavancin and oritavancin for bone and joint infections, infective endocarditis, and bloodstream infections (BSIs). However, the US Food and Drug Administration has approved an indication for the treatment of ABSSSI.3-9 Dosing for these off-label indications varies but typically consists of an initial intravenous (IV) dose (1000 mg, 1200 mg, or 1500 mg), with a subsequent dose 1 to 2 weeks later or administered once weekly.6-10
Due in part to the recent availability of oritavancin and dalbavancin relative to the publication of practice guidelines, their appropriate place in therapy continues to evolve based on emerging literature.11,12 One potential barrier of use for these medications is their cost. Based on the number of doses administered, the 2022 estimated total acquisition cost of therapy for oritavancin and dalbavancin was $1014 to $4397 and $3046 to $7150, respectively (eAppendix). Despite the high acquisition costs, these agents do not require the placement of an indwelling central line, can be administered in outpatient settings, and require minimal therapeutic dose monitoring compared to vancomycin.13-15 This medication use evaluation (MUE) compared the total cost of treatment with oritavancin and dalbavancin vs therapies traditionally used for OPAT or prolonged IV inpatient therapy.
METHODS
This retrospective MUE was conducted at the Boise Veterans Affairs Medical Center (BVAMC), a level 2 facility with an extensive rural catchment area. BVAMC provides many OPAT services, including medications, supplies, and dressing changes after initial clinic or inpatient education. Contracted vendors may also assist with at-home nursing care using supplies provided by the BVAMC. Cases were identified using an internal database of OPAT patients and those who received oritavancin or dalbavancin between September 1, 2017, and November 1, 2022. Patients aged ≥ 18 years who received ≥ 1 dose of oritavancin or dalbavancin for ABSSSI, osteomyelitis/joint infections, endocarditis, and BSI were included. Comparator treatments consisting of ≥ 1 week of vancomycin or daptomycin for ABSSSI, osteomyelitis/joint infections, endocarditis, and BSI were identified through review of OPAT and Infectious Diseases service consults during the same timeframe. Patients were excluded if any antibiotic was prescribed by a non- VA clinician, if medications were not provided by OPAT, or if chart review did not identify an ABSSSI, osteomyelitis/ joint infection, or BSI diagnosis.
Electronic medical record review was conducted using a standardized data collection form (eAppendix). Data collected included demographics, infectious diagnosis, treatment administered, administration procedures and related visits and treatment locations, outcomes including clinical failure, adverse events (AEs), and hospital readmission.
Clinical failure was defined as readmission or death due to worsening infection or readmission secondary to a documented potential AE to the evaluated antibiotics within 90 days after initiation. Clinical failures excluded readmissions not associated with infection including comorbidities or elective procedures. AEs included new onset renal failure (serum creatinine ≥ 0.5 mg/dL), neutropenia (neutrophils ≤ 500), thrombocytopenia (platelets < 100,000), eosinophilia (> 15% eosinophils), or creatine phosphokinase > 10 times the upper limit of normal, and Clostridioides difficile (C. difficile) infection. Line complications included thrombophlebitis, local inflammation, or infection requiring line replacement (eAppendix).
A cost-minimization approach was used to assess the total cost of treatment.16 Patients who received oritavancin or dalbavancin were matched with patients that received vancomycin and daptomycin for the same indication and about 1 month of initiation through the randomization function in Microsoft Excel. This accounted for changes in personnel, nonformulary drug approvals, cost, and changes in practice during the pandemic. Costs were calculated using a decision tree as a base model (Figure 1). In this model, each treatment dyad was assessed for the presence or absence of clinical failure, adverse event (medication and line complications), and treatment setting endpoints. Cost estimates were tabulated for each patient that received treatment using published VA data, literature, pharmacoeconomist guidance, or best faith effort based on workflow. 17-20 All cost estimates were based on 2022 figures or adjusted for inflation if obtained prior to 2022. Secondary endpoints of this analysis included estimated total cost of medication acquisition, administration supplies, laboratory monitoring, and human resources for OPAT visits or receiving home-health services.
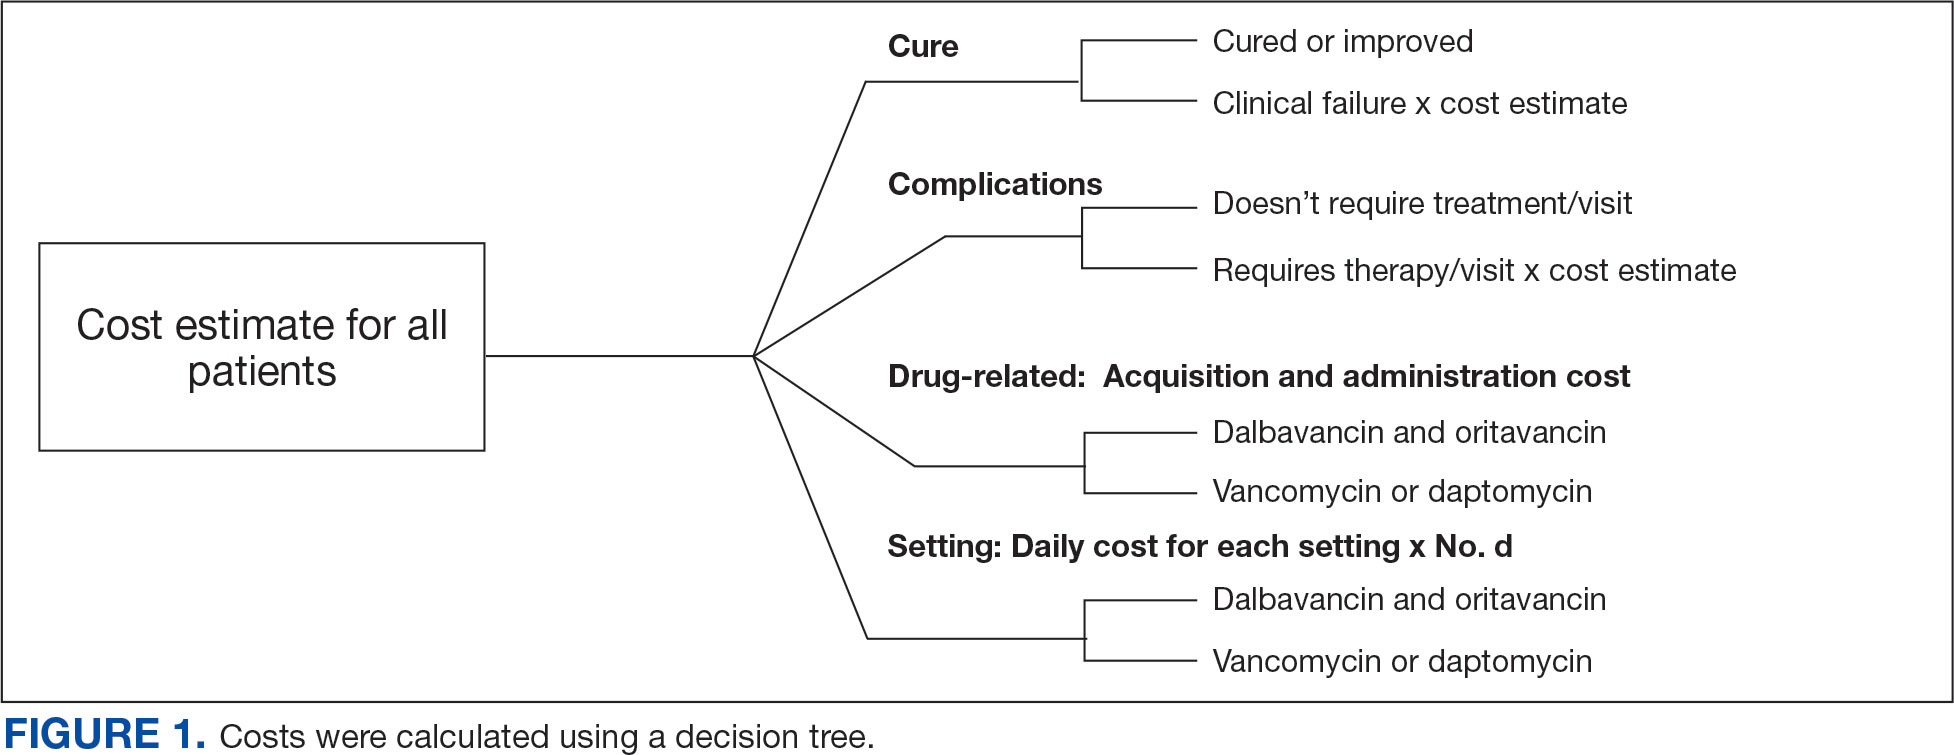
This evaluation was classified by the BVAMC Medication Use Evaluation research determination subcommittee as a quality improvement project and was considered exempt from VA Human Subjects Research requirements based on the VA Policy Handbook guideline 1058.05.
RESULTS
The study identified 44 patients who received dalbavancin or oritavancin between September 1, 2017, and October 31, 2022. Thirty-nine patients were included in the analysis: 24 received oritavancin and 15 received dalbavancin and were matched by indication to 10 patients who received vancomycin and 8 patients who received daptomycin. Three patients could not be matched by indication of ABSSSI (Figure 2). Most patients were male, aged > 65 years, and were treated for osteomyelitis (Table 1). No patients were treated for infective endocarditis. A myriad of concomitant antibiotics were used to treat patients and culture results indicated that most infections treated with oritavancin and dalbavancin were polymicrobial.
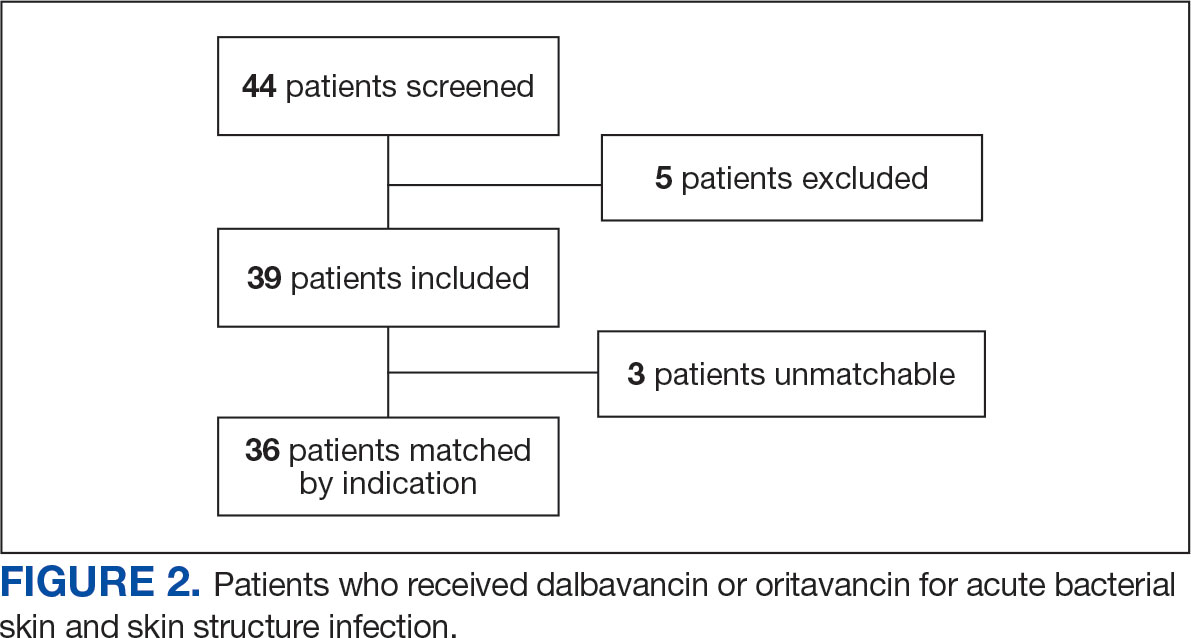
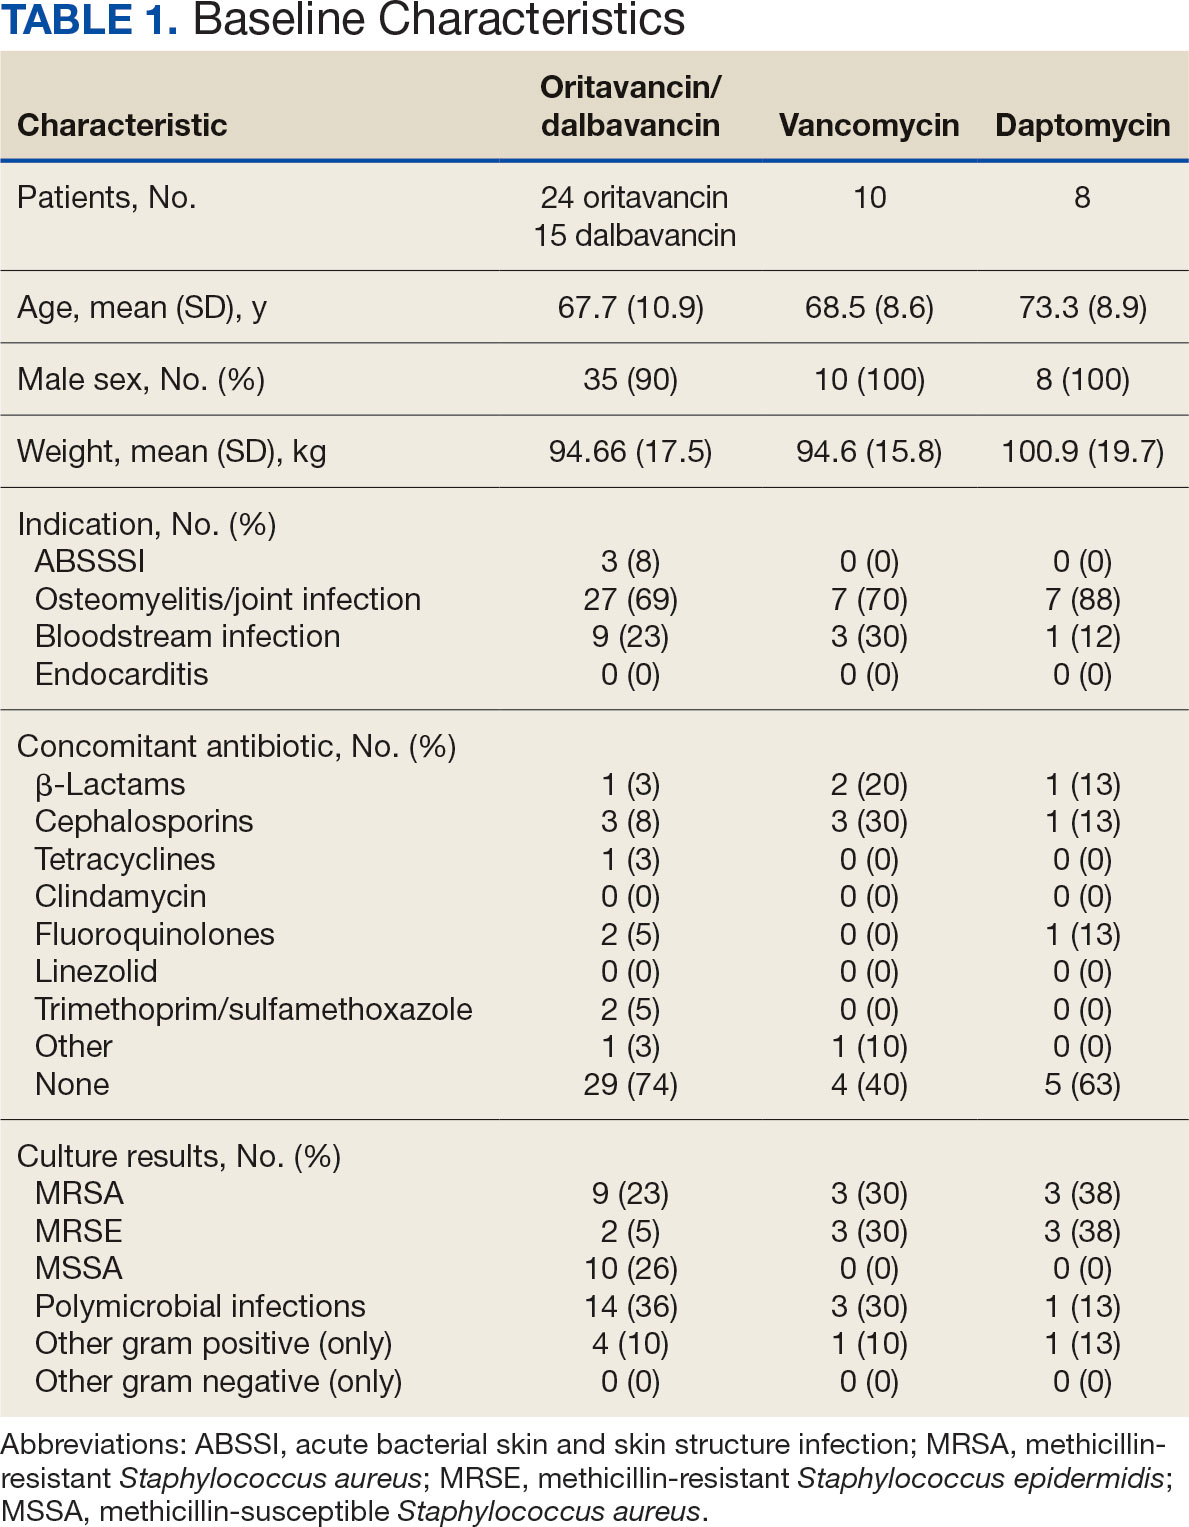
The mean total cost of therapy per patient receiving oritavancin, dalbavancin, vancomycin, and daptomycin was $35,630, $59,612, $73,333, and $73,708, respectively (Figure 3). When stratified by indication, 27 patients (69%) in the oritavancin/dalbavancin group were treated for osteomyelitis/ joint infections (16 oritavancin, 11 dalbavancin), 9 patients (23%) were treated for BSI (6 oritavancin, 3 dalbavancin), and 3 patients (8%) were treated for ABSSSI (2 oritavancin, 1 dalbavancin). The mean cost per patient for osteomyelitis/joint infections with oritavancin, dalbavancin, vancomycin, and daptomycin was $34,678, $54,224, $87,488, and $85,044, respectively. The mean cost per patient for BSI for oritavancin, dalbavancin, vancomycin, and daptomycin was $35,048, $75,349, $40,305, and $68,068, respectively. The mean cost per patient for ABSSSI for oritavancin and dalbavancin was $44,771 and $71,672.51.
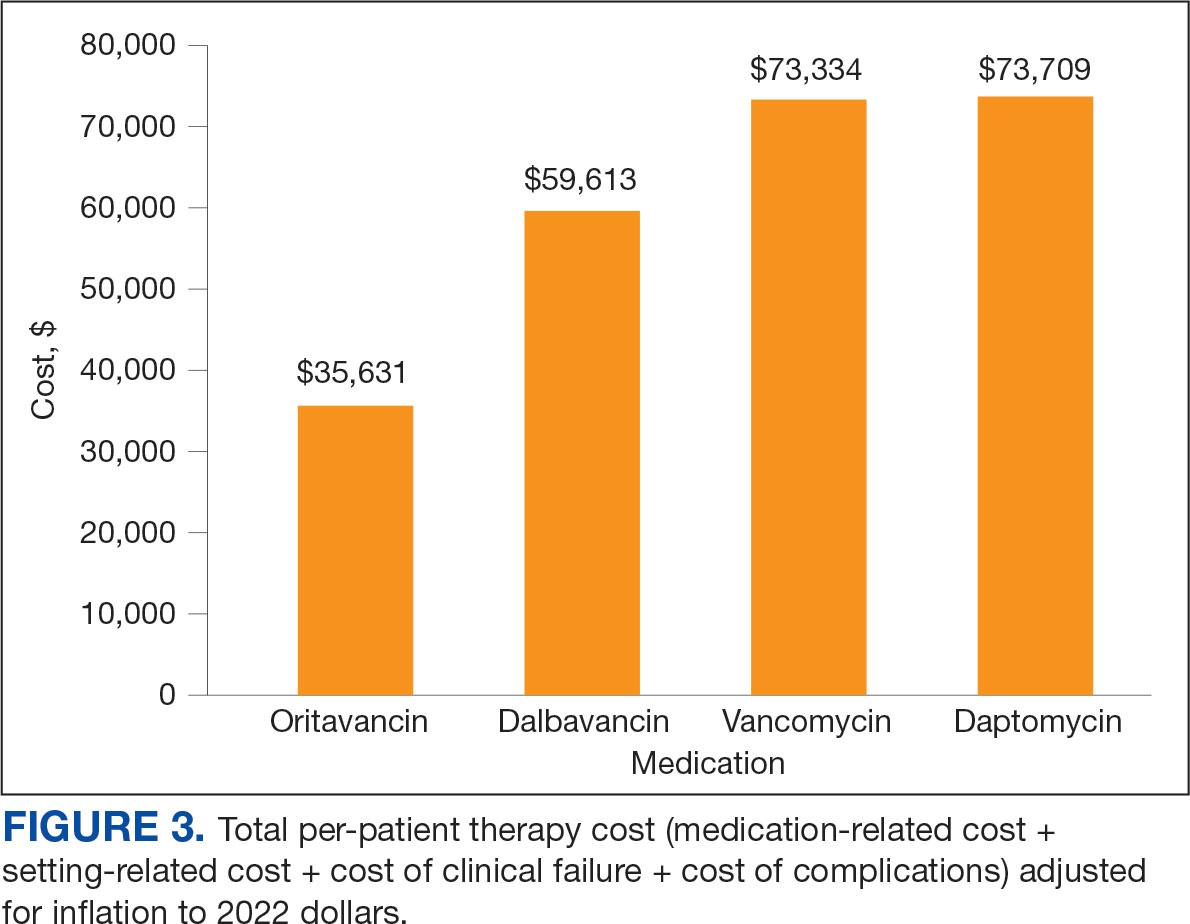
Estimated total drug cost represents the cost of drug acquisition, administration supplies, laboratory monitoring, and human resources for OPAT visits or receiving home health services. The mean cost per patient of drug-related therapy for oritavancin, dalbavancin, vancomycin, and daptomycin was $2203, $5924, $3637, and $7146, respectively (Table 2).
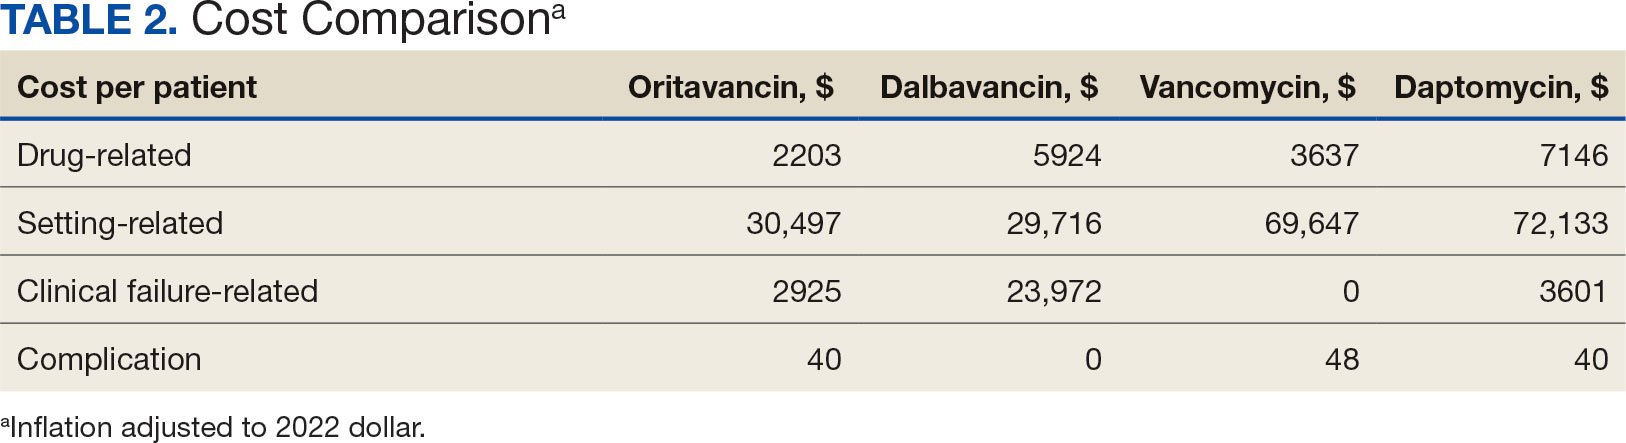
The mean cost per patient for osteomyelitis therapy for oritavancin, dalbavancin, vancomycin, and daptomycin was $2375, $6775, $4164, $8152, respectively. The mean cost of per patient for BSI treatment with oritavancin, dalbavancin, vancomycin, and daptomycin was $1737, $3475, $2409, and $1016, respectively. The mean cost per patient for oritavancin and dalbavancin for ABSSSI treatment, was $1553 and $3910, respectively.
Setting-related costs include expenses from inpatient admissions and postdischarge stays at community living centers (CLCs), skilled nursing facilities (SNFs), or rehabilitation facilities (RFs) for the duration of antimicrobial therapy. The mean setting-related therapy cost for osteomyelitis treatment with oritavancin, dalbavancin, vancomycin, and daptomycin was $27,852, $17,815, $83,324, and $72,856, respectively. The mean setting-related therapy cost per patient for BSI treatment with oritavancin, dalbavancin, vancomycin, and daptomycin was $33,310, $60,668, $37,734, and $67,074, respectively. The mean setting-related therapy cost per patient for ABSSSI treatment for oritavancin and dalbavancin was $43,218 and $67,762.00, respectively.
Six of 39 patients (15%) had clinical failure: 2 patients with oritavancin and 4 patients with dalbavancin. Four patients were readmitted for worsening infection and 2 for AEs. One patient (13%) in the daptomycin group had clinical failure due to readmission for worsening infection. There was no clinical failure with vancomycin. The costs associated with clinical failure per patient for oritavancin, dalbavancin, vancomycin, and daptomycin were $2925, $23,972, $0, and $3601, respectively (Table 3).
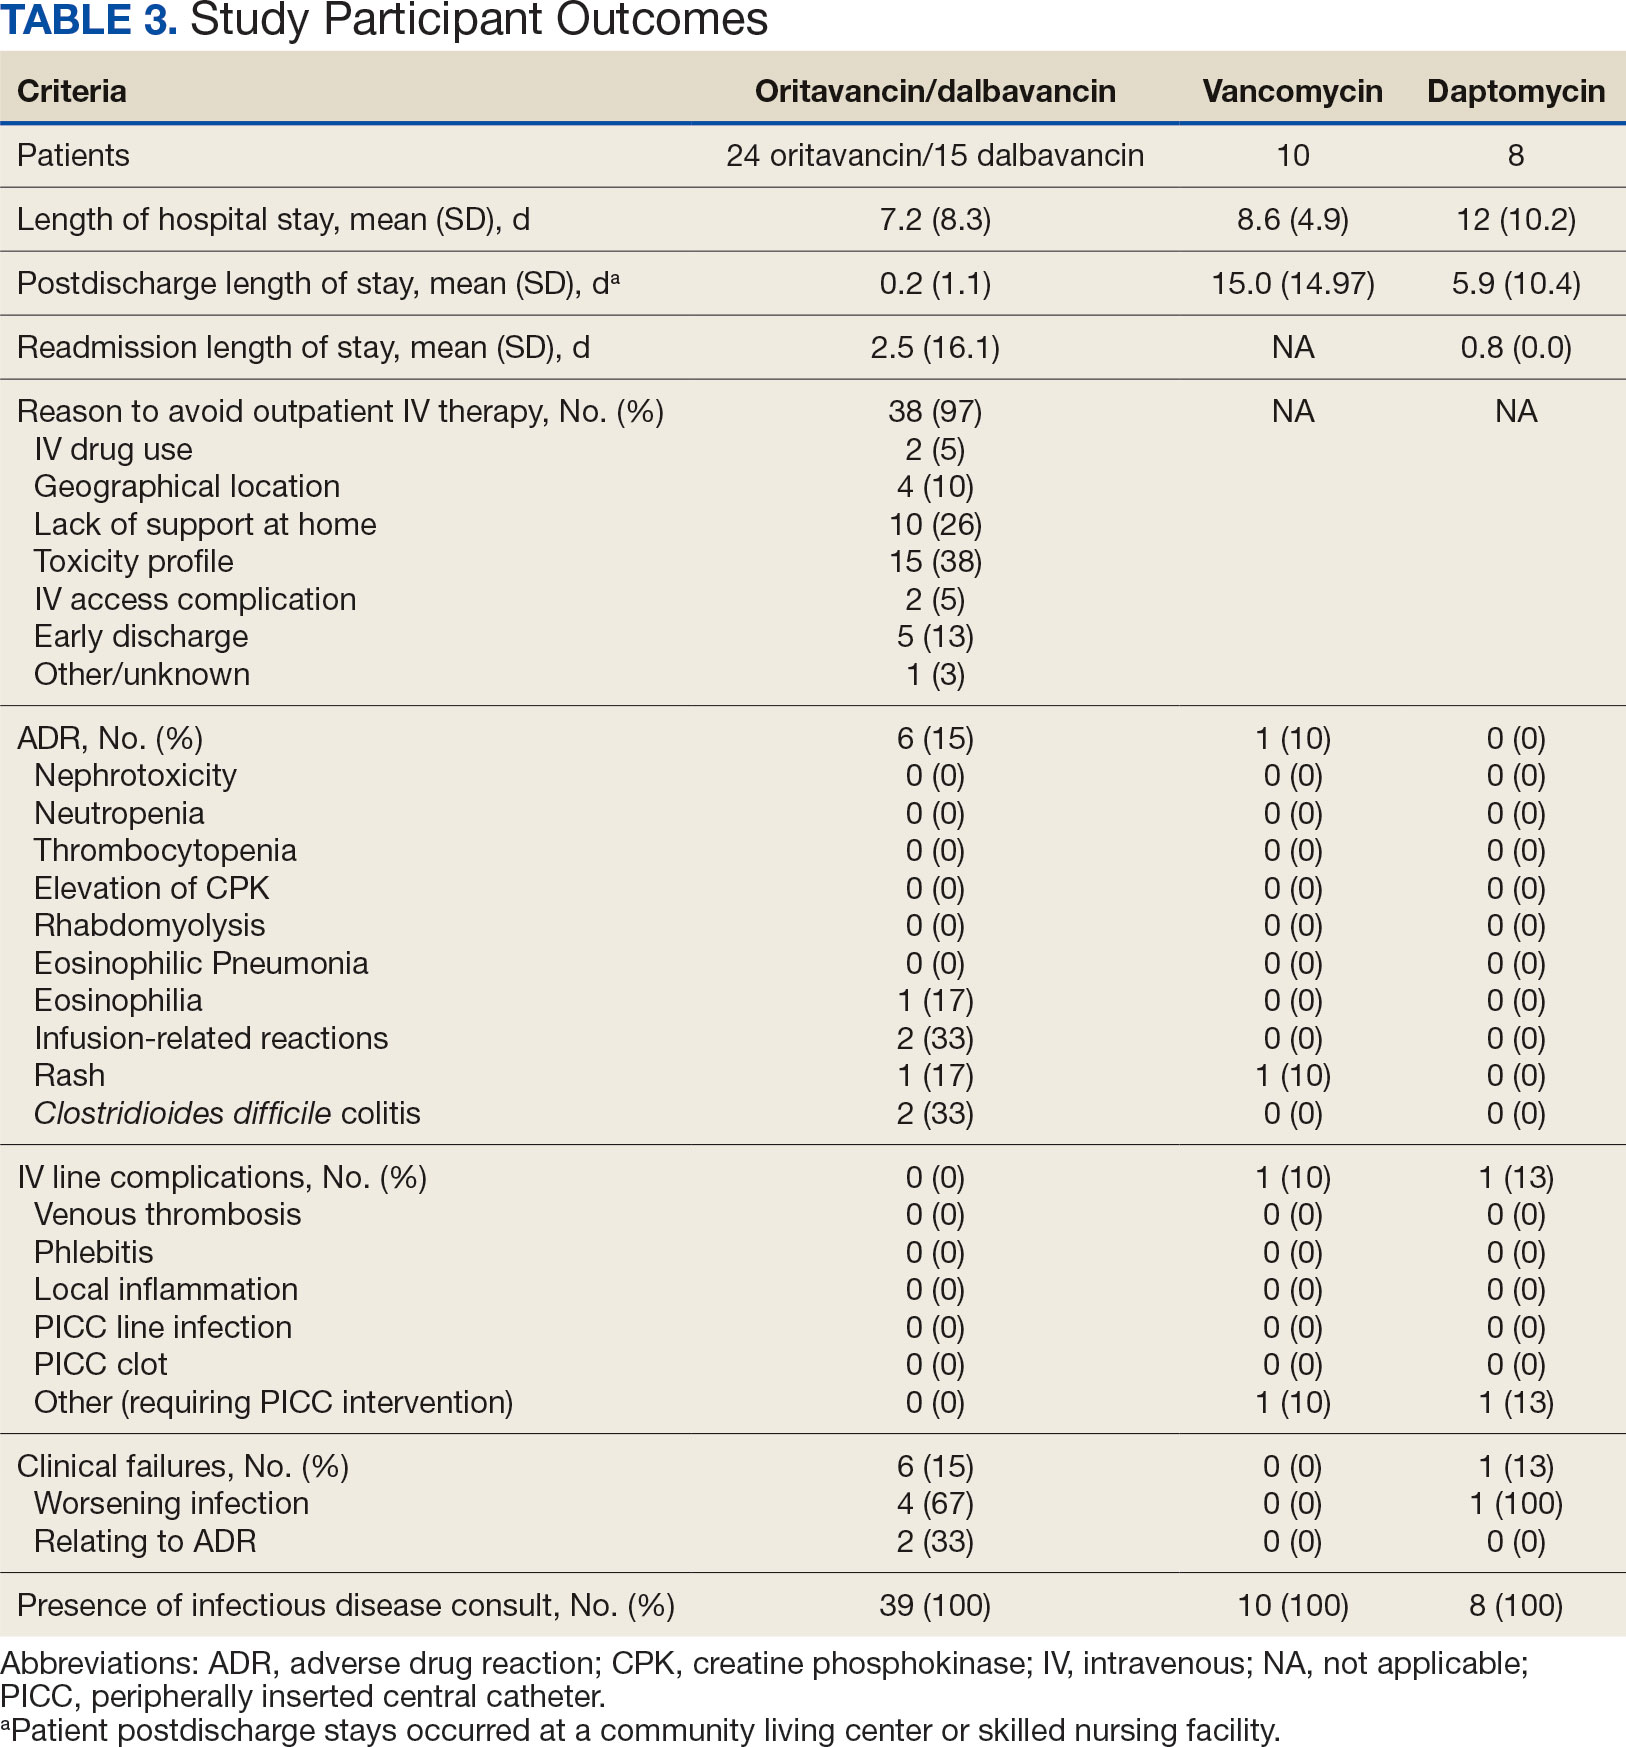
Thirty-eight patients (97%) who received oritavancin or dalbavancin had difficulty adhering to vancomycin or daptomycin OPAT. Oritavancin or dalbavancin was used in 10 patients (26%) who lacked support at home and 15 patients (38%) who had either a contraindication or previous failure with other antimicrobials, which were the most common explanations.
DISCUSSION
Long-acting lipoglycopeptides represent a potential alternative to home IV therapy that can avoid prolonged IV access with traditional OPAT. This offers significant advantages, allowing patients to be discharged from the hospital early, especially in rural areas with little OPAT infrastructure or those with logistic challenges. In this analysis, treatment with oritavancin for osteomyelitis, BSI, or ABSSSI, yielded an estimated cost savings of about $37,000 per patient, compared to treatment of matched indications with vancomycin and daptomycin. For every patient treated with dalbavancin for osteomyelitis, BSI, or ABSSSI, the cost savings was about $13,000 per patient, compared to treatment of matched indications for daptomycin and vancomycin. The estimated cost savings per patient for oritavancin was similar to previously published projections ($30,500 to $55,831).15
Cost savings were primarily driven by setting-related costs. The greatest contrast between the oritavancin and dalbavancin group compared to the vancomycin and daptomycin group was the length of stay in a postdischarge CLC, SNF, or RF setting. This analysis estimated that for every patient treated with oritavancin for osteomyelitis, the setting-related cost savings per patient was about $55,000 compared with vancomycin, and about $45,000 per patient compared with daptomycin. Furthermore, the estimated setting-related cost savings for osteomyelitis treatment with dalbavancin was about $65,000 compared with vancomycin and about $55,000 compared with daptomycin.
Clinical failure occurred with greater frequency in the oritavancin and dalbavancin groups (15%), compared with the vancomycin (0%) and daptomycin (13%) groups. Although the clinical failure rates in patients with osteomyelitis treated with oritavancin and dalbavancin compared with daptomycin were like those in previously published research (10%-30%), the rates of clinical failure for vancomycin in this analysis were lower than those in the oritavancin and dalbavancin group.8,21,22 The discrepancy in clinical failure rates between this analysis and previous research is likely due to selection bias. Based on the percentages of clinical failure found in the analysis, it is not surprising to note that the total clinical failure-related cost per patient was higher for oritavancin and dalbavancin compared to vancomycin, but similar between oritavancin and daptomycin.
This analysis also found that 15% of patients in the oritavancin and dalbavancin group experienced an AE compared to 10% of patients in the vancomycin group and none in the daptomycin group. In the oritavancin and dalbavancin group, the 2 most common AEs were infusion-related reactions and C. difficile colitis. Although infusion related reactions are easier to correspond to oritavancin and dalbavancin, it becomes difficult to definitively attribute the occurrence of C. difficile to these drugs as many patients were receiving concomitant antibiotics. Although not a primary or secondary objective, the rate of IV-line AEs were more prevalent in the vancomycin (10%), and daptomycin (13%) groups, compared to none in the oritavancin and dalbavancin group. This finding was expected; oritavancin and dalbavancin do not require a central IV line for administration.
Pharmacoeconomic literature continues to emerge with long-acting lipoglycopeptides. A 2024 Italian retrospective single-center analysis of 62 patients reported mean cost reductions > €3200 per patient (> $3400) given dalbavancin compared with the standard of care for ABSSSI or more deep-seeded infections such as osteomyelitis.23 A 2023 Spanish observational multicenter analysis of 124 patients with infective endocarditis demonstrated high efficacy, safety and cost-effectiveness with dalbavancin vs conventional treatments, with a mean savings of > €5548 per patient (> $6200).24 An analysis of the implementation of a dalbavancin order pathway for ABSSSI to avert inpatient admissions at 11 US emergency departments found a mean cost savings of $5133 per patient and $1211 per hospitalization day avoided, compared with inpatient usual care.25
Conversely, a multicenter, retrospective study of 209 patients in a community-based health care system failed to show a financial benefit for dalbavancin use when compared to standard of care for ABSSSI with higher readmission rates.26 Turco et al also reported increased cost results for 64 patients who received dalbavancin vs standard of care for ABSSSI.27 These discordant findings in ABSSSI studies may be impacted by the authors' patient selection choices and cost assumptions, especially with significantly cheaper oral alternatives. More data are needed to best identify the optimal therapeutic use for the long-acting lipoglycopeptides.
Limitations
The most significant limitation in this analysis was selection bias: 38 of 39 patients (97%) who received dalbavancin or oritavancin had a documented reason that described why OPAT therapy with traditional medications would not be optimal, including logistics, AEs, or clinical failures. Most patients treated with vancomycin and daptomycin were admitted into a SNF, RF, or CLC for the remainder of their treatment, allowing for closer monitoring and care compared to patients treated with oritavancin and dalbavancin, but at a greater cost. For patients sent to a community based SNF or RF, laboratory data were not available unless internally drawn or documented in the electronic medical record.
Additionally, not all cost data were available from VA sources; some were applied from literature, pharmacoeconomist, or best faith effort based on workflow. The cost data from third party contractors providing OPAT services to some BVAMC patients during the time frame of this analysis were not available. Due to its small sample size, outliers had the potential to affect averages reported and accuracy of the cost analysis. Emerging evidence suggests that daptomycin doses higher than the manufacturer-recommended regimen may be required for select indications, a factor that could affect cost, AEs, and efficacy outcomes.28 The acquisition cost of oritavancin and dalbavancin may vary by institution (ie, VA contract prices vs non- VA contract prices) and change over time. A current assessment of cost is needed to best visualize institutional benefit.
Finally, while the patient demographic of this MUE was highly representative of the demographic treated at the BVAMC (males aged >65 years), it may not be applicable to external patient populations. This analysis evaluated off-label indications for these medications. Consequently, this analysis would likely not be applicable to non-VA institution, as third-party payers (eg, insurance) are unlikely to cover medications for off-label indications.
CONCLUSIONS
This study found cost savings associated with the use of oritavancin and dalbavancin compared with vancomycin and daptomycin, particularly for the treatment of osteomyelitis. As safety and efficacy data continues to emerge, the use of long-acting lipoglycopeptides appears to be an increasingly attractive alternative option compared to traditional outpatient antimicrobial therapy, depending on the structure of the program. Larger, multicenter cost-effectiveness studies are needed to further establish the impact of these novel agents.
- Dalvance. Package insert. AbbVie Inc.; 2025.
- Orbactiv. Package insert. Melinta Therapeutics; 2022.
- Cooper CC, Stein GE, Mitra S, Abubaker A, Havlichek DH. Long-acting lipoglycopeptides for the treatment of bone and joint infections. Surg Infect (Larchmt). 2021;22(8):771- 779. doi:10.1089/sur.2020.413
- Simonetti O, Rizzetto G, Molinelli E, Cirioni O, Offidani A. Review: a safety profile of dalbavancin for on- and offlabel utilization. Ther Clin Risk Manag. 2021;17:223-232. doi:10.2147/TCRM.S271445
- Bloem A, Bax HI, Yusuf E, Verkaik NJ. New-generation antibiotics for treatment of gram-positive infections: a review with focus on endocarditis and osteomyelitis. J Clin Med. 2021;10(8):1743. doi:10.3390/jcm10081743
- Thomas G, Henao-Martínez AF, Franco-Paredes C, Chastain DB. Treatment of osteoarticular, cardiovascular, intravascular-catheter-related and other complicated infections with dalbavancin and oritavancin: a systematic review. Int J Antimicrob Agents. 2020;56(3):106069. doi:10.1016/j.ijantimicag.2020.106069
- Rappo U, Puttagunta S, Shevchenko V, et al. Dalbavancin for the treatment of osteomyelitis in adult patients: a randomized clinical trial of efficacy and safety. Open Forum Infect Dis. 2018;6(1):ofy331. doi:10.1093/ofid/ofy331
- Cain AR, Bremmer DN, Carr DR, et al. Effectiveness of dalbavancin compared with standard of care for the treatment of osteomyelitis: a real-world analysis. Open Forum Infect Dis. 2021;9(2):ofab589. doi:10.1093/ofid/ofab589
- Van Hise NW, Chundi V, Didwania V, et al. Treatment of acute osteomyelitis with once-weekly oritavancin: a two-year, multicenter, retrospective study. Drugs Real World Outcomes. 2020;7(Suppl 1):41-45. doi:10.1007/s40801-020-00195-7
- Cooper MM, Preslaski CR, Shihadeh KC, Hawkins KL, Jenkins TC. Multiple-dose dalbavancin regimens as the predominant treatment of deep-seated or endovascular infections: a scoping review. Open Forum Infect Dis. 2021;8(11):ofab486. doi:10.1093/ofid/ofab486
- Baddour LM, Wilson WR, Bayer AS, et al. Infective endocarditis in adults: diagnosis, antimicrobial therapy, and management of complications: a scientific statement for healthcare professionals from the American Heart Association. Circulation. 2015;132(15):1435-1486. doi:10.1161/CIR.0000000000000296
- Berbari EF, Kanj SS, Kowalski TJ, et al. 2015 Infectious Diseases Society of America (IDSA) Clinical Practice Guidelines for the Diagnosis and Treatment of Native Vertebral Osteomyelitis in Adults. Clin Infect Dis. 2015;61(6):e26-46. doi:10.1093/cid/civ482
- Arrieta-Loitegui M, Caro-Teller JM, Ortiz-Pérez S, López- Medrano F, San Juan-Garrido R, Ferrari-Piquero JM. Effectiveness, safety, and cost analysis of dalbavancin in clinical practice. Eur J Hosp Pharm. 2022;29(1):55-58. doi:10.1136/ejhpharm-2020-002315
- Pascale R, Maccaro A, Mikus E, et al. A retrospective multicentre study on dalbavancin effectiveness and cost-evaluation in sternotomic wound infection treatment: DALBA SWIT study. J Glob Antimicrob Resist. 2022;30:390-394. doi:10.1016/j.jgar.2022.07.018
- Antosz K, Al-Hasan MN, Lu ZK, et at. Clinical utility and cost effectiveness of long-acting lipoglycopeptides used in deep seated infections among patients with social and economic barriers to care. Pharmacy (Basel). 2021;10(1):1. doi:10.3390/pharmacy10010001
- Roberts MS. Economic aspects of evaluation. In: Friedman CP, Wyatt JC, eds. Evaluation Methods in Biomedical Informatics. 2nd ed. Springer; 2006:301-337.
- US Department of Veterans Affairs. HERC inpatient average cost data. Updated May 1, 2025. Accessed May 9, 2025. https://www.herc.research.va.gov/include/page.asp?id=inpatient
- US Department of Veterans Affairs. HERC Outpatient average cost dataset. Updated May 1, 2025. Accessed May 9, 2025. https://www.herc.research.va.gov/include/page.asp?id=outpatient
- Ektare V, Khachatryan A, Xue M, Dunne M, Johnson K, Stephens J. Assessing the economic value of avoiding hospital admissions by shifting the management of gram + acute bacterial skin and skin-structure infections to an outpatient care setting. J Med Econ. 2015;18(12):1092-1101. doi:10.3111/13696998.2015.1078339
- Ruh CA, Parameswaran GI, Wojciechowski AL, Mergenhagen KA. Outcomes and pharmacoeconomic analysis of a home intravenous antibiotic infusion program in veterans. Clin Ther. 2015;37(11):2527-2535. doi:10.1016/j.clinthera.2015.09.009
- Nakrani M, Yu D, Skikka M, et al. Comparison of vancomycin and daptomycin complications and interventions in outpatient parenteral antimicrobial therapy. Open Forum Infect Dis. 2020;7(Suppl 1):S361-S362. doi:10.1093/ofid/ofaa439.791
- Scoble PJ, Reilly J, Tilloston GS. Real-world use of oritavancin for the treatment of osteomyelitis. Drugs Real World Outcomes. 2020;7(Suppl 1):46-54. doi:10.1007/s40801-020-00194-8
- Segala D, Barbieri M, Di Nuzzo M, et al. Clinical, organizational, and pharmacoeconomic perspectives of dalbavancin vs standard of care in the infectious disease network. Glob Reg Health Technol Assess. 2024;11(Suppl 2):5-12. doi:10.33393/grhta.2024.3094
- Gómez A, et al. EN-DALBACEN 2.0 Cohort: real-life study of dalbavancin as sequential/consolidation therapy in patients with infective endocarditis due to Gram-positive cocci. Int J Antimicrob Agents. 2023;62(3):106918. doi:10.1016/j.ijantimicag.2023.106918
- LoVecchio F, McCarthy MW, Ye X, et al. Single intravenous dose dalbavancin pathway for the treatment of acute bacterial skin and skin structure infections: considerations for emergency department implementation and cost savings. J Emerg Med. 2024;67(2):e217-e229. doi:10.1016/j.jemermed.2024.03.003
- Gonzalez J, Andrade DC, Niu J. Cost-consequence analysis of single-dose dalbavancin versus standard of care for the treatment of acute bacterial skin and skin structure infections in a multisite healthcare system. Clin Infect Dis. 2021;73(7):e1436-e1442. doi:10.1093/cid/ciaa1732
- Turco NJ, Kane-Gill SL, Hernandez I, Oleksiuk LM, D’Amico F, Pickering AJ. A cost-minimization analysis of dalbavancin compared to conventional therapy for the outpatient treatment of acute bacterial skin and skin-structure infections. Expert Opin Pharmacother. 2018;19(4):319-325. doi:10.1080/14656566.2018.1442439
- Jones TW, Jun AH, Michal JL, Olney WJ. High-dose daptomycin and clinical applications. Ann Pharmacother. 2021;55(11):1363-1378. doi:10.1177/1060028021991943
Oritavancin and dalbavancin are long acting lipoglycopeptides indicated for the treatment of acute bacterial skin and skin structure infections (ABSSSI).1,2 Largely due to their long half-lives, prolonged tissue concentrations at sites of infection, tolerability, and minimal requirement for therapeutic drug monitoring, these agents are attractive options in outpatient settings.3,4 A 1- or 2-dose treatment of oritavancin and dalbavancin may be sufficient for conditions traditionally treated with outpatient parenteral antimicrobial therapy (OPAT) via peripherally inserted central catheter (PICC).
Limited research supports the use of dalbavancin and oritavancin for bone and joint infections, infective endocarditis, and bloodstream infections (BSIs). However, the US Food and Drug Administration has approved an indication for the treatment of ABSSSI.3-9 Dosing for these off-label indications varies but typically consists of an initial intravenous (IV) dose (1000 mg, 1200 mg, or 1500 mg), with a subsequent dose 1 to 2 weeks later or administered once weekly.6-10
Due in part to the recent availability of oritavancin and dalbavancin relative to the publication of practice guidelines, their appropriate place in therapy continues to evolve based on emerging literature.11,12 One potential barrier of use for these medications is their cost. Based on the number of doses administered, the 2022 estimated total acquisition cost of therapy for oritavancin and dalbavancin was $1014 to $4397 and $3046 to $7150, respectively (eAppendix). Despite the high acquisition costs, these agents do not require the placement of an indwelling central line, can be administered in outpatient settings, and require minimal therapeutic dose monitoring compared to vancomycin.13-15 This medication use evaluation (MUE) compared the total cost of treatment with oritavancin and dalbavancin vs therapies traditionally used for OPAT or prolonged IV inpatient therapy.
METHODS
This retrospective MUE was conducted at the Boise Veterans Affairs Medical Center (BVAMC), a level 2 facility with an extensive rural catchment area. BVAMC provides many OPAT services, including medications, supplies, and dressing changes after initial clinic or inpatient education. Contracted vendors may also assist with at-home nursing care using supplies provided by the BVAMC. Cases were identified using an internal database of OPAT patients and those who received oritavancin or dalbavancin between September 1, 2017, and November 1, 2022. Patients aged ≥ 18 years who received ≥ 1 dose of oritavancin or dalbavancin for ABSSSI, osteomyelitis/joint infections, endocarditis, and BSI were included. Comparator treatments consisting of ≥ 1 week of vancomycin or daptomycin for ABSSSI, osteomyelitis/joint infections, endocarditis, and BSI were identified through review of OPAT and Infectious Diseases service consults during the same timeframe. Patients were excluded if any antibiotic was prescribed by a non- VA clinician, if medications were not provided by OPAT, or if chart review did not identify an ABSSSI, osteomyelitis/ joint infection, or BSI diagnosis.
Electronic medical record review was conducted using a standardized data collection form (eAppendix). Data collected included demographics, infectious diagnosis, treatment administered, administration procedures and related visits and treatment locations, outcomes including clinical failure, adverse events (AEs), and hospital readmission.
Clinical failure was defined as readmission or death due to worsening infection or readmission secondary to a documented potential AE to the evaluated antibiotics within 90 days after initiation. Clinical failures excluded readmissions not associated with infection including comorbidities or elective procedures. AEs included new onset renal failure (serum creatinine ≥ 0.5 mg/dL), neutropenia (neutrophils ≤ 500), thrombocytopenia (platelets < 100,000), eosinophilia (> 15% eosinophils), or creatine phosphokinase > 10 times the upper limit of normal, and Clostridioides difficile (C. difficile) infection. Line complications included thrombophlebitis, local inflammation, or infection requiring line replacement (eAppendix).
A cost-minimization approach was used to assess the total cost of treatment.16 Patients who received oritavancin or dalbavancin were matched with patients that received vancomycin and daptomycin for the same indication and about 1 month of initiation through the randomization function in Microsoft Excel. This accounted for changes in personnel, nonformulary drug approvals, cost, and changes in practice during the pandemic. Costs were calculated using a decision tree as a base model (Figure 1). In this model, each treatment dyad was assessed for the presence or absence of clinical failure, adverse event (medication and line complications), and treatment setting endpoints. Cost estimates were tabulated for each patient that received treatment using published VA data, literature, pharmacoeconomist guidance, or best faith effort based on workflow. 17-20 All cost estimates were based on 2022 figures or adjusted for inflation if obtained prior to 2022. Secondary endpoints of this analysis included estimated total cost of medication acquisition, administration supplies, laboratory monitoring, and human resources for OPAT visits or receiving home-health services.
This evaluation was classified by the BVAMC Medication Use Evaluation research determination subcommittee as a quality improvement project and was considered exempt from VA Human Subjects Research requirements based on the VA Policy Handbook guideline 1058.05.
RESULTS
The study identified 44 patients who received dalbavancin or oritavancin between September 1, 2017, and October 31, 2022. Thirty-nine patients were included in the analysis: 24 received oritavancin and 15 received dalbavancin and were matched by indication to 10 patients who received vancomycin and 8 patients who received daptomycin. Three patients could not be matched by indication of ABSSSI (Figure 2). Most patients were male, aged > 65 years, and were treated for osteomyelitis (Table 1). No patients were treated for infective endocarditis. A myriad of concomitant antibiotics were used to treat patients and culture results indicated that most infections treated with oritavancin and dalbavancin were polymicrobial.
The mean total cost of therapy per patient receiving oritavancin, dalbavancin, vancomycin, and daptomycin was $35,630, $59,612, $73,333, and $73,708, respectively (Figure 3). When stratified by indication, 27 patients (69%) in the oritavancin/dalbavancin group were treated for osteomyelitis/ joint infections (16 oritavancin, 11 dalbavancin), 9 patients (23%) were treated for BSI (6 oritavancin, 3 dalbavancin), and 3 patients (8%) were treated for ABSSSI (2 oritavancin, 1 dalbavancin). The mean cost per patient for osteomyelitis/joint infections with oritavancin, dalbavancin, vancomycin, and daptomycin was $34,678, $54,224, $87,488, and $85,044, respectively. The mean cost per patient for BSI for oritavancin, dalbavancin, vancomycin, and daptomycin was $35,048, $75,349, $40,305, and $68,068, respectively. The mean cost per patient for ABSSSI for oritavancin and dalbavancin was $44,771 and $71,672.51.
Estimated total drug cost represents the cost of drug acquisition, administration supplies, laboratory monitoring, and human resources for OPAT visits or receiving home health services. The mean cost per patient of drug-related therapy for oritavancin, dalbavancin, vancomycin, and daptomycin was $2203, $5924, $3637, and $7146, respectively (Table 2).
The mean cost per patient for osteomyelitis therapy for oritavancin, dalbavancin, vancomycin, and daptomycin was $2375, $6775, $4164, $8152, respectively. The mean cost of per patient for BSI treatment with oritavancin, dalbavancin, vancomycin, and daptomycin was $1737, $3475, $2409, and $1016, respectively. The mean cost per patient for oritavancin and dalbavancin for ABSSSI treatment, was $1553 and $3910, respectively.
Setting-related costs include expenses from inpatient admissions and postdischarge stays at community living centers (CLCs), skilled nursing facilities (SNFs), or rehabilitation facilities (RFs) for the duration of antimicrobial therapy. The mean setting-related therapy cost for osteomyelitis treatment with oritavancin, dalbavancin, vancomycin, and daptomycin was $27,852, $17,815, $83,324, and $72,856, respectively. The mean setting-related therapy cost per patient for BSI treatment with oritavancin, dalbavancin, vancomycin, and daptomycin was $33,310, $60,668, $37,734, and $67,074, respectively. The mean setting-related therapy cost per patient for ABSSSI treatment for oritavancin and dalbavancin was $43,218 and $67,762.00, respectively.
Six of 39 patients (15%) had clinical failure: 2 patients with oritavancin and 4 patients with dalbavancin. Four patients were readmitted for worsening infection and 2 for AEs. One patient (13%) in the daptomycin group had clinical failure due to readmission for worsening infection. There was no clinical failure with vancomycin. The costs associated with clinical failure per patient for oritavancin, dalbavancin, vancomycin, and daptomycin were $2925, $23,972, $0, and $3601, respectively (Table 3).
Thirty-eight patients (97%) who received oritavancin or dalbavancin had difficulty adhering to vancomycin or daptomycin OPAT. Oritavancin or dalbavancin was used in 10 patients (26%) who lacked support at home and 15 patients (38%) who had either a contraindication or previous failure with other antimicrobials, which were the most common explanations.
DISCUSSION
Long-acting lipoglycopeptides represent a potential alternative to home IV therapy that can avoid prolonged IV access with traditional OPAT. This offers significant advantages, allowing patients to be discharged from the hospital early, especially in rural areas with little OPAT infrastructure or those with logistic challenges. In this analysis, treatment with oritavancin for osteomyelitis, BSI, or ABSSSI, yielded an estimated cost savings of about $37,000 per patient, compared to treatment of matched indications with vancomycin and daptomycin. For every patient treated with dalbavancin for osteomyelitis, BSI, or ABSSSI, the cost savings was about $13,000 per patient, compared to treatment of matched indications for daptomycin and vancomycin. The estimated cost savings per patient for oritavancin was similar to previously published projections ($30,500 to $55,831).15
Cost savings were primarily driven by setting-related costs. The greatest contrast between the oritavancin and dalbavancin group compared to the vancomycin and daptomycin group was the length of stay in a postdischarge CLC, SNF, or RF setting. This analysis estimated that for every patient treated with oritavancin for osteomyelitis, the setting-related cost savings per patient was about $55,000 compared with vancomycin, and about $45,000 per patient compared with daptomycin. Furthermore, the estimated setting-related cost savings for osteomyelitis treatment with dalbavancin was about $65,000 compared with vancomycin and about $55,000 compared with daptomycin.
Clinical failure occurred with greater frequency in the oritavancin and dalbavancin groups (15%), compared with the vancomycin (0%) and daptomycin (13%) groups. Although the clinical failure rates in patients with osteomyelitis treated with oritavancin and dalbavancin compared with daptomycin were like those in previously published research (10%-30%), the rates of clinical failure for vancomycin in this analysis were lower than those in the oritavancin and dalbavancin group.8,21,22 The discrepancy in clinical failure rates between this analysis and previous research is likely due to selection bias. Based on the percentages of clinical failure found in the analysis, it is not surprising to note that the total clinical failure-related cost per patient was higher for oritavancin and dalbavancin compared to vancomycin, but similar between oritavancin and daptomycin.
This analysis also found that 15% of patients in the oritavancin and dalbavancin group experienced an AE compared to 10% of patients in the vancomycin group and none in the daptomycin group. In the oritavancin and dalbavancin group, the 2 most common AEs were infusion-related reactions and C. difficile colitis. Although infusion related reactions are easier to correspond to oritavancin and dalbavancin, it becomes difficult to definitively attribute the occurrence of C. difficile to these drugs as many patients were receiving concomitant antibiotics. Although not a primary or secondary objective, the rate of IV-line AEs were more prevalent in the vancomycin (10%), and daptomycin (13%) groups, compared to none in the oritavancin and dalbavancin group. This finding was expected; oritavancin and dalbavancin do not require a central IV line for administration.
Pharmacoeconomic literature continues to emerge with long-acting lipoglycopeptides. A 2024 Italian retrospective single-center analysis of 62 patients reported mean cost reductions > €3200 per patient (> $3400) given dalbavancin compared with the standard of care for ABSSSI or more deep-seeded infections such as osteomyelitis.23 A 2023 Spanish observational multicenter analysis of 124 patients with infective endocarditis demonstrated high efficacy, safety and cost-effectiveness with dalbavancin vs conventional treatments, with a mean savings of > €5548 per patient (> $6200).24 An analysis of the implementation of a dalbavancin order pathway for ABSSSI to avert inpatient admissions at 11 US emergency departments found a mean cost savings of $5133 per patient and $1211 per hospitalization day avoided, compared with inpatient usual care.25
Conversely, a multicenter, retrospective study of 209 patients in a community-based health care system failed to show a financial benefit for dalbavancin use when compared to standard of care for ABSSSI with higher readmission rates.26 Turco et al also reported increased cost results for 64 patients who received dalbavancin vs standard of care for ABSSSI.27 These discordant findings in ABSSSI studies may be impacted by the authors' patient selection choices and cost assumptions, especially with significantly cheaper oral alternatives. More data are needed to best identify the optimal therapeutic use for the long-acting lipoglycopeptides.
Limitations
The most significant limitation in this analysis was selection bias: 38 of 39 patients (97%) who received dalbavancin or oritavancin had a documented reason that described why OPAT therapy with traditional medications would not be optimal, including logistics, AEs, or clinical failures. Most patients treated with vancomycin and daptomycin were admitted into a SNF, RF, or CLC for the remainder of their treatment, allowing for closer monitoring and care compared to patients treated with oritavancin and dalbavancin, but at a greater cost. For patients sent to a community based SNF or RF, laboratory data were not available unless internally drawn or documented in the electronic medical record.
Additionally, not all cost data were available from VA sources; some were applied from literature, pharmacoeconomist, or best faith effort based on workflow. The cost data from third party contractors providing OPAT services to some BVAMC patients during the time frame of this analysis were not available. Due to its small sample size, outliers had the potential to affect averages reported and accuracy of the cost analysis. Emerging evidence suggests that daptomycin doses higher than the manufacturer-recommended regimen may be required for select indications, a factor that could affect cost, AEs, and efficacy outcomes.28 The acquisition cost of oritavancin and dalbavancin may vary by institution (ie, VA contract prices vs non- VA contract prices) and change over time. A current assessment of cost is needed to best visualize institutional benefit.
Finally, while the patient demographic of this MUE was highly representative of the demographic treated at the BVAMC (males aged >65 years), it may not be applicable to external patient populations. This analysis evaluated off-label indications for these medications. Consequently, this analysis would likely not be applicable to non-VA institution, as third-party payers (eg, insurance) are unlikely to cover medications for off-label indications.
CONCLUSIONS
This study found cost savings associated with the use of oritavancin and dalbavancin compared with vancomycin and daptomycin, particularly for the treatment of osteomyelitis. As safety and efficacy data continues to emerge, the use of long-acting lipoglycopeptides appears to be an increasingly attractive alternative option compared to traditional outpatient antimicrobial therapy, depending on the structure of the program. Larger, multicenter cost-effectiveness studies are needed to further establish the impact of these novel agents.
- Dalvance. Package insert. AbbVie Inc.; 2025.
- Orbactiv. Package insert. Melinta Therapeutics; 2022.
- Cooper CC, Stein GE, Mitra S, Abubaker A, Havlichek DH. Long-acting lipoglycopeptides for the treatment of bone and joint infections. Surg Infect (Larchmt). 2021;22(8):771- 779. doi:10.1089/sur.2020.413
- Simonetti O, Rizzetto G, Molinelli E, Cirioni O, Offidani A. Review: a safety profile of dalbavancin for on- and offlabel utilization. Ther Clin Risk Manag. 2021;17:223-232. doi:10.2147/TCRM.S271445
- Bloem A, Bax HI, Yusuf E, Verkaik NJ. New-generation antibiotics for treatment of gram-positive infections: a review with focus on endocarditis and osteomyelitis. J Clin Med. 2021;10(8):1743. doi:10.3390/jcm10081743
- Thomas G, Henao-Martínez AF, Franco-Paredes C, Chastain DB. Treatment of osteoarticular, cardiovascular, intravascular-catheter-related and other complicated infections with dalbavancin and oritavancin: a systematic review. Int J Antimicrob Agents. 2020;56(3):106069. doi:10.1016/j.ijantimicag.2020.106069
- Rappo U, Puttagunta S, Shevchenko V, et al. Dalbavancin for the treatment of osteomyelitis in adult patients: a randomized clinical trial of efficacy and safety. Open Forum Infect Dis. 2018;6(1):ofy331. doi:10.1093/ofid/ofy331
- Cain AR, Bremmer DN, Carr DR, et al. Effectiveness of dalbavancin compared with standard of care for the treatment of osteomyelitis: a real-world analysis. Open Forum Infect Dis. 2021;9(2):ofab589. doi:10.1093/ofid/ofab589
- Van Hise NW, Chundi V, Didwania V, et al. Treatment of acute osteomyelitis with once-weekly oritavancin: a two-year, multicenter, retrospective study. Drugs Real World Outcomes. 2020;7(Suppl 1):41-45. doi:10.1007/s40801-020-00195-7
- Cooper MM, Preslaski CR, Shihadeh KC, Hawkins KL, Jenkins TC. Multiple-dose dalbavancin regimens as the predominant treatment of deep-seated or endovascular infections: a scoping review. Open Forum Infect Dis. 2021;8(11):ofab486. doi:10.1093/ofid/ofab486
- Baddour LM, Wilson WR, Bayer AS, et al. Infective endocarditis in adults: diagnosis, antimicrobial therapy, and management of complications: a scientific statement for healthcare professionals from the American Heart Association. Circulation. 2015;132(15):1435-1486. doi:10.1161/CIR.0000000000000296
- Berbari EF, Kanj SS, Kowalski TJ, et al. 2015 Infectious Diseases Society of America (IDSA) Clinical Practice Guidelines for the Diagnosis and Treatment of Native Vertebral Osteomyelitis in Adults. Clin Infect Dis. 2015;61(6):e26-46. doi:10.1093/cid/civ482
- Arrieta-Loitegui M, Caro-Teller JM, Ortiz-Pérez S, López- Medrano F, San Juan-Garrido R, Ferrari-Piquero JM. Effectiveness, safety, and cost analysis of dalbavancin in clinical practice. Eur J Hosp Pharm. 2022;29(1):55-58. doi:10.1136/ejhpharm-2020-002315
- Pascale R, Maccaro A, Mikus E, et al. A retrospective multicentre study on dalbavancin effectiveness and cost-evaluation in sternotomic wound infection treatment: DALBA SWIT study. J Glob Antimicrob Resist. 2022;30:390-394. doi:10.1016/j.jgar.2022.07.018
- Antosz K, Al-Hasan MN, Lu ZK, et at. Clinical utility and cost effectiveness of long-acting lipoglycopeptides used in deep seated infections among patients with social and economic barriers to care. Pharmacy (Basel). 2021;10(1):1. doi:10.3390/pharmacy10010001
- Roberts MS. Economic aspects of evaluation. In: Friedman CP, Wyatt JC, eds. Evaluation Methods in Biomedical Informatics. 2nd ed. Springer; 2006:301-337.
- US Department of Veterans Affairs. HERC inpatient average cost data. Updated May 1, 2025. Accessed May 9, 2025. https://www.herc.research.va.gov/include/page.asp?id=inpatient
- US Department of Veterans Affairs. HERC Outpatient average cost dataset. Updated May 1, 2025. Accessed May 9, 2025. https://www.herc.research.va.gov/include/page.asp?id=outpatient
- Ektare V, Khachatryan A, Xue M, Dunne M, Johnson K, Stephens J. Assessing the economic value of avoiding hospital admissions by shifting the management of gram + acute bacterial skin and skin-structure infections to an outpatient care setting. J Med Econ. 2015;18(12):1092-1101. doi:10.3111/13696998.2015.1078339
- Ruh CA, Parameswaran GI, Wojciechowski AL, Mergenhagen KA. Outcomes and pharmacoeconomic analysis of a home intravenous antibiotic infusion program in veterans. Clin Ther. 2015;37(11):2527-2535. doi:10.1016/j.clinthera.2015.09.009
- Nakrani M, Yu D, Skikka M, et al. Comparison of vancomycin and daptomycin complications and interventions in outpatient parenteral antimicrobial therapy. Open Forum Infect Dis. 2020;7(Suppl 1):S361-S362. doi:10.1093/ofid/ofaa439.791
- Scoble PJ, Reilly J, Tilloston GS. Real-world use of oritavancin for the treatment of osteomyelitis. Drugs Real World Outcomes. 2020;7(Suppl 1):46-54. doi:10.1007/s40801-020-00194-8
- Segala D, Barbieri M, Di Nuzzo M, et al. Clinical, organizational, and pharmacoeconomic perspectives of dalbavancin vs standard of care in the infectious disease network. Glob Reg Health Technol Assess. 2024;11(Suppl 2):5-12. doi:10.33393/grhta.2024.3094
- Gómez A, et al. EN-DALBACEN 2.0 Cohort: real-life study of dalbavancin as sequential/consolidation therapy in patients with infective endocarditis due to Gram-positive cocci. Int J Antimicrob Agents. 2023;62(3):106918. doi:10.1016/j.ijantimicag.2023.106918
- LoVecchio F, McCarthy MW, Ye X, et al. Single intravenous dose dalbavancin pathway for the treatment of acute bacterial skin and skin structure infections: considerations for emergency department implementation and cost savings. J Emerg Med. 2024;67(2):e217-e229. doi:10.1016/j.jemermed.2024.03.003
- Gonzalez J, Andrade DC, Niu J. Cost-consequence analysis of single-dose dalbavancin versus standard of care for the treatment of acute bacterial skin and skin structure infections in a multisite healthcare system. Clin Infect Dis. 2021;73(7):e1436-e1442. doi:10.1093/cid/ciaa1732
- Turco NJ, Kane-Gill SL, Hernandez I, Oleksiuk LM, D’Amico F, Pickering AJ. A cost-minimization analysis of dalbavancin compared to conventional therapy for the outpatient treatment of acute bacterial skin and skin-structure infections. Expert Opin Pharmacother. 2018;19(4):319-325. doi:10.1080/14656566.2018.1442439
- Jones TW, Jun AH, Michal JL, Olney WJ. High-dose daptomycin and clinical applications. Ann Pharmacother. 2021;55(11):1363-1378. doi:10.1177/1060028021991943
Are Oritavancin and Dalbavancin More Cost Effective for Outpatient Parenteral Antimicrobial Therapy at a Veterans Affairs Medical Center?
Are Oritavancin and Dalbavancin More Cost Effective for Outpatient Parenteral Antimicrobial Therapy at a Veterans Affairs Medical Center?