User login
Heart failure: Medicare cost sharing may put quadruple therapy out of reach
Out-of-pocket (OOP) costs for Medicare enrollees receiving quadruple drug therapy for heart failure with reduced ejection fraction were “substantially higher than regimens limited to generically available medications,” according to a new analysis of prescription drug plans.
“Despite the clinical benefit of quadruple therapy” consisting of beta-blockers, angiotensin receptor-neprilysin inhibitors (ARNIs), mineralocorticoid receptor antagonists (MRAs), and sodium-glucose cotransporter-2 (SGLT2) inhibitors, “coverage was restricted primarily through cost sharing, and estimated annual OOP costs for beneficiaries were [over $2,000] per year under most plans,” wrote Kamil F. Faridi, MD, and associates. The findings were published in the Journal of the American College of Cardiology.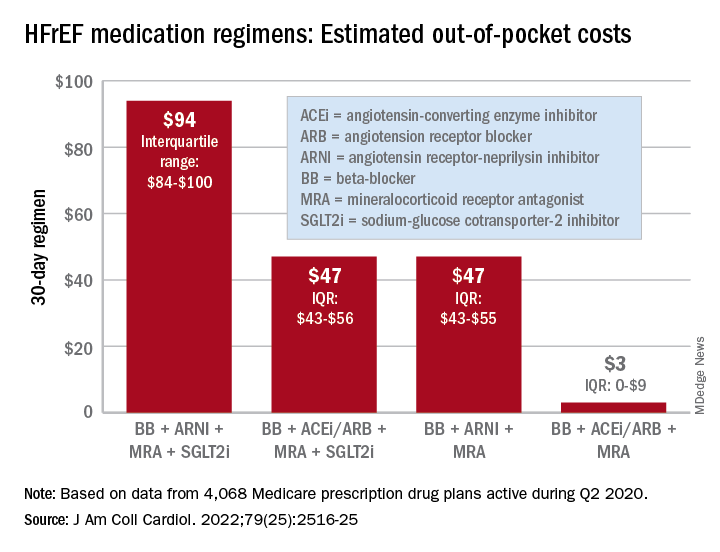
For just 1 month of quadruple drug therapy for heart failure with reduced ejection fraction (HFrEF), the estimated median OOP cost was $94 for individuals covered by a Medicare prescription drug plan during the second quarter of 2020, with the majority coming from the ARNI (median, $47) and the SGLT2 inhibitor (median, $45). Alternative HFrEF regimens were significantly less costly, ranging from $3 to $47 OOP, the investigators reported.
Almost all of the 4,068 plans participating in Medicare at that time covered quadruple therapy for HFrEF, but more than 99% restricted coverage by instituting cost sharing for medications at tier level 3 and above on the drug formularies. Such restrictions for ARNIs and SGLT2 inhibitors “might not be readily apparent to prescribing physicians,” wrote Dr. Faridi of Yale University, New Haven, Conn., and associates.
Other methods of regulating coverage were less common. Prior authorization of ARNIs was invoked by about a quarter of the plans, but none required authorization for any of the other drugs involved, and few plans used step therapy-requirements involving lower-cost alternatives, they noted.
“The use of cost sharing restricts access through high OOP costs for patients. Furthermore, these policies likely disadvantage relatively poorer patients (although the poorest Medicare patients will tend to be dual-enrolled in Medicaid and protected from cost sharing),” Jason H. Wasfy, MD, and Anna C. O’Kelly, MD, said in an accompanying editorial comment .
Since acceptable cost-effectiveness has been demonstrated for dapagliflozin, an SGLT1 inhibitor, and for the ARNIs, and because these medications have no generic equivalents, health plans should “use the discretion they have under Medicare Part D to reduce cost sharing for patients with HFrEF,” Dr. Wasfy and Dr. O’Kelly wrote, adding that the current study “demonstrates that without consensus on cost effectiveness from the societal perspective, costs can be imposed directly on patients in ways that slow uptake of cost-effective drugs.”
Data for all Medicare Advantage plans (n = 3,167) and standalone Part D plans (n = 901) came from the Medicare Prescription Drug Plan Formulary and Pricing Information Files. Annual OOP costs were estimated “using each phase of a 2020 Medicare part D standard benefit,” including deductible, standard coverage, coverage gap, and catastrophic coverage, the investigators explained.
Dr. Faridi and associates did not report any direct funding sources for their study. Dr Faridi received a grant from the National Institutes of Health outside the scope of the present work, and other investigators disclosed ties to the Food and Drug Administration, the Centers for Medicare and Medicaid Services, Johnson & Johnson, AstraZeneca, Boehringer Ingelheim, Amgen, Cytokinetics, and the Institute for Clinical and Economic Review.
Dr. Wasfy is supported by the American Heart Association and has received consulting fees from Pfizer and honoraria from the Institute for Clinical and Economic Review. Dr. O’Kelly has no relevant disclosures.
FROM THE JOURNAL Of the AMERICAN COLLEGE OF CARDIOLOGY
How we treat acute pain could be wrong
In a surprising discovery that flies in the face of conventional medicine,
The paper, published in Science Translational Medicine, suggests that inflammation, a normal part of injury recovery, helps resolve acute pain and prevents it from becoming chronic. Blocking that inflammation may interfere with this process, leading to harder-to-treat pain.
“What we’ve been doing for decades not only appears to be wrong, but appears to be 180 degrees wrong,” says senior study author Jeffrey Mogil, PhD, a professor in the department of psychology at McGill University in Montreal. “You should not be blocking inflammation. You should be letting inflammation happen. That’s what stops chronic pain.”
Inflammation: Nature’s pain reliever
Wanting to know why pain goes away for some but drags on (and on) for others, the researchers looked at pain mechanisms in both humans and mice. They found that a type of white blood cell known as a neutrophil seems to play a key role.
“In analyzing the genes of people suffering from lower back pain, we observed active changes in genes over time in people whose pain went away,” says Luda Diatchenko, PhD, a professor in the faculty of medicine and Canada excellence research chair in human pain genetics at McGill. “Changes in the blood cells and their activity seemed to be the most important factor, especially in cells called neutrophils.”
To test this link, the researchers blocked neutrophils in mice and found the pain lasted 2-10 times longer than normal. Anti-inflammatory drugs, despite providing short-term relief, had the same pain-prolonging effect – though injecting neutrophils into the mice seemed to keep that from happening.
The findings are supported by a separate analysis of 500,000 people in the United Kingdom that showed those taking anti-inflammatory drugs to treat their pain were more likely to have pain 2-10 years later.
“Inflammation occurs for a reason,” says Dr. Mogil, “and it looks like it’s dangerous to interfere with it.”
Rethinking how we treat pain
Neutrophils arrive early during inflammation, at the onset of injury – just when many of us reach for pain medication. This research suggests it might be better not to block inflammation, instead letting the neutrophils “do their thing.” Taking an analgesic that alleviates pain without blocking neutrophils, like acetaminophen, may be better than taking an anti-inflammatory drug or steroid, says Dr. Mogil.
Still, while the findings are compelling, clinical trials are needed to directly compare anti-inflammatory drugs to other painkillers, the researchers said. This research may also lay the groundwork for new drug development for chronic pain patients, Dr. Mogil says.
“Our data strongly suggests that neutrophils act like analgesics themselves, which is potentially useful in terms of analgesic development,” Dr. Mogil says. “And of course, we need new analgesics.”
A version of this article first appeared on WebMD.com.
FROM SCIENCE TRANSLATIONAL MEDICINE
Longer circadian rhythms linked to severe depression in teens
, according to results from a European study.
A range of psychiatric symptoms and conditions has been linked to sleep pathologies, wrote Liisa Kuula, PhD, of the University of Helsinki, Finland, and colleagues. Some research suggests that late circadian rhythms and irregular sleep patterns increase the risk for psychiatric conditions, but the association has not been well studied, especially in adolescents, although the onset of psychiatric problems often occurs at this age, they said.

In a study published in the Journal of Psychiatric Research (2022 Apr 4. doi: 10.1016/j.jpsychires.2022.03.056.), the investigators reviewed data from 342 adolescents who were part of SleepHelsinki! a large cohort study of delayed sleep phase disorder (DSPD) in adolescents. The mean age of the participants was 17.4 years, and 70% were female.
The participants completed the Mini International Neuropsychiatric Interview (MINI) and wore temperature loggers for 3 days to assess circadian rhythms. The primary outcome was the impact of circadian dynamics on different psychiatric problems. Delayed Sleep Phase (DSP) behavior was defined as going to sleep later than 1 a.m. at least three times a week.
Circadian length was determined through the temperature loggers worn for 3 days. Most participants also completed 1-week GeneActiv Original actigraphy measurements (wearing the actigraph for 1 week) and responded to the Morningness-Eveningness Questionnaire, which divided participants into three circadian preference groups: morning, intermediate, and evening. Sleep duration was calculated as total sleep time, sleep quality was estimated by sleep efficiency, and sleep timing was assessed by the midpoint of the sleep period.
Overall, the MINI interview results suggested that approximately one-third (36%) of the teens had at least one psychiatric problem, and 21% had comorbid conditions.
Severe depression was significantly associated with a longer circadian period (P = .002), while suicidality was significantly associated with a later midpoint and more irregular sleep (P = .007 for both).
Participants with agoraphobia slept longer than did those without, the researchers noted (P = .013). However, sleep duration was not significantly associated with other psychiatric conditions.
Manic episodes and psychotic disorders were associated with irregular sleep timing (P < .018 and P < .017, respectively).
When the researchers examined DSP and circadian preferences, they found that 21.5% of individuals with suicidality had characteristics of DSP, as did 21.5% of those with panic disorder.
Individuals with a preference for eveningness were significantly more likely to meet criteria for severe depression, panic disorder, generalized anxiety disorder, and obsessive-compulsive disorder than were those without a preference for eveningness, the researchers noted.
“Our findings are the first to encompass diverse circadian measures alongside an array of psychiatric symptoms in such a focused age range,” the researchers wrote in their discussion. The data reflect results from other studies and extend the likely role of circadian patterns in mental wellbeing, they said.
The study findings were limited by several factors including the lack of actual diagnoses from medical records and use of self-reported symptoms, the researchers noted. Other limitations included the lack of polysomnography data and small size of subgroups of the study sample.
However, the results were strengthened by the heterogenous study population and use of multiple measures to examine sleep and circadian rhythms, as well as consideration of personal circadian preferences, the researchers said.
“The importance of overall synchronization with environment is perhaps best highlighted by response to treatment: most psychopathologic symptoms benefit from sleep-targeted therapeutic approaches,” they concluded.
The study received no outside funding. The researchers had no financial conflicts to disclose.
, according to results from a European study.
A range of psychiatric symptoms and conditions has been linked to sleep pathologies, wrote Liisa Kuula, PhD, of the University of Helsinki, Finland, and colleagues. Some research suggests that late circadian rhythms and irregular sleep patterns increase the risk for psychiatric conditions, but the association has not been well studied, especially in adolescents, although the onset of psychiatric problems often occurs at this age, they said.
In a study published in the Journal of Psychiatric Research (2022 Apr 4. doi: 10.1016/j.jpsychires.2022.03.056.), the investigators reviewed data from 342 adolescents who were part of SleepHelsinki! a large cohort study of delayed sleep phase disorder (DSPD) in adolescents. The mean age of the participants was 17.4 years, and 70% were female.
The participants completed the Mini International Neuropsychiatric Interview (MINI) and wore temperature loggers for 3 days to assess circadian rhythms. The primary outcome was the impact of circadian dynamics on different psychiatric problems. Delayed Sleep Phase (DSP) behavior was defined as going to sleep later than 1 a.m. at least three times a week.
Circadian length was determined through the temperature loggers worn for 3 days. Most participants also completed 1-week GeneActiv Original actigraphy measurements (wearing the actigraph for 1 week) and responded to the Morningness-Eveningness Questionnaire, which divided participants into three circadian preference groups: morning, intermediate, and evening. Sleep duration was calculated as total sleep time, sleep quality was estimated by sleep efficiency, and sleep timing was assessed by the midpoint of the sleep period.
Overall, the MINI interview results suggested that approximately one-third (36%) of the teens had at least one psychiatric problem, and 21% had comorbid conditions.
Severe depression was significantly associated with a longer circadian period (P = .002), while suicidality was significantly associated with a later midpoint and more irregular sleep (P = .007 for both).
Participants with agoraphobia slept longer than did those without, the researchers noted (P = .013). However, sleep duration was not significantly associated with other psychiatric conditions.
Manic episodes and psychotic disorders were associated with irregular sleep timing (P < .018 and P < .017, respectively).
When the researchers examined DSP and circadian preferences, they found that 21.5% of individuals with suicidality had characteristics of DSP, as did 21.5% of those with panic disorder.
Individuals with a preference for eveningness were significantly more likely to meet criteria for severe depression, panic disorder, generalized anxiety disorder, and obsessive-compulsive disorder than were those without a preference for eveningness, the researchers noted.
“Our findings are the first to encompass diverse circadian measures alongside an array of psychiatric symptoms in such a focused age range,” the researchers wrote in their discussion. The data reflect results from other studies and extend the likely role of circadian patterns in mental wellbeing, they said.
The study findings were limited by several factors including the lack of actual diagnoses from medical records and use of self-reported symptoms, the researchers noted. Other limitations included the lack of polysomnography data and small size of subgroups of the study sample.
However, the results were strengthened by the heterogenous study population and use of multiple measures to examine sleep and circadian rhythms, as well as consideration of personal circadian preferences, the researchers said.
“The importance of overall synchronization with environment is perhaps best highlighted by response to treatment: most psychopathologic symptoms benefit from sleep-targeted therapeutic approaches,” they concluded.
The study received no outside funding. The researchers had no financial conflicts to disclose.
FROM THE JOURNAL OF PSYCHIATRIC RESEARCH
Bariatric surgery can be a tool to relieve migraine
DENVER – , a neurologist told colleagues at the annual meeting of the American Headache Society. “There’s evidence-based medicine to support bariatric surgery, a lot of it, and the outcomes are actually pretty good,” said Jennifer McVige, MD, MA, of Dent Neurologic Institute in Buffalo, N.Y.
As Dr. McVige noted, research has linked obesity to migraine even after adjustment for comorbidities. A 2007 analysis of a survey of 30,215 participants, for example, found that “the proportion of subjects with severe headache pain increased with BMI, doubling in the morbidly obese relative to the normally weighted (odds ratio [OR] = 1.9).” And a 2011 study of 3,733 pregnant women found that risk of migraine increased in line with level of obesity: “obese women had a 1.48-fold increased odds of migraine (OR = 1.48; 95% confidence interval [CI], 1.12-1.96). Severely obese (OR = 2.07; 95% CI, 1.27-3.39) and morbidly obese (OR = 2.75; 95% CI, 1.60-4.70) had the highest odds of migraines.”
The link between obesity and headaches is unclear, she said, but there are hints at possible factors. For one, calcitonin gene-related peptide (CGRP) is increased in people with obesity and is an important factor in migraines. Additionally, nausea is quite common in people with migraine, suggesting a possible gut-brain interaction – or not.
“Nausea is associated with a lot of the medicines that we give patients with migraine. Is it the nausea that’s associated with the migraine medicine, or is nausea occurring at the end of the migraine?” she asked. “That’s always been kind of a conundrum for us.”
Whatever the case, she said, bariatric surgery appears to be helpful for patients with headache. Some studies have been small, but a 2021 analysis of 1,680 patients with migraine found that 55% experienced remission with no need for medication at 180 days post surgery. Women, older patients, and those taking more migraine medications were less likely to reach remission.
Research also suggests that bariatric surgery can relieve headache symptoms in patients with idiopathic intracranial hypertension.
Dr. McVige cautioned, however, that medical professionals must take special care when they talk to patients about their weight. “I’ve learned from conversations with my patients that they don’t like hearing ‘obese,’ or ‘fat,’ or ‘diet,’ or ‘losing weight.’ What they do like is ‘maybe we could try to find ways to be more healthy, to help your body to look the way that you would like it to look in the future. Let me help you. Maybe we can talk about nutrition. Maybe we can talk about exercise. Let’s talk about energy. Let’s talk about those types of things.’”
Unfortunately, there’s little research into how to have these conversations, Dr. McVige said. Still, “we need to be the first people to come forward and say, ‘This is a tough topic for me to talk about too. It makes me uncomfortable as well. I know you’re uncomfortable, but I have to talk to you because I care about you as a patient.’”
She also advised colleagues to not bring up weight right out of the gate. “It’s easier to say some of those things after you develop a relationship,” she said, “when they know you care about them.”
Dr. McVige reported multiple disclosures related to research funding and speaker fees.
AT AHS 2022
More Black mothers deliver by cesarean, not always by choice
When 29-year-old Sakeenah Fowler was pregnant with her first child, doctors kept a close watch. Ms. Fowler has lupus, high blood pressure, a history of blood clotting, and kidney problems that all could have endangered her or the health of her unborn baby.
She saw maternal-fetal specialists who could keep watch of her high-risk pregnancy, and she collected urine samples every 24 hours to make sure her kidneys were functioning properly from her home in Roebuck, S.C.
But the pregnancy ultimately proved uneventful; even her kidneys remained stable. So Ms. Fowler said she was shocked when her doctors ordered an emergency cesarean delivery after she had gone into active labor.
“I was already dilated all the way to 6 cm,” but the baby’s heart rate had decreased by a small amount, she says. “They thought it was best to just go ahead with a C-section.”
Ms. Fowler, who is Black, said she believes the surgical intervention was unnecessary and that she wasn’t given a chance to discuss her options for a vaginal childbirth.
“They already had it in their minds that I wasn’t going to make it through the pregnancy without any issues; then when I did, it was like they wanted to find something that made me have to have a C-section,” Ms. Fowler said. “It was close to the holidays; everybody was ready to go home. It was just like I was pushed to do what they wanted me to do.”
Ms. Fowler’s sense of a lack of choice is important beyond the measure of patient experience. While cesarean deliveries can be a lifeline for mother and baby, they can put up massive roadblocks to maternal and infant health when not necessary.
“The risk of hemorrhage, infection – on average, all of these go up when you have surgery instead of a vaginal delivery,” says Kimberly B. Glazer, PhD, a perinatal epidemiologist at the Icahn School of Medicine at Mount Sinai, New York.
“Birth is one of the most salient experiences you can have. People want to feel like their values and preferences – whatever they may be – were honored and respected. Even if the delivery goes a different way than you wanted, feeling like your values were taken into account is very important.”
More than 1 million women undergo cesarean deliveries in the United States every year, composing over 31% of all births in 2020, according to the Centers for Disease Control and Prevention.
The World Health Organization, meanwhile, recommends a rate of cesarean delivery of no more than 15% per region. Whether or not all the U.S. procedures were medically warranted is unclear, however.
Black women have higher odds of undergoing a cesarean: 36% undergo surgical deliveries annually, compared with about 30% of White women. Black women are also about three times more likely to die of pregnancy-related causes than White women.
Risk becomes reality
Ms. Fowler eventually developed an infection in her cesarean surgical wound, but her doctors initially insisted her alternating chills and fever were merely postpartum hormonal swings, she says.
“I thought something had to be wrong, but they just kept saying nothing was wrong,” she says.
By the time her doctors caught the infection, Ms. Fowler was readmitted to the hospital for several days of IV antibiotic therapy. The infection “almost got into my bloodstream and could have killed me,” she says.
While cesarean deliveries are associated with decreases in maternal, neonatal, and infant mortality, the benefits are only seen up to a certain threshold. The WHO, for instance, has reported that over the 15% threshold, that lower mortality benefit disappears.
“When medically necessary, cesarean delivery can improve outcomes for mother and baby. But the fact that cesarean section rates have increased in recent years without a corresponding improvement in health outcomes indicates overreliance on the procedure,” Dr. Glazer says.
Clinical discretion leads to biased judgment calls
Rates of cesarean deliveries are even higher among low-risk pregnancies in women of color than in White women. Between 2016 and 2019, the overall rate of cesarean deliveries for low-risk births was 23%, according to a recent analysis. But the rate was almost 18% higher among Black women than among White women (27% vs. 22%).
“When you see data about these subjective indications varying by race and ethnicity, I think that’s pointing us toward some answers,” Dr. Glazer says. “Once you adjust for all these measures, prepregnancy characteristics, and risk factors, the research identifies variation in quality and outcomes that is rooted in structural and systemic racism in health care, implicit bias from clinicians.”
Researchers investigating cesarean deliveries have found that Black women are more likely to undergo the surgery for reasons that are highly subjective, such as fetal distress.
“There is a huge range of how concerning a fetal heart rate can be, and some health providers might perform a C-section for only minor changes in the fetal heart rate, while others might wait until it is much worse,” said Rebecca Hamm, MD, an assistant professor of obstetrics and gynecology at the Perelman School of Medicine at the University of Pennsylvania.
At least some of the differences in care can be explained by where women deliver their babies, studies have shown. Women of color disproportionately deliver at hospitals with poorer quality outcomes for moms and babies.
Dealing with the aftermath
There can be costs that reverberate throughout the life of a mother, child, and their family as the result of surgical delivery.
“Cesarean sections cost a lot more,” says Jamila Taylor, PhD, director of health care reform and a senior fellow with The Century Foundation, a progressive policy think tank in Washington, D.C. The cost of a cesarean delivery averages about $17,000, compared with about $12,200 for a vaginal birth; for uninsured patients, surgical deliveries cost about $9,000 more than vaginal deliveries.
Dr. Taylor, who has studied the historical mistreatment of Black women in obstetrics, noted that this cost includes not just the bill for surgery but also a prolonged recovery time that is often spent in a hospital bed.
Beyond the detrimental effect that a large hospital bill for delivery and aftercare can have on families, other costs can crop up later. Infants delivered by cesarean surgery are more likely to develop an infection, breathing problems, and to spend time in the neonatal intensive care unit than babies born vaginally. Although studies suggest these outcomes may result from a medically necessary health concern that spurred the cesarean surgery, they often stem from the delivery itself.
Babies born surgically also miss out on the benefits of passing through the birth canal, such as supporting a newborn’s immune system and preparing their lungs to breathe oxygen after birth.
Most of the efforts to reduce inequities in maternal care are happening at the clinical level, aimed at both patients and providers, Dr. Taylor says.
“As advocates, we’re talking about how we can help Black women be advocates for themselves in the health care system – if the physician suggests a C-section, getting a second opinion, or walking through what a [surgical delivery] will mean and what their recovery will look like,” she says.
Women are also increasingly choosing non-hospital settings to deliver when possible, Dr. Taylor says. Including doulas or midwife practitioners in the maternal care team can reduce unnecessary cesarean deliveries among Black women, according to Camille Clare, MD, chair of the New York chapter of the American College of Obstetricians and Gynecologists.
Also, last year, race was removed from the vaginal birth after C-section (VBAC) calculator, which is used to gauge the safety of vaginal delivery in women with a history of surgical birth. The original calculator included race-based correction factors for Black women and Hispanic women. It predicted a lower likelihood of successful vaginal deliveries for women who already had a C-section and who identify as Black or Hispanic than for White women with otherwise identical characteristics, such as age, weight, and a history of cesarean delivery.
“Those are things that over time should reduce the high rates of cesarean section for Black women in particular,” Dr. Clare says.
In addition to embracing the updated calculator and including nurse-midwives and doulas in their obstetrics services, Penn Medicine, Philadelphia received a federal grant to study the impact of creating a standard plan for deliveries. This includes standardizing the induction of labor and any effect that might have on reducing C-section rates.
“This idea that biases lead to difference in decisionmaking, and that by standardizing practices we could address these differences – people were somewhat resistant at first,” Dr. Hamm says. “They didn’t believe there were differences in their practices.”
People struggle to recognize those differences, she says, and “it takes active participation in reducing disparities to make that happen.”
At the community level, Synergistic Sisters in Science (SIS), a group of maternal health experts and health equity advocates, is working on a project called PM3, to reduce maternal mortality through mobile technology.
The smartphone app will provide information for new moms to empower them to start conversations with health care providers. It also connects users to social support and resources. SIS is especially hoping to engage Black women living in rural areas.
“There is so much mistrust due to things like unnecessary C-sections and the fact that Black women feel they aren’t heard,” said Natalie Hernandez, PhD, executive director of the Center for Maternal Health Equity at Morehouse School of Medicine, Atlanta. “Here is a tool that gives a woman information that’s culturally centered, looks like her, and was informed by her voice.”
A version of this article first appeared on WebMD.com.
Food allergy test breakthrough: Less risk, more useful results
What would you do if you believed you had a serious health issue, but the best way to find out for sure might kill you?
That’s the reality for patients who wish to confirm or rule out a food allergy, says Sindy Tang, PhD, an associate professor of mechanical engineering at Stanford (Calif.) University.
And it’s the reason Dr. Tang and her colleagues are developing a food allergy test that’s not only safer, but also more reliable than today’s tests. In a paper in the journal Lab on a Chip, Dr. Tang and her colleagues outline the basis for this future test, which isolates a food allergy marker from the blood using a magnetic field.
How today’s food allergy tests fall short
The gold standard for food allergy diagnosis is something called the oral food challenge. That’s when the patient eats gradually increasing amounts of a problem food – say, peanuts – every 15 to 30 minutes to see if symptoms occur. This means highly allergic patients may risk anaphylaxis, an allergic reaction that causes inflammation so severe that breathing becomes restricted and blood pressure drops. Because of that, a clinical team must be at the ready with treatments like oxygen, epinephrine, or albuterol.
“The test is very accurate, but it’s also potentially unsafe and even fatal in rare cases,” Dr. Tang says. “That’s led to many sham tests advertised online that claim to use hair samples for food tests, but those are inaccurate and potentially dangerous, since they may give someone a false sense of confidence about a food they should avoid.”
Less risky tests are available, such as skin-prick tests – those involve scratching a small amount of the food into a patient’s arm – as well as blood tests that measure allergen-specific antibodies.
“Unfortunately, both of those are not that accurate and have high false-positive rates,” Dr. Tang says. “The best method is the oral food challenge, which many patients are afraid to do, not surprisingly.”
The future of food allergy testing: faster, safer, more reliable
In their study, the Stanford researchers focused on a type of white blood cell known as basophils, which release histamine when triggered by allergens. By using magnetic nanoparticles that bind to some blood cells but not basophils, they were able to separate basophils from the blood with a magnetic field in just 10 minutes.
Once isolated, the basophils are exposed to potential allergens. If they react, that’s a sign of an allergy.
Basophils have been isolated in labs before but not nearly this quickly and efficiently, Dr. Tang says.
“For true basophil activation, you need the blood to be fresh, which is challenging when you have to send it to a lab,” Dr. Tang says. “Being able to do this kind of test within a clinic or an in-house lab would be a big step forward.”
Next steps
While this represents a breakthrough in basophil activation testing, more research is needed to fully develop the system for clinical use. It must be standardized, automated, and miniaturized, the researchers say.
That said, the results give hope to those with food allergies that tomorrow’s gold-standard test will require only a blood sample without an emergency team standing by.
A version of this article first appeared on WebMD.com.
A unique care model for comorbid depression, PTSD
“We know there are strains on the mental health care system, and sometimes something as simple as getting to see a psychiatrist can be incredibly challenging,” coinvestigator Zachary Zuschlag, MD, staff psychiatrist at the James A. Haley Veterans’ Hospital and assistant professor at the University of South Florida, both in Tampa, said in an interview.
“So, a model that encourages primary care doctors, together with consultation from us [psychiatrists] to effectively treat these patients in a more proactive way, is very beneficial,” Dr. Zuschlag said.
The findings were presented at the American Society of Clinical Psychopharmacology annual meeting.
Common bedfellows
Dr. Zuschlag noted that comorbid PTSD and depression is common, but it is often considered too complex to be managed in a primary care setting.
Although treating these patients can be challenging, Dr. Zuschlag, who also heads his Veterans Administration facility’s antidepressant monitoring program (ADM), said that when he started the program for this patient population, he used “a much more inclusive model and welcomed these patients even if they had co-occurring issues.”
“Anecdotally, we had seen that our patients with [depression and] co-occurring PTSD appeared to be doing as well as their peers without PTSD, and we just wanted to look at it more systematically,” he added.
The ADM program is specifically designed for psychopharmacologic management of depression and anxiety in the primary care setting. It involves an interdisciplinary team of RN care managers, consulting psychiatrists, psychologists, and primary care physicians. Patients in primary care clinics deemed likely to benefit from psychiatric medications can be enrolled and followed in the program.
The program consists of structured, protocol-based telephone contacts from the RN care managers at scheduled intervals, usually every 3-4 weeks, said Dr. Zuschlag.
During calls, information is collected via evidence-based mental health symptomatic assessment scales. The consulting psychiatrists use this and other information to help guide treatment and coordinate with patients’ primary care physicians to adjust the treatment plan, including medication changes and additional psychotherapy.
To determine the program’s efficacy the investigators retrospectively reviewed all patients enrolled in the ADM program during its first 10 months. Of the 433 program participants, 112 (26%) were identified with active PTSD symptoms at baseline. Another 43 patients had a prior diagnosis of PTSD.
Program completion rates for the cohort with PTSD did not differ from that of the cohort without PTSD.
Overall, mean improvements in depression and anxiety symptoms were evidenced by changes in Patient Health Questionnaire-9 (PHQ-9) and Generalized Anxiety Disorder Assessment-7 (GAD-7) scores of 44% and 43%, respectively.
No differences in mean reduction in symptoms of depression were observed when comparing those with no history of PTSD with those with any history of PTSD (–6.16 vs. –5.42; P = .3244) or with those with active PTSD symptoms (–6.16 vs. –5.54; P = .4543).
Similarly, for anxiety, a mean reduction of –5.61 on the GAD-7 score was observed for the cohort without PTSD, compared with –4.99 in the cohort with any history of PTSD and –5.35 in the cohort with active PTSD symptoms. Again, these differences were nonsignificant.
Dr. Zuschlag noted that the VA setting is unique, with a lot of resources available to conduct such a program as ADM.
“Care management programs that are multidisciplinary are very effective and, in our experience, those who have completed the program do exceptionally well. The patients love it because there is a lot of contact between them and their various care providers,” he said.
A model for other settings?
Commenting on the study, Nagy A. Youssef, MD, PhD, professor of psychiatry and director of clinical research at Ohio State University, Columbus, called the results “interesting.”
“Treating patients with comorbid mild to moderate depression and current or past PTSD within the primary care setting using a care management program could be a model for other VA hospitals as well as in non-VA settings,” said Dr. Youssef, who was not part of the study.
Dr. Youssef noted that not only was there no difference in symptomatic improvement between the depression-plus-PTSD and depression-only groups, but program completion rates did not differ.
This further emphasizes “the potential utility of this approach in initial patient treatment, especially with limited mental health resources and the need to help more patients,” he said.
Dr. Zuschlag and Dr. Youssef report no relevant financial relationships.
A version of this article first appeared on Medscape.com.
FROM ASCP 2022
It’s hot outside – and that’s bad news for children’s health
Heat waves are getting hotter and becoming more frequent because of rising rates of air pollution, putting children’s health at risk, a wide-ranging new report finds.
An article in the New England Journal of Medicine reviews current research to take a sweeping inventory of how air pollution and climate change interact to adversely affect people’s health, especially that of kids. It examined the link between fossil fuel emissions and a variety of consequences of climate change – including extreme weather events; wildfires; vector-borne illnesses such as malaria, Zika, and Lyme disease; and heat waves, a topic at the forefront of many people’s minds.
This month, for example, record-high temperatures have been reported across the United States, affecting more than 100 million people and touching locations from the Gulf Coast to the Great Lakes, the Southwest, the mid-Atlantic, and the Midwest.
In Texas, Austin has already experienced an 8-day streak of temperatures above the 100° F mark in June, according to the Austin American-Statesman.
These patterns are an important reality to note, said Frederica Perera, DrPH, PhD, the article’s lead author. “My concern is that the threats are rising as temperature is rising,” Dr. Perera, a professor at Columbia University’s Mailman School of Public Health, New York, told KHN. “Temperatures are rising because greenhouse gas emissions are rising, and that’s a great concern for everyone’s health – but especially the most vulnerable.”
Children fit into this category, wrote Dr. Perera and her coauthor, Kari Nadeau, MD, PhD, Naddisy Foundation Endowed Professor of Medicine and Pediatrics at Stanford (Calif.) University, because their ability to regulate temperature, known as thermoregulation, is not fully developed.
They are also more susceptible to heat-related stress because they’re smaller and need to drink and eat more frequently to stay healthy, said Dr. Perera. But because “young children are dependent on parents to provide, sometimes their needs go ignored,” she said.
The authors noted that heat-related illness is “a leading and increasing cause of death and illness among student athletes” in the United States. In addition, they cited studies suggesting that “the heat associated with climate change” takes a toll on the mental health of children and adolescents, as well as their ability to learn.
The review article pointed to previous research. that associated in utero exposure to heat waves with “increased risks of preterm birth or low birth weight; hyperthermia and death among infants; and heat stress, kidney disease, and other illnesses” among kids.
“Being pregnant is very physiologically demanding in itself, and then heat places additional stress on a pregnant woman,” said Dr. Robert Dubrow, a professor of epidemiology at Yale’s School of Public Health, New Haven, Conn., who was not associated with either study. “And the fetus can experience heat stress as well, which could result in adverse birth outcomes.”
And these heat-related risks are across-the-board greater for “low-income communities and communities of color,” wrote the authors of the new article.
Carbon dioxide emissions from burning fossil fuels have risen sharply in the past 70 years, according to the article. “Modeling indicates that some heat waves would be extraordinarily unlikely to occur in the absence of climate change,” it says.
The authors briefly outline solutions that they describe as “climate and environmental strategies” that “should also be seen as essential public health policy.” Beyond big-picture efforts to mitigate fossil fuel and greenhouse gas emissions, they offered various ways to protect children – steps they term “adaptation measures” – which included providing clean water to children and families facing drought or water contamination and creating shaded areas where children play, live, and go to school.
Separately, Austin-based research highlighted why this step could be meaningful.
Researchers tracked the physical activity levels and location of students ages 8 to 10 during recess at three elementary schools in 2019. They compared children’s activity at recess during two weeks in September, the hottest full month during the school year, to a cooler week in November. “We wanted to understand the impact of outdoor temperatures on children’s play in schoolyard environments,” said Dr. Kevin Lanza, the study’s lead investigator, to inform the design of “future school-based interventions for physical activity in the face of climate change.”
During the hotter periods, he said, “children engaged in less physical activity and sought shade.”
As temperatures continue to rise, he said, schools must be flexible in making sure students are getting the daily exercise they need. “Schools should consider adding shade, either by planting trees or installing artificial structures that cover spaces intended for physical activity,” said Dr. Lanza, an assistant professor at UTHealth School of Public Health, Austin, Tex. He also noted that school policies could be updated so that recesses are scheduled during cooler times of the day and moved inside during periods of extreme heat.
But the overall need to protect kids from scorching weather patterns requires action beyond such steps, Dr. Perera said, and more climate and clean air policies must be enacted.
“Governments have the responsibility to protect the population and especially those most vulnerable, which especially includes children,” Dr. Perera said. “Action must be done immediately because we’re absolutely heading in the wrong direction.”
KHN (Kaiser Health News) is a national newsroom that produces in-depth journalism about health issues. Together with Policy Analysis and Polling, KHN is one of the three major operating programs at KFF (Kaiser Family Foundation). KFF is an endowed nonprofit organization providing information on health issues to the nation.
Can the ketogenic diet treat polycystic ovary syndrome?
MADRID – During the International Scientific Symposium “New Frontiers in Scientific Research” that recently took place in Barcelona, specialists analyzed the role of the very-low-calorie ketogenic diet. This analysis was in relation to three comorbidities that have a higher incidence among overweight and obese patients: polycystic ovary syndrome, nonalcoholic fatty liver disease, and type 2 diabetes. The experts’ aim? To analyze and update the latest evidence on the benefits of this dietary choice.
Polycystic ovary syndrome
Alessandra Gambineri, MD, PhD, associate professor at the department of medicine and surgery (DIMEC) at the University of Bologna, Italy, addressed the link between obesity and polycystic ovary syndrome, which she described as a chronic disease that affects about 10% of women of childbearing age and that presents diverse phenotypes with different characteristics.
“The pathophysiology of this syndrome is characterized by the interaction of three factors: androgen excess, adipose tissue dysfunction, and insulin resistance. These factors interact with each other and are expressed differently in each phenotype,” said Dr. Gambineri.
She indicated that adipose tissue dysfunction is central to this pathology. This centrality results from its association with secretions, such as free fatty acids, proinflammatory cytokines, certain adipokines that promote insulin resistance, glucocorticosteroids, androgens, and oxidative stress.
“Similarly, the oxidative stress that characterizes this syndrome is increasingly present in obese individuals,” said Dr. Gambineri. “This oxidative stress also produces ovary hypotoxicity that aggravates ovulatory function. In this context, the very-low-calorie ketogenic diet can be useful in several ways: weight reduction; promoting the loss of mainly visceral/abdominal fat; decreasing lipotoxicity; and improving inflammation, hyperinsulinemia, and insulin resistance.”
This was the path followed to carry out a study that aimed to analyze the effects of the very-low-calorie ketogenic diet on manifestations of polycystic ovary syndrome in the obesity phenotype. Dr. Gambineri presented its results.
“The objective was to compare the effects of a very-low-calorie ketogenic diet and the standard low-calorie (hypocaloric) diet as a control group,” she said. “The effects studied include body weight, insulin resistance, menstrual cycle, ovulation, ovarian morphology, and hyperandrogenism in a population of 30 obese women with polycystic ovary syndrome and insulin resistance.”
Study participants had a diagnosis of polycystic ovary syndrome as defined by the National Institutes of Health criteria and were aged 18-45 years. These women were randomly assigned to two groups of equal size: experimental (very-low-calorie ketogenic diet) and control (hypocaloric diet). “The women assigned to the experimental group followed the ketogenic stage for eight weeks and then moved to the second, low-calorie diet phase for an additional eight weeks, while those in the control group (hypocaloric diet) followed the low-calorie diet for all 16 weeks.”
The primary outcomes were changes in weight and body composition, specifically fat mass and lean mass, measured by bioimpedance. “The changes observed in the following aspects were considered secondary outcomes: abdominal fat distribution, metabolic parameters, ovulation, ovarian morphology, hirsutism, hyperandrogenism, psychological well-being, and psychological distress,” said Dr. Gambineri. “Any reduction in the ovarian stroma, the area where androgens are synthesized, was also analyzed.”
The study authors found that although BMI decreased in both groups, this reduction was greater in the group that followed the very-low-calorie ketogenic diet. Significant weight loss was observed in both groups, 12.4 kg versus 4.7 kg. Significant differences were also observed in waist circumference (−8.1% in the experimental group vs. −2.2% in the control group), fat mass (−15.1% vs. −8.5%), and free testosterone (−30.3% vs. +10.6%). Only the experimental group saw a reduction in insulin.
“A key point regarding hyperandrogenism, especially regarding what’s referred to as free testosterone, there was only a significant reduction in the very-low-calorie ketogenic diet group,” said Dr. Gambineri. “This reduction was especially evident in the first part of the study, coinciding with the ketogenic period. The reason for this effect lies in the significant increase in the concentration of sex hormone-binding globulins, SHB6. Said globulins bind to the testosterone present in female blood, producing a reduction in free testosterone, a very important effect considering that this syndrome is an androgenic disorder. Furthermore, current treatments for polycystic ovary syndrome do not reduce free testosterone as much as this dietary approach does.”
For the specialist, among all these positive effects in these patients, perhaps most important is the notable improvement that occurs in ovulation. “At the beginning of the study, only 38.5% of the participants in the experimental group and 14.3% of those in the control group had ovulatory cycles. After the intervention, 84.6% managed to ovulate, compared to 35.7% who achieved this goal in the other group.”
Dr. Gambineri suggested that this method is “valid for reducing fat mass and rapidly improving hyperandrogenism and ovulatory dysfunction in women with obesity and polycystic ovary syndrome.”
Reversing type 2 diabetes?
Daniela Sofrà, MD, an endocrinologist specializing in diabetology at La Source Clinic, Lausanne, Switzerland, reviewed the current evidence on the role of the very-low-calorie ketogenic diet in the management of type 2 diabetes.
“It’s time to rethink diabetes treatment and focus efforts on managing obesity as an associated factor,” she said. “One of the hypotheses being examined in this regard is the twin cycle, which postulates that type 2 diabetes is the result of excess fat in the liver. This in turn is associated with insulin resistance with pancreas dysfunction.”
Dr. Sofrà added that there is a study documenting for the first time the reversibility of the morphology of the diabetic pancreas after caloric restriction with the very-low-calorie ketogenic diet. “The reason for this effect is the use of visceral and intrahepatic fat, which can lead to the remission of the clinical manifestation of type 2 diabetes, understanding as such the definition made by the American Diabetes Association: glycosylated hemoglobin < 6.5% without pharmacological therapy.”
Specifically, the results of this research showed that after following the very-low-calorie ketogenic diet and achieving a 15% weight loss (mean weight loss of the participants), liver glucose levels returned to normal levels within 7 days. Beta cell function returned to near normal within 8 weeks.
“Subsequent studies have shown the durability of remission of type 2 diabetes, thanks to the reactivation of the insulin-secreting function of beta cells that had become dedifferentiated in the face of chronic nutrient excess. Specifically, 6 out of 10 patients maintained glycosylated hemoglobin < 6% after 6 months without the need for pharmacological therapy,” Dr. Sofrà added.
Likewise, she highlighted that the probability of achieving remission is mainly determined by the duration of the disease. “The years with diabetes are one of the main predictors of the response that the patient will have with this dietary intervention. Studies have shown that remission is possible in patients with diabetes for less than 6 years, although there are other projects that indicate that it can be achieved with up to 10 years’ duration.”
Based on these data, Dr. Sofrà emphasized the pleiotropic effects of the very-low-calorie ketogenic diet on glycemic control, favoring the possible remission of diabetes or the reduction of drugs, as well as the reduction of the HOMA-IR index (insulin resistance) and waist circumference in people with type 2 diabetes.
Nonalcoholic fatty liver disease
The third comorbidity of obesity that may benefit from the very-low-calorie ketogenic diet is hepatic steatosis, or nonalcoholic fatty liver disease, said Hardy Walle, MD, an internal medicine specialist and director/founder of the Bodymed center, Kirkel, Germany, and one of the authors of this research.
“Recent research shows that ectopic fat and nonalcoholic fatty liver disease could be considered a cause, or at least one of the causes, of most of the diseases that affect the population as a consequence of overweight and obesity,” said Dr. Walle. “Some authors have stated that without fatty liver, there is no type 2 diabetes.”
Dr. Walle pointed out that between 30% and 40% of the adult population has nonalcoholic fatty liver disease, a percentage that increases considerably in people with obesity, reaching 70% prevalence and increasing, in the case of type 2 diabetes, to almost 90%. “Even normal weight does not rule out fatty liver; in fact, about 15% of people with nonalcoholic fatty liver disease are not overweight.”
In a setting where there are no approved drugs for the treatment of fatty liver (the current standard approach focuses on lifestyle interventions), a short-term hypocaloric diet (or liver fasting) is considered an effective method for management of this pathology. This principle was demonstrated by a study by the Saarland University, Saarbrücken, Germany, that Dr. Walle used to illustrate this statement.
“The participants (60 patients with hepatic steatosis) followed a hypocaloric diet (less than 1,000 kcal/day) for 14 days with a formula rich in protein and fiber specially developed for the treatment of nonalcoholic fatty liver disease. A fibroscan was then performed with controlled attenuation parameter measurement to quantify fatty liver disease. The results showed not only a significant improvement in nonalcoholic fatty liver disease parameters but also a marked improvement in all relevant metabolic parameters (serum lipids, liver enzymes),” explained Dr. Walle.
“This evidence leads us to affirm that the concept of hepatic fasting (by means of a hypocaloric diet) marks a point of reference for a future treatment approach for nonalcoholic fatty liver disease,” he concluded.
The study that Dr. Gambineri presented was carried out with the collaboration of the Pronokal Group (Nestlé Health Science). Dr. Gambineri, Dr. Sofrà, and Dr. Walle disclosed no relevant financial relationships.
A version of this article first appeared on Medscape.com.
AMA: Insurance should cover treatment for infertility caused by gender-affirming care
CHICAGO – Health insurance should cover treatment for infertility caused by gender-affirming medical interventions, the American Medical Association said June 13 at its House of Delegates meeting.
Speaking on behalf of the Medical Student Section, Justin Magrath, of Louisiana, said, “We as a section feel that these interventions should be considered as additional causes of iatrogenic infertility and be covered by insurance.”
Iatrogenic infertility is infertility caused by surgery, radiotherapy, chemotherapy, or other medically necessary treatment. The AMA voted June 13 to support including the phrase, “impaired fertility as a consequence of gender-affirming hormone therapy and gender-affirming surgery,” in that definition.
The AMA also supports access to fertility preservation services for people who undergo those treatments.
“I’ve had many friends who went through transitions and gender-affirming care and had no idea that these options were available and others who did know they were available but they were so expensive that they couldn’t access them,” said emergency medicine resident Sophia Spadafore, MD, delegate for the Resident and Fellow Section. “So while people might be able to access gender-affirming care, sometimes they have to make the decision between future fertility and having children and accessing this kind of lifesaving care that we support.”
The AMA already had policies that support insurance coverage of treatments for gender dysphoria and the right to seek fertility preservation services for people who undergo gender-affirming hormone therapy or surgery, but until this week, it had not addressed insurance coverage for preserving fertility in those cases.
“The transgender population already faces many barriers to care, such as provider discrimination, legal concerns, financial burden, and emotional cost,” Mr. Magrath said during a reference committee hearing on June 11. “We as a section ask our organization to continue to serve as an ally, providing equitable care for diverse populations and expanding coverage for medically necessary treatments.”
“I am a gender surgeon, so this is pretty important to me,” said Sean Figy, MD, of Nebraska, a delegate for the American Society for Reconstructive Microsurgery.
The original resolution included the words “medically necessary” when referring to gender-affirming treatments, and Dr. Figy expressed hesitancy about those words. An amendment removed them.
“I’ve seen that phrase weaponized against gender-nonconforming patients,” he said.
Ophthalmologist Charles Hickey, MD, of the Ohio delegation, spoke in favor of referral or of waiting to adopt the resolution.
“I think the different amendments being discussed here are evidence that this needs a more thorough and careful treatment than we can do at this point right now,” he said.
A version of this article first appeared on Medscape.com.