User login
Review: Pitfalls in Using Central Venous Pressure as a Marker of Fluid Responsiveness
Case Scenario
A 69-year-old man was transported to the ED via emergency medical services after a family member discovered him alone at home and confused. His wife stated that her husband had been sick with the flu and had been febrile for the previous several days. The patient’s blood pressure taken on the scene by the emergency medical technician was 80/40 mm Hg, and 1 L normal saline was infused during transport. Upon arrival to the ED, his vital signs were: temperature, 103.3°F; heart rate,130 beats/minute; BP, 90/48 mm Hg; and respiratory rate, 24 breaths/minute. Oxygen saturation was 92% on nasal canula. An electrocardiogram showed sinus tachycardia with nonspecific changes.
Based on the patient’s symptoms, the emergency physician (EP) suspected sepsis and ordered the appropriate laboratory studies and radiographic images. During evaluation, the patient’s systolic BP decreased to 70 from 80 mm Hg, and the EP ordered another fluid bolus and considered assessing the patient’s volume status.
Introduction
There is a long-standing debate as to the most accurate method of determining the volume status of a critically ill patient, as well as the physiological ability to respond to fluid therapy. In the assessment of a critically ill patient receiving volume replacement, a wide variability of assessment options are available; however, the current literature has yet to determine which method is the best. This article reviews multiple approaches to estimating the intravascular volume status of critically ill patients and the use of modalities to determine a patient’s physiological response to fluid therapy.
Basic Physiology
Central venous pressure (CVP) is the pressure in the thoracic vena cava adjacent to the right atrium. The heart functions as a two-sided pump; the right side pumps volume at low pressure and the left side pumps against systemic arterial pressure. The major determinant of the filling pressure of the right ventricle (RV) at the end of diastole is CVP, which is affected by the initial stretching of the ventricles before contraction (preload).
Frank-Starling Mechanism
The Frank-Starling mechanism describes the relationship between cardiac performance and intravascular volume. Stroke volume increases in response to an increase in preload volume. The increased volume of blood stretches the ventricular wall, causing the cardiac muscle to contract more forcefully. The change in volume (∆V) of blood divided by the change in pressure (∆P) is termed compliance
(∆V/∆P).
The venous system is the major reservoir within the vascular system and is markedly more compliant than the arterial system. Thus, CVP will increase with a decrease in venous compliance and/or an increase in the venous volume. These relationships can be quite dynamic depending on the disease state.
History of CVP Monitoring
The resuscitation of hemodynamically unstable patients historically stressed the use of intravenous (IV) fluid boluses. However, measuring the efficacy of this approach has been difficult. This issue was first addressed in the 1960s and 1970s when clinicians began to use central venous catheters (CVCs) to measure CVP as a surrogate measure of right atrial volume, which had been interpreted as a measure of the amount of blood returning to the heart. However, CVP measurements were static measurements of a dynamic filtration, and derivation of cardiac output required a long and complex calculation. The Swan-Ganz pulmonary artery catheter was the first catheter that enabled continuous monitoring and allowed clinicians to obtain cardiac index calculations at the bedside.1
The CVP is an approximation of the right atrial pressure and is an indicator of RV preload, which is a major determinant of RV filling pressure. Both RV preload and RV filling pressure correlate with intravascular volume. Lower CVP may occur with vasodilation or hypovolemia, which decreases the volume returning to the right atrium. This volume depletion creates a need for fluid replacement.
To illustrate this point, picture the body’s blood supply contained within a 6-L expandable tank. Vasodilation may expand the tank to a 9-L capacity, with a 3-L volume deficit. Similarly, blood loss from the 6-L tank may drain 3-L from the tank, leaving a 3-L deficit. Both mechanisms may cause a 3-L deficit, with the tank partially empty. Although it might make sense to replace the loss or “fill the tank in both scenarios,” fluid replacement may have risks. Overly aggressive fluid resuscitation may cause multiorgan dysfunction such as pulmonary edema, abdominal compartment syndrome, altered mental status, dilutional anemia, or dilutional coagulopathy. However, suboptimal fluid treatment may cause inadequate resuscitation that may be complicated by persistent hypotension, hypoperfusion, and end-organ damage and failure.
Up until the 1980s, it was believed that maintenance of normal hemodynamic parameters was the key to resuscitation of critically ill patients. Shoemaker et al2,3 then published several papers about increasing patient survival by “supranormalizing” cardiac indices. They recommended increasing cardiac index, oxygen transport, and CVP to higher than normal. High-risk surgical patients had placement of a pulmonary artery catheter and were randomized into three groups: (1) normalization of CVP; (2) pulmonary artery catheter monitoring and normalization of CVP; or (3) a pulmonary artery catheter protocol based on increasing normal cardiac indices to supranormal values. The time to intervention was greater than 6 hours. The study demonstrated no mortality difference among the CVP and pulmonary artery control groups, but did demonstrate a significant mortality reduction in the pulmonary artery catheter protocol group where the hemodynamic markers were kept at values higher (supranormalization group) than normal.
Early Goal-Directed Therapy
The intervention time of 6 hours was questioned in a study by Rivers et al,4 who suggested this delay was too long. In this study, early goal-directed therapy (EGDT) was compared to standard therapy in the ED in severe sepsis and septic shock. A CVP catheter was used within the right atrium, and critically ill patients were randomized into the following two groups: (1) CVC with continuous central venous oxygen saturation (ScvO2) measurements; and (2) the standard therapy group which was treated at the clinician’s discretion according to standard ED care with the exception of placement of a CVC without ScvO2 monitoring. Both groups had targeted goals of CVP, 8 to 12 mm Hg; mean arterial pressure, greater than 65 mm Hg; and urine output, greater than 0.5 mL/kg/h. Both groups received an equal volume of crystalloid fluids, which exceeded the commonly given amount of fluid to patients. The EDGT group received 4981± 2984 mL compared to the standard group which received 3499 ± 2438 mL. The EGDT-targeted supranormalization of ScvO2 employs dobutamine to achieve a goal of ScvO2 level greater than 70% and uses transfusion to achieve hematocrit level greater than 30%. The study showed 21% overall reduction in mortality in the EGDT group. Aggressive care and early recognition of disease seemed critical to patient survival. The study supported the measurement of CVP as a guide in fluid resuscitation in protocol-driven therapy during the initial 6 hours for patients who had severe sepsis and septic shock.4 The 2012 Surviving Sepsis Campaign guidelines for the treatment of severe sepsis and septic shock recommend maintaining CVP at 8 to 12 mm Hg for nonventilated patients and higher for ventilated patients.5
Since the publication of the EGDT study,4 the use of protocolized “bundle” therapy as a guide for resuscitation in severe sepsis and septic shock has been brought into question. The debate begs to answer which intervention within the bundle (CVP, transfusions, ScvO2, serial lactate, blood transfusions) results in a mortality benefit.
Between 2014 and 2015, three trials were published with the goal of determining which bundle intervention of EGDT was important in decreasing mortality. These three randomized worldwide trials, the so-called “trilogy of EDGT,” were the Protocol-based Care for Early Septic Shock (PROCESS),6 Australasian Resuscitation in Sepsis Evaluation (ARISE),7 and Protocolised Management in Sepsis (ProMISe).8 The results of all three trials were consistent. From a population standpoint, if the comprehensive processes are in place for the early detection of sepsis, aggressive IV fluid administration, early antibiotic administration, and serial lactate measurement; the subsequent algorithm-driven EGDT (as defined by Rivers et al4), including continuous central venous oxygenation and CVP monitoring, did not lead to an improvement in outcomes. Patients in the usual care group received central-line and arterial-line placement at a much higher rate than expected.
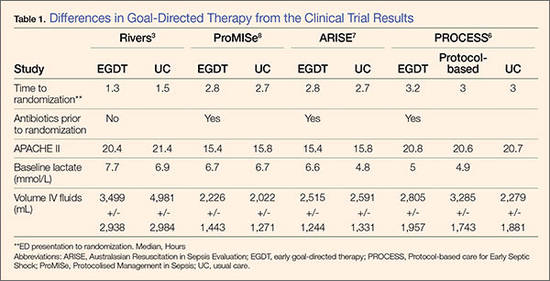
A number of potential reasons for differences in results from the original study by Rivers et al4 exist—eg, randomization occurred later, patients appeared to be less ill at baseline, all patients received antibiotics prior to randomization (Table 1). It is important to bear in mind that usual care, as defined in the “trilogy” may in fact not have been the “usual” care back in the mid-1990s when Rivers et al4 were conducting his EGDT. In addition, due to the influences of the original paper, the Surviving Sepsis Guidelines publications, improvement in EMS, critical care improvement, what Rivers et al4 termed usual care was really a modification of EDGT. One can, however, conclude from the trilogy is that placing a CVP or an ScvO2 catheter just for the purpose of chasing a CVP is no longer recommended.
Central Venous Pressure Measurement
A CVC must be placed in a sterile fashion with the tip of the catheter at the junction between the right atrium and superior vena cava. After the catheter has been properly secured and placement has been confirmed, a pressure transducer is connected from the most distal port of the CVC to the monitor. The use of CVP in the treatment of critically ill patients has logistical, mechanical, and placement issues that can complicate the clinical picture. Additionally, placement of a CVC is an invasive procedure with a set of complications that can compromise an already complex patient picture.9,10
The mechanical issues are numerous. The transducer is a water column that must be calibrated and set to zero at the level of the heart along the same plane of the right atrium (phlebostatic axis). The tip of the catheter inadvertently can be moved easily by health care workers, and a slight change in position may cause reading errors. The monitor must be recalibrated after the patient undergoes care by ancillary staff or is logrolled, moved, or repositioned in a way that affects the level of the heart. Some staff may not have adequate experience using the equipment. Misplacement of the catheter may cause erroneous and inaccurate measurements. The catheter tip must be in the right atrium, but using a catheter that is too long or short may have the catheter tip located in the superior vena cava, ventricle, or inferior vena cava (IVC). All these conditions will cause false reading of CVP.
Central Venous Pressure Interpretation
Normal CVP is 2 to 4 mm Hg, but interpretation of the value may vary. Low CVP typically indicates intravascular volume depletion and need for fluid replacement. However, caution is required with this approach. Depending on the cardiac compliance, some never have adequate volume with a low CVP and others with an elevated CVP may still augment cardiac output with additional fluid therapy (ie, a patient with hypertrophic Cardiomyopathy or advanced Pulmonary HTN).11,12
CVP as a trend may be more useful when compared to a single reading. Patients may vary on an individual basis, thereby making CVP a poor static marker. It should be used in the context of the patient’s clinical condition as it indicates the relationship between circulating blood volume and the capacity of the heart at a given time. As a trend, it is more sensitive to guide continued resuscitation efforts.13
Dynamic Techniques to Monitor Cardiac Output and Determine Fluid Responsiveness
Central venous pressure can be affected by anatomical and physiological factors such as valvular heart disease, right heart failure, poor lung compliance, or arrhythmias. In 2008, Marik et al14 performed a systematic review of 24 studies reviewing the benefits of CVP in the management of fluid therapy. In 2013, Marik et al14,15 repeated the meta-analysis of the literature which included 43 articles, and again concluded that there were no data to support the use of CVP to guide fluid therapy, and both papers conluded that CVP should not be used for fluid resuscitation. Static measures of fluid responsiveness such as CVP may not be the most appropriate measures, and may be less accurate physiologically than dynamic measures.
Dynamic measurements based on the Frank-Starling principle use the changes in the venous return (preload) and stroke volume as a marker of fluid responsiveness and may be more useful. There are several dynamic methods to assess fluid responsiveness. The first such method is the measurement of right atrial pressure. In a case series of 33 medical and surgical intensive care unit (ICU) patients who had pulmonary artery catheters, it was hypothesized that right atrial pressure predicted the response to fluid pressure as right atrial pressure should not decrease during spontaneous inspiration in patients who had a heart that was not volume responsive. Patients were classified as having a positive response test when right atrial pressure decreased ≥1 mm Hg during inspiration, or a negative response when right atrial pressure decreased <1 mm Hg. A positive response correlated with cardiac output increase of 250 mL/h.16
Evaluation of Pulse Pressure and Stroke Volume Variation
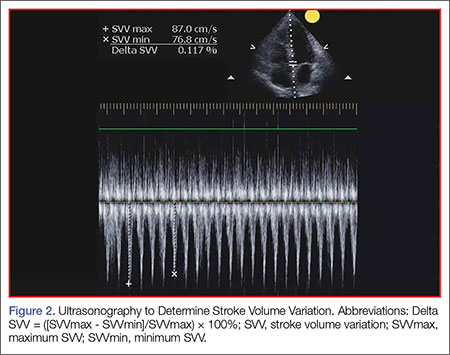
Pulse pressure variation (PPV), stroke volume variation (SVV), and variation of the amplitude of pulse oximeter plethysmographic waveform are highly predictive of fluid responsiveness in mechanically ventilated patients who have septic or hemorrhagic shock.17,18 The PPV is derived from the analysis of the arterial waveform, and SVV is derived from pulse contour analysis. The PPV uses the physiologic changes that occur during positive pressure ventilation. The delivery of a mechanical breath increases pleural pressure on inspiration, causing the following: (1) a decrease in RV preload because of decreased venous return; and (2) increase in RV afterload because of increased transpulmonary pressure. These changes lead to decreased RV stroke volume, which is at a minimal level at the end of inspiration. The inspiration reduction in RV ejection leads to a decrease in LV filling after a phase lag of two to three heart beats because of long pulmonary transit time. Thus, the LV preload reduction may induce a decrease in LV stroke volume, which is at its minimum volume during the inspiratory period of mechanical ventilation.18 The variation between the RV and LV stroke volume are greatest when the ventricles operate on the steep part of the Frank-Starling curve (rather than the flat portion). The PPV is calculated as the difference between maximum and minimum pulse pressures divided by the average of their sum, and multiplied by 100%. A variation in PPV of greater than 13% is highly predictive of volume responsiveness.19 The use of PPV is feasible in the ED because the only requirements include arterial access, measurement of the minimum and maximum pulse pressures during 30 seconds, and performance of the calculation. The PPV has been validated in different patient populations. However, the use of PPV is limited to a conventional volume control mode of ventilation and restricted to tidal volumes (TVs) over 7 mL/kg, this method of measurement was validated in patients receiving tidal volumes of at least 8 cc/kg ideal body weight—which may be higher than seen in contemporary clinical practice with more restrictive TV, ventilation strategies in patients with acute respiratory distress syndrome.20 Furthermore, patients must be ventilated passively, with heavy sedation or chemical paralysis to prevent spontaneous breathing. They must also have a normal heart rhythm. Most acute lung injury states are managed with lung protective strategy with TV of 4 to 6 mL/kg, PPV values obtained using lower TVs are less reliable and their use is not recommended.20-22
The Pleth Variation Index (PVI) is similar to PPV but is an automated measure of the dynamic change in the perfusion index that occurs during a respiratory cycle. Perfusion index is the ratio of nonpulsatile to pulsatile blood flow through the peripheral bed, measured noninvasively with a pulse oximeter probe. The PVI can predict positive fluid response in mechanically ventilated patients. However, PVI has the same limitations as PPV, the patient must be in sinus rhythm, and PVI cannot be used in patients who are breathing spontaneously.23
Ultrasonographic Assessment
Bedside ultrasonography is noninvasive, can be performed rapidly, and provides real-time clinically relevant data. There is much evidence that ultrasonography is effective in evaluating hemodynamic and volume status, and it may be used to assess fluid responsiveness during resuscitation. 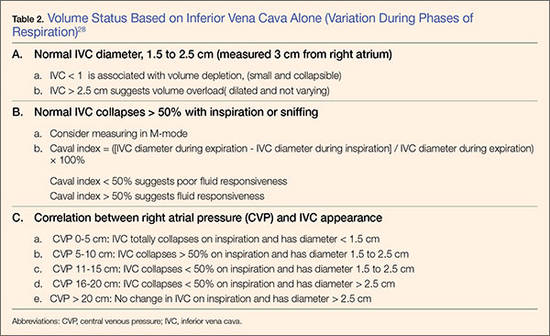
As there is growing awareness of sepsis and fluid resuscitation, IVC measurements have grown in popularity as a noninvasive approach for such monitoring.24 IVC collapsibility in spontaneously breathing patients and caval index in mechanically ventilated patients can be determined rapidly at the bedside. There are two views that most easily allow access to measure the IVC: subxyphoid and right upper quadrant. Using the phased array probe or a curvilinear probe, the IVC can be seen traversing through the liver with the hepatic vein joining the IVC just before the diaphragm and emptying into the right atrium. Interrater reliability is often questioned when ultrasound is used. However, Fields et al25 were able to show that there was a high degree of interrater reliability among EPs when measuring IVC collapsibility.
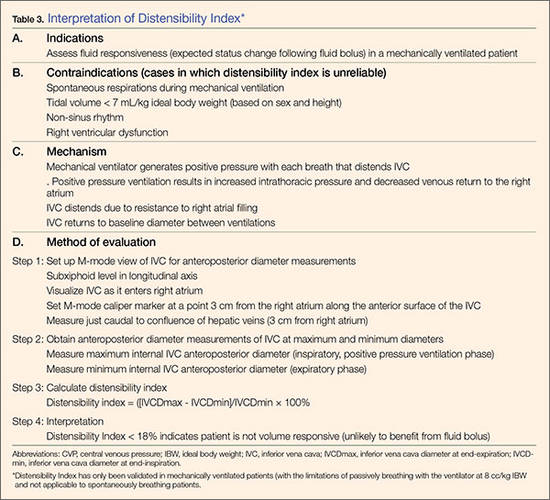
A systematic review by Zhang et al,26 showed change in IVC measured with point-of-care ultrasonography can reliably predict fluid responsiveness, particularly in patients that are mechanically ventilated. A caval index of 0.72 corresponds to CVP less than 7 cm water; a caval index of 1.23 corresponds to CVP 8 to 12 cm water; and a caval index of 1.59 corresponds to CVP greater than 13 cm water. The distensibility index is similar and calculated based on the IVC diameter at end-expiration (IVCDmax) and end-inspiration (IVCDmin).27 The ratio of (IVCDmax - IVCDmin)/IVCDmin is expressed as a percentage (dIVC%) in mechanically ventilated patients. A distensibility index less than 18% may indicate that the patient is not volume responsive (Tables 2 and 3; Figure 1).

Caval Index
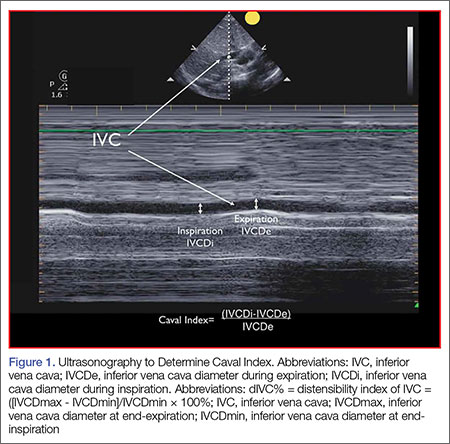
A more widely utilized method for IVC evaluation is described by Nagdev et al.29 The caval index is calculated as the relative decrease in inferior vena cava diameter during one respiratory cycle. A caval index greater than or equal to 50% is strongly associated with a low CVP with 91% sensitivity and 94% specificity.29 It is important to remember, however, that IVC collapsibility is only useful at the extremes. Nevertheless, IVC measurement is limited by increased PEEP, increased TV, and increased intraabdominal pressure.
While IVC is the most commonly used vessel for sonographic volume status assessment, other vessels can also be used. Kent et al30 describe using the internal jugular vein as well as the femoral vein. Guarracino et al31 achieved similar results when using the internal jugular vein for distensibility index for assessing fluid responsiveness. When compared to the invasive CVP measurements, new CVP quantification methods could be used as a reliable approach for monitoring hemodynamic status.
Stroke Volume Variation
While not used regularly in the ED, respiratory changes in aortic blood velocity as measured by transesophageal echocardiography (TEE) may predict fluid responsiveness in mechanically ventilated patients.34 Peak aortic blood flow velocity variation is measured by TEE. Similarly, ventilator-induced variation in descending aortic blood flow measured by esophageal Doppler monitoring may predict fluid responsiveness.34 However peak aortic blood flow velocity measurements determined by TEE may have limited utility because TEE is an invasive procedure. Similarly, esophageal Doppler monitors can be used but are limited because of low predictive value and rare usage in the emergency setting.35
Passive Leg Raise
In spontaneously breathing patients, passive leg raising (PLR) has been studied as a substitute for volume challenge due to the ease of performing PLR at the bedside and absence of adverse events such as volume overload. When performing PLR, the patient starts in a semirecumbent position and is repositioned supine with the legs raised to 45°. Blood transferred to the heart during PLR increases cardiac preload and tests preload responsiveness. The maximum hemodynamic response to PLR occurs within one minute of performing the maneuver.36 The effects of PLR are assessed by the changes in cardiac output or stroke volume after PLR, which are extrapolated from aortic blood flow measured by esophageal Doppler, velocity time integral measured by transthoracic echocardiography, and femoral artery flow measured by arterial Doppler.36 These modalities may provide additional data points in the evaluation of fluid responsiveness but is out of the scope of this review.
Data in mechanically ventilated patients with esophageal Doppler and arterial access demonstrated that an increase in aortic blood flow by 10% with PLR predicted a positive fluid response with sensitivity 97% and specificity 94%.37 However, in the same study, the specificity in spontaneously breathing patients was markedly reduced (46%).37,38
Another study used a more conventional noninvasive measurement with transthoracic echocardiography to determine whether PLR could predict fluid responsiveness in hemodynamically unstable patients. In this study, a PLR-induced increase in stroke volume greater than or equal to 12.5% predicted an increase in stroke volume by greater than or equal to 15% after fluid administration with specificity 100% and sensitivity 77%.38 This study included patients on mechanical ventilation with active inspiration, patients without mechanical support, and patients with atrial fibrillation, enabling better generalization of results than previous studies.39
Bioreactance Technology
Cardiac output measurement using bioreactance technology is an alternative noninvasive method to measure cardiac output using only four surface electrodes. This technology is based on an analysis of relative phase shifts of an oscillating current that occurs when the current traverses the thoracic cavity. The bioreactance device (NICOM, Cheetah Medical, Tel Aviv, Israel) is comprised of a high frequency (75 kHz) sine wave generator and four dual electrode stickers that are used to establish electrical contact with the body. The cardiac output measured by bioreactance correlates well with values measured by thermodilution and pulse contour analysis.40 Performing PLR and determining its response using a bioreactance machine may be appropriate in the ED, in the ward, or at the initial presentation to the ICU because it is noninvasive and less labor intensive than other methods. In postoperative cardiac surgery patients, PLR-induced changes in cardiac output measured by bioreactance had sensitivity 88% and specificity 100%.40 In hemodynamically unstable patients, the results were more encouraging with a sensitivity of 94% and a specificity of 100% in predicting fluid responsiveness (defined as greater than10% increase in stroke volume index).41 However, in a group of critically ill patients (83% septic, 10% hypovolemic, and 7% cardiogenic), bioreactance coupled with PLR was unable to measure cardiac index compared with transpulmonary thermodilution, and bioreactance failed to predict fluid responsiveness.42 More research on bioreactance technology is needed, and its noninvasive evaluation of critically ill patients who need cardiac output monitoring and fluid therapy.
Conclusion
There are many tools available to estimate the volume status and fluid responsiveness of the critically ill patient. One of these tools, CVP measurement, must be used cautiously as an assessment of fluid responsiveness. It is important to understand the limitations of this technology. While other more advanced tools, such as ultrasonography to measure the IVC at the bedside and assess IVC variation or TEE to assess LV diastolic size and contractility during fluid resuscitation, may provide a better diagnostic picture, these tools/devices are not always available at most community hospitals.
The authors do not recommend placing a CVC simply to measure CVP; however, when a CVC or peripherally inserted central catheter is medically needed for treatment, the catheter can be used to trend CVP since the value of CVP is greatest as a trend to guide resuscitation. Other minimally invasive and noninvasive diagnostic tools currently are available, such as bedside ultrasound, and enable clinicians to assess volume responsiveness using dynamic procedures that challenge the Frank-Starling curve.4 These technologies have a useful place in resuscitation but each has its own limitations. With an understanding of the tools available, with their strengths and limitations, physicians can better individualize intravascular volume resuscitation.
Dr Farcy is the chairman of the department of emergency medicine, medical director of intensivists at Mount Sinai Medical Center, Miami Beach, Florida; and clinical assistant professor, Florida International University Medical School, Miami, Florida. Dr Jain is an assistant professor, director of critical care ultrasound, department of emergency medicine at the SUNY Downstate Medical Center, Kings County Hospital Center, Brooklyn, New York. Dr Dalley is the emergency-medicine residency program director at Mount Sinai Medical Center, Miami Beach, Florida.
Dr Scalea holds the Francis X. Kelly professorship in trauma surgery, is the distinguished professor in trauma, and director, program in trauma at the University of Maryland School of Medicine, Baltimore; he is also the physician in chief, shock trauma center, and system chief for critical care services at the University of Maryland Medical System, Baltimore.
- Pitfalls in Using Central Venous Pressure as a Marker of Fluid Responsiveness
- Chatterjee K. The Swan-Ganz catheters: past, present, and future. A viewpoint. Circulation. 2009;119(1):147-52.
- Shoemaker WC, Appel PL, Waxman K, Schwartz S, Chang P. Clinical trial of survivors’ cardiorespiratory patterns as therapeutic goals in critically ill postoperative patients. Crit Care Med. 1982;10(6):398-403.
- Shoemaker WC, Appel PL, Kram HB, Waxman K, Lee TS. Prospective trial of supranormal values of survivors as therapeutic goals in high-risk surgical patients. Chest. 1988;94(6):1176-1186.
- Rivers E, Nguyen B, Havstad S, et al; Goal-Directed Therapy Collaborative Group. Early goal-directed therapy in the treatment of severe sepsis and septic shock. N Engl J Med. 2001;345(19):1368-1377.
- Dellinger RP, Levy MM, Carlet JM, et al; International Surviving Sepsis Campaign Guidelines Committee; American Association of Critical-Care Nurses, American College of Chest Physicians, et al. Surviving Sepsis Campaign: international guidelines for management of severe sepsis and septic shock: 2008. Crit Care Med. 2008;36(1):296-327.
- ProCESS Investigators, Yealy DM, Kellum JA, Huang DT, et al. A randomized trial of Protocol-based care for Early Septic Shock. N Engl J Med. 2014;370(18):1683-1693.
- Peake SL, Delaney A, Bellomo R; ARISE Investigators. Goal-directed resuscitation in septic shock. N Engl J Med. 2015; 372(2):190-191.
- Mouncey PR, Osborn TM, Power GS, et al; ProMISe Trial Investigators. Trial of early, goal-directed resuscitation for septic shock. N Engl J Med. 2015;372(14):1301-1311.
- Akmal AH, Hasan M, Mariam A. The incidence of complications of central venous catheters at an intensive care unit. Ann Thorac Med. 2007;2(2):61–63.
- Ruesch S, Walder B, Tramèr MR. Complications of central venous catheters: internal jugular versus subclavian access—a systematic review. Crit Care Med. 2002;30(2):454–460.
- Magder S. How to use central venous pressure measurements. Curr Opin Crit Care. 2005;11(3):264-270.
- Bafaqeeh F, Magder S. CVP and volume responsiveness of cardiac output. Am J Respir Crit Care Med. 2004;169:A344.
- Schummer W. Central venous pressure. Validity, informative value and correct measurement [in German]. Anaesthesist. 2009;58(5):499-505.
- Marik PE, Baram M, Vahid B. Does the central venous pressure predict fluid responsiveness? A systematic review of the literature and the tale of seven mares. Chest. 2008;134(1):172-178.
- Marik PE, Cavallazzi R. Does the central venous pressure predict fluid responsiveness? An updated meta-analysis and a plea for some common sense. Crit Care Med. 2013;41(7):1774-1781.
- Magder S, Georgiadis G, Cheong T. Respiratory variations in right atrial pressure predict the response to fluid challenge. J Crit Care. 1992;7(2):76-85.
- Marik PE, Cavallazzi R, Vasu T, Hirani A. Dynamic changes in arterial waveform derived variables and fluid responsiveness in mechanically ventilated patients: a systematic review of the literature. Crit Care Med. 2009;37(9):2642-2647.
- Reuter DA, Kirchner A, Felbinger TW, et al. Usefulness of left ventricular stroke volume variation to assess fluid responsiveness in patients with reduced cardiac function. Crit Care Med. 2003;31(5):1399-1404.
- Perel A, Pizov R, Cotev S. Systolic blood pressure variation is a sensitive indicator of hypovolemia in ventilated dogs subjected to graded hemorrhage. Anesthesiology. 1987;67(4):498-502.
- De Backer D, Heenen S, Piagnerelli M, Koch M, Vincent JL. Pulse pressure variations to predict fluid responsiveness: influence of tidal volume. Intensive Care Med. 2005;31(4):517-523.
- Charron C, Fessenmeyer C, Cosson C, et al. The influence of tidal volume on the dynamic variables of fluid responsiveness in critically ill patients. Anesth Analg. 2006;102(5):1511-1517.
- Galas F, Hajjar L, Polastri T, et al. Passive leg raising predicts fluid responsiveness after cardiac surgery. Crit Care. 2008;12(suppl 2):P89
- Cannesson M, Desebbe O, Rosamel P, et al. Pleth variability index to monitor the respiratory variations in the pulse oximeter plethysmographic waveform amplitude and predict fluid responsiveness in the operating theatre. Br J Anaesth. 2008;101(2):200-206.
- Coen D, Cortellaro F, Pasini S, et al. Towards a less invasive approach to the early goal-directed treatment of septic shock in the ED. Am J Emerg Med. 2014;32(6):563-568.
- Fields JM, Lee PA, Jenq KY, Mark DG, Panebianco NL, Dean AJ. The interrater reliability of inferior vena cava ultrasound by bedside clinician sonographers in emergency department patients. Acad Emerg Med. 2011;18(1):98-101.
- Zhang Z, Xu X, Ye S, Xu L. Ultrasonographic measurement of the respiratory variation in the inferior vena cava diameter is predictive of fluid responsiveness in critically ill patients: systematic review and meta-analysis. Ultrasound Med Biol. 2014;40(5):845-853
- Sefidbakht S, Assadsangabi R, Abbasi HR, Nabavizadeh A. Sonographic measurement of the inferior vena cava as a predictor of shock in trauma patients. Emerg Radiol. 2007;14(3):181-185.
- Rudski LW, Lai WW, Afilalo J, et al. Guidelines of the echocardiographic assessment of the right heart in adults: a report from the American Society of Echocardiography endorsed by the European Association of Echocardiography a registered branch of the European Society of Cardiology, and the Canadian Society of Echocardiography. J Am Soc Echocardiogr. 2013;23(7):658-713.
- Nagdev AD, Merchant RC, Tirado-Gonzalez A, Sisson CA, Murphy MC. Emergency department bedside ultrasonographic measurement of the caval index for noninvasive determination of low central venous pressure. Ann Emerg Med. 2010;55(3):290-295.
- Kent A, Patil P, Davila V, et al. Sonographic evaluation of intravascular volume status: Can internal jugular or femoral vein collapsibility be used in the absence of IVC visualization? Ann Thorac Med. 2015;10(1):44-49.
- Guarracino F, Ferro B, Forfori F, Bertini P, Magliacano L, Pinsky MR. Jugular vein distensibility predicts fluid responsiveness in septic patients. Crit Care. 2014;18(6):647.
- Chin JH, Jun IG, Lee J, Seo H, Hwang GS, Kim YK. Can stroke volume variation be an alternative to central venous pressure in patients undergoing kidney transplantation? Transplant Proc. 2014;46(10):3363-3366.
- Zhang Z, Lu B, Sheng X, Jin N. Accuracy of stroke volume variation in predicting fluid responsiveness: a systematic review and meta-analysis. J Anesth. 2011;25(6):904-916.
- Feissel M, Michard F, Mangin I, Ruyer O, Faller JP, Teboul JL. Respiratory changes in aortic blood velocity as an indicator of fluid responsiveness in ventilated patients with septic shock. Chest. 2001;119(3):867-873.
- Davies SJ, Minhas S, Wilson RJ, Yates D, Howell SJ. Comparison of stroke volume and fluid responsiveness measurements in commonly used technologies for goal-directed therapy. J Clin Anesth. 2013;25(6):466-474.
- Marik PE, Monnet X, Teboul JL. Hemodynamic parameters to guide fluid therapy. Ann Intensive Care. 2011;1(1):1.
- Monnet X, Rienzo M, Osman D, et al. Esophageal Doppler monitoring predicts fluid responsiveness in critically ill ventilated patients. Intensive Care Med. 2005;31(9):1195-1201.
- Monnet X, Rienzo M, Osman D, et al. Passive leg raising predicts fluid responsiveness in the critically ill. Crit Care Med. 2006;34(5):1402-1407.
- Lamia B, Ochagavia A, Monnet X, Chemla D, Richard C, Teboul JL. Echocardiographic prediction of volume responsiveness in critically ill patients with spontaneously breathing activity. Intensive Care Med. 2007;33(7):1125-1132.
- Benomar B, Ouattara A, Estagnasie P, Brusset A, Squara P. Fluid responsiveness predicted by noninvasive bioreactance-based passive leg raise test. Intensive Care Med. 2010;36(11):1875-1881.
- Marik PE, Levitov A, Young A, Andrews L. The use of bioreactance and carotid Doppler to determine volume responsiveness and blood flow redistribution following passive leg raising in hemodynamically unstable patients. Chest. 2013;143(2):364-370.
- Kupersztych-Hagege E, Teboul JL, Artigas A, et al. Bioreactance is not reliable for estimating cardiac output and the effects of passive leg raising in critically ill patients. Br J Anaesth. 2013;111(6):961-966.
Case Scenario
A 69-year-old man was transported to the ED via emergency medical services after a family member discovered him alone at home and confused. His wife stated that her husband had been sick with the flu and had been febrile for the previous several days. The patient’s blood pressure taken on the scene by the emergency medical technician was 80/40 mm Hg, and 1 L normal saline was infused during transport. Upon arrival to the ED, his vital signs were: temperature, 103.3°F; heart rate,130 beats/minute; BP, 90/48 mm Hg; and respiratory rate, 24 breaths/minute. Oxygen saturation was 92% on nasal canula. An electrocardiogram showed sinus tachycardia with nonspecific changes.
Based on the patient’s symptoms, the emergency physician (EP) suspected sepsis and ordered the appropriate laboratory studies and radiographic images. During evaluation, the patient’s systolic BP decreased to 70 from 80 mm Hg, and the EP ordered another fluid bolus and considered assessing the patient’s volume status.
Introduction
There is a long-standing debate as to the most accurate method of determining the volume status of a critically ill patient, as well as the physiological ability to respond to fluid therapy. In the assessment of a critically ill patient receiving volume replacement, a wide variability of assessment options are available; however, the current literature has yet to determine which method is the best. This article reviews multiple approaches to estimating the intravascular volume status of critically ill patients and the use of modalities to determine a patient’s physiological response to fluid therapy.
Basic Physiology
Central venous pressure (CVP) is the pressure in the thoracic vena cava adjacent to the right atrium. The heart functions as a two-sided pump; the right side pumps volume at low pressure and the left side pumps against systemic arterial pressure. The major determinant of the filling pressure of the right ventricle (RV) at the end of diastole is CVP, which is affected by the initial stretching of the ventricles before contraction (preload).
Frank-Starling Mechanism
The Frank-Starling mechanism describes the relationship between cardiac performance and intravascular volume. Stroke volume increases in response to an increase in preload volume. The increased volume of blood stretches the ventricular wall, causing the cardiac muscle to contract more forcefully. The change in volume (∆V) of blood divided by the change in pressure (∆P) is termed compliance
(∆V/∆P).
The venous system is the major reservoir within the vascular system and is markedly more compliant than the arterial system. Thus, CVP will increase with a decrease in venous compliance and/or an increase in the venous volume. These relationships can be quite dynamic depending on the disease state.
History of CVP Monitoring
The resuscitation of hemodynamically unstable patients historically stressed the use of intravenous (IV) fluid boluses. However, measuring the efficacy of this approach has been difficult. This issue was first addressed in the 1960s and 1970s when clinicians began to use central venous catheters (CVCs) to measure CVP as a surrogate measure of right atrial volume, which had been interpreted as a measure of the amount of blood returning to the heart. However, CVP measurements were static measurements of a dynamic filtration, and derivation of cardiac output required a long and complex calculation. The Swan-Ganz pulmonary artery catheter was the first catheter that enabled continuous monitoring and allowed clinicians to obtain cardiac index calculations at the bedside.1
The CVP is an approximation of the right atrial pressure and is an indicator of RV preload, which is a major determinant of RV filling pressure. Both RV preload and RV filling pressure correlate with intravascular volume. Lower CVP may occur with vasodilation or hypovolemia, which decreases the volume returning to the right atrium. This volume depletion creates a need for fluid replacement.
To illustrate this point, picture the body’s blood supply contained within a 6-L expandable tank. Vasodilation may expand the tank to a 9-L capacity, with a 3-L volume deficit. Similarly, blood loss from the 6-L tank may drain 3-L from the tank, leaving a 3-L deficit. Both mechanisms may cause a 3-L deficit, with the tank partially empty. Although it might make sense to replace the loss or “fill the tank in both scenarios,” fluid replacement may have risks. Overly aggressive fluid resuscitation may cause multiorgan dysfunction such as pulmonary edema, abdominal compartment syndrome, altered mental status, dilutional anemia, or dilutional coagulopathy. However, suboptimal fluid treatment may cause inadequate resuscitation that may be complicated by persistent hypotension, hypoperfusion, and end-organ damage and failure.
Up until the 1980s, it was believed that maintenance of normal hemodynamic parameters was the key to resuscitation of critically ill patients. Shoemaker et al2,3 then published several papers about increasing patient survival by “supranormalizing” cardiac indices. They recommended increasing cardiac index, oxygen transport, and CVP to higher than normal. High-risk surgical patients had placement of a pulmonary artery catheter and were randomized into three groups: (1) normalization of CVP; (2) pulmonary artery catheter monitoring and normalization of CVP; or (3) a pulmonary artery catheter protocol based on increasing normal cardiac indices to supranormal values. The time to intervention was greater than 6 hours. The study demonstrated no mortality difference among the CVP and pulmonary artery control groups, but did demonstrate a significant mortality reduction in the pulmonary artery catheter protocol group where the hemodynamic markers were kept at values higher (supranormalization group) than normal.
Early Goal-Directed Therapy
The intervention time of 6 hours was questioned in a study by Rivers et al,4 who suggested this delay was too long. In this study, early goal-directed therapy (EGDT) was compared to standard therapy in the ED in severe sepsis and septic shock. A CVP catheter was used within the right atrium, and critically ill patients were randomized into the following two groups: (1) CVC with continuous central venous oxygen saturation (ScvO2) measurements; and (2) the standard therapy group which was treated at the clinician’s discretion according to standard ED care with the exception of placement of a CVC without ScvO2 monitoring. Both groups had targeted goals of CVP, 8 to 12 mm Hg; mean arterial pressure, greater than 65 mm Hg; and urine output, greater than 0.5 mL/kg/h. Both groups received an equal volume of crystalloid fluids, which exceeded the commonly given amount of fluid to patients. The EDGT group received 4981± 2984 mL compared to the standard group which received 3499 ± 2438 mL. The EGDT-targeted supranormalization of ScvO2 employs dobutamine to achieve a goal of ScvO2 level greater than 70% and uses transfusion to achieve hematocrit level greater than 30%. The study showed 21% overall reduction in mortality in the EGDT group. Aggressive care and early recognition of disease seemed critical to patient survival. The study supported the measurement of CVP as a guide in fluid resuscitation in protocol-driven therapy during the initial 6 hours for patients who had severe sepsis and septic shock.4 The 2012 Surviving Sepsis Campaign guidelines for the treatment of severe sepsis and septic shock recommend maintaining CVP at 8 to 12 mm Hg for nonventilated patients and higher for ventilated patients.5
Since the publication of the EGDT study,4 the use of protocolized “bundle” therapy as a guide for resuscitation in severe sepsis and septic shock has been brought into question. The debate begs to answer which intervention within the bundle (CVP, transfusions, ScvO2, serial lactate, blood transfusions) results in a mortality benefit.
Between 2014 and 2015, three trials were published with the goal of determining which bundle intervention of EGDT was important in decreasing mortality. These three randomized worldwide trials, the so-called “trilogy of EDGT,” were the Protocol-based Care for Early Septic Shock (PROCESS),6 Australasian Resuscitation in Sepsis Evaluation (ARISE),7 and Protocolised Management in Sepsis (ProMISe).8 The results of all three trials were consistent. From a population standpoint, if the comprehensive processes are in place for the early detection of sepsis, aggressive IV fluid administration, early antibiotic administration, and serial lactate measurement; the subsequent algorithm-driven EGDT (as defined by Rivers et al4), including continuous central venous oxygenation and CVP monitoring, did not lead to an improvement in outcomes. Patients in the usual care group received central-line and arterial-line placement at a much higher rate than expected.
A number of potential reasons for differences in results from the original study by Rivers et al4 exist—eg, randomization occurred later, patients appeared to be less ill at baseline, all patients received antibiotics prior to randomization (Table 1). It is important to bear in mind that usual care, as defined in the “trilogy” may in fact not have been the “usual” care back in the mid-1990s when Rivers et al4 were conducting his EGDT. In addition, due to the influences of the original paper, the Surviving Sepsis Guidelines publications, improvement in EMS, critical care improvement, what Rivers et al4 termed usual care was really a modification of EDGT. One can, however, conclude from the trilogy is that placing a CVP or an ScvO2 catheter just for the purpose of chasing a CVP is no longer recommended.
Central Venous Pressure Measurement
A CVC must be placed in a sterile fashion with the tip of the catheter at the junction between the right atrium and superior vena cava. After the catheter has been properly secured and placement has been confirmed, a pressure transducer is connected from the most distal port of the CVC to the monitor. The use of CVP in the treatment of critically ill patients has logistical, mechanical, and placement issues that can complicate the clinical picture. Additionally, placement of a CVC is an invasive procedure with a set of complications that can compromise an already complex patient picture.9,10
The mechanical issues are numerous. The transducer is a water column that must be calibrated and set to zero at the level of the heart along the same plane of the right atrium (phlebostatic axis). The tip of the catheter inadvertently can be moved easily by health care workers, and a slight change in position may cause reading errors. The monitor must be recalibrated after the patient undergoes care by ancillary staff or is logrolled, moved, or repositioned in a way that affects the level of the heart. Some staff may not have adequate experience using the equipment. Misplacement of the catheter may cause erroneous and inaccurate measurements. The catheter tip must be in the right atrium, but using a catheter that is too long or short may have the catheter tip located in the superior vena cava, ventricle, or inferior vena cava (IVC). All these conditions will cause false reading of CVP.
Central Venous Pressure Interpretation
Normal CVP is 2 to 4 mm Hg, but interpretation of the value may vary. Low CVP typically indicates intravascular volume depletion and need for fluid replacement. However, caution is required with this approach. Depending on the cardiac compliance, some never have adequate volume with a low CVP and others with an elevated CVP may still augment cardiac output with additional fluid therapy (ie, a patient with hypertrophic Cardiomyopathy or advanced Pulmonary HTN).11,12
CVP as a trend may be more useful when compared to a single reading. Patients may vary on an individual basis, thereby making CVP a poor static marker. It should be used in the context of the patient’s clinical condition as it indicates the relationship between circulating blood volume and the capacity of the heart at a given time. As a trend, it is more sensitive to guide continued resuscitation efforts.13
Dynamic Techniques to Monitor Cardiac Output and Determine Fluid Responsiveness
Central venous pressure can be affected by anatomical and physiological factors such as valvular heart disease, right heart failure, poor lung compliance, or arrhythmias. In 2008, Marik et al14 performed a systematic review of 24 studies reviewing the benefits of CVP in the management of fluid therapy. In 2013, Marik et al14,15 repeated the meta-analysis of the literature which included 43 articles, and again concluded that there were no data to support the use of CVP to guide fluid therapy, and both papers conluded that CVP should not be used for fluid resuscitation. Static measures of fluid responsiveness such as CVP may not be the most appropriate measures, and may be less accurate physiologically than dynamic measures.
Dynamic measurements based on the Frank-Starling principle use the changes in the venous return (preload) and stroke volume as a marker of fluid responsiveness and may be more useful. There are several dynamic methods to assess fluid responsiveness. The first such method is the measurement of right atrial pressure. In a case series of 33 medical and surgical intensive care unit (ICU) patients who had pulmonary artery catheters, it was hypothesized that right atrial pressure predicted the response to fluid pressure as right atrial pressure should not decrease during spontaneous inspiration in patients who had a heart that was not volume responsive. Patients were classified as having a positive response test when right atrial pressure decreased ≥1 mm Hg during inspiration, or a negative response when right atrial pressure decreased <1 mm Hg. A positive response correlated with cardiac output increase of 250 mL/h.16
Evaluation of Pulse Pressure and Stroke Volume Variation
Pulse pressure variation (PPV), stroke volume variation (SVV), and variation of the amplitude of pulse oximeter plethysmographic waveform are highly predictive of fluid responsiveness in mechanically ventilated patients who have septic or hemorrhagic shock.17,18 The PPV is derived from the analysis of the arterial waveform, and SVV is derived from pulse contour analysis. The PPV uses the physiologic changes that occur during positive pressure ventilation. The delivery of a mechanical breath increases pleural pressure on inspiration, causing the following: (1) a decrease in RV preload because of decreased venous return; and (2) increase in RV afterload because of increased transpulmonary pressure. These changes lead to decreased RV stroke volume, which is at a minimal level at the end of inspiration. The inspiration reduction in RV ejection leads to a decrease in LV filling after a phase lag of two to three heart beats because of long pulmonary transit time. Thus, the LV preload reduction may induce a decrease in LV stroke volume, which is at its minimum volume during the inspiratory period of mechanical ventilation.18 The variation between the RV and LV stroke volume are greatest when the ventricles operate on the steep part of the Frank-Starling curve (rather than the flat portion). The PPV is calculated as the difference between maximum and minimum pulse pressures divided by the average of their sum, and multiplied by 100%. A variation in PPV of greater than 13% is highly predictive of volume responsiveness.19 The use of PPV is feasible in the ED because the only requirements include arterial access, measurement of the minimum and maximum pulse pressures during 30 seconds, and performance of the calculation. The PPV has been validated in different patient populations. However, the use of PPV is limited to a conventional volume control mode of ventilation and restricted to tidal volumes (TVs) over 7 mL/kg, this method of measurement was validated in patients receiving tidal volumes of at least 8 cc/kg ideal body weight—which may be higher than seen in contemporary clinical practice with more restrictive TV, ventilation strategies in patients with acute respiratory distress syndrome.20 Furthermore, patients must be ventilated passively, with heavy sedation or chemical paralysis to prevent spontaneous breathing. They must also have a normal heart rhythm. Most acute lung injury states are managed with lung protective strategy with TV of 4 to 6 mL/kg, PPV values obtained using lower TVs are less reliable and their use is not recommended.20-22
The Pleth Variation Index (PVI) is similar to PPV but is an automated measure of the dynamic change in the perfusion index that occurs during a respiratory cycle. Perfusion index is the ratio of nonpulsatile to pulsatile blood flow through the peripheral bed, measured noninvasively with a pulse oximeter probe. The PVI can predict positive fluid response in mechanically ventilated patients. However, PVI has the same limitations as PPV, the patient must be in sinus rhythm, and PVI cannot be used in patients who are breathing spontaneously.23
Ultrasonographic Assessment
Bedside ultrasonography is noninvasive, can be performed rapidly, and provides real-time clinically relevant data. There is much evidence that ultrasonography is effective in evaluating hemodynamic and volume status, and it may be used to assess fluid responsiveness during resuscitation.
As there is growing awareness of sepsis and fluid resuscitation, IVC measurements have grown in popularity as a noninvasive approach for such monitoring.24 IVC collapsibility in spontaneously breathing patients and caval index in mechanically ventilated patients can be determined rapidly at the bedside. There are two views that most easily allow access to measure the IVC: subxyphoid and right upper quadrant. Using the phased array probe or a curvilinear probe, the IVC can be seen traversing through the liver with the hepatic vein joining the IVC just before the diaphragm and emptying into the right atrium. Interrater reliability is often questioned when ultrasound is used. However, Fields et al25 were able to show that there was a high degree of interrater reliability among EPs when measuring IVC collapsibility.
A systematic review by Zhang et al,26 showed change in IVC measured with point-of-care ultrasonography can reliably predict fluid responsiveness, particularly in patients that are mechanically ventilated. A caval index of 0.72 corresponds to CVP less than 7 cm water; a caval index of 1.23 corresponds to CVP 8 to 12 cm water; and a caval index of 1.59 corresponds to CVP greater than 13 cm water. The distensibility index is similar and calculated based on the IVC diameter at end-expiration (IVCDmax) and end-inspiration (IVCDmin).27 The ratio of (IVCDmax - IVCDmin)/IVCDmin is expressed as a percentage (dIVC%) in mechanically ventilated patients. A distensibility index less than 18% may indicate that the patient is not volume responsive (Tables 2 and 3; Figure 1).
Caval Index
A more widely utilized method for IVC evaluation is described by Nagdev et al.29 The caval index is calculated as the relative decrease in inferior vena cava diameter during one respiratory cycle. A caval index greater than or equal to 50% is strongly associated with a low CVP with 91% sensitivity and 94% specificity.29 It is important to remember, however, that IVC collapsibility is only useful at the extremes. Nevertheless, IVC measurement is limited by increased PEEP, increased TV, and increased intraabdominal pressure.
While IVC is the most commonly used vessel for sonographic volume status assessment, other vessels can also be used. Kent et al30 describe using the internal jugular vein as well as the femoral vein. Guarracino et al31 achieved similar results when using the internal jugular vein for distensibility index for assessing fluid responsiveness. When compared to the invasive CVP measurements, new CVP quantification methods could be used as a reliable approach for monitoring hemodynamic status.
Stroke Volume Variation
While not used regularly in the ED, respiratory changes in aortic blood velocity as measured by transesophageal echocardiography (TEE) may predict fluid responsiveness in mechanically ventilated patients.34 Peak aortic blood flow velocity variation is measured by TEE. Similarly, ventilator-induced variation in descending aortic blood flow measured by esophageal Doppler monitoring may predict fluid responsiveness.34 However peak aortic blood flow velocity measurements determined by TEE may have limited utility because TEE is an invasive procedure. Similarly, esophageal Doppler monitors can be used but are limited because of low predictive value and rare usage in the emergency setting.35
Passive Leg Raise
In spontaneously breathing patients, passive leg raising (PLR) has been studied as a substitute for volume challenge due to the ease of performing PLR at the bedside and absence of adverse events such as volume overload. When performing PLR, the patient starts in a semirecumbent position and is repositioned supine with the legs raised to 45°. Blood transferred to the heart during PLR increases cardiac preload and tests preload responsiveness. The maximum hemodynamic response to PLR occurs within one minute of performing the maneuver.36 The effects of PLR are assessed by the changes in cardiac output or stroke volume after PLR, which are extrapolated from aortic blood flow measured by esophageal Doppler, velocity time integral measured by transthoracic echocardiography, and femoral artery flow measured by arterial Doppler.36 These modalities may provide additional data points in the evaluation of fluid responsiveness but is out of the scope of this review.
Data in mechanically ventilated patients with esophageal Doppler and arterial access demonstrated that an increase in aortic blood flow by 10% with PLR predicted a positive fluid response with sensitivity 97% and specificity 94%.37 However, in the same study, the specificity in spontaneously breathing patients was markedly reduced (46%).37,38
Another study used a more conventional noninvasive measurement with transthoracic echocardiography to determine whether PLR could predict fluid responsiveness in hemodynamically unstable patients. In this study, a PLR-induced increase in stroke volume greater than or equal to 12.5% predicted an increase in stroke volume by greater than or equal to 15% after fluid administration with specificity 100% and sensitivity 77%.38 This study included patients on mechanical ventilation with active inspiration, patients without mechanical support, and patients with atrial fibrillation, enabling better generalization of results than previous studies.39
Bioreactance Technology
Cardiac output measurement using bioreactance technology is an alternative noninvasive method to measure cardiac output using only four surface electrodes. This technology is based on an analysis of relative phase shifts of an oscillating current that occurs when the current traverses the thoracic cavity. The bioreactance device (NICOM, Cheetah Medical, Tel Aviv, Israel) is comprised of a high frequency (75 kHz) sine wave generator and four dual electrode stickers that are used to establish electrical contact with the body. The cardiac output measured by bioreactance correlates well with values measured by thermodilution and pulse contour analysis.40 Performing PLR and determining its response using a bioreactance machine may be appropriate in the ED, in the ward, or at the initial presentation to the ICU because it is noninvasive and less labor intensive than other methods. In postoperative cardiac surgery patients, PLR-induced changes in cardiac output measured by bioreactance had sensitivity 88% and specificity 100%.40 In hemodynamically unstable patients, the results were more encouraging with a sensitivity of 94% and a specificity of 100% in predicting fluid responsiveness (defined as greater than10% increase in stroke volume index).41 However, in a group of critically ill patients (83% septic, 10% hypovolemic, and 7% cardiogenic), bioreactance coupled with PLR was unable to measure cardiac index compared with transpulmonary thermodilution, and bioreactance failed to predict fluid responsiveness.42 More research on bioreactance technology is needed, and its noninvasive evaluation of critically ill patients who need cardiac output monitoring and fluid therapy.
Conclusion
There are many tools available to estimate the volume status and fluid responsiveness of the critically ill patient. One of these tools, CVP measurement, must be used cautiously as an assessment of fluid responsiveness. It is important to understand the limitations of this technology. While other more advanced tools, such as ultrasonography to measure the IVC at the bedside and assess IVC variation or TEE to assess LV diastolic size and contractility during fluid resuscitation, may provide a better diagnostic picture, these tools/devices are not always available at most community hospitals.
The authors do not recommend placing a CVC simply to measure CVP; however, when a CVC or peripherally inserted central catheter is medically needed for treatment, the catheter can be used to trend CVP since the value of CVP is greatest as a trend to guide resuscitation. Other minimally invasive and noninvasive diagnostic tools currently are available, such as bedside ultrasound, and enable clinicians to assess volume responsiveness using dynamic procedures that challenge the Frank-Starling curve.4 These technologies have a useful place in resuscitation but each has its own limitations. With an understanding of the tools available, with their strengths and limitations, physicians can better individualize intravascular volume resuscitation.
Dr Farcy is the chairman of the department of emergency medicine, medical director of intensivists at Mount Sinai Medical Center, Miami Beach, Florida; and clinical assistant professor, Florida International University Medical School, Miami, Florida. Dr Jain is an assistant professor, director of critical care ultrasound, department of emergency medicine at the SUNY Downstate Medical Center, Kings County Hospital Center, Brooklyn, New York. Dr Dalley is the emergency-medicine residency program director at Mount Sinai Medical Center, Miami Beach, Florida.
Dr Scalea holds the Francis X. Kelly professorship in trauma surgery, is the distinguished professor in trauma, and director, program in trauma at the University of Maryland School of Medicine, Baltimore; he is also the physician in chief, shock trauma center, and system chief for critical care services at the University of Maryland Medical System, Baltimore.
- Pitfalls in Using Central Venous Pressure as a Marker of Fluid Responsiveness
- Chatterjee K. The Swan-Ganz catheters: past, present, and future. A viewpoint. Circulation. 2009;119(1):147-52.
- Shoemaker WC, Appel PL, Waxman K, Schwartz S, Chang P. Clinical trial of survivors’ cardiorespiratory patterns as therapeutic goals in critically ill postoperative patients. Crit Care Med. 1982;10(6):398-403.
- Shoemaker WC, Appel PL, Kram HB, Waxman K, Lee TS. Prospective trial of supranormal values of survivors as therapeutic goals in high-risk surgical patients. Chest. 1988;94(6):1176-1186.
- Rivers E, Nguyen B, Havstad S, et al; Goal-Directed Therapy Collaborative Group. Early goal-directed therapy in the treatment of severe sepsis and septic shock. N Engl J Med. 2001;345(19):1368-1377.
- Dellinger RP, Levy MM, Carlet JM, et al; International Surviving Sepsis Campaign Guidelines Committee; American Association of Critical-Care Nurses, American College of Chest Physicians, et al. Surviving Sepsis Campaign: international guidelines for management of severe sepsis and septic shock: 2008. Crit Care Med. 2008;36(1):296-327.
- ProCESS Investigators, Yealy DM, Kellum JA, Huang DT, et al. A randomized trial of Protocol-based care for Early Septic Shock. N Engl J Med. 2014;370(18):1683-1693.
- Peake SL, Delaney A, Bellomo R; ARISE Investigators. Goal-directed resuscitation in septic shock. N Engl J Med. 2015; 372(2):190-191.
- Mouncey PR, Osborn TM, Power GS, et al; ProMISe Trial Investigators. Trial of early, goal-directed resuscitation for septic shock. N Engl J Med. 2015;372(14):1301-1311.
- Akmal AH, Hasan M, Mariam A. The incidence of complications of central venous catheters at an intensive care unit. Ann Thorac Med. 2007;2(2):61–63.
- Ruesch S, Walder B, Tramèr MR. Complications of central venous catheters: internal jugular versus subclavian access—a systematic review. Crit Care Med. 2002;30(2):454–460.
- Magder S. How to use central venous pressure measurements. Curr Opin Crit Care. 2005;11(3):264-270.
- Bafaqeeh F, Magder S. CVP and volume responsiveness of cardiac output. Am J Respir Crit Care Med. 2004;169:A344.
- Schummer W. Central venous pressure. Validity, informative value and correct measurement [in German]. Anaesthesist. 2009;58(5):499-505.
- Marik PE, Baram M, Vahid B. Does the central venous pressure predict fluid responsiveness? A systematic review of the literature and the tale of seven mares. Chest. 2008;134(1):172-178.
- Marik PE, Cavallazzi R. Does the central venous pressure predict fluid responsiveness? An updated meta-analysis and a plea for some common sense. Crit Care Med. 2013;41(7):1774-1781.
- Magder S, Georgiadis G, Cheong T. Respiratory variations in right atrial pressure predict the response to fluid challenge. J Crit Care. 1992;7(2):76-85.
- Marik PE, Cavallazzi R, Vasu T, Hirani A. Dynamic changes in arterial waveform derived variables and fluid responsiveness in mechanically ventilated patients: a systematic review of the literature. Crit Care Med. 2009;37(9):2642-2647.
- Reuter DA, Kirchner A, Felbinger TW, et al. Usefulness of left ventricular stroke volume variation to assess fluid responsiveness in patients with reduced cardiac function. Crit Care Med. 2003;31(5):1399-1404.
- Perel A, Pizov R, Cotev S. Systolic blood pressure variation is a sensitive indicator of hypovolemia in ventilated dogs subjected to graded hemorrhage. Anesthesiology. 1987;67(4):498-502.
- De Backer D, Heenen S, Piagnerelli M, Koch M, Vincent JL. Pulse pressure variations to predict fluid responsiveness: influence of tidal volume. Intensive Care Med. 2005;31(4):517-523.
- Charron C, Fessenmeyer C, Cosson C, et al. The influence of tidal volume on the dynamic variables of fluid responsiveness in critically ill patients. Anesth Analg. 2006;102(5):1511-1517.
- Galas F, Hajjar L, Polastri T, et al. Passive leg raising predicts fluid responsiveness after cardiac surgery. Crit Care. 2008;12(suppl 2):P89
- Cannesson M, Desebbe O, Rosamel P, et al. Pleth variability index to monitor the respiratory variations in the pulse oximeter plethysmographic waveform amplitude and predict fluid responsiveness in the operating theatre. Br J Anaesth. 2008;101(2):200-206.
- Coen D, Cortellaro F, Pasini S, et al. Towards a less invasive approach to the early goal-directed treatment of septic shock in the ED. Am J Emerg Med. 2014;32(6):563-568.
- Fields JM, Lee PA, Jenq KY, Mark DG, Panebianco NL, Dean AJ. The interrater reliability of inferior vena cava ultrasound by bedside clinician sonographers in emergency department patients. Acad Emerg Med. 2011;18(1):98-101.
- Zhang Z, Xu X, Ye S, Xu L. Ultrasonographic measurement of the respiratory variation in the inferior vena cava diameter is predictive of fluid responsiveness in critically ill patients: systematic review and meta-analysis. Ultrasound Med Biol. 2014;40(5):845-853
- Sefidbakht S, Assadsangabi R, Abbasi HR, Nabavizadeh A. Sonographic measurement of the inferior vena cava as a predictor of shock in trauma patients. Emerg Radiol. 2007;14(3):181-185.
- Rudski LW, Lai WW, Afilalo J, et al. Guidelines of the echocardiographic assessment of the right heart in adults: a report from the American Society of Echocardiography endorsed by the European Association of Echocardiography a registered branch of the European Society of Cardiology, and the Canadian Society of Echocardiography. J Am Soc Echocardiogr. 2013;23(7):658-713.
- Nagdev AD, Merchant RC, Tirado-Gonzalez A, Sisson CA, Murphy MC. Emergency department bedside ultrasonographic measurement of the caval index for noninvasive determination of low central venous pressure. Ann Emerg Med. 2010;55(3):290-295.
- Kent A, Patil P, Davila V, et al. Sonographic evaluation of intravascular volume status: Can internal jugular or femoral vein collapsibility be used in the absence of IVC visualization? Ann Thorac Med. 2015;10(1):44-49.
- Guarracino F, Ferro B, Forfori F, Bertini P, Magliacano L, Pinsky MR. Jugular vein distensibility predicts fluid responsiveness in septic patients. Crit Care. 2014;18(6):647.
- Chin JH, Jun IG, Lee J, Seo H, Hwang GS, Kim YK. Can stroke volume variation be an alternative to central venous pressure in patients undergoing kidney transplantation? Transplant Proc. 2014;46(10):3363-3366.
- Zhang Z, Lu B, Sheng X, Jin N. Accuracy of stroke volume variation in predicting fluid responsiveness: a systematic review and meta-analysis. J Anesth. 2011;25(6):904-916.
- Feissel M, Michard F, Mangin I, Ruyer O, Faller JP, Teboul JL. Respiratory changes in aortic blood velocity as an indicator of fluid responsiveness in ventilated patients with septic shock. Chest. 2001;119(3):867-873.
- Davies SJ, Minhas S, Wilson RJ, Yates D, Howell SJ. Comparison of stroke volume and fluid responsiveness measurements in commonly used technologies for goal-directed therapy. J Clin Anesth. 2013;25(6):466-474.
- Marik PE, Monnet X, Teboul JL. Hemodynamic parameters to guide fluid therapy. Ann Intensive Care. 2011;1(1):1.
- Monnet X, Rienzo M, Osman D, et al. Esophageal Doppler monitoring predicts fluid responsiveness in critically ill ventilated patients. Intensive Care Med. 2005;31(9):1195-1201.
- Monnet X, Rienzo M, Osman D, et al. Passive leg raising predicts fluid responsiveness in the critically ill. Crit Care Med. 2006;34(5):1402-1407.
- Lamia B, Ochagavia A, Monnet X, Chemla D, Richard C, Teboul JL. Echocardiographic prediction of volume responsiveness in critically ill patients with spontaneously breathing activity. Intensive Care Med. 2007;33(7):1125-1132.
- Benomar B, Ouattara A, Estagnasie P, Brusset A, Squara P. Fluid responsiveness predicted by noninvasive bioreactance-based passive leg raise test. Intensive Care Med. 2010;36(11):1875-1881.
- Marik PE, Levitov A, Young A, Andrews L. The use of bioreactance and carotid Doppler to determine volume responsiveness and blood flow redistribution following passive leg raising in hemodynamically unstable patients. Chest. 2013;143(2):364-370.
- Kupersztych-Hagege E, Teboul JL, Artigas A, et al. Bioreactance is not reliable for estimating cardiac output and the effects of passive leg raising in critically ill patients. Br J Anaesth. 2013;111(6):961-966.
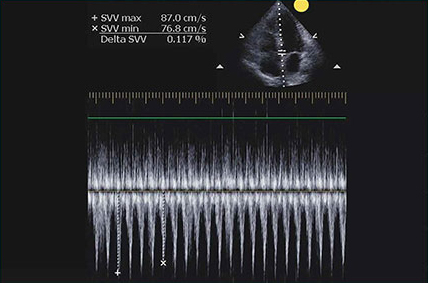
Case Report: Perianal Streptococcal Infection
Case
The mother of a 3-year-old boy presented her son to the ED for evaluation after she noticed peeling of the skin in his perianal region. She stated that the peeling had started 1 day prior to presentation. Two days earlier, the mother had brought the same patient to the ED for evaluation of a fever, sore throat, and a slight rash over his face. The boy’s vital signs at the initial presentation were: temperature, 101.8°F; heart rate, 102 beats/minute; and respiratory rate, 28 breaths/minute. Oxygen saturation was 98% on room air.
During this first visit, the mother denied the child having had any fever, chills, headache, sore throat, facial rash, joint pain, or pain on defecation. He had no significant medical history and no known drug allergies. After examination, a throat culture was taken, and the patient was given acetaminophen and discharged home with a diagnosis of viral syndrome.
At the second presentation, physical examination revealed a well-developed child in no distress. The examination was negative except for a 4 x 2 cm area of desquamation present over the perianal region (Figure).
The area of desquamation was dry, mildly erythematous without discharge, and nontender. The patient’s vital signs at this presentation were stable, and he was afebrile. The remaining physical examination findings were normal. The throat culture taken during the first ED presentation was reported as negative. A perianal swab was sent for culture and sensitivity. This was later reported to be positive for group A β-hemolytic streptococci (GABHS), which is sensitive to penicillin. The patient was discharged home in the care of his mother with a prescription of penicillin. A 10-day follow-up showed complete resolution of the skin rash.
Discussion
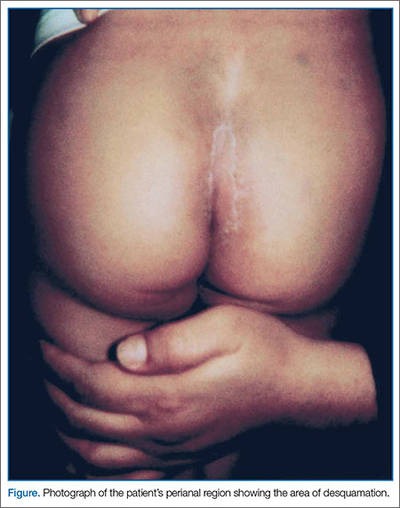
The rash in this case was most likely the result of scarlet fever with an unusual presentation of PSD; the signs and symptoms of which include perianal erythema, itching, rectal pain, sometimes blood-streaked stools, rectal bleeding, irritation or pruritus, tissue loss and exudation, secondary constipation, and cellulitis. Perianal streptococcal dermatitis has also been described in the adult literature.2 As with pediatric cases, PSD in adults is usually caused by GABHS.
Evaluation and Diagnosis
A rapid streptococcal test of suspicious areas can confirm the diagnosis. Fever, sore throat, and arthralgia are rare; however, culture from the perianal region grows GABHS. Titers are usually not elevated in laboratory evaluation. A routine skin culture is an alternative diagnostic aid.
Brilliant2 described the bright red color of PSD as a sharply demarcated rash that is caused by GABHS. As previously stated, symptoms include perianal rash, itching, and rectal pain; blood-streaked stools may also be seen in one-third of patients. It primarily occurs in children between 6 months and 10 years of age and is often misdiagnosed and treated inappropriately.3
Prompt diagnosis of GABHS is important. If untreated, it can cause serious systemic infections, especially in elderly and in newborn patients. Treatment with antibiotics resolves the condition in the majority of patients.2 In the acute stage, a white pseudomembrane may be present. As the rash becomes more chronic, the perianal eruption may consist of painful fissures, a dry mucoid discharge, or psoriasiform plaques. Perianal dermatitis can also be caused by Staphylococcus aureus or Candida. Confirmation of the diagnosis is accomplished by culturing a moderate-to-heavy growth of GABHS on 5% sheep-blood agar.
Treatment
A 10-day course of oral penicillin produces resolution of the dermatitis and other symptoms in most patients, but a relapse rate as high as 39% has been reported. Other treatment plans include amoxicillin, 40 mg/kg per day, divided into three doses, and/or topical applications of mupirocin 2% three times per day for 10 days. Penicillin, clindamycin phosphate, and erythromycin have also been used.
Although penicillin is generally recommended for treatment of GABHS infection, amoxicillin is often better tolerated in the pediatric population due to its superior palatability. Early antibiotic treatment causes a dramatic and rapid improvement of symptoms. However, according to Olson et al,4 PSD initially treated with amoxicillin or penicillin is consistently associated with a high risk of clinical recurrence. Whether treatment with a β-lactamase–resistant agent reduces this risk is uncertain.
Conclusion
This case represents an unusual presentation of scarlet fever manifesting as perianal dermatitis caused by GABHS. Although more common in the pediatric population, adult cases have been documented in the literature. As this case illustrates, early recognition and treatment with penicillin (or amoxicillin) produces rapid improvement and resolution of symptoms.
Dr Nibhanipudi is a professor of clinical emergency medicine at New York Medical College - Metropolitan Hospital Center, New York.
- Case Report: Perianal Streptococcal Infection
- Landolt M, Heininger U. Prevalence of perianal streptococcal dermatitis in children and adolescents [in German]. Praxis (Bern 1994). 2005;94(38):1467-1471.
- Kahlke V, Jongen J, Peleikis HG, Herbst RA. Perianal streptococcal dermatitis in adults: its association with pruritic anorectal diseases is mainly caused by group B Streptococci. Colorectal Dis. 2013;15(5):602-607.
- Brilliant LC. Perianal streptococcal dermatitis. Am Fam Physician. 2000;61(2):391-393.
- Olson D, Edmonson MB. Outcomes in children treated for perineal group A beta-hemolytic streptococcal dermatitis. Pediatr Infect Dis J. 2011;30(11):933-936.
Case
The mother of a 3-year-old boy presented her son to the ED for evaluation after she noticed peeling of the skin in his perianal region. She stated that the peeling had started 1 day prior to presentation. Two days earlier, the mother had brought the same patient to the ED for evaluation of a fever, sore throat, and a slight rash over his face. The boy’s vital signs at the initial presentation were: temperature, 101.8°F; heart rate, 102 beats/minute; and respiratory rate, 28 breaths/minute. Oxygen saturation was 98% on room air.
During this first visit, the mother denied the child having had any fever, chills, headache, sore throat, facial rash, joint pain, or pain on defecation. He had no significant medical history and no known drug allergies. After examination, a throat culture was taken, and the patient was given acetaminophen and discharged home with a diagnosis of viral syndrome.
At the second presentation, physical examination revealed a well-developed child in no distress. The examination was negative except for a 4 x 2 cm area of desquamation present over the perianal region (Figure).
The area of desquamation was dry, mildly erythematous without discharge, and nontender. The patient’s vital signs at this presentation were stable, and he was afebrile. The remaining physical examination findings were normal. The throat culture taken during the first ED presentation was reported as negative. A perianal swab was sent for culture and sensitivity. This was later reported to be positive for group A β-hemolytic streptococci (GABHS), which is sensitive to penicillin. The patient was discharged home in the care of his mother with a prescription of penicillin. A 10-day follow-up showed complete resolution of the skin rash.
Discussion
The rash in this case was most likely the result of scarlet fever with an unusual presentation of PSD; the signs and symptoms of which include perianal erythema, itching, rectal pain, sometimes blood-streaked stools, rectal bleeding, irritation or pruritus, tissue loss and exudation, secondary constipation, and cellulitis. Perianal streptococcal dermatitis has also been described in the adult literature.2 As with pediatric cases, PSD in adults is usually caused by GABHS.
Evaluation and Diagnosis
A rapid streptococcal test of suspicious areas can confirm the diagnosis. Fever, sore throat, and arthralgia are rare; however, culture from the perianal region grows GABHS. Titers are usually not elevated in laboratory evaluation. A routine skin culture is an alternative diagnostic aid.
Brilliant2 described the bright red color of PSD as a sharply demarcated rash that is caused by GABHS. As previously stated, symptoms include perianal rash, itching, and rectal pain; blood-streaked stools may also be seen in one-third of patients. It primarily occurs in children between 6 months and 10 years of age and is often misdiagnosed and treated inappropriately.3
Prompt diagnosis of GABHS is important. If untreated, it can cause serious systemic infections, especially in elderly and in newborn patients. Treatment with antibiotics resolves the condition in the majority of patients.2 In the acute stage, a white pseudomembrane may be present. As the rash becomes more chronic, the perianal eruption may consist of painful fissures, a dry mucoid discharge, or psoriasiform plaques. Perianal dermatitis can also be caused by Staphylococcus aureus or Candida. Confirmation of the diagnosis is accomplished by culturing a moderate-to-heavy growth of GABHS on 5% sheep-blood agar.
Treatment
A 10-day course of oral penicillin produces resolution of the dermatitis and other symptoms in most patients, but a relapse rate as high as 39% has been reported. Other treatment plans include amoxicillin, 40 mg/kg per day, divided into three doses, and/or topical applications of mupirocin 2% three times per day for 10 days. Penicillin, clindamycin phosphate, and erythromycin have also been used.
Although penicillin is generally recommended for treatment of GABHS infection, amoxicillin is often better tolerated in the pediatric population due to its superior palatability. Early antibiotic treatment causes a dramatic and rapid improvement of symptoms. However, according to Olson et al,4 PSD initially treated with amoxicillin or penicillin is consistently associated with a high risk of clinical recurrence. Whether treatment with a β-lactamase–resistant agent reduces this risk is uncertain.
Conclusion
This case represents an unusual presentation of scarlet fever manifesting as perianal dermatitis caused by GABHS. Although more common in the pediatric population, adult cases have been documented in the literature. As this case illustrates, early recognition and treatment with penicillin (or amoxicillin) produces rapid improvement and resolution of symptoms.
Dr Nibhanipudi is a professor of clinical emergency medicine at New York Medical College - Metropolitan Hospital Center, New York.
- Case Report: Perianal Streptococcal Infection
- Landolt M, Heininger U. Prevalence of perianal streptococcal dermatitis in children and adolescents [in German]. Praxis (Bern 1994). 2005;94(38):1467-1471.
- Kahlke V, Jongen J, Peleikis HG, Herbst RA. Perianal streptococcal dermatitis in adults: its association with pruritic anorectal diseases is mainly caused by group B Streptococci. Colorectal Dis. 2013;15(5):602-607.
- Brilliant LC. Perianal streptococcal dermatitis. Am Fam Physician. 2000;61(2):391-393.
- Olson D, Edmonson MB. Outcomes in children treated for perineal group A beta-hemolytic streptococcal dermatitis. Pediatr Infect Dis J. 2011;30(11):933-936.

2016 Update on obstetrics
Some areas of obstetric care are not as clearcut as others in this time of rapid medical evolution. In this Update, we discuss 3 of them:
- management of twin gestations
- management of chronic hypertension in pregnancy
- cell-free DNA screening for fetal aneuploidy.
To our benefit, both the American College of Obstetricians and Gynecologists (ACOG) and the Society for Maternal-Fetal Medicine (SMFM) have weighed in on important aspects of these areas of obstetric care.
Society for Maternal-Fetal Medicine, Simpson LL. Twin-twin transfusion syndrome. Am J Obstet Gynecol. 2013;208(1):3–18.
Society for Maternal-Fetal Medicine. Checklists and Safety Bundles. https://www.smfm.org/mfm-practice/checklists-and-safety-bundles. Published March 2015. Accessed December 7, 2015.
American College of Obstetricians and Gynecologists. Practice bulletin No. 144. Multifetal gestations: twin, triplet, and higher-order multifetal pregnancies. Obstet Gynecol. 2014;123(5):1118–1132.
From the maternal perspective, twin pregnancies are known to have higher risks than their singleton counterparts for such complications as hypertension, preeclampsia, diabetes, hemorrhage, cesarean delivery, postpartum depression, and anemia. These complications are managed essentially the same way regardless of the number of fetuses.
From the fetal/neonatal perspective, twin gestations may carry increased risks of congenital anomalies, preterm birth, and aneuploidy, which are managed similarly to singleton gestations overall, with certain adjustments as necessary.
Twin pregnancies do have unique risks, however, that are managed differently from the time chorionicity is established until delivery. The level of risk increases as the number of chorions and amnions decreases.
A basic management plan for twin gestations consists of a number of components, elucidated below.
1. Determine chorionicity and amnionicityThis determination is most reliably performed late in the first trimester and must be done using ultrasound. The inter-twin membrane should be identified. At 11 to 14 weeks, the presence of the “lambda sign,” a triangular projection of tissue that extends from the chorionic surface, is indicative of a dichorionic pregnancy, while a “T sign” suggests a monochorionic pregnancy (sensitivities 97%–100%; specificities 98%–100%). Alternatively, demonstration of discordant genders or separate placentas may be used later in pregnancy.
2. Monitor growth every 4 weeks in dichorionic twinsDichorionic twins are, by default, diamniotic. After the anatomic survey, growth surveillance should be conducted approximately every 4 weeks.
Discordant growth usually is defined as a difference of 20% or more in weight between the twins, based on the weight of the larger twin. As an isolated finding with both fetuses of normal weight, this discordance has not been demonstrated to increase adverse outcomes. Routine antenatal surveillance is not necessarily indicated.
Fetal growth restriction of one twin or a coexisting abnormality should prompt antenatal testing and/or earlier delivery. Any maternal comorbidities such as hypertension or diabetes also would be indications for testing. Otherwise, delivery is recommended at 38 weeks’ to 38-6/7 weeks’ gestation.
After 32 weeks, the mode of delivery may be vaginal if the presenting twin is vertex and the delivery provider can perform breech extraction or internal podalic version, if necessary.
3. Monochorionic/diamniotic twins also warrant regular surveillanceThe shared placenta places these pregnancies at increased risk for twin-to-twin transfusion syndrome (TTTS), a fetal-placental imbalance in which one twin “transfuses” the other. Ten percent to 15% of monochorionic pregnancies develop TTTS, which is associated with high rates of morbidity and mortality, even when treated.
Antenatal surveillance of these pregnancies involves ultrasonography assessment every 2 weeks, starting at 16 weeks. At each examination, the deepest vertical pocket (DVP) of fluid and presence of each fetal bladder are documented. This limited assessment alternates with a growth assessment every 2 weeks. SMFM recommends this biweekly assessment until 28 weeks, then every 2 to 3 weeks until delivery.
Stage 1 TTTS is defined by the polyhydramnios/oligohydramnios sequence (DVP of one fetus <2 cm, with DVP of the other >8 cm).
Evaluation for treatment of TTTS with laser coagulation (preferred) or amnio‑reduction should take place after the diagnosis is made, along with increased fetal surveillance.
SMFM also recommends fetal echocardiography due to the 9-fold increased risk of cardiac anomalies in monochorionic pregnancies.
Other complications of monochorionic/diamniotic twins include selective fetal growth restriction (due to unequal sharing of the placenta), twin reversed arterial perfusion (TRAP) sequence, and twin anemia-polycythemia sequence (TAPS).
Antenatal surveillance of all monochorionic twins is recommended, given the increased risk of stillbirth; many centers start testing at 32 weeks’ gestation. According to ACOG, uncomplicated monochorionic/diamniotic twins should be delivered at 34 weeks’ to 37-6/7 weeks’ gestation. Fetal growth restriction or other comorbidities may prompt delivery as early as 32 weeks.
4. Know the risks of monoamniotic twin gestationsThese twins are at increased risk for intrauterine fetal death due to cord entanglement, as well as TTTS, TAPS, and fetal growth restriction. Routine growth assessment and evaluation for TTTS are similar to those for monochorionic/diamniotic twins (without the option of polyhydramnios/oligohydramnios measurement), but the overall management of these pregnancies is unknown.
Protocols may range from outpatient antenatal testing to hospitalization to 24 to 28 weeks’ gestation with daily antenatal testing or attempted continuous monitoring. Delivery by cesarean delivery is recommended at 32 to 34 weeks’ gestation.
What this EVIDENCE means for practice Monochorionic twins need specific and frequent monitoring due to significantly increased risk for both fetal and placental complications. They justify late preterm or early term delivery.
Management of chronic hypertension in pregnancy: Reserve therapy for severe hypertension
Cell-free DNA screening for fetal aneuploidy: Strengths and limitations
Jaimey M. Pauli, MD, and John T. Repke, MD

Dr. Pauli is Assistant Professor, Division of Maternal-Fetal Medicine, Department of Obstetrics and Gynecology, Penn State University College of Medicine, and Attending Perinatologist at the Milton S. Hershey Medical Center in Hershey, Pennsylvania.

Dr. Repke is University Professor and Chairman of Obstetrics and Gynecology at Penn State University College of Medicine. He is also Obstetrician-Gynecologist-in-Chief at the Milton S. Hershey Medical Center in Hershey, Pennsylvania. Dr. Repke serves on the OBG Management Board of Editors.
The authors report no financial relationships relevant to this article.
Jaimey M. Pauli, MD, and John T. Repke, MD
Dr. Pauli is Assistant Professor, Division of Maternal-Fetal Medicine, Department of Obstetrics and Gynecology, Penn State University College of Medicine, and Attending Perinatologist at the Milton S. Hershey Medical Center in Hershey, Pennsylvania.
Dr. Repke is University Professor and Chairman of Obstetrics and Gynecology at Penn State University College of Medicine. He is also Obstetrician-Gynecologist-in-Chief at the Milton S. Hershey Medical Center in Hershey, Pennsylvania. Dr. Repke serves on the OBG Management Board of Editors.
The authors report no financial relationships relevant to this article.
Some areas of obstetric care are not as clearcut as others in this time of rapid medical evolution. In this Update, we discuss 3 of them:
- management of twin gestations
- management of chronic hypertension in pregnancy
- cell-free DNA screening for fetal aneuploidy.
To our benefit, both the American College of Obstetricians and Gynecologists (ACOG) and the Society for Maternal-Fetal Medicine (SMFM) have weighed in on important aspects of these areas of obstetric care.
Society for Maternal-Fetal Medicine, Simpson LL. Twin-twin transfusion syndrome. Am J Obstet Gynecol. 2013;208(1):3–18.
Society for Maternal-Fetal Medicine. Checklists and Safety Bundles. https://www.smfm.org/mfm-practice/checklists-and-safety-bundles. Published March 2015. Accessed December 7, 2015.
American College of Obstetricians and Gynecologists. Practice bulletin No. 144. Multifetal gestations: twin, triplet, and higher-order multifetal pregnancies. Obstet Gynecol. 2014;123(5):1118–1132.
From the maternal perspective, twin pregnancies are known to have higher risks than their singleton counterparts for such complications as hypertension, preeclampsia, diabetes, hemorrhage, cesarean delivery, postpartum depression, and anemia. These complications are managed essentially the same way regardless of the number of fetuses.
From the fetal/neonatal perspective, twin gestations may carry increased risks of congenital anomalies, preterm birth, and aneuploidy, which are managed similarly to singleton gestations overall, with certain adjustments as necessary.
Twin pregnancies do have unique risks, however, that are managed differently from the time chorionicity is established until delivery. The level of risk increases as the number of chorions and amnions decreases.
A basic management plan for twin gestations consists of a number of components, elucidated below.
1. Determine chorionicity and amnionicityThis determination is most reliably performed late in the first trimester and must be done using ultrasound. The inter-twin membrane should be identified. At 11 to 14 weeks, the presence of the “lambda sign,” a triangular projection of tissue that extends from the chorionic surface, is indicative of a dichorionic pregnancy, while a “T sign” suggests a monochorionic pregnancy (sensitivities 97%–100%; specificities 98%–100%). Alternatively, demonstration of discordant genders or separate placentas may be used later in pregnancy.
2. Monitor growth every 4 weeks in dichorionic twinsDichorionic twins are, by default, diamniotic. After the anatomic survey, growth surveillance should be conducted approximately every 4 weeks.
Discordant growth usually is defined as a difference of 20% or more in weight between the twins, based on the weight of the larger twin. As an isolated finding with both fetuses of normal weight, this discordance has not been demonstrated to increase adverse outcomes. Routine antenatal surveillance is not necessarily indicated.
Fetal growth restriction of one twin or a coexisting abnormality should prompt antenatal testing and/or earlier delivery. Any maternal comorbidities such as hypertension or diabetes also would be indications for testing. Otherwise, delivery is recommended at 38 weeks’ to 38-6/7 weeks’ gestation.
After 32 weeks, the mode of delivery may be vaginal if the presenting twin is vertex and the delivery provider can perform breech extraction or internal podalic version, if necessary.
3. Monochorionic/diamniotic twins also warrant regular surveillanceThe shared placenta places these pregnancies at increased risk for twin-to-twin transfusion syndrome (TTTS), a fetal-placental imbalance in which one twin “transfuses” the other. Ten percent to 15% of monochorionic pregnancies develop TTTS, which is associated with high rates of morbidity and mortality, even when treated.
Antenatal surveillance of these pregnancies involves ultrasonography assessment every 2 weeks, starting at 16 weeks. At each examination, the deepest vertical pocket (DVP) of fluid and presence of each fetal bladder are documented. This limited assessment alternates with a growth assessment every 2 weeks. SMFM recommends this biweekly assessment until 28 weeks, then every 2 to 3 weeks until delivery.
Stage 1 TTTS is defined by the polyhydramnios/oligohydramnios sequence (DVP of one fetus <2 cm, with DVP of the other >8 cm).
Evaluation for treatment of TTTS with laser coagulation (preferred) or amnio‑reduction should take place after the diagnosis is made, along with increased fetal surveillance.
SMFM also recommends fetal echocardiography due to the 9-fold increased risk of cardiac anomalies in monochorionic pregnancies.
Other complications of monochorionic/diamniotic twins include selective fetal growth restriction (due to unequal sharing of the placenta), twin reversed arterial perfusion (TRAP) sequence, and twin anemia-polycythemia sequence (TAPS).
Antenatal surveillance of all monochorionic twins is recommended, given the increased risk of stillbirth; many centers start testing at 32 weeks’ gestation. According to ACOG, uncomplicated monochorionic/diamniotic twins should be delivered at 34 weeks’ to 37-6/7 weeks’ gestation. Fetal growth restriction or other comorbidities may prompt delivery as early as 32 weeks.
4. Know the risks of monoamniotic twin gestationsThese twins are at increased risk for intrauterine fetal death due to cord entanglement, as well as TTTS, TAPS, and fetal growth restriction. Routine growth assessment and evaluation for TTTS are similar to those for monochorionic/diamniotic twins (without the option of polyhydramnios/oligohydramnios measurement), but the overall management of these pregnancies is unknown.
Protocols may range from outpatient antenatal testing to hospitalization to 24 to 28 weeks’ gestation with daily antenatal testing or attempted continuous monitoring. Delivery by cesarean delivery is recommended at 32 to 34 weeks’ gestation.
What this EVIDENCE means for practice Monochorionic twins need specific and frequent monitoring due to significantly increased risk for both fetal and placental complications. They justify late preterm or early term delivery.
Management of chronic hypertension in pregnancy: Reserve therapy for severe hypertension
Cell-free DNA screening for fetal aneuploidy: Strengths and limitations
In this article
- Know the risks of monoamniotic twin gestations
- “Less tight” versus “tight” BP control
- Cell-free DNA screening for aneuploidy

Cell-free DNA screening for women at low risk for fetal aneuploidy
CASE: Low-risk patient requests cell-free DNA screening
Ms. Smith is a 25-year-old woman (G1P0) presenting at 10 weeks’ gestation for her first prenatal visit. She requests cell-free DNA (cfDNA) screening to test for fetal aneuploidy. You explain that the current recommendations are for traditional screening, and inform her that her insurance may not cover the cost of cfDNA screening. She is anxious to learn the sex of her fetus as early as possible, and indicates that she would like to pursue cfDNA. After further discussion of the pros and cons, you order the test.
Prenatal screening is currently recommended in pregnancy for a number of genetic disorders, chromosomal aneuploidy, and structural birth defects in the fetus, regardless of maternal age or family history. There is a broad range of sonographic and maternal serum-based options available for carrying out aneuploidy risk assessment in the first and/or second trimester.
In addition, cfDNA screening for fetal aneuploidy has been clinically available since 2011 and has seen tremendous uptake, particularly in the high-risk population. Recent data indicate that cfDNA screening likewise has very high sensitivity and specificity for trisomy 21 in the low-risk population.1,2
Many low-risk patients are asking providers about the pros and cons of cfDNA screening, and the appropriateness of this test as a primary screen, including in low-risk patients, is the focus of this article.
What is cfDNA?
cfDNA consists of small (<200 base pairs) fragments of DNA that are present in the maternal serum. After 10 weeks of gestation, about 10% of the total circulating cfDNA in the maternal serum is derived from the placenta and can therefore be used to test for fetal disorders (FIGURE).3

Although cfDNA screening has been reported to be possible for many different types of genetic conditions, such as RhD type and single-gene disorders such as achondroplasia,4 most clinical testing is done for fetal chromosomal disorders, including trisomies 13, 18, and 21 and the sex chromosomes. In addition, some laboratories provide testing for other trisomies (16 and 22), as well as some of the microdeletion syndromes (22q11.2, 1p36, Prader Willi syndrome, and others).5
Analysis of cfDNA to assess the risk for aneuploidy is done using a number of different approaches; these generally all include next-generation sequencing with advanced bioinformatics analyses.3,6–9 Although the laboratories use somewhat different techniques, all of them share very high sensitivity and specificity for detection of trisomy 21 (TABLE 1).10
Sensitivities for trisomy 13 and sex chromosomal abnormalities are somewhat lower, but the specificity is greater than 99% for each condition, meaning that false-positive rates are very low.
The accuracy of cfDNA in identifying chromosomal aneuploidy depends on several factors, including the relative amount of fetal to maternal DNA, the chance that a chromosome abnormality is present (that is, the risk based on maternal age or results of other screening), and other factors such as the presence of twins or a nonviable second fetus, or the presence of placental mosaicism.
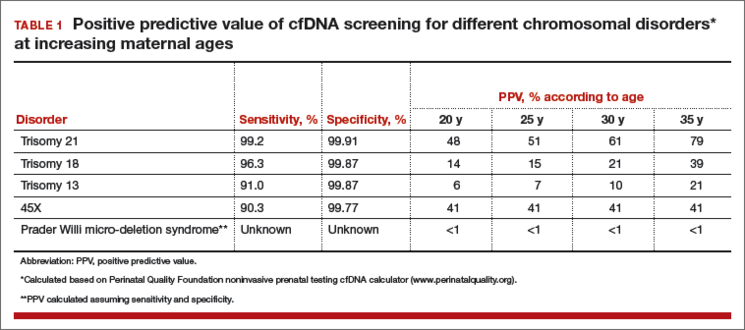
Because of these variables, both false-positive and false-negative results can occur, and the test is not diagnostic but rather is considered a screening test. A positive result does not mean that the fetus is definitely affected with aneuploidy.
What are the advantages of cfDNA screening for low-risk patients?
There are several benefits of cfDNA screening versus traditional screening or diagnostic testing, which are the other options available (TABLE 2). For Down syndrome, the detection rate is higher and the false-positive rate is lower than that seen with traditional aneuploidy screening using serum analytes and nuchal translucency ultrasonography.1,2
TABLE 2 Pros and cons of cfDNA screening in low-risk patients
Pros
- High detection rate and very low false-positive rate
- Can be performed any time after 10 weeks’ gestation
- Requires a single blood test at any gestational age
- Results presented in simple “Yes” or “No” format
- As with other screening tests, cfDNA provides a noninvasive determination of risk
Cons
- Tests for a limited range of conditions, which are rare in low-risk patients
- Is not as comprehensive or definitive as diagnostic testing with amniocentesis or chorionic villus sampling
- Results do not adjust for patient’s prior risk
- Positive results require calculation and interpretation of positive predictive value by provider
- Low fetal DNA and other factors can lead to test failure in some cases
- Cannot be used with vanishing twin
- Can reveal unsuspected maternal conditions of uncertain significance
The test can be done any time after 10 weeks’ gestation without the narrow gestational-age windows required or the need for accurate gestational age determination using traditional screening to accurately interpret results. cfDNA screening involves a single blood test that does not require integration with multiple serum markers or ultrasound findings. Finally, results are generally presented in a simple “Yes” or “No” format that is easy for providers and patients to understand.
CASE Continued
Your patient’s results are positive for trisomy 13. Her understanding is that the test is more than 99% accurate, and she interprets this to mean that the chance of trisomy 13 in her fetus is more than 99%. She is distraught and asks about pregnancy termination.
What are the limitations of cfDNA screening?
Similar to other noninvasive screening tests, cfDNA screening does not carry direct risk to the pregnancy. However, there are limitations to this testing. As a result, the American College of Obstetricians and Gynecologists (ACOG) and the Society for Maternal-Fetal Medicine (SMFM) recently have stated that traditional screening is the most appropriate option for most women.11,12
One reason that cfDNA screening may not be the best choice for low-risk women is that Down syndrome is quite uncommon in this group, so cfDNA screening is a very precise test for a rare condition. Traditional multiple marker screening, on the other hand, is more effective at signaling risk for the broad range of adverse perinatal outcomes that can affect a pregnancy, including other structural birth defects, as well as such obstetric complications as preterm birth, preeclampsia, and fetal growth restriction.13,14
Many women who undergo cfDNA screening are under the impression that they have had a definitive test for all birth defects when, in fact, the coverage of cfDNA for all possible birth defects in a low-risk woman is very limited; her residual risk for a birth defect is little changed by a normal cfDNA result.
The ease of obtaining a blood sample for cfDNA screening is an advantage of the test. However, because it is simple to perform, it often is done with inadequate pretest counseling or consideration. Just because the test is easily obtained does not negate the need for adequate discussion to assure that each woman understands what the test can and cannot measure, and the possible outcomes of testing.
Another perceived benefit of cfDNA screening is the simple presentation of results. While reports vary, they generally provide very dichotomized results. Aneuploidy risk is reported as “Positive” or “Negative,” or as “Detected” or “Not detected.”
Some laboratories report the chance of aneuploidy; this is almost always stated to be more than 99% in patients at increased risk, and less than 1 in 10,000 in patients at low risk.
All of these results suggest a near diagnostic certainty. However, this reporting is oversimplified and misleading, as it does not account for each patient’s prior or background risk. The chance that a positive result is a true positive is very different in a 20-year-old versus a 35-year-old woman, yet the reports do not reflect this difference in positive predictive value (PPV). See TABLE 1.
Accurate interpretation of risk for the individual patient, therefore, requires calculation by the provider; this can be done through an online calculator available through the Perinatal Quality Foundation (www.perina talquality.org).
CASE Continued
You explain to your patient that the chance her fetus has trisomy 13 is far lower than 99%, based in part on the very low prior risk given her age. You calculate the PPV using an online calculator, which estimates that there is only a 7% chance that this is a true positive result.
As mentioned earlier, there has been a tremendously rapid uptake of cfDNA screening. Given wider use by practitioners not as familiar with the complexities of genetic testing and statistical analysis, misunderstanding of the test characteristics carries risks if inappropriate recommendations or decisions are made or actions taken.
Most low-risk patients do not request or desire diagnostic testing. It is important during pretest counseling to explain that cfDNA cannot detect all significant chromosomal aneuploidies. Some serious abnormalities will be undetected; therefore, some women may prefer more comprehensive prenatal testing (TABLE 3).
TABLE 3 Checklist for pretest counseling for cfDNA28
- cfDNA screening is the most accurate screening test for trisomy 21
- cfDNA is a screening test, and false-positive and false-negative results can and do occur
- Diagnostic confirmation with chorionic villus sampling or amniocentesis is recommended for women with abnormal cfDNA results
- A negative cfDNA result decreases risk but does not rule out trisomy 21 and other chromosomal conditions
- cfDNA does not test for all chromosomal conditions
- Women who desire definitive information about chromosome conditions in the pregnancy should consider diagnostic testing with chorionic villus sampling or amniocentesis
- All genetic testing is optional. Whether a woman chooses to have a screening test, a diagnostic test, or no testing is a personal decision; any are reasonable options for any pregnant woman.
ACOG recommends that diagnostic testing should be available to all pregnant women, regardless of age.15 In prenatal series, trisomies 13, 18, and 21 make up approximately two-thirds of all clinically significant aneuploidies.16,17 Given that cfDNA detects only these aneuploidies, the other third will not be identified prenatally in patients who choose cfDNA. Traditional aneuploidy screening has been demonstrated to detect a broader range of these less common but clinically important chromosomal abnormalities.18
In one study of women found to be at increased risk based on traditional multiple marker screening, if cfDNA were chosen instead of diagnostic testing, 17% of the aneuploidies present in this group would not have been detected.18 Of all high-risk women in this study, 2%, or 1 in 50, had a chromosomal abnormality detectable by amniocentesis but not with cfDNA.
Successful tests require adequate placental DNA
Accurate interpretation of cfDNA screening also requires that an adequate quantity of placental DNA be present; this is often referred to as the “fetal fraction.” In some cases, the placental DNA volume is too low for accurate analysis, particularly in obese patients and women with specific chromosomal abnormalities.
Some laboratories measure this and do not report a result if the fetal fraction is below a specific cut-off, typically about 4%. Other laboratories do not measure or exclude cases with too little fetal DNA, raising concern that this could result in missing cases of aneuploidy. It has been noted that a placental DNA fraction of less than 8% is associated with less accurate test results, even if results are returned.8
Low fetal fraction also has been associated with maternal obesity, and in one study cfDNA failed to provide a result in 20% of women weighing more than 250 lb and 50% of women weighing more than 350 lb.19 Therefore, cfDNA is not the best option for obese women (TABLE 4).
TABLE 4 Appropriateness of cfDNA screeningin specific clinical circumstances
Optimal candidates for cfDNA screening
- High risk for trisomy based on maternal age (≥35 years)
- Ultrasound findings suggesting trisomy 13, 18, or 21
- History of prior pregnancy with trisomy 13, 18, or 21
- Positive traditional screening test
- Parental balanced Robertsonian translocation associated with risk for trisomy 13 or 21
Less optimal candidates
- Low risk for trisomy based on age and/or low risk traditional screening
- Ultrasound structural anomalies other than those specifically suggesting trisomy 13, 18, or 21
- High risk for nonchromosomal genetic disorder
- Comprehensive genetic diagnosis desired
- Maternal malignancy
- Maternal organ transplant
- Maternal sex chromosomal mosaicism or other chromosomal abnormality
- Maternal obesity
- Gestational age <10 weeks
While the free fraction is relatively constant from 10 to 22 weeks’ gestation, it is lower earlier than 10 weeks’ gestation and less likely to provide a result. For this reason, the test should not be attempted before 10 weeks’ gestation.
Recent evidence indicates that low fetal DNA fraction is associated with some chromosome abnormalities. Given this association, women with failed cfDNA results should be counseled and offered appropriate follow-up. As the association appears to be greater for trisomies 13 and 18, and triploidy, a careful ultrasound is likely to detect abnormalities in many such cases. However, it also is appropriate to offer the option of diagnostic testing, given the very high risk.
A repeat cfDNA test will be successful in some cases. Whether the patient chooses to attempt cfDNA again may depend in part on maternal body mass index (BMI), as well as gestational age—a patient at a more advanced gestation may not wish to delay obtaining definitive information given the high risk.
cfDNA screening has a low false-positive rate
One of the greatest benefits of cfDNA screening is a lower false-positive rate than is reported with traditional screening. However, when “no results” cases are also considered, the percentage of patients who require follow-up after cfDNA is close to that of traditional screening.
The chance of test failure is reported to be 0.9% to 8.1%,7,9,10 and varies in part by whether the laboratory measures fetal fraction and requires a minimum concentration.
A recent meta-analysis estimated the overall test failure rate at 3%.10 When comparing cfDNA to traditional screening, if “no results” cases are included with the “screen positive” group, the benefits of cfDNA over traditional screening are much less clear, particularly in a low-risk population.
ACOG: Offer traditional multiple-marker screening first
While multiple marker and cfDNA screening have differing performance characteristics, there are no data to support doing both tests concurrently. In fact, in a recent survey of nearly 200 women presented with different testing scenarios, women found it preferable and more reassuring to have a positive traditional screen followed by normal cfDNA results, rather that discrepant results of the 2 tests done concurrently.20
For many reasons, the approach recommended by ACOG and SMFM is to offer traditional multiple-marker screening first, and cfDNA screening or diagnostic testing as a follow-up for patients that screen positive. In that scenario, the benefits and limitations of diagnostic testing versus follow-up with cfDNA screening should be explained carefully.
In all patients who have a positive cfDNA result, diagnostic testing for confirmation should be offered and strongly recommended prior to pregnancy termination if that is considered. Even if a structural abnormality is present and a true positive result is highly likely, karyotyping is important to determine if there may be an inherited translocation putting subsequent pregnancies at higher risk.
Components of pretest counseling
A woman of any age can have a fetus with trisomy or another chromosomal abnormality, and some women prefer diagnostic testing or no testing regardless of age. It is therefore appropriate to offer diagnostic testing, screening, or the option of no testing to all women.
Recent studies have demonstrated that providing well-informed access to all prenatal tests results in more informed choices and no increase in uptake of invasive testing.22 However, the offer of prenatal testing requires discussion of the pros and cons of all test options, including the detection rates of all significant abnormalities, the screen positive rates, and recommended follow-up if an abnormal result is obtained. See TABLE 4.
Cost-effectiveness
Although the detection rate of cfDNA for trisomy 21 is higher than that of traditional screening, the detection rate of traditional screening is also quite high at lower cost. For low-risk women, therefore, traditional screening provides a less expensive alternative to cfDNA. Because aneuploidy is rare in low-risk patients, the residual chance of aneuploidy after a normal traditional screen is very low, and the cost per additional case of Down syndrome detected by cfDNA is very high.
In one study, this was estimated at $3.6 million.23 These authors suggested that, at present, cfDNA is optimally used as a secondary screen for high-risk women. Other cost analyses also have demonstrated that the most cost-effective strategy is a model in which cfDNA is used as a follow-up test in patients found to be screen positive by traditional screening.15,24 A recent cost utility analysis compared outcomes of 6 approaches to prenatal screening, including sequential screening, cfDNA screening, nuchal translucency only, and diagnostic testing with microarray (alone, in combination, or in sequence).
The clinical outcomes included fetal abnormalities detected, taking into account all chromosomal abnormalities, as well as failed cfDNA tests. For younger women (<40 yr), traditional sequential screening provided the highest detection of all abnormalities and was the optimal testing strategy, while cfDNA was preferable for women aged 40 or older, given the higher prevalence of trisomy 21.20
Incidental findings
Given that the cfDNA in maternal serum is a mixture of maternal and placental DNA, a number of biologic phenomena can cause a false-positive cfDNA result. In many cases, these false-positives reveal unanticipated or unexpected maternal conditions and information that the woman may have preferred not to know. A few cases of maternal malignancies with chromosomal abnormalities within the tumor have been reported in patients with false-positive cfDNA results.26
These case reports have raised the question about the need for further evaluation for maternal malignancy in women with false-positive results. Maternal genetic disorders also can cause false-positive results, and may lead to unanticipated detection of adult-onset conditions. In some cases, positive results for sex chromosomal aneuploidy can occur in pregnant women who themselves have a sex chromosomal abnormality, often in mosaic form and previously undiagnosed.27
Again, this has led to discussion of the possible health benefit of karyotyping women who have a false-positive cfDNA result to rule out a mosaic chromosomal abnormality in the mother.
At this time, the clinical utility of such investigations is unknown and there are no recommendations regarding appropriate follow-up for such cases.
CASE Resolved
Given the results of her cfDNA screening, your patient opts to undergo diagnostic testing. In that testing, trisomy 13 is ruled out and she goes on to have a healthy daughter.
Share your thoughts on this article! Send your Letter to the Editor to [email protected]. Please include your name and the city and state in which you practice.
- Bianchi DW, Parker RL, Wentworth J, et al. DNA sequencing versus standard prenatal aneuploidy screening. N Engl J Med. 2014;370(9):799–808.
- Norton ME, Jacobsson B, Swamy GK, et al. Cell-free DNA analysis for noninvasive examination of trisomy. N Engl J Med. 2015;372(17):1589–1597.
- Norton ME, Brar H, Weiss J, et al. Non-Invasive Chromosomal Evaluation (NICE) study: results of a multicenter prospective cohort study for detection of fetal trisomy 21 and trisomy 18. Am J Obstet Gynecol. 2012;207(2):137.e1–e8.
- Chitty LS, Mason S, Barrett AN, et al. Non-invasive prenatal diagnosis of achondroplasia and thanatophoric dysplasia: next-generation sequencing allows for a safer, more accurate, and comprehensive approach. Prenat Diagn. 2015;35(7):656–662.
- Wapner RJ, Babiarz JE, Levy B, et al. Expanding the scope of noninvasive prenatal testing: detection of fetal microdeletion syndromes. Am J Obstet Gynecol. 2015;212(3):332.e1–e9.
- Bianchi DW, Platt LD, Goldberg JD, Abuhamad AZ, Sehnert AJ, Rava RP. Genome-wide fetal aneuploidy detection by maternal plasma DNA sequencing. Obstet Gynecol. 2012;119(5):890–901.
- Palomaki GE, Kloza EM, Lambert-Messerlian GM, et al. DNA sequencing of maternal plasma to detect Down syndrome: an international clinical validation study. Genet Med. 2011;13(11):913–920.
- Sparks AB, Wang ET, Struble CA, et al. DNA sequencing of maternal plasma to detect Down syndrome: an international clinical validation study [abstract]. Proceedings of the ISPD 16th International Conference on Prenatal Diagnosis and Therapy; Miami, Florida; June 3–6, 2012. Prenat Diagn. 2012;32(suppl 1):s3–s9.
- Zimmermann B, Hill M, Gemelos G, et al. Noninvasive prenatal aneuploidy testing of chromosomes 13, 18, 21, X, and Y, using targeted sequencing of polymorphic loci. Prenat Diagn. 2012;32(13):1233–1241.
- Gil MM, Quezada MS, Revello R, Akolekar R, Niclaides KH. Analysis of cell-free DNA in maternal blood in screening for fetal aneuploidies: updated meta-analysis. Ultrasound Obstet Gynecol. 2015;45(3):249–266.
- American College of Obstetricians and Gynecologists. Committee Opinion No. 640: cell-free DNA screening for fetal aneuploidy. Obstet Gynecol. 2015;126(3):e31–e37.
- Society for Maternal-Fetal Medicine (SMFM) Publications Committee. Prenatal aneuploidy screening using cell-free DNA. Am J Obstet Gynecol. 2015;212(6):711–716.
- Baer RJ, Currier RJ, Norton ME, et al. Obstetric, perinatal, and fetal outcomes in pregnancies with false-positive integrated screening results. Obstet Gynecol. 2014;123(3):603–609.
- Dugoff L; Society for Maternal-Fetal Medicine. First- and second-trimester maternal serum markers for aneuploidy and adverse obstetric outcomes. Obstet Gynecol. 2010;115(5):1052–1061.
- American College of Obstetricians and Gynecologists. Practice bulletin No. 88: invasive prenatal testing for aneuploidy. Obstet Gynecol. 2007;110(6):1459–1467.
- Alamillo CM, Krantz D, Evans M, Fiddler M, Pergament E. Nearly a third of abnormalities found after first-trimester screening are different than expected: 10-year experience from a single center. Prenat Diagn. 2013;33(3):251–256.
- Wellesley D, Dolk H, Boyd PA, et al. Rare chromosome abnormalities, prevalence and prenatal diagnosis rates from population-based congenital anomaly registers in Europe. Eur J Hum Genet. 2012;20(5):521–526.
- Norton ME, Jelliffe-Pawlowski LL, Currier RJ. Chromosome abnormalities detected by current prenatal screening and noninvasive prenatal testing. Obstet Gynecol. 2014;124(5):979–986.
- Ashoor G, Syngelaki A, Poon LC, Rezende JC, Nicolaides KH. Fetal fraction in maternal plasma cell-free DNA at 11-13 weeks’ gestation: relation to maternal and fetal characteristics. Ultrasound Obstet Gynecol. 2013;41(1):26–32.
- Kaimal AJ, Norton ME, Kuppermann M. Prenatal testing in the genomic age: clinical outcomes, quality of life, and costs. Obstet Gynecol. 2015;126(4):737–746.
- Wapner RJ, Martin CL, Levy B, et al. Chromosomal microarray versus karyotyping for prenatal diagnosis. N Engl J Med. 2012;367(23):2175–2184.
- Kuppermann M, Pena S, Bishop JT, et al. Effect of enhanced information, values clarification, and removal of financial barriers on use of prenatal genetic testing: a randomized clinical trial. JAMA. 2014;312(12):1210–1217.
- Cuckle H, Benn P, Pergament E. Maternal cfDNA screening for Down syndrome—a cost sensitivity analysis. Prenat Diagn. 2013;33(7):636–642.
- Beulen L, Grutters JPC, Faas BH, Feenstra I, van Vugt JMG, Bekker MN. The consequences of implementing non-invasive prenatal testing in Dutch national health care: a cost-effectiveness analysis. Eur J Obstet Gynecol Reprod Biol. 2014;182:53–61.
- Okun N, Teitelbaum M, Huang T, Dewa CS, Hoch JS. The price of performance: a cost and performance analysis of the implementation of cell-free fetal DNA testing for Down syndrome in Ontario, Canada: Cost and performance analysis of cfDNA testing for Down syndrome in Ontario. Prenat Diagn. 2014;34(4):350–356.
- Bianchi DW, Chudova D, Sehnert AJ, et al. Noninvasive prenatal testing and incidental detection of occult maternal malignancies. JAMA. 2015;314(2):162–169.
- Wang Y, Chen Y, Tian F, et al. Maternal mosaicism is a significant contributor to discordant sex chromosomal aneuploidies associated with noninvasive prenatal testing. Clin Chem. 2014;60(1):251–259.
- Norton ME, Jelliffe-Pawlowski LL, Currier RJ. Chromosome abnormalities detected by current prenatal screening and noninvasive prenatal testing. Obstet Gynecol. 2014;124(5):979–986Society for Maternal-Fetal Medicine (SMFM) Publications Committee. Prenatal aneuploidy screening using cell-free DNA. Am J Obstet Gynecol. 2015;212(6):711–716.
CASE: Low-risk patient requests cell-free DNA screening
Ms. Smith is a 25-year-old woman (G1P0) presenting at 10 weeks’ gestation for her first prenatal visit. She requests cell-free DNA (cfDNA) screening to test for fetal aneuploidy. You explain that the current recommendations are for traditional screening, and inform her that her insurance may not cover the cost of cfDNA screening. She is anxious to learn the sex of her fetus as early as possible, and indicates that she would like to pursue cfDNA. After further discussion of the pros and cons, you order the test.
Prenatal screening is currently recommended in pregnancy for a number of genetic disorders, chromosomal aneuploidy, and structural birth defects in the fetus, regardless of maternal age or family history. There is a broad range of sonographic and maternal serum-based options available for carrying out aneuploidy risk assessment in the first and/or second trimester.
In addition, cfDNA screening for fetal aneuploidy has been clinically available since 2011 and has seen tremendous uptake, particularly in the high-risk population. Recent data indicate that cfDNA screening likewise has very high sensitivity and specificity for trisomy 21 in the low-risk population.1,2
Many low-risk patients are asking providers about the pros and cons of cfDNA screening, and the appropriateness of this test as a primary screen, including in low-risk patients, is the focus of this article.
What is cfDNA?
cfDNA consists of small (<200 base pairs) fragments of DNA that are present in the maternal serum. After 10 weeks of gestation, about 10% of the total circulating cfDNA in the maternal serum is derived from the placenta and can therefore be used to test for fetal disorders (FIGURE).3
Although cfDNA screening has been reported to be possible for many different types of genetic conditions, such as RhD type and single-gene disorders such as achondroplasia,4 most clinical testing is done for fetal chromosomal disorders, including trisomies 13, 18, and 21 and the sex chromosomes. In addition, some laboratories provide testing for other trisomies (16 and 22), as well as some of the microdeletion syndromes (22q11.2, 1p36, Prader Willi syndrome, and others).5
Analysis of cfDNA to assess the risk for aneuploidy is done using a number of different approaches; these generally all include next-generation sequencing with advanced bioinformatics analyses.3,6–9 Although the laboratories use somewhat different techniques, all of them share very high sensitivity and specificity for detection of trisomy 21 (TABLE 1).10
Sensitivities for trisomy 13 and sex chromosomal abnormalities are somewhat lower, but the specificity is greater than 99% for each condition, meaning that false-positive rates are very low.
The accuracy of cfDNA in identifying chromosomal aneuploidy depends on several factors, including the relative amount of fetal to maternal DNA, the chance that a chromosome abnormality is present (that is, the risk based on maternal age or results of other screening), and other factors such as the presence of twins or a nonviable second fetus, or the presence of placental mosaicism.
Because of these variables, both false-positive and false-negative results can occur, and the test is not diagnostic but rather is considered a screening test. A positive result does not mean that the fetus is definitely affected with aneuploidy.
What are the advantages of cfDNA screening for low-risk patients?
There are several benefits of cfDNA screening versus traditional screening or diagnostic testing, which are the other options available (TABLE 2). For Down syndrome, the detection rate is higher and the false-positive rate is lower than that seen with traditional aneuploidy screening using serum analytes and nuchal translucency ultrasonography.1,2
TABLE 2 Pros and cons of cfDNA screening in low-risk patients
Pros
- High detection rate and very low false-positive rate
- Can be performed any time after 10 weeks’ gestation
- Requires a single blood test at any gestational age
- Results presented in simple “Yes” or “No” format
- As with other screening tests, cfDNA provides a noninvasive determination of risk
Cons
- Tests for a limited range of conditions, which are rare in low-risk patients
- Is not as comprehensive or definitive as diagnostic testing with amniocentesis or chorionic villus sampling
- Results do not adjust for patient’s prior risk
- Positive results require calculation and interpretation of positive predictive value by provider
- Low fetal DNA and other factors can lead to test failure in some cases
- Cannot be used with vanishing twin
- Can reveal unsuspected maternal conditions of uncertain significance
The test can be done any time after 10 weeks’ gestation without the narrow gestational-age windows required or the need for accurate gestational age determination using traditional screening to accurately interpret results. cfDNA screening involves a single blood test that does not require integration with multiple serum markers or ultrasound findings. Finally, results are generally presented in a simple “Yes” or “No” format that is easy for providers and patients to understand.
CASE Continued
Your patient’s results are positive for trisomy 13. Her understanding is that the test is more than 99% accurate, and she interprets this to mean that the chance of trisomy 13 in her fetus is more than 99%. She is distraught and asks about pregnancy termination.
What are the limitations of cfDNA screening?
Similar to other noninvasive screening tests, cfDNA screening does not carry direct risk to the pregnancy. However, there are limitations to this testing. As a result, the American College of Obstetricians and Gynecologists (ACOG) and the Society for Maternal-Fetal Medicine (SMFM) recently have stated that traditional screening is the most appropriate option for most women.11,12
One reason that cfDNA screening may not be the best choice for low-risk women is that Down syndrome is quite uncommon in this group, so cfDNA screening is a very precise test for a rare condition. Traditional multiple marker screening, on the other hand, is more effective at signaling risk for the broad range of adverse perinatal outcomes that can affect a pregnancy, including other structural birth defects, as well as such obstetric complications as preterm birth, preeclampsia, and fetal growth restriction.13,14
Many women who undergo cfDNA screening are under the impression that they have had a definitive test for all birth defects when, in fact, the coverage of cfDNA for all possible birth defects in a low-risk woman is very limited; her residual risk for a birth defect is little changed by a normal cfDNA result.
The ease of obtaining a blood sample for cfDNA screening is an advantage of the test. However, because it is simple to perform, it often is done with inadequate pretest counseling or consideration. Just because the test is easily obtained does not negate the need for adequate discussion to assure that each woman understands what the test can and cannot measure, and the possible outcomes of testing.
Another perceived benefit of cfDNA screening is the simple presentation of results. While reports vary, they generally provide very dichotomized results. Aneuploidy risk is reported as “Positive” or “Negative,” or as “Detected” or “Not detected.”
Some laboratories report the chance of aneuploidy; this is almost always stated to be more than 99% in patients at increased risk, and less than 1 in 10,000 in patients at low risk.
All of these results suggest a near diagnostic certainty. However, this reporting is oversimplified and misleading, as it does not account for each patient’s prior or background risk. The chance that a positive result is a true positive is very different in a 20-year-old versus a 35-year-old woman, yet the reports do not reflect this difference in positive predictive value (PPV). See TABLE 1.
Accurate interpretation of risk for the individual patient, therefore, requires calculation by the provider; this can be done through an online calculator available through the Perinatal Quality Foundation (www.perina talquality.org).
CASE Continued
You explain to your patient that the chance her fetus has trisomy 13 is far lower than 99%, based in part on the very low prior risk given her age. You calculate the PPV using an online calculator, which estimates that there is only a 7% chance that this is a true positive result.
As mentioned earlier, there has been a tremendously rapid uptake of cfDNA screening. Given wider use by practitioners not as familiar with the complexities of genetic testing and statistical analysis, misunderstanding of the test characteristics carries risks if inappropriate recommendations or decisions are made or actions taken.
Most low-risk patients do not request or desire diagnostic testing. It is important during pretest counseling to explain that cfDNA cannot detect all significant chromosomal aneuploidies. Some serious abnormalities will be undetected; therefore, some women may prefer more comprehensive prenatal testing (TABLE 3).
TABLE 3 Checklist for pretest counseling for cfDNA28
- cfDNA screening is the most accurate screening test for trisomy 21
- cfDNA is a screening test, and false-positive and false-negative results can and do occur
- Diagnostic confirmation with chorionic villus sampling or amniocentesis is recommended for women with abnormal cfDNA results
- A negative cfDNA result decreases risk but does not rule out trisomy 21 and other chromosomal conditions
- cfDNA does not test for all chromosomal conditions
- Women who desire definitive information about chromosome conditions in the pregnancy should consider diagnostic testing with chorionic villus sampling or amniocentesis
- All genetic testing is optional. Whether a woman chooses to have a screening test, a diagnostic test, or no testing is a personal decision; any are reasonable options for any pregnant woman.
ACOG recommends that diagnostic testing should be available to all pregnant women, regardless of age.15 In prenatal series, trisomies 13, 18, and 21 make up approximately two-thirds of all clinically significant aneuploidies.16,17 Given that cfDNA detects only these aneuploidies, the other third will not be identified prenatally in patients who choose cfDNA. Traditional aneuploidy screening has been demonstrated to detect a broader range of these less common but clinically important chromosomal abnormalities.18
In one study of women found to be at increased risk based on traditional multiple marker screening, if cfDNA were chosen instead of diagnostic testing, 17% of the aneuploidies present in this group would not have been detected.18 Of all high-risk women in this study, 2%, or 1 in 50, had a chromosomal abnormality detectable by amniocentesis but not with cfDNA.
Successful tests require adequate placental DNA
Accurate interpretation of cfDNA screening also requires that an adequate quantity of placental DNA be present; this is often referred to as the “fetal fraction.” In some cases, the placental DNA volume is too low for accurate analysis, particularly in obese patients and women with specific chromosomal abnormalities.
Some laboratories measure this and do not report a result if the fetal fraction is below a specific cut-off, typically about 4%. Other laboratories do not measure or exclude cases with too little fetal DNA, raising concern that this could result in missing cases of aneuploidy. It has been noted that a placental DNA fraction of less than 8% is associated with less accurate test results, even if results are returned.8
Low fetal fraction also has been associated with maternal obesity, and in one study cfDNA failed to provide a result in 20% of women weighing more than 250 lb and 50% of women weighing more than 350 lb.19 Therefore, cfDNA is not the best option for obese women (TABLE 4).
TABLE 4 Appropriateness of cfDNA screeningin specific clinical circumstances
Optimal candidates for cfDNA screening
- High risk for trisomy based on maternal age (≥35 years)
- Ultrasound findings suggesting trisomy 13, 18, or 21
- History of prior pregnancy with trisomy 13, 18, or 21
- Positive traditional screening test
- Parental balanced Robertsonian translocation associated with risk for trisomy 13 or 21
Less optimal candidates
- Low risk for trisomy based on age and/or low risk traditional screening
- Ultrasound structural anomalies other than those specifically suggesting trisomy 13, 18, or 21
- High risk for nonchromosomal genetic disorder
- Comprehensive genetic diagnosis desired
- Maternal malignancy
- Maternal organ transplant
- Maternal sex chromosomal mosaicism or other chromosomal abnormality
- Maternal obesity
- Gestational age <10 weeks
While the free fraction is relatively constant from 10 to 22 weeks’ gestation, it is lower earlier than 10 weeks’ gestation and less likely to provide a result. For this reason, the test should not be attempted before 10 weeks’ gestation.
Recent evidence indicates that low fetal DNA fraction is associated with some chromosome abnormalities. Given this association, women with failed cfDNA results should be counseled and offered appropriate follow-up. As the association appears to be greater for trisomies 13 and 18, and triploidy, a careful ultrasound is likely to detect abnormalities in many such cases. However, it also is appropriate to offer the option of diagnostic testing, given the very high risk.
A repeat cfDNA test will be successful in some cases. Whether the patient chooses to attempt cfDNA again may depend in part on maternal body mass index (BMI), as well as gestational age—a patient at a more advanced gestation may not wish to delay obtaining definitive information given the high risk.
cfDNA screening has a low false-positive rate
One of the greatest benefits of cfDNA screening is a lower false-positive rate than is reported with traditional screening. However, when “no results” cases are also considered, the percentage of patients who require follow-up after cfDNA is close to that of traditional screening.
The chance of test failure is reported to be 0.9% to 8.1%,7,9,10 and varies in part by whether the laboratory measures fetal fraction and requires a minimum concentration.
A recent meta-analysis estimated the overall test failure rate at 3%.10 When comparing cfDNA to traditional screening, if “no results” cases are included with the “screen positive” group, the benefits of cfDNA over traditional screening are much less clear, particularly in a low-risk population.
ACOG: Offer traditional multiple-marker screening first
While multiple marker and cfDNA screening have differing performance characteristics, there are no data to support doing both tests concurrently. In fact, in a recent survey of nearly 200 women presented with different testing scenarios, women found it preferable and more reassuring to have a positive traditional screen followed by normal cfDNA results, rather that discrepant results of the 2 tests done concurrently.20
For many reasons, the approach recommended by ACOG and SMFM is to offer traditional multiple-marker screening first, and cfDNA screening or diagnostic testing as a follow-up for patients that screen positive. In that scenario, the benefits and limitations of diagnostic testing versus follow-up with cfDNA screening should be explained carefully.
In all patients who have a positive cfDNA result, diagnostic testing for confirmation should be offered and strongly recommended prior to pregnancy termination if that is considered. Even if a structural abnormality is present and a true positive result is highly likely, karyotyping is important to determine if there may be an inherited translocation putting subsequent pregnancies at higher risk.
Components of pretest counseling
A woman of any age can have a fetus with trisomy or another chromosomal abnormality, and some women prefer diagnostic testing or no testing regardless of age. It is therefore appropriate to offer diagnostic testing, screening, or the option of no testing to all women.
Recent studies have demonstrated that providing well-informed access to all prenatal tests results in more informed choices and no increase in uptake of invasive testing.22 However, the offer of prenatal testing requires discussion of the pros and cons of all test options, including the detection rates of all significant abnormalities, the screen positive rates, and recommended follow-up if an abnormal result is obtained. See TABLE 4.
Cost-effectiveness
Although the detection rate of cfDNA for trisomy 21 is higher than that of traditional screening, the detection rate of traditional screening is also quite high at lower cost. For low-risk women, therefore, traditional screening provides a less expensive alternative to cfDNA. Because aneuploidy is rare in low-risk patients, the residual chance of aneuploidy after a normal traditional screen is very low, and the cost per additional case of Down syndrome detected by cfDNA is very high.
In one study, this was estimated at $3.6 million.23 These authors suggested that, at present, cfDNA is optimally used as a secondary screen for high-risk women. Other cost analyses also have demonstrated that the most cost-effective strategy is a model in which cfDNA is used as a follow-up test in patients found to be screen positive by traditional screening.15,24 A recent cost utility analysis compared outcomes of 6 approaches to prenatal screening, including sequential screening, cfDNA screening, nuchal translucency only, and diagnostic testing with microarray (alone, in combination, or in sequence).
The clinical outcomes included fetal abnormalities detected, taking into account all chromosomal abnormalities, as well as failed cfDNA tests. For younger women (<40 yr), traditional sequential screening provided the highest detection of all abnormalities and was the optimal testing strategy, while cfDNA was preferable for women aged 40 or older, given the higher prevalence of trisomy 21.20
Incidental findings
Given that the cfDNA in maternal serum is a mixture of maternal and placental DNA, a number of biologic phenomena can cause a false-positive cfDNA result. In many cases, these false-positives reveal unanticipated or unexpected maternal conditions and information that the woman may have preferred not to know. A few cases of maternal malignancies with chromosomal abnormalities within the tumor have been reported in patients with false-positive cfDNA results.26
These case reports have raised the question about the need for further evaluation for maternal malignancy in women with false-positive results. Maternal genetic disorders also can cause false-positive results, and may lead to unanticipated detection of adult-onset conditions. In some cases, positive results for sex chromosomal aneuploidy can occur in pregnant women who themselves have a sex chromosomal abnormality, often in mosaic form and previously undiagnosed.27
Again, this has led to discussion of the possible health benefit of karyotyping women who have a false-positive cfDNA result to rule out a mosaic chromosomal abnormality in the mother.
At this time, the clinical utility of such investigations is unknown and there are no recommendations regarding appropriate follow-up for such cases.
CASE Resolved
Given the results of her cfDNA screening, your patient opts to undergo diagnostic testing. In that testing, trisomy 13 is ruled out and she goes on to have a healthy daughter.
Share your thoughts on this article! Send your Letter to the Editor to [email protected]. Please include your name and the city and state in which you practice.
- Bianchi DW, Parker RL, Wentworth J, et al. DNA sequencing versus standard prenatal aneuploidy screening. N Engl J Med. 2014;370(9):799–808.
- Norton ME, Jacobsson B, Swamy GK, et al. Cell-free DNA analysis for noninvasive examination of trisomy. N Engl J Med. 2015;372(17):1589–1597.
- Norton ME, Brar H, Weiss J, et al. Non-Invasive Chromosomal Evaluation (NICE) study: results of a multicenter prospective cohort study for detection of fetal trisomy 21 and trisomy 18. Am J Obstet Gynecol. 2012;207(2):137.e1–e8.
- Chitty LS, Mason S, Barrett AN, et al. Non-invasive prenatal diagnosis of achondroplasia and thanatophoric dysplasia: next-generation sequencing allows for a safer, more accurate, and comprehensive approach. Prenat Diagn. 2015;35(7):656–662.
- Wapner RJ, Babiarz JE, Levy B, et al. Expanding the scope of noninvasive prenatal testing: detection of fetal microdeletion syndromes. Am J Obstet Gynecol. 2015;212(3):332.e1–e9.
- Bianchi DW, Platt LD, Goldberg JD, Abuhamad AZ, Sehnert AJ, Rava RP. Genome-wide fetal aneuploidy detection by maternal plasma DNA sequencing. Obstet Gynecol. 2012;119(5):890–901.
- Palomaki GE, Kloza EM, Lambert-Messerlian GM, et al. DNA sequencing of maternal plasma to detect Down syndrome: an international clinical validation study. Genet Med. 2011;13(11):913–920.
- Sparks AB, Wang ET, Struble CA, et al. DNA sequencing of maternal plasma to detect Down syndrome: an international clinical validation study [abstract]. Proceedings of the ISPD 16th International Conference on Prenatal Diagnosis and Therapy; Miami, Florida; June 3–6, 2012. Prenat Diagn. 2012;32(suppl 1):s3–s9.
- Zimmermann B, Hill M, Gemelos G, et al. Noninvasive prenatal aneuploidy testing of chromosomes 13, 18, 21, X, and Y, using targeted sequencing of polymorphic loci. Prenat Diagn. 2012;32(13):1233–1241.
- Gil MM, Quezada MS, Revello R, Akolekar R, Niclaides KH. Analysis of cell-free DNA in maternal blood in screening for fetal aneuploidies: updated meta-analysis. Ultrasound Obstet Gynecol. 2015;45(3):249–266.
- American College of Obstetricians and Gynecologists. Committee Opinion No. 640: cell-free DNA screening for fetal aneuploidy. Obstet Gynecol. 2015;126(3):e31–e37.
- Society for Maternal-Fetal Medicine (SMFM) Publications Committee. Prenatal aneuploidy screening using cell-free DNA. Am J Obstet Gynecol. 2015;212(6):711–716.
- Baer RJ, Currier RJ, Norton ME, et al. Obstetric, perinatal, and fetal outcomes in pregnancies with false-positive integrated screening results. Obstet Gynecol. 2014;123(3):603–609.
- Dugoff L; Society for Maternal-Fetal Medicine. First- and second-trimester maternal serum markers for aneuploidy and adverse obstetric outcomes. Obstet Gynecol. 2010;115(5):1052–1061.
- American College of Obstetricians and Gynecologists. Practice bulletin No. 88: invasive prenatal testing for aneuploidy. Obstet Gynecol. 2007;110(6):1459–1467.
- Alamillo CM, Krantz D, Evans M, Fiddler M, Pergament E. Nearly a third of abnormalities found after first-trimester screening are different than expected: 10-year experience from a single center. Prenat Diagn. 2013;33(3):251–256.
- Wellesley D, Dolk H, Boyd PA, et al. Rare chromosome abnormalities, prevalence and prenatal diagnosis rates from population-based congenital anomaly registers in Europe. Eur J Hum Genet. 2012;20(5):521–526.
- Norton ME, Jelliffe-Pawlowski LL, Currier RJ. Chromosome abnormalities detected by current prenatal screening and noninvasive prenatal testing. Obstet Gynecol. 2014;124(5):979–986.
- Ashoor G, Syngelaki A, Poon LC, Rezende JC, Nicolaides KH. Fetal fraction in maternal plasma cell-free DNA at 11-13 weeks’ gestation: relation to maternal and fetal characteristics. Ultrasound Obstet Gynecol. 2013;41(1):26–32.
- Kaimal AJ, Norton ME, Kuppermann M. Prenatal testing in the genomic age: clinical outcomes, quality of life, and costs. Obstet Gynecol. 2015;126(4):737–746.
- Wapner RJ, Martin CL, Levy B, et al. Chromosomal microarray versus karyotyping for prenatal diagnosis. N Engl J Med. 2012;367(23):2175–2184.
- Kuppermann M, Pena S, Bishop JT, et al. Effect of enhanced information, values clarification, and removal of financial barriers on use of prenatal genetic testing: a randomized clinical trial. JAMA. 2014;312(12):1210–1217.
- Cuckle H, Benn P, Pergament E. Maternal cfDNA screening for Down syndrome—a cost sensitivity analysis. Prenat Diagn. 2013;33(7):636–642.
- Beulen L, Grutters JPC, Faas BH, Feenstra I, van Vugt JMG, Bekker MN. The consequences of implementing non-invasive prenatal testing in Dutch national health care: a cost-effectiveness analysis. Eur J Obstet Gynecol Reprod Biol. 2014;182:53–61.
- Okun N, Teitelbaum M, Huang T, Dewa CS, Hoch JS. The price of performance: a cost and performance analysis of the implementation of cell-free fetal DNA testing for Down syndrome in Ontario, Canada: Cost and performance analysis of cfDNA testing for Down syndrome in Ontario. Prenat Diagn. 2014;34(4):350–356.
- Bianchi DW, Chudova D, Sehnert AJ, et al. Noninvasive prenatal testing and incidental detection of occult maternal malignancies. JAMA. 2015;314(2):162–169.
- Wang Y, Chen Y, Tian F, et al. Maternal mosaicism is a significant contributor to discordant sex chromosomal aneuploidies associated with noninvasive prenatal testing. Clin Chem. 2014;60(1):251–259.
- Norton ME, Jelliffe-Pawlowski LL, Currier RJ. Chromosome abnormalities detected by current prenatal screening and noninvasive prenatal testing. Obstet Gynecol. 2014;124(5):979–986Society for Maternal-Fetal Medicine (SMFM) Publications Committee. Prenatal aneuploidy screening using cell-free DNA. Am J Obstet Gynecol. 2015;212(6):711–716.
In this Article
- Pros and cons of cfDNA in low-risk patients
- Optimal and less optimal candidates for cfDNA screening
- Checklist for pretest counseling for cfDNA
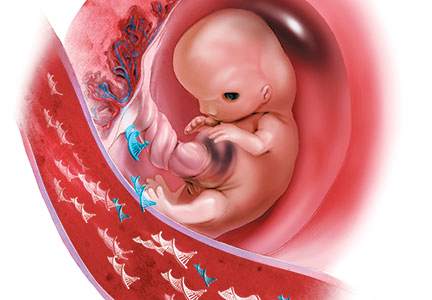
HIV Prevention: A 3-Pronged Approach
› Screen all pregnant women and individuals ages 15 to 65 for human immunodeficiency virus (HIV) infection. A
› Prescribe tenofovir disoproxil fumarate/emtricitabine (Truvada) for pre-exposure prophylaxis for patients at high risk of acquiring HIV. A
› Offer needle and syringe exchange programs and, when appropriate, opioid substitution therapy to individuals who inject drugs. A
Strength of recommendation (SOR)
A Good-quality patient-oriented evidence
B Inconsistent or limited-quality patient-oriented evidence
C Consensus, usual practice, opinion, disease-oriented evidence, case series
Despite advances in human immunodeficiency virus (HIV) screening and treatment over the last 30 years, HIV remains a public health concern. In the United States, after an initial decline, total HIV incidence has failed to significantly decrease in the last 25 years. More than 1.2 million people are living with HIV in the United States, and 12.8% of them (156,300) are unaware they are affected.1 Of those diagnosed with HIV, only 30% are receiving treatment and are virally suppressed.2 Due to structural inequalities and psychosocial factors, African American and Latino patients remain disproportionately affected.3 The incidence of HIV infection among men who have sex with men has increased, and the incidence of HIV infection among people who inject drugs has plateaued after years of progressive decline.4
HIV prevention strategies are highly effective, but in general are underutilized. This article reviews 3 prevention strategies that can be administered by family physicians: HIV screening, pre-exposure prophylaxis (PrEP), and harm reduction.
Who and how to screen for HIV
Early identification of HIV infection generally leads to reduced transmission because diagnosis is associated with decreases in risky behavior.5,6 In addition, antiretroviral therapy (ART) is more effective when initiated early, before the development of advanced immunosuppression.7-9
The “window period” of acute HIV infection (AHI) is the time from when the virus is transmitted to when markers of infection can be detected. Because this window period is associated with high viral transmission rates, family physicians must be familiar with symptoms of AHI (TABLE 1)10,11 and associated risk factors (eg, recent condomless sex or sharing of drug injection equipment with someone who is HIV-positive or of unknown HIV status).
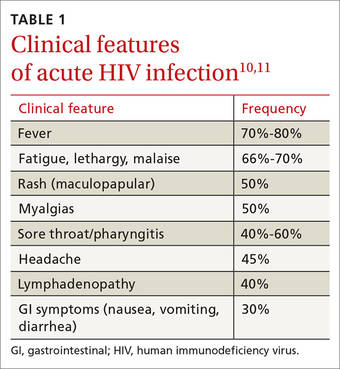
Screening for HIV solely based on the presence of risk factors or clinical symptoms is not enough, however. The United States Preventive Services Task Force (USPSTF) recommends screening all pregnant women and individuals ages 15 to 65 for HIV.12 Screening based solely on risk factors or clinical symptoms frequently leads to missed diagnoses and identification of HIV infection at more advanced stages.13,14 Both the USPSTF and the Centers for Disease Control and Prevention (CDC) recommend universal opt-out screening (patients are informed that HIV screening will be performed and that they may decline testing) because such screening identifies HIV earlier and is associated with higher testing rates than opt-in screening, which requires explicit written consent and extensive pre-test counseling.
Which test to use. HIV screening with a fourth-generation antigen/antibody combination immunoassay—which detects both HIV p24 antigen and HIV antibodies—provides greater diagnostic accuracy than older tests.15 These newer tests detect HIV approximately 15 days after initial infection, reducing the window period of AHI.15,16 If you suspect a patient has AHI, consider early repeat HIV testing with a fourth-generation assay, or initial co-testing with a fourth-generation assay and a nucleic acid amplification test for HIV RNA, which makes it possible to detect infection approximately 5 days earlier than fourth-generation assays.15
Offer pre-exposure prophylaxis to high-risk patients
PrEP is the use of ART prior to HIV exposure to prevent transmission of the virus. It should be used with conventional risk reduction strategies, such as providing condoms, counseling patients about reducing risky behaviors, supporting medication adherence, and screening for and treating other sexually transmitted infections.
The US Food and Drug Administration (FDA) has approved only one medication, Truvada (tenofovir disoproxil fumarate/emtricitabine; TDF/FTC), for use as PrEP. Oral tenofovir-based regimens can effectively prevent HIV transmission,17-20 and strong adherence is associated with a risk reduction of 90% to 100%.17-23 The protective effect of oral PrEP is particularly strong in high-risk populations (eg, men who have sex with men, people who inject drugs), where the number needed to treat to prevent one HIV infection ranges from 12 to 100, depending on the patients’ risk profile.24-26 The CDC and Department of Health and Human Services have issued guidelines for using PrEP in high-risk patients.27
Barriers to implementing PrEP. Despite being highly effective, PrEP is not routinely prescribed to high-risk patients; modeling suggests that current use of PrEP is insufficient to significantly impact the incidence of HIV.28 Demand for PrEP is high among target groups,21,29,30 but patients have expressed concerns about adverse effects31 and stigma related to ART, HIV, and being at risk for HIV.32,33 Young age, lack of social support, low perception of risk, and failure to show up for appointments are also barriers to PrEP use.28,30,34
Some physicians have expressed concern that prescribing PrEP may promote high-risk sexual behavior.35 However, because PrEP is most beneficial in individuals who already engage in high-risk sexual behavior, strategic delivery of PrEP remains an effective risk-reducing strategy.17,18,21,26,36,37 Even in instances where PrEP has been associated with higher-risk sexual behavior and higher rates of sexually transmitted infections, it still prevents as much as 100% of new HIV infections.38
Fear of drug resistance also contributes to slow implementation of PrEP. Drug resistance has been observed in clinical trials of PrEP, but it has been exceedingly rare and predominantly limited to patients who had unrecognized AHI when they started PrEP.39 Furthermore, the few cases of drug resistance attributable to PrEP pale in comparison to the large number of estimated HIV infections averted—infections that would require lifelong ART with its own associated risks of drug resistance. By decreasing HIV transmission, PrEP is expected to decrease total drug resistance.40
Cost is another obstacle. Truvada costs approximately $1,540 per month.41 However, analysis has demonstrated that PrEP is cost-effective when targeted to high-risk patients.42 Most insurance plans cover PrEP, but often require high deductibles and copays; fortunately, this financial burden for patients can be mitigated or eliminated by co-pay assistance programs. The manufacturer of Truvada offers assistance programs for both insured and uninsured patients who are candidates for PrEP; details are available at http://www.truvada.com/truvada-patient-assistance.
Stigma has historically burdened individuals who seek to protect their sexual health, including HIV-negative individuals who are candidates for PrEP. Stigma surrounding HIV may decrease ART-based HIV prevention in men who have sex with men,43 while increasing high-risk behaviors44 and all-cause mortality.45
The resources listed in TABLE 2 can help physicians overcome some of the barriers to implementing PrEP.

How to deliver PrEP
Whether HIV specialists or primary care clinicians are best suited to provide PrEP is a subject of debate. HIV specialists are most familiar with ART and routine monitoring of adherence; however, they have less access to HIV-negative patients, who are the target group for PrEP.35 Family physicians tend to work in closer proximity and maintain longitudinal relationships with PrEP target groups, but in general have less experience with ART and evaluating AHI. Some may argue that competing demands may make it impractical to take a detailed sexual history during a primary care visit.46 In truth, both HIV specialists and family physicians can be appropriately equipped to provide PrEP.
TABLE 3 outlines the steps necessary to provide a patient with PrEP.47 Assessing risk is the initial step; PrEP is beneficial for patients who have one or more risk factors for HIV infection. To be eligible for TDF/FTC, a patient must be HIV-negative, and should be tested for hepatitis B virus (HBV) infection and kidney disease. Because TDF/FTC treats HBV infection, candidates for PrEP who test positive for HBV should be evaluated for treatment of HBV before initiating PrEP. Candidates for PrEP who test negative for HBV infection and immunity should be vaccinated.

Candidates for PrEP should also be screened and monitored for kidney disease. TDF can cause increased serum creatinine due to tubular toxicity. A patient who has an estimated creatinine clearance <60 mL/min should not receive TDF/FTC for PrEP. If a patient’s estimated creatinine clearance falls below 60 mL/min or serum creatinine increases by 0.3 mg/dL above baseline after PrEP is started, TDF/FTC should be discontinued, and the patient should be evaluated for the underlying cause of the kidney disease.27
Before starting PrEP, candidates should be screened for HIV infection and symptoms of AHI. Strongly consider testing for sexually transmitted infections that may increase the risk of HIV transmission, such as syphilis, gonorrhea, or chlamydia.
Candidates who are eligible for PrEP must be counseled on medication adverse effects, adherence strategies, and symptoms of sexually transmitted infections. To initiate PrEP, candidates may be given a one-month supply of TDF/FTC; adherence, adverse effects, and other risk-reduction strategies are assessed at an office visit 3 to 4 weeks later. Subsequent prescriptions are then dispensed as a 3-month supply, with office visits to monitor PrEP scheduled for at least once every 3 months. During these monitoring visits, evaluate the patient’s HIV status, pregnancy status, adherence, adverse effects, risk-reduction behaviors, and indications for continued PrEP. Every 6 months, renal function and sexually transmitted infection status should be reassessed.
Reducing risk of harm among patients who inject drugs

Nonsexual transmission of HIV is a route of high infectivity.48 It includes transfusion of infected blood, sharing of equipment during injection drug use, and percutaneous needle sticks. Sharing of equipment during injection drug use is estimated to account for 8% of new infections in the United States.4
Harm reduction is a collection of strategies meant to reduce complications of illicit drug use, including HIV transmission. These strategies include needle and syringe programs that provide injection drug users with sterile equipment, and opioid substitution therapy.
Needle and syringe programs decrease HIV transmission49 and risky behaviors related to injection drug use,50 but federal funding of such programs is prohibited. Opioid substitution therapy reduces the incidence of HIV,50,51 injection drug use, sharing of drug preparation and injection equipment, and drug-related behaviors associated with a high risk of HIV transmission.50,52 However, in the United States, the quality of these programs varies; a study of opioid substitution therapy delivery found that 22.8% of programs provided doses that were too low to be effective.53
FDA-approved medications for opioid substitution therapy include sublingual buprenorphine, sublingual buprenorphine/naloxone tablets or strips (Suboxone), and oral methadone. Buprenorphine-based regimens can be provided by appropriately trained primary care clinicians; methadone requires a referral to a narcotic treatment program. TABLE 4 provides training and support resources for physicians who want to integrate opioid substitution therapy into their clinical practice.
CORRESPONDENCE
Richard Moore II, MD, 250 Smith Church Road, Roanoke Rapids, NC 27870; [email protected].
1. Hall HI, An Q, Tang T, et al; Centers for Disease Control and Prevention (CDC). Prevalence of diagnosed and undiagnosed HIV infection--United States, 2008-2012. MMWR Morb Mortal Wkly Rep. 2015;64:657-662.
2. Bradley H, Hall HI, Wolitski RJ, et al. Vital signs: HIV diagnosis, care, and treatment among persons living with HIV--United States, 2011. MMWR Morb Mortal Wkly Rep. 2014;63:1113-1117.
3. Maulsby C, Millet G, Lindsey K, et al. HIV among black men who have sex with men (MSM) in the United States: a review of the literature. AIDS Behav. 2014;18:10-25.
4. Centers for Disease Control and Prevention. Estimated HIV incidence among adults and adolescents in the United States, 2007-2010, HIV Surveillance Supplemental Report. 2012. Centers for Disease Control and Prevention Web site. Available at: http://www.cdc.gov/hiv/pdf/statistics_hssr_vol_17_no_4.pdf. Accessed October 8, 2015.
5. Cleary PD, Van Devanter N, Rogers TF, et al. Behavior changes after notification of HIV infection. Am J Public Health. 1991;81:1586-1590.
6. Higgins DL, Galavotti C, O’Reilly KR, et al. Evidence for the effects of HIV antibody counseling and testing on risk behaviors. JAMA. 1991;266:2419-2429.
7. Murphy EL, Collier AC, Kalish LA, et al. Highly active antiretroviral therapy decreases mortality and morbidity in patients with advanced HIV disease. Ann Intern Med. 2001;135:17-26.
8. Palella FJ Jr, Deloria-Knoll M, Chmiel JS, et al. Survival benefit of initiating antiretroviral therapy in HIV-infected persons in different CD4 cell strata. Ann Intern Med. 2003;138:620-626.
9. INSIGHT START Study Group, Lundgren JD, Babiker AG, Gordin F, et al. Initiation of antiretroviral therapy in early asymptomatic HIV infection. N Engl J Med. 2015;373:795-807.
10. Daar ES, Pilcher CD, Hecht FM. Clinical presentation and diagnosis of primary HIV-1 infection. Curr Opin HIV AIDS. 2008;3:10-15.
11. Tindall B, Barker S, Donovan B, et al. Characterization of the acute clinical illness associated with human immunodeficiency virus infection. Arch Intern Med. 1988;148:945-949.
12. Moyer V, US Preventative Services Task Force. Screening for HIV: US Preventive Services Task Force recommendation statement. Ann Intern Med. 2013;159:51-60.
13. Jenkins T, Gardner E, Thrun M, et al. Risk-based HIV testing fails to detect the majority of HIV-infected persons in medical care settings. Sex Transm Dis. 2006;33:329-333.
14. Klein D, Hurley LB, Merrill D, et al. Review of medical encounters in the 5 years before a diagnosis of HIV-1 infection: implications for early detection. J Acquir Immune Defic Syndr. 2003;32:143-152.
15. Pandori M, Hackett J Jr, Louie B, et al. Assessment of the ability of a fourth-generation immunoassay for human immunodeficiency virus (HIV) antibody and p24 antigen to detect both acute and recent HIV infections in a high-risk setting. J Clin Microbiol. 2009;47:2639-2642.
16. Branson BM. The future of HIV testing. J Acquir Imm Defic Syndr. 2010;55 Suppl 2:S102-S105.
17. Grant RM, Lama JR, Anderson PL, et al; iPrEx Study Team. Preexposure chemoprophylaxis for HIV prevention in men who have sex with men. N Engl J Med. 2010;363:2587-2599.
18. Baeten JM, Donnell D, Ndase P, et al; Partners PrEP Study Team. Antiretroviral prophylaxis for HIV prevention in heterosexual men and women. N Engl J Med. 2012;367:399-410.
19. Thigpen MC, Kebaabetswe PM, Paxton LA, et al. Antiretroviral preexposure prophylaxis for heterosexual HIV transmission in Botswana. N Engl J Med. 2012;367:423-434.
20. Choopanya K, Martin M, Suntharasamai P, et al. Antiretroviral prophylaxis for HIV infection in injecting drug users in Bangkok, Thailand (the Bangkok Tenofovir Study): a randomised, doubleblind, placebo-controlled phase 3 trial. Lancet. 2013;381:2083-2090.
21. Grant RM, Anderson PL, McMahan V, et al. Uptake of pre-exposure prophylaxis, sexual practices, and HIV incidence in men and transgender women who have sex with men: a cohort study. Lancet Infect Dis. 2014;14:820-829.
22. Anderson PL, Glidden DV, Liu A, et al. Emtricitabine-tenofovir concentrations and pre-exposure prophylaxis efficacy in men who have sex with men. Sci Transl Med. 2012;4:151ra125.
23. Henderson FL, Taylor AW, Chirwa LI, et al. Characteristics and oral PrEP adherence in the TDF2 open-label extension in Botswana. Paper presented at International AIDS Society Conference on HIV Pathogenesis, Treatment and Prevention; July 1922, 2015; Vancouver, Canada.
24. Murnane PM, Celum C, Mugo N, et al. Efficacy of preexposure prophylaxis for HIV-1 prevention among high-risk heterosexuals: subgroup analyses from a randomized trial. AIDS. 2013;27:2155-2160.
25. Heffron R, Mugo N, Were E, et al. Preexposure prophylaxis is efficacious for HIV-1 prevention among women using depot medroxyprogesterone acetate for contraception. AIDS. 2014;28:2771-2776.
26. Buchbinder SP, Glidden DV, Liu AY, et al. HIV pre-exposure prophylaxis in men who have sex with men and transgender women: a secondary analysis of a phase 3 randomised controlled efficacy trial. Lancet Infect Dis. 2014;14:468-475.
27. Center for Disease Control and Prevention. Preexposure prophylaxis for the prevention of HIV infection in the United States – 2014. Centers for Disease Control and Prevention Web site. Available at: http://www.cdc.gov/hiv/pdf/PrEPguidelines2014.pdf. Accessed June 18, 2015.
28. Grant RM. Scale-up of preexposure prophylaxis in San Francisco to impact HIV incidence. Abstract 25. Paper presented at Conference on Retroviruses and Opportunistic Infections; February 23-26, 2015; Seattle, WA.
29. Cohen SE, Vittinghoff E, Bacon O, et al. High interest in preexposure prophylaxis among men who have sex with men at risk for HIV infection: baseline data from the US PrEP demonstration project. J Acquir Immune Defic Syndr. 2015;68:439-448.
30. Haberer JE, Baeten JM, Campbell J, et al. Adherence to antiretroviral prophylaxis for HIV prevention: a substudy cohort within a clinical trial of serodiscordant couples in East Africa. PLoS Med. 2013;10:e1001511.
31. Gilmore H, Koester K, Liu A, et al. To PrEP or not to PrEP: Perspectives from US iPrEx open label extension (OLE) participants. Abstract 440. Paper presented at 9th International Conference on HIV Treatment and Prevention Adherence; June 9, 2014; Miami Beach, FL.
32. Jain S, Gregor C, Krakower D, et al. Attitudes and interest toward HIV pre-exposure prophylaxis (PrEP) among participants using HIV non-occupational post-exposure prophylaxis (NPEP). Poster Abstract 1523. Poster presented at Infectious Disease Society of America Conference; October 8-12, 2014; Philadelphia, PA.
33. van der Straten A, Stadler J, Luecke E, et al; VOICE-C Study Team, Perspectives on use of oral and vaginal antiretrovirals for HIV prevention: the VOICE-C qualitative study in Johannesburg, South Africa. J Int AIDS Soc. 2014;17:19146.
34. Corneli AL, McKenna K, Headley J, et al; FEM-PrEP Study Group. A descriptive analysis of perceptions of HIV risk and worry about acquiring HIV among FEM-PrEP participants who seroconverted in Bondo, Kenya, and Pretoria, South Africa. J Int AIDS Soc. 2014;17:19152.
35. Krakower D, Ware N, Mitty JA, et al. HIV providers’ perceived barriers and facilitators to implementing pre-exposure prophylaxis in care settings: a qualitative study. AIDS Behav. 2014;18:1712-1721.
36. McCormack S, Dunn DT, Desai M, et al. Pre-exposure prophylaxis to prevent the acquisition of HIV-1 infection (PROUD): effectiveness results from the pilot phase of a pragmatic open-label randomised trial. Lancet. 2015. [Epub ahead of print].
37. Mugwanya KK, Donnell D, Celum C, et al. Sexual behaviour of heterosexual men and women receiving antiretroviral pre-exposure prophylaxis for HIV prevention: a longitudinal analysis. Lancet Infect Dis. 2013;13:1021-1028.
38. Volk JE, Marcus JL, Phengrasamy T, et al. No new HIV infections with increasing use of HIV preexposure prophylaxis in a clinical practice setting. Clin Infect Dis. 2015;61:1601-1603.
39. Lehman DA, Baeten JM, McCoy CO, et al. Risk of drug resistance among persons acquiring HIV within a randomized clinical trial of single- or dual-agent preexposure prophylaxis. J Infect Dis. 2015;211:1211-1218.
40. Supervie V, Garcia-Lerma JG, Heneine W, et al. HIV, transmitted drug resistance, and the paradox of preexposure prophylaxis. Proc Natl Acad Sci U S A. 2010;107:12381-12386.
41. AIDSinfo. Cost considerations and antiretroviral therapy. AIDSinfo Web site. Available at: https://aidsinfo.nih.gov/guidelines/html/1/adult-and-adolescent-arv-guidelines/459/cost-considerations-and-antiretroviral-therapy. Accessed December 14, 2015.
42. Gomez GB, Borquez A, Case KK, et al. The cost and impact of scaling up pre-exposure prophylaxis for HIV prevention: a systematic review of cost-effectiveness modelling studies. PLoS Med. 2013;10:e1001401.
43. Oldenburg CE, Perez-Brumer AG, Hatzenbuehler ML, et al. State-level structural sexual stigma and HIV prevention in a national online sample of HIV-uninfected MSM in the United States. AIDS. 2015;29:837-845.
44. Hatzenbuehler ML, O’Cleirigh C, Mayer KH, et al. Prospective associations between HIV-related stigma, transmission risk behaviors, and adverse mental health outcomes in men who have sex with men. Ann Behav Med. 2011;42:227-234.
45. Hatzenbuehler ML, Bellatorre A, Lee Y, et al. Structural stigma and all-cause mortality in sexual minority populations. Soc Sci Med. 2014;103:33-41.
46. Arnold EA, Hazelton P, Lane T, et al. A qualitative study of provider thoughts on implementing pre-exposure prophylaxis (PrEP) in clinical settings to prevent HIV infection. PLoS One. 2012;7:e40603.
47. North Carolina AIDS Training and Education Center. For PrEP Providers. North Carolina AIDS Training and Education Center Web site. Available at: http://www.med.unc.edu/ncaidstraining/prep/for-providers/for-prep-prescribers. Accessed July 7, 2015.
48. Patel P, Borkowf CB, Brook JT, et al. Estimating per-act HIV transmission risk: a systematic review. AIDS. 2014;28:1509-1519.
49. Aspinall EJ, Nambiar D, Goldberg DJ, et al. Are needle and syringe programmes associated with a reduction in HIV transmission among people who inject drugs: a systematic review and metaanalysis. Int J Epidemiol. 2014;43:235-248.
50. MacArthur GJ, van Velzen E, Palmateer N, et al. Interventions to prevent HIV and Hepatitis C in people who inject drugs: a review of reviews to assess evidence of effectiveness. Int J Drug Policy. 2014;25:34-52.
51. MacArthur GJ, Minozzi S, Martin N, et al. Opiate substitution treatment and HIV transmission in people who inject drugs: systematic review and meta-analysis. BMJ. 2012;345:e5945.
52. Gowing L, Farrell MF, Bornemann R, et al. Oral substitution treatment of injecting opioid users for prevention of HIV infection. Cochrane Database Syst Rev. 2011;(8):CD004145.
53. D’Aunno T, Pollack HA, Frimpong JA, et al. Evidence-based treatment for opioid disorders: a 23-year national study of methadone dose levels. J Subst Abuse Treat. 2014;47:245-250.
› Screen all pregnant women and individuals ages 15 to 65 for human immunodeficiency virus (HIV) infection. A
› Prescribe tenofovir disoproxil fumarate/emtricitabine (Truvada) for pre-exposure prophylaxis for patients at high risk of acquiring HIV. A
› Offer needle and syringe exchange programs and, when appropriate, opioid substitution therapy to individuals who inject drugs. A
Strength of recommendation (SOR)
A Good-quality patient-oriented evidence
B Inconsistent or limited-quality patient-oriented evidence
C Consensus, usual practice, opinion, disease-oriented evidence, case series
Despite advances in human immunodeficiency virus (HIV) screening and treatment over the last 30 years, HIV remains a public health concern. In the United States, after an initial decline, total HIV incidence has failed to significantly decrease in the last 25 years. More than 1.2 million people are living with HIV in the United States, and 12.8% of them (156,300) are unaware they are affected.1 Of those diagnosed with HIV, only 30% are receiving treatment and are virally suppressed.2 Due to structural inequalities and psychosocial factors, African American and Latino patients remain disproportionately affected.3 The incidence of HIV infection among men who have sex with men has increased, and the incidence of HIV infection among people who inject drugs has plateaued after years of progressive decline.4
HIV prevention strategies are highly effective, but in general are underutilized. This article reviews 3 prevention strategies that can be administered by family physicians: HIV screening, pre-exposure prophylaxis (PrEP), and harm reduction.
Who and how to screen for HIV
Early identification of HIV infection generally leads to reduced transmission because diagnosis is associated with decreases in risky behavior.5,6 In addition, antiretroviral therapy (ART) is more effective when initiated early, before the development of advanced immunosuppression.7-9
The “window period” of acute HIV infection (AHI) is the time from when the virus is transmitted to when markers of infection can be detected. Because this window period is associated with high viral transmission rates, family physicians must be familiar with symptoms of AHI (TABLE 1)10,11 and associated risk factors (eg, recent condomless sex or sharing of drug injection equipment with someone who is HIV-positive or of unknown HIV status).
Screening for HIV solely based on the presence of risk factors or clinical symptoms is not enough, however. The United States Preventive Services Task Force (USPSTF) recommends screening all pregnant women and individuals ages 15 to 65 for HIV.12 Screening based solely on risk factors or clinical symptoms frequently leads to missed diagnoses and identification of HIV infection at more advanced stages.13,14 Both the USPSTF and the Centers for Disease Control and Prevention (CDC) recommend universal opt-out screening (patients are informed that HIV screening will be performed and that they may decline testing) because such screening identifies HIV earlier and is associated with higher testing rates than opt-in screening, which requires explicit written consent and extensive pre-test counseling.
Which test to use. HIV screening with a fourth-generation antigen/antibody combination immunoassay—which detects both HIV p24 antigen and HIV antibodies—provides greater diagnostic accuracy than older tests.15 These newer tests detect HIV approximately 15 days after initial infection, reducing the window period of AHI.15,16 If you suspect a patient has AHI, consider early repeat HIV testing with a fourth-generation assay, or initial co-testing with a fourth-generation assay and a nucleic acid amplification test for HIV RNA, which makes it possible to detect infection approximately 5 days earlier than fourth-generation assays.15
Offer pre-exposure prophylaxis to high-risk patients
PrEP is the use of ART prior to HIV exposure to prevent transmission of the virus. It should be used with conventional risk reduction strategies, such as providing condoms, counseling patients about reducing risky behaviors, supporting medication adherence, and screening for and treating other sexually transmitted infections.
The US Food and Drug Administration (FDA) has approved only one medication, Truvada (tenofovir disoproxil fumarate/emtricitabine; TDF/FTC), for use as PrEP. Oral tenofovir-based regimens can effectively prevent HIV transmission,17-20 and strong adherence is associated with a risk reduction of 90% to 100%.17-23 The protective effect of oral PrEP is particularly strong in high-risk populations (eg, men who have sex with men, people who inject drugs), where the number needed to treat to prevent one HIV infection ranges from 12 to 100, depending on the patients’ risk profile.24-26 The CDC and Department of Health and Human Services have issued guidelines for using PrEP in high-risk patients.27
Barriers to implementing PrEP. Despite being highly effective, PrEP is not routinely prescribed to high-risk patients; modeling suggests that current use of PrEP is insufficient to significantly impact the incidence of HIV.28 Demand for PrEP is high among target groups,21,29,30 but patients have expressed concerns about adverse effects31 and stigma related to ART, HIV, and being at risk for HIV.32,33 Young age, lack of social support, low perception of risk, and failure to show up for appointments are also barriers to PrEP use.28,30,34
Some physicians have expressed concern that prescribing PrEP may promote high-risk sexual behavior.35 However, because PrEP is most beneficial in individuals who already engage in high-risk sexual behavior, strategic delivery of PrEP remains an effective risk-reducing strategy.17,18,21,26,36,37 Even in instances where PrEP has been associated with higher-risk sexual behavior and higher rates of sexually transmitted infections, it still prevents as much as 100% of new HIV infections.38
Fear of drug resistance also contributes to slow implementation of PrEP. Drug resistance has been observed in clinical trials of PrEP, but it has been exceedingly rare and predominantly limited to patients who had unrecognized AHI when they started PrEP.39 Furthermore, the few cases of drug resistance attributable to PrEP pale in comparison to the large number of estimated HIV infections averted—infections that would require lifelong ART with its own associated risks of drug resistance. By decreasing HIV transmission, PrEP is expected to decrease total drug resistance.40
Cost is another obstacle. Truvada costs approximately $1,540 per month.41 However, analysis has demonstrated that PrEP is cost-effective when targeted to high-risk patients.42 Most insurance plans cover PrEP, but often require high deductibles and copays; fortunately, this financial burden for patients can be mitigated or eliminated by co-pay assistance programs. The manufacturer of Truvada offers assistance programs for both insured and uninsured patients who are candidates for PrEP; details are available at http://www.truvada.com/truvada-patient-assistance.
Stigma has historically burdened individuals who seek to protect their sexual health, including HIV-negative individuals who are candidates for PrEP. Stigma surrounding HIV may decrease ART-based HIV prevention in men who have sex with men,43 while increasing high-risk behaviors44 and all-cause mortality.45
The resources listed in TABLE 2 can help physicians overcome some of the barriers to implementing PrEP.
How to deliver PrEP
Whether HIV specialists or primary care clinicians are best suited to provide PrEP is a subject of debate. HIV specialists are most familiar with ART and routine monitoring of adherence; however, they have less access to HIV-negative patients, who are the target group for PrEP.35 Family physicians tend to work in closer proximity and maintain longitudinal relationships with PrEP target groups, but in general have less experience with ART and evaluating AHI. Some may argue that competing demands may make it impractical to take a detailed sexual history during a primary care visit.46 In truth, both HIV specialists and family physicians can be appropriately equipped to provide PrEP.
TABLE 3 outlines the steps necessary to provide a patient with PrEP.47 Assessing risk is the initial step; PrEP is beneficial for patients who have one or more risk factors for HIV infection. To be eligible for TDF/FTC, a patient must be HIV-negative, and should be tested for hepatitis B virus (HBV) infection and kidney disease. Because TDF/FTC treats HBV infection, candidates for PrEP who test positive for HBV should be evaluated for treatment of HBV before initiating PrEP. Candidates for PrEP who test negative for HBV infection and immunity should be vaccinated.
Candidates for PrEP should also be screened and monitored for kidney disease. TDF can cause increased serum creatinine due to tubular toxicity. A patient who has an estimated creatinine clearance <60 mL/min should not receive TDF/FTC for PrEP. If a patient’s estimated creatinine clearance falls below 60 mL/min or serum creatinine increases by 0.3 mg/dL above baseline after PrEP is started, TDF/FTC should be discontinued, and the patient should be evaluated for the underlying cause of the kidney disease.27
Before starting PrEP, candidates should be screened for HIV infection and symptoms of AHI. Strongly consider testing for sexually transmitted infections that may increase the risk of HIV transmission, such as syphilis, gonorrhea, or chlamydia.
Candidates who are eligible for PrEP must be counseled on medication adverse effects, adherence strategies, and symptoms of sexually transmitted infections. To initiate PrEP, candidates may be given a one-month supply of TDF/FTC; adherence, adverse effects, and other risk-reduction strategies are assessed at an office visit 3 to 4 weeks later. Subsequent prescriptions are then dispensed as a 3-month supply, with office visits to monitor PrEP scheduled for at least once every 3 months. During these monitoring visits, evaluate the patient’s HIV status, pregnancy status, adherence, adverse effects, risk-reduction behaviors, and indications for continued PrEP. Every 6 months, renal function and sexually transmitted infection status should be reassessed.
Reducing risk of harm among patients who inject drugs
Nonsexual transmission of HIV is a route of high infectivity.48 It includes transfusion of infected blood, sharing of equipment during injection drug use, and percutaneous needle sticks. Sharing of equipment during injection drug use is estimated to account for 8% of new infections in the United States.4
Harm reduction is a collection of strategies meant to reduce complications of illicit drug use, including HIV transmission. These strategies include needle and syringe programs that provide injection drug users with sterile equipment, and opioid substitution therapy.
Needle and syringe programs decrease HIV transmission49 and risky behaviors related to injection drug use,50 but federal funding of such programs is prohibited. Opioid substitution therapy reduces the incidence of HIV,50,51 injection drug use, sharing of drug preparation and injection equipment, and drug-related behaviors associated with a high risk of HIV transmission.50,52 However, in the United States, the quality of these programs varies; a study of opioid substitution therapy delivery found that 22.8% of programs provided doses that were too low to be effective.53
FDA-approved medications for opioid substitution therapy include sublingual buprenorphine, sublingual buprenorphine/naloxone tablets or strips (Suboxone), and oral methadone. Buprenorphine-based regimens can be provided by appropriately trained primary care clinicians; methadone requires a referral to a narcotic treatment program. TABLE 4 provides training and support resources for physicians who want to integrate opioid substitution therapy into their clinical practice.
CORRESPONDENCE
Richard Moore II, MD, 250 Smith Church Road, Roanoke Rapids, NC 27870; [email protected].
1. Hall HI, An Q, Tang T, et al; Centers for Disease Control and Prevention (CDC). Prevalence of diagnosed and undiagnosed HIV infection--United States, 2008-2012. MMWR Morb Mortal Wkly Rep. 2015;64:657-662.
2. Bradley H, Hall HI, Wolitski RJ, et al. Vital signs: HIV diagnosis, care, and treatment among persons living with HIV--United States, 2011. MMWR Morb Mortal Wkly Rep. 2014;63:1113-1117.
3. Maulsby C, Millet G, Lindsey K, et al. HIV among black men who have sex with men (MSM) in the United States: a review of the literature. AIDS Behav. 2014;18:10-25.
4. Centers for Disease Control and Prevention. Estimated HIV incidence among adults and adolescents in the United States, 2007-2010, HIV Surveillance Supplemental Report. 2012. Centers for Disease Control and Prevention Web site. Available at: http://www.cdc.gov/hiv/pdf/statistics_hssr_vol_17_no_4.pdf. Accessed October 8, 2015.
5. Cleary PD, Van Devanter N, Rogers TF, et al. Behavior changes after notification of HIV infection. Am J Public Health. 1991;81:1586-1590.
6. Higgins DL, Galavotti C, O’Reilly KR, et al. Evidence for the effects of HIV antibody counseling and testing on risk behaviors. JAMA. 1991;266:2419-2429.
7. Murphy EL, Collier AC, Kalish LA, et al. Highly active antiretroviral therapy decreases mortality and morbidity in patients with advanced HIV disease. Ann Intern Med. 2001;135:17-26.
8. Palella FJ Jr, Deloria-Knoll M, Chmiel JS, et al. Survival benefit of initiating antiretroviral therapy in HIV-infected persons in different CD4 cell strata. Ann Intern Med. 2003;138:620-626.
9. INSIGHT START Study Group, Lundgren JD, Babiker AG, Gordin F, et al. Initiation of antiretroviral therapy in early asymptomatic HIV infection. N Engl J Med. 2015;373:795-807.
10. Daar ES, Pilcher CD, Hecht FM. Clinical presentation and diagnosis of primary HIV-1 infection. Curr Opin HIV AIDS. 2008;3:10-15.
11. Tindall B, Barker S, Donovan B, et al. Characterization of the acute clinical illness associated with human immunodeficiency virus infection. Arch Intern Med. 1988;148:945-949.
12. Moyer V, US Preventative Services Task Force. Screening for HIV: US Preventive Services Task Force recommendation statement. Ann Intern Med. 2013;159:51-60.
13. Jenkins T, Gardner E, Thrun M, et al. Risk-based HIV testing fails to detect the majority of HIV-infected persons in medical care settings. Sex Transm Dis. 2006;33:329-333.
14. Klein D, Hurley LB, Merrill D, et al. Review of medical encounters in the 5 years before a diagnosis of HIV-1 infection: implications for early detection. J Acquir Immune Defic Syndr. 2003;32:143-152.
15. Pandori M, Hackett J Jr, Louie B, et al. Assessment of the ability of a fourth-generation immunoassay for human immunodeficiency virus (HIV) antibody and p24 antigen to detect both acute and recent HIV infections in a high-risk setting. J Clin Microbiol. 2009;47:2639-2642.
16. Branson BM. The future of HIV testing. J Acquir Imm Defic Syndr. 2010;55 Suppl 2:S102-S105.
17. Grant RM, Lama JR, Anderson PL, et al; iPrEx Study Team. Preexposure chemoprophylaxis for HIV prevention in men who have sex with men. N Engl J Med. 2010;363:2587-2599.
18. Baeten JM, Donnell D, Ndase P, et al; Partners PrEP Study Team. Antiretroviral prophylaxis for HIV prevention in heterosexual men and women. N Engl J Med. 2012;367:399-410.
19. Thigpen MC, Kebaabetswe PM, Paxton LA, et al. Antiretroviral preexposure prophylaxis for heterosexual HIV transmission in Botswana. N Engl J Med. 2012;367:423-434.
20. Choopanya K, Martin M, Suntharasamai P, et al. Antiretroviral prophylaxis for HIV infection in injecting drug users in Bangkok, Thailand (the Bangkok Tenofovir Study): a randomised, doubleblind, placebo-controlled phase 3 trial. Lancet. 2013;381:2083-2090.
21. Grant RM, Anderson PL, McMahan V, et al. Uptake of pre-exposure prophylaxis, sexual practices, and HIV incidence in men and transgender women who have sex with men: a cohort study. Lancet Infect Dis. 2014;14:820-829.
22. Anderson PL, Glidden DV, Liu A, et al. Emtricitabine-tenofovir concentrations and pre-exposure prophylaxis efficacy in men who have sex with men. Sci Transl Med. 2012;4:151ra125.
23. Henderson FL, Taylor AW, Chirwa LI, et al. Characteristics and oral PrEP adherence in the TDF2 open-label extension in Botswana. Paper presented at International AIDS Society Conference on HIV Pathogenesis, Treatment and Prevention; July 1922, 2015; Vancouver, Canada.
24. Murnane PM, Celum C, Mugo N, et al. Efficacy of preexposure prophylaxis for HIV-1 prevention among high-risk heterosexuals: subgroup analyses from a randomized trial. AIDS. 2013;27:2155-2160.
25. Heffron R, Mugo N, Were E, et al. Preexposure prophylaxis is efficacious for HIV-1 prevention among women using depot medroxyprogesterone acetate for contraception. AIDS. 2014;28:2771-2776.
26. Buchbinder SP, Glidden DV, Liu AY, et al. HIV pre-exposure prophylaxis in men who have sex with men and transgender women: a secondary analysis of a phase 3 randomised controlled efficacy trial. Lancet Infect Dis. 2014;14:468-475.
27. Center for Disease Control and Prevention. Preexposure prophylaxis for the prevention of HIV infection in the United States – 2014. Centers for Disease Control and Prevention Web site. Available at: http://www.cdc.gov/hiv/pdf/PrEPguidelines2014.pdf. Accessed June 18, 2015.
28. Grant RM. Scale-up of preexposure prophylaxis in San Francisco to impact HIV incidence. Abstract 25. Paper presented at Conference on Retroviruses and Opportunistic Infections; February 23-26, 2015; Seattle, WA.
29. Cohen SE, Vittinghoff E, Bacon O, et al. High interest in preexposure prophylaxis among men who have sex with men at risk for HIV infection: baseline data from the US PrEP demonstration project. J Acquir Immune Defic Syndr. 2015;68:439-448.
30. Haberer JE, Baeten JM, Campbell J, et al. Adherence to antiretroviral prophylaxis for HIV prevention: a substudy cohort within a clinical trial of serodiscordant couples in East Africa. PLoS Med. 2013;10:e1001511.
31. Gilmore H, Koester K, Liu A, et al. To PrEP or not to PrEP: Perspectives from US iPrEx open label extension (OLE) participants. Abstract 440. Paper presented at 9th International Conference on HIV Treatment and Prevention Adherence; June 9, 2014; Miami Beach, FL.
32. Jain S, Gregor C, Krakower D, et al. Attitudes and interest toward HIV pre-exposure prophylaxis (PrEP) among participants using HIV non-occupational post-exposure prophylaxis (NPEP). Poster Abstract 1523. Poster presented at Infectious Disease Society of America Conference; October 8-12, 2014; Philadelphia, PA.
33. van der Straten A, Stadler J, Luecke E, et al; VOICE-C Study Team, Perspectives on use of oral and vaginal antiretrovirals for HIV prevention: the VOICE-C qualitative study in Johannesburg, South Africa. J Int AIDS Soc. 2014;17:19146.
34. Corneli AL, McKenna K, Headley J, et al; FEM-PrEP Study Group. A descriptive analysis of perceptions of HIV risk and worry about acquiring HIV among FEM-PrEP participants who seroconverted in Bondo, Kenya, and Pretoria, South Africa. J Int AIDS Soc. 2014;17:19152.
35. Krakower D, Ware N, Mitty JA, et al. HIV providers’ perceived barriers and facilitators to implementing pre-exposure prophylaxis in care settings: a qualitative study. AIDS Behav. 2014;18:1712-1721.
36. McCormack S, Dunn DT, Desai M, et al. Pre-exposure prophylaxis to prevent the acquisition of HIV-1 infection (PROUD): effectiveness results from the pilot phase of a pragmatic open-label randomised trial. Lancet. 2015. [Epub ahead of print].
37. Mugwanya KK, Donnell D, Celum C, et al. Sexual behaviour of heterosexual men and women receiving antiretroviral pre-exposure prophylaxis for HIV prevention: a longitudinal analysis. Lancet Infect Dis. 2013;13:1021-1028.
38. Volk JE, Marcus JL, Phengrasamy T, et al. No new HIV infections with increasing use of HIV preexposure prophylaxis in a clinical practice setting. Clin Infect Dis. 2015;61:1601-1603.
39. Lehman DA, Baeten JM, McCoy CO, et al. Risk of drug resistance among persons acquiring HIV within a randomized clinical trial of single- or dual-agent preexposure prophylaxis. J Infect Dis. 2015;211:1211-1218.
40. Supervie V, Garcia-Lerma JG, Heneine W, et al. HIV, transmitted drug resistance, and the paradox of preexposure prophylaxis. Proc Natl Acad Sci U S A. 2010;107:12381-12386.
41. AIDSinfo. Cost considerations and antiretroviral therapy. AIDSinfo Web site. Available at: https://aidsinfo.nih.gov/guidelines/html/1/adult-and-adolescent-arv-guidelines/459/cost-considerations-and-antiretroviral-therapy. Accessed December 14, 2015.
42. Gomez GB, Borquez A, Case KK, et al. The cost and impact of scaling up pre-exposure prophylaxis for HIV prevention: a systematic review of cost-effectiveness modelling studies. PLoS Med. 2013;10:e1001401.
43. Oldenburg CE, Perez-Brumer AG, Hatzenbuehler ML, et al. State-level structural sexual stigma and HIV prevention in a national online sample of HIV-uninfected MSM in the United States. AIDS. 2015;29:837-845.
44. Hatzenbuehler ML, O’Cleirigh C, Mayer KH, et al. Prospective associations between HIV-related stigma, transmission risk behaviors, and adverse mental health outcomes in men who have sex with men. Ann Behav Med. 2011;42:227-234.
45. Hatzenbuehler ML, Bellatorre A, Lee Y, et al. Structural stigma and all-cause mortality in sexual minority populations. Soc Sci Med. 2014;103:33-41.
46. Arnold EA, Hazelton P, Lane T, et al. A qualitative study of provider thoughts on implementing pre-exposure prophylaxis (PrEP) in clinical settings to prevent HIV infection. PLoS One. 2012;7:e40603.
47. North Carolina AIDS Training and Education Center. For PrEP Providers. North Carolina AIDS Training and Education Center Web site. Available at: http://www.med.unc.edu/ncaidstraining/prep/for-providers/for-prep-prescribers. Accessed July 7, 2015.
48. Patel P, Borkowf CB, Brook JT, et al. Estimating per-act HIV transmission risk: a systematic review. AIDS. 2014;28:1509-1519.
49. Aspinall EJ, Nambiar D, Goldberg DJ, et al. Are needle and syringe programmes associated with a reduction in HIV transmission among people who inject drugs: a systematic review and metaanalysis. Int J Epidemiol. 2014;43:235-248.
50. MacArthur GJ, van Velzen E, Palmateer N, et al. Interventions to prevent HIV and Hepatitis C in people who inject drugs: a review of reviews to assess evidence of effectiveness. Int J Drug Policy. 2014;25:34-52.
51. MacArthur GJ, Minozzi S, Martin N, et al. Opiate substitution treatment and HIV transmission in people who inject drugs: systematic review and meta-analysis. BMJ. 2012;345:e5945.
52. Gowing L, Farrell MF, Bornemann R, et al. Oral substitution treatment of injecting opioid users for prevention of HIV infection. Cochrane Database Syst Rev. 2011;(8):CD004145.
53. D’Aunno T, Pollack HA, Frimpong JA, et al. Evidence-based treatment for opioid disorders: a 23-year national study of methadone dose levels. J Subst Abuse Treat. 2014;47:245-250.

Updates in Pediatrics
TALKING OUT CHILDHOOD OBESITY
Resnicow K, McMaster F, Bocian A, et al. Motivational interviewing and dietary counseling for obesity in primary care: an RCT. Pediatrics. 2015;135(4):649-657.
Counseling parents of overweight children using motivational interviewing from both health care providers and registered dietitians can significantly improve BMI, according to a study of 42 practices in the Pediatric Research in Office Settings Network of the American Academy of Pediatrics.
Researchers randomly assigned parents of overweight children, ages 2 through 8, to one of three groups: (1) usual care, (2) four provider-delivered motivational interviewing sessions over two years, or (3) four provider-delivered motivational interviewing sessions plus six sessions with a registered dietitian over two years. At study end, BMI percentile and change in BMI for the different groups were as follows:

COMMENTARY
The results of this study are exciting. Motivational interviewing is a technique in which the practitioner asks questions of a patient and allows the patient to discover his/her own conclusions about the topic. By so doing, the patient is more engaged in the discussion and is less resistant to input. This technique, with excellent evidence of effectiveness in the area of drug and alcohol abuse, has been shown to facilitate effective behavioral change in many areas and is recommended by the American Heart Association for behavioral change in adults.1,2 This is an exciting paper demonstrating evidence-based efficacy in addressing childhood obesity—a critical health issue—and is worth trying in the office.
1. Rubak S, Sandbaek A, Lauritzen T, Christensen B. Motivational interviewing: a systematic review and meta-analysis. Br J Gen Pract. 2005;55(513):305-312.
2. Spring B, Ockene JK, Gidding SS, et al; American Heart Association Behavior Change Committee of the Council on Epidemiology and Prevention, Council on Lifestyle and Cardiometabolic Health, Council for High Blood Pressure Research, and Council on Cardiovascular and Stroke Nursing. Better population health through behavior change in adults: a call to action. Circulation. 2013;128(19):2169-2176. doi: 10.1161/01.cir.0000435173.25936.e1.
Continue for long-acting reversible contraception among teens >>
LONG-ACTING REVERSIBLE CONTRACEPTION AMONG TEENS
Romero L, Pazol K, Warner L, et al. Vital signs: trends in use of long-acting reversible contraception among teens aged 15-19 years seeking contraceptive services – United States, 2005-2013. MMWR Morb Mortal Wkly Rep. 2015;64(13):363-369.
Efforts to improve teen access to long-acting reversible contraception (LARC) have increased use of these methods, according to a CDC review of services provided at Title X National Family Planning Program centers. The report found
• LARC rates among teen patients increased from 0.4% in 2005 to 7.2% in 2013.
• In 2013, 2.8% of those seeking contraception used IUDs and 4.3% used implants.
• Among Title X patients, 7.6% of 18- and 19-year-olds used LARC, compared with 6.5% of 15- to 17-year-olds.
• Rates of LARC were lowest in Mississippi (0.7%) and highest in Colorado (25.8%).
COMMENTARY
LARCs, which include IUD and implantable hormonal contraceptive devices, require no effort for adherence on the part of the user; once in place, they are effective without further action. Current CDC guidelines on contraceptive use clearly recommend LARC for teenagers based on the efficacy and safety.1 LARCs are favored for teenagers because poor compliance has yielded suboptimal effectiveness of oral contraceptives and condoms in teenagers, who often forget to take their birth control pills or don’t use condoms when they should. Many clinicians have been slow to recommend LARCs in teenagers based on safety concerns related to adverse experience with IUDs 20 to 30 years ago. According to CDC guidelines, IUDs and implantable contraceptive devices now have robust safety data, and this article shows that they are being increasingly made available to teenagers who need them.
1. Division of Reproductive Health, National Center for Chronic Disease Prevention and Health Promotion, CDC. US Selected Practice Recommendations for Contraceptive Use, 2013: adapted from the World Health Organization selected practice recommendations for contraceptive use, 2nd edition. MMWR Recomm Rep. 2013;62(RR-05):1-60.
Continue to testing for celiac in pediatric rheumatology patients >>
TESTING FOR CELIAC IN PEDIATRIC RHEUMATOLOGY PATIENTS
Sherman Y, Karanicolas R, DiMarco B, et al. Unrecognized celiac disease in children presenting for rheumatology evaluation. Pediatrics. 2015; [Epub ahead of print].
Children presenting for rheumatology evaluation should be screened for celiac disease, according to a review of 2,125 pediatric patients who were screened for celiac as part of the standard initial serologic evaluation.
Researchers identified 36 new cases of celiac disease (2.0% prevalence rate). The most common presenting complaints among these patients were myalgia, arthralgia, and rash. Less frequent complaints included gastrointestinal complaints of abdominal pain, nausea, and diarrhea.
After initiating a gluten-free diet, all of the patients with celiac disease reported improvement or complete resolution of musculoskeletal symptoms.
COMMENTARY
Celiac disease has a prevalence of 0.5% to 1% in the US and can present with a range of symptoms that include diarrhea, abdominal discomfort, and weight loss. In addition to these typical symptoms, celiac disease can cause a wide range of systemic symptoms, including osteopenia, abnormal liver function tests, anemia, neurologic symptoms, and general malaise and fatigue.1 This study suggests that celiac testing be considered in children presenting with rheumatologic symptoms, including myalgia, arthralgia, and rash.
1. Presutti RJ, Cangemi JR, Cassidy HD, et al. Celiac disease. Am Fam Physician. 2007;76(12):1795-1802, 1809-1810.
Continue for educating parents about antibiotic use >>
EDUCATING PARENTS ABOUT ANTIBIOTIC USE
Vaz LE, Kleinman KP, Lakoma MD, et al. Prevalence of parental misconceptions about antibiotic use. Pediatrics. 2015;136:221-231.
Misperceptions about antibiotic use persist and continue to be more prevalent among parents of Medicaid-insured children, according to a study of 1,500 Massachusetts parents.
Investigators examined antibiotic-related knowledge and attitudes among both Medicaid-insured and private-insured parents and found
• Fewer Medicaid parents answered questions correctly, except for one regarding bronchitis.
• Medicaid patients were more likely to request unnecessary antibiotics.
• More parents in 2013 understood that green nasal discharge did not require antibiotics than in 2000.
• Medicaid-insured parents were younger, less likely to be white, and had less education than those commercially insured.
COMMENTARY
Decreasing the unnecessary use of antibiotics for viral infections is an important component of decreasing the development of antibiotic-resistant organisms. An important driver of clinician use of antibiotics is patients’ expectations for antibiotics. This study shows that much work remains to be done in changing patient expectations, which is not surprising to any practicing clinician. This study also suggests that the expectation for antibiotics is greater among those individuals with Medicaid insurance, which suggests that an opportunity exists for Medicaid insurance plans to do targeted patient education on this issue—which should improve patient outcomes, decrease cost from use of unneeded antibiotics, and decrease the development of antibiotic-resistant organisms.
Continue for newborn pulmonary hypertension and maternal antidepressant use >>
NEWBORN PULMONARY HYPERTENSION AND MATERNAL ANTIDEPRESSANT USE
Huybrechts KF, Bateman BT, Palmsten K, et al. Antidepressant use late in pregnancy and risk of persistent pulmonary hypertension of the newborn. JAMA. 2015;313(21):2142-2151.
Taking antidepressants during late pregnancy may increase the risk for persistent pulmonary hypertension of the newborn (PPHN), according to a nested cohort study of more than 3.7 million pregnant women in the 2000-2010 Medicaid Analytic eXtract.
Investigators compared offspring of mothers who used selective serotonin reuptake inhibitors (SSRIs) or non-SSRI monotherapy in the last 90 days of pregnancy to those who did not and found 3.4% of women filled at least one prescription for antidepressants late in pregnancy, primarily SSRIs.
Rates and odds ratios (ORs) of PPHN stratified by use and type of antidepressant were as follows:
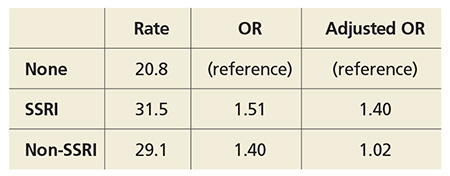
The study authors note the absolute risk is small, and the increased risk is more modest than previous studies found.
COMMENTARY
Depression affects more than 12% of pregnancies and has important consequences, including increased risk for suicide, preterm birth, poor fetal growth, and impaired fetal and infant development.1 PPHN is a serious condition that can require intubation and can be fatal in 10% to 20% of cases. This study adds to the conflicting data suggesting that SSRI use in pregnancy can lead to an increase in this rare condition. The decision to use an antidepressant during pregnancy is a difficult one, because depression has serious consequences but so, potentially, does treatment. The treatment of depression during pregnancy requires thoughtful, informed discussion between patient and provider.
1. Stewart DE. Clinical practice. Depression during pregnancy. N Engl J Med. 2011;365(17):1605-1611. doi:10.1056/NEJMcp1102730.
Continue for new infant vaccine treats 6 diseases >>
NEW INFANT VACCINE TREATS 6 DISEASES
Marshall GS, Adams GL, Leonardi ML, et al. Immunogenicity, safety, and tolerability of a hexavalent vaccine in infants. Pediatrics. 2015:136(2):323-332.
The safety and immunogenicity of DTaP5-IPV-Hib-HepB fully liquid investigational hexavalent vaccine are comparable with the analogous licensed component vaccines and provide a new combination vaccine option aligned with the recommended US infant immunization schedule, according to a phase III study of 1,465 participants. Overall, 981 healthy infants were vaccinated in group 1 with the hexavalent vaccine and 484 in group 2 with the analogous licensed component vaccines.
The study found
• Immune responses in group 1 to all antigens contained in the vaccine one month after dose 3 were essentially noninferior to those in group 2.
• Adverse event rates after any dose were similar in both groups.
COMMENTARY
Vaccine administration has led to many diseases, including Haemophilus influenzae type b, polio, and measles, becoming quite rare. As we have recently seen with the resurgence of measles, continued vigilance and high immunization rates are important in ensuring that these diseases remain rare. The development of a hexavalent vaccine is another step in making immunization easier for clinicians to administer and for patients to accept.
Continue for treating infants with bronchiolitis >>
TREATING INFANTS WITH BRONCHIOLITIS
Silver AH, Esteban-Cruciani N, Azzarone G, et al. 3% hypertonic saline versus normal saline in inpatient bronchiolitis: a randomized controlled trial. Pediatrics. 2015;136:1036-1043.
Infants hospitalized with bronchiolitis saw no difference in length of stay or seven-day readmission rates when treated with nebulized 3% hypertonic saline (HS) compared with nebulized normal saline (NS), according to a randomized, controlled study of 227 infants who were younger than 12 months when admitted. Patients received either 4 mL nebulized 3% HS (113 infants) or 4 mL 0.9% NS (114 infants) every four hours from enrollment until hospital discharge. Researchers found
• Median length of stay of HS and NS groups was 2.1 days vs 2.1 days, respectively.
• Seven-day readmission rates for HS and NS groups were 4.3% vs 3.1%, respectively.
• Clinical worsening events were similar between groups.
COMMENTARY
Bronchiolitis, the most common lower respiratory tract infection in infants, is usually due to a viral infection, most often respiratory syncytial virus, and can cause disease that ranges in severity from mild to life-threatening. Infants with bronchiolitis typically present with rhinitis, tachypnea, wheezing, and cough, and occasionally crackles and use of accessory muscles. While many medications are used, supportive care and monitoring are the mainstays of therapy. Maintaining pulse above 90% is important, using supplemental oxygen when needed to achieve this. Alpha-adrenergic and beta-adrenergic bronchodilators are often used; though the evidence suggests that they are not usually helpful, they can be tried and continued if they appear to help. Systemic steroids are often used, but they too lack evidence of efficacy.1 This study shows that hypertonic saline can now join the list of interventions used with evidence of a lack of efficacy.
1. Diagnosis and management of bronchiolitis. Subcommittee on diagnosis and management of bronchiolitis. Pediatrics. 2006;118(4):1774-1793. doi:10.1542/peds.2006-2223.
Continue for azithromycin and preschool children >>
AZITHROMYCIN AND PRESCHOOL CHILDREN: CAN ANTIBIOTICS LESSEN ONSET OF SEVERE LRTIs?
Bacharier LB, Guilbert TW, Mauger DT, et al. Early administration of azithromycin and prevention of severe lower respiratory tract illnesses in preschool children with a history of such illnesses: a randomized clinical trial. JAMA. 2015;314(19):2034-2044.
The use of azithromycin early during an apparent respiratory tract illness (RTI) reduced the likelihood of severe lower RTI (LRTI) among young children with a history of recurrent severe LRTI, compared with placebo, according to a study of 607 children ages 12 to 71 months. Participants were randomized in a 1:1 ratio to receive either azithromycin (12 mg/kg/d for 5 d) or matching placebo at the start of an RTI. Researchers found
• A total of 937 treated RTIs were experienced by 443 children, including 92 severe LRTIs (azithromycin group, 35; placebo group, 57).
• Azithromycin significantly reduced the risk for progression to severe LRTI relative to placebo (HR, 0.64).
• Induction of azithromycin-resistant organisms and adverse events were infrequent.
COMMENTARY
Recurrent episodes of severe wheezing with RTI are an important and common occurrence, affecting up to 15% to 20% of children prior to age 6.1 LRTI was defined in this study as RTI that required the use of additional rescue medication. The current approach to RTI is to try to minimize the use of antibiotics unless an infection is clearly bacterial in origin, and to treat severe LRTI when it occurs. The results of this trial suggest that in children at high risk for severe LRTI, identified by their episodes of recurrent wheezing, early treatment of RTI with azithromycin may decrease the development of severe LRTI by more than 35%—an important result. It is important to recognize that this study does not suggest treating all RTIs with antibiotics, but rather that the use of a macrolide antibiotic may be considered, perhaps, in the select group of children similar to those studied, with a history of recurrent wheezing with previous RTIs.
1. Ly NP, Gold DR, Weiss ST, Celedón JC. Recurrent wheeze in early childhood and asthma among children at risk for atopy. Pediatrics. 2006;117(6):e1132-e1138.
TALKING OUT CHILDHOOD OBESITY
Resnicow K, McMaster F, Bocian A, et al. Motivational interviewing and dietary counseling for obesity in primary care: an RCT. Pediatrics. 2015;135(4):649-657.
Counseling parents of overweight children using motivational interviewing from both health care providers and registered dietitians can significantly improve BMI, according to a study of 42 practices in the Pediatric Research in Office Settings Network of the American Academy of Pediatrics.
Researchers randomly assigned parents of overweight children, ages 2 through 8, to one of three groups: (1) usual care, (2) four provider-delivered motivational interviewing sessions over two years, or (3) four provider-delivered motivational interviewing sessions plus six sessions with a registered dietitian over two years. At study end, BMI percentile and change in BMI for the different groups were as follows:
COMMENTARY
The results of this study are exciting. Motivational interviewing is a technique in which the practitioner asks questions of a patient and allows the patient to discover his/her own conclusions about the topic. By so doing, the patient is more engaged in the discussion and is less resistant to input. This technique, with excellent evidence of effectiveness in the area of drug and alcohol abuse, has been shown to facilitate effective behavioral change in many areas and is recommended by the American Heart Association for behavioral change in adults.1,2 This is an exciting paper demonstrating evidence-based efficacy in addressing childhood obesity—a critical health issue—and is worth trying in the office.
1. Rubak S, Sandbaek A, Lauritzen T, Christensen B. Motivational interviewing: a systematic review and meta-analysis. Br J Gen Pract. 2005;55(513):305-312.
2. Spring B, Ockene JK, Gidding SS, et al; American Heart Association Behavior Change Committee of the Council on Epidemiology and Prevention, Council on Lifestyle and Cardiometabolic Health, Council for High Blood Pressure Research, and Council on Cardiovascular and Stroke Nursing. Better population health through behavior change in adults: a call to action. Circulation. 2013;128(19):2169-2176. doi: 10.1161/01.cir.0000435173.25936.e1.
Continue for long-acting reversible contraception among teens >>
LONG-ACTING REVERSIBLE CONTRACEPTION AMONG TEENS
Romero L, Pazol K, Warner L, et al. Vital signs: trends in use of long-acting reversible contraception among teens aged 15-19 years seeking contraceptive services – United States, 2005-2013. MMWR Morb Mortal Wkly Rep. 2015;64(13):363-369.
Efforts to improve teen access to long-acting reversible contraception (LARC) have increased use of these methods, according to a CDC review of services provided at Title X National Family Planning Program centers. The report found
• LARC rates among teen patients increased from 0.4% in 2005 to 7.2% in 2013.
• In 2013, 2.8% of those seeking contraception used IUDs and 4.3% used implants.
• Among Title X patients, 7.6% of 18- and 19-year-olds used LARC, compared with 6.5% of 15- to 17-year-olds.
• Rates of LARC were lowest in Mississippi (0.7%) and highest in Colorado (25.8%).
COMMENTARY
LARCs, which include IUD and implantable hormonal contraceptive devices, require no effort for adherence on the part of the user; once in place, they are effective without further action. Current CDC guidelines on contraceptive use clearly recommend LARC for teenagers based on the efficacy and safety.1 LARCs are favored for teenagers because poor compliance has yielded suboptimal effectiveness of oral contraceptives and condoms in teenagers, who often forget to take their birth control pills or don’t use condoms when they should. Many clinicians have been slow to recommend LARCs in teenagers based on safety concerns related to adverse experience with IUDs 20 to 30 years ago. According to CDC guidelines, IUDs and implantable contraceptive devices now have robust safety data, and this article shows that they are being increasingly made available to teenagers who need them.
1. Division of Reproductive Health, National Center for Chronic Disease Prevention and Health Promotion, CDC. US Selected Practice Recommendations for Contraceptive Use, 2013: adapted from the World Health Organization selected practice recommendations for contraceptive use, 2nd edition. MMWR Recomm Rep. 2013;62(RR-05):1-60.
Continue to testing for celiac in pediatric rheumatology patients >>
TESTING FOR CELIAC IN PEDIATRIC RHEUMATOLOGY PATIENTS
Sherman Y, Karanicolas R, DiMarco B, et al. Unrecognized celiac disease in children presenting for rheumatology evaluation. Pediatrics. 2015; [Epub ahead of print].
Children presenting for rheumatology evaluation should be screened for celiac disease, according to a review of 2,125 pediatric patients who were screened for celiac as part of the standard initial serologic evaluation.
Researchers identified 36 new cases of celiac disease (2.0% prevalence rate). The most common presenting complaints among these patients were myalgia, arthralgia, and rash. Less frequent complaints included gastrointestinal complaints of abdominal pain, nausea, and diarrhea.
After initiating a gluten-free diet, all of the patients with celiac disease reported improvement or complete resolution of musculoskeletal symptoms.
COMMENTARY
Celiac disease has a prevalence of 0.5% to 1% in the US and can present with a range of symptoms that include diarrhea, abdominal discomfort, and weight loss. In addition to these typical symptoms, celiac disease can cause a wide range of systemic symptoms, including osteopenia, abnormal liver function tests, anemia, neurologic symptoms, and general malaise and fatigue.1 This study suggests that celiac testing be considered in children presenting with rheumatologic symptoms, including myalgia, arthralgia, and rash.
1. Presutti RJ, Cangemi JR, Cassidy HD, et al. Celiac disease. Am Fam Physician. 2007;76(12):1795-1802, 1809-1810.
Continue for educating parents about antibiotic use >>
EDUCATING PARENTS ABOUT ANTIBIOTIC USE
Vaz LE, Kleinman KP, Lakoma MD, et al. Prevalence of parental misconceptions about antibiotic use. Pediatrics. 2015;136:221-231.
Misperceptions about antibiotic use persist and continue to be more prevalent among parents of Medicaid-insured children, according to a study of 1,500 Massachusetts parents.
Investigators examined antibiotic-related knowledge and attitudes among both Medicaid-insured and private-insured parents and found
• Fewer Medicaid parents answered questions correctly, except for one regarding bronchitis.
• Medicaid patients were more likely to request unnecessary antibiotics.
• More parents in 2013 understood that green nasal discharge did not require antibiotics than in 2000.
• Medicaid-insured parents were younger, less likely to be white, and had less education than those commercially insured.
COMMENTARY
Decreasing the unnecessary use of antibiotics for viral infections is an important component of decreasing the development of antibiotic-resistant organisms. An important driver of clinician use of antibiotics is patients’ expectations for antibiotics. This study shows that much work remains to be done in changing patient expectations, which is not surprising to any practicing clinician. This study also suggests that the expectation for antibiotics is greater among those individuals with Medicaid insurance, which suggests that an opportunity exists for Medicaid insurance plans to do targeted patient education on this issue—which should improve patient outcomes, decrease cost from use of unneeded antibiotics, and decrease the development of antibiotic-resistant organisms.
Continue for newborn pulmonary hypertension and maternal antidepressant use >>
NEWBORN PULMONARY HYPERTENSION AND MATERNAL ANTIDEPRESSANT USE
Huybrechts KF, Bateman BT, Palmsten K, et al. Antidepressant use late in pregnancy and risk of persistent pulmonary hypertension of the newborn. JAMA. 2015;313(21):2142-2151.
Taking antidepressants during late pregnancy may increase the risk for persistent pulmonary hypertension of the newborn (PPHN), according to a nested cohort study of more than 3.7 million pregnant women in the 2000-2010 Medicaid Analytic eXtract.
Investigators compared offspring of mothers who used selective serotonin reuptake inhibitors (SSRIs) or non-SSRI monotherapy in the last 90 days of pregnancy to those who did not and found 3.4% of women filled at least one prescription for antidepressants late in pregnancy, primarily SSRIs.
Rates and odds ratios (ORs) of PPHN stratified by use and type of antidepressant were as follows:
The study authors note the absolute risk is small, and the increased risk is more modest than previous studies found.
COMMENTARY
Depression affects more than 12% of pregnancies and has important consequences, including increased risk for suicide, preterm birth, poor fetal growth, and impaired fetal and infant development.1 PPHN is a serious condition that can require intubation and can be fatal in 10% to 20% of cases. This study adds to the conflicting data suggesting that SSRI use in pregnancy can lead to an increase in this rare condition. The decision to use an antidepressant during pregnancy is a difficult one, because depression has serious consequences but so, potentially, does treatment. The treatment of depression during pregnancy requires thoughtful, informed discussion between patient and provider.
1. Stewart DE. Clinical practice. Depression during pregnancy. N Engl J Med. 2011;365(17):1605-1611. doi:10.1056/NEJMcp1102730.
Continue for new infant vaccine treats 6 diseases >>
NEW INFANT VACCINE TREATS 6 DISEASES
Marshall GS, Adams GL, Leonardi ML, et al. Immunogenicity, safety, and tolerability of a hexavalent vaccine in infants. Pediatrics. 2015:136(2):323-332.
The safety and immunogenicity of DTaP5-IPV-Hib-HepB fully liquid investigational hexavalent vaccine are comparable with the analogous licensed component vaccines and provide a new combination vaccine option aligned with the recommended US infant immunization schedule, according to a phase III study of 1,465 participants. Overall, 981 healthy infants were vaccinated in group 1 with the hexavalent vaccine and 484 in group 2 with the analogous licensed component vaccines.
The study found
• Immune responses in group 1 to all antigens contained in the vaccine one month after dose 3 were essentially noninferior to those in group 2.
• Adverse event rates after any dose were similar in both groups.
COMMENTARY
Vaccine administration has led to many diseases, including Haemophilus influenzae type b, polio, and measles, becoming quite rare. As we have recently seen with the resurgence of measles, continued vigilance and high immunization rates are important in ensuring that these diseases remain rare. The development of a hexavalent vaccine is another step in making immunization easier for clinicians to administer and for patients to accept.
Continue for treating infants with bronchiolitis >>
TREATING INFANTS WITH BRONCHIOLITIS
Silver AH, Esteban-Cruciani N, Azzarone G, et al. 3% hypertonic saline versus normal saline in inpatient bronchiolitis: a randomized controlled trial. Pediatrics. 2015;136:1036-1043.
Infants hospitalized with bronchiolitis saw no difference in length of stay or seven-day readmission rates when treated with nebulized 3% hypertonic saline (HS) compared with nebulized normal saline (NS), according to a randomized, controlled study of 227 infants who were younger than 12 months when admitted. Patients received either 4 mL nebulized 3% HS (113 infants) or 4 mL 0.9% NS (114 infants) every four hours from enrollment until hospital discharge. Researchers found
• Median length of stay of HS and NS groups was 2.1 days vs 2.1 days, respectively.
• Seven-day readmission rates for HS and NS groups were 4.3% vs 3.1%, respectively.
• Clinical worsening events were similar between groups.
COMMENTARY
Bronchiolitis, the most common lower respiratory tract infection in infants, is usually due to a viral infection, most often respiratory syncytial virus, and can cause disease that ranges in severity from mild to life-threatening. Infants with bronchiolitis typically present with rhinitis, tachypnea, wheezing, and cough, and occasionally crackles and use of accessory muscles. While many medications are used, supportive care and monitoring are the mainstays of therapy. Maintaining pulse above 90% is important, using supplemental oxygen when needed to achieve this. Alpha-adrenergic and beta-adrenergic bronchodilators are often used; though the evidence suggests that they are not usually helpful, they can be tried and continued if they appear to help. Systemic steroids are often used, but they too lack evidence of efficacy.1 This study shows that hypertonic saline can now join the list of interventions used with evidence of a lack of efficacy.
1. Diagnosis and management of bronchiolitis. Subcommittee on diagnosis and management of bronchiolitis. Pediatrics. 2006;118(4):1774-1793. doi:10.1542/peds.2006-2223.
Continue for azithromycin and preschool children >>
AZITHROMYCIN AND PRESCHOOL CHILDREN: CAN ANTIBIOTICS LESSEN ONSET OF SEVERE LRTIs?
Bacharier LB, Guilbert TW, Mauger DT, et al. Early administration of azithromycin and prevention of severe lower respiratory tract illnesses in preschool children with a history of such illnesses: a randomized clinical trial. JAMA. 2015;314(19):2034-2044.
The use of azithromycin early during an apparent respiratory tract illness (RTI) reduced the likelihood of severe lower RTI (LRTI) among young children with a history of recurrent severe LRTI, compared with placebo, according to a study of 607 children ages 12 to 71 months. Participants were randomized in a 1:1 ratio to receive either azithromycin (12 mg/kg/d for 5 d) or matching placebo at the start of an RTI. Researchers found
• A total of 937 treated RTIs were experienced by 443 children, including 92 severe LRTIs (azithromycin group, 35; placebo group, 57).
• Azithromycin significantly reduced the risk for progression to severe LRTI relative to placebo (HR, 0.64).
• Induction of azithromycin-resistant organisms and adverse events were infrequent.
COMMENTARY
Recurrent episodes of severe wheezing with RTI are an important and common occurrence, affecting up to 15% to 20% of children prior to age 6.1 LRTI was defined in this study as RTI that required the use of additional rescue medication. The current approach to RTI is to try to minimize the use of antibiotics unless an infection is clearly bacterial in origin, and to treat severe LRTI when it occurs. The results of this trial suggest that in children at high risk for severe LRTI, identified by their episodes of recurrent wheezing, early treatment of RTI with azithromycin may decrease the development of severe LRTI by more than 35%—an important result. It is important to recognize that this study does not suggest treating all RTIs with antibiotics, but rather that the use of a macrolide antibiotic may be considered, perhaps, in the select group of children similar to those studied, with a history of recurrent wheezing with previous RTIs.
1. Ly NP, Gold DR, Weiss ST, Celedón JC. Recurrent wheeze in early childhood and asthma among children at risk for atopy. Pediatrics. 2006;117(6):e1132-e1138.
Trading Kidneys: Innovative Program Could Save Thousands of Lives
While editing this month’s Renal Consult, I noted the mention of “paired kidney exchange” with particular interest. In 2005, I heard about a relatively new concept: matching two or more incompatible kidney donor-recipient pairs to create compatible matches. After conducting some research and interviewing experts, I wrote an article on paired kidney exchange for our sister publication, Clinician News. In the subsequent decade, the concept of paired exchange has expanded to the point that as many as 70 people have participated in a 35-kidney exchange. —AMH
Last year, almost 27,000 Americans received an organ transplant—a new national record, according to the US Department of Health and Human Services. Donations from living persons reached nearly 7,000, an increase of 2.3% from 2003. But despite these positive numbers, nearly 88,000 people are on the waiting list for an organ, and about 6,200 died last year before one became available.
But in some areas of the country, an innovative program is gaining momentum: paired kidney exchange, which puts together two or more incompatible donor-recipient pairs to create compatible matches. And while it will not close the gap between patients in need and those who receive, experts believe it could help thousands of people each year.
The real struggle is finding more willing donors. But Francis Delmonico, MD, Medical Director, New England Organ Bank, Newton, Massachusetts, says paired exchange is “an adjunct. When it can be of help, it’s helped a number of people already. And as with any of this, it’s a lot of work but it’s a tactic that we ought to try and apply anytime we can.”
“There are about 10,000 people who could be put into a program like this,” says Michael A. Rees, MD, PhD, Associate Professor, Department of Urology, Medical College of Ohio, Toledo. “Once you put them into the program, we would hope that 2,000 to 3,000 per year could be matched up and we could do that many extra kidney transplants a year. And that would certainly help to close the gap.”
Continue for how it works >>
HOW IT WORKS
Paired kidney exchange got its start in the US at Johns Hopkins Comprehensive Transplant Center, Baltimore, in 2001. The concept is simple: Recipient A needs a kidney and has a family member or friend, Donor A, who is willing to give. However, testing reveals that Donor A and Recipient A are incompatible. Meanwhile, Recipient B and Donor B find themselves with the same problem. But, it turns out, Donor B could give to Recipient A and Donor A could give to Recipient B. The patients and their donors are approached with the idea of an exchange, and if they agree, two people receive needed organs.
Twenty-two patients have received kidneys through the Johns Hopkins program, according to Robert A. Montgomery, MD, PhD, Director, Incompatible Kidney Transplant Programs (InKTP). Surgeons at Johns Hopkins have also expanded the exchange to three donor-recipient pairs; “triple swap” operations were performed at the hospital in 2003 and 2004.
“Everyone, when they come for an incompatible transplant, is offered the option of a paired exchange, because … if there’s any way to get a compatible kidney, that’s what you try for first,” says Janet Hiller, RN, MSN, Clinical Nurse Specialist, InKTP. “We’ve only had probably two out of a hundred [patients] who have thought, ‘No, I’d rather just get the kidney from my spouse or loved one.’”
“Patients are surprisingly open to this option, and almost all of them … request it when they are initially seen by me,” Montgomery told Clinician News via e-mail. “Some [recipients] have expressed apprehension about not knowing the donor and not being sure they have taken good care of their kidney. The donors have rarely expressed any concerns; they just want their loved one to receive a kidney…. It has universally been a positive experience.”
Ohio’s Rees first heard about paired exchange at a conference in 2001. He returned to his institution and consulted with the living donor coordinator to see if any pairs could be formed from people who had been willing to donate but unable due to blood type or other incompatibility problems. After identifying two pairs (out of 10 possibilities) for whom an exchange might work, Rees brought the patients and donors in for testing. But alas, the match wasn’t quite right.
“It became clear to me that if I really wanted to make this work, I needed a lot more than 10 pairs [to start with],” Rees says. “The numbers—if you try to match up people—go up logarithmically the more pairs that you have. So the chances you have of creating pairs go up exponentially.”
With this realization in mind, Rees set out to find someone willing to write a computer program that could identify potential matches from a larger bank of people pooled from several facilities. After some false starts—no computer programmer would work on the project for academic glory, the only reward Rees could offer—he convinced his father, Alan, to help. The senior Rees’ prototype was the basis for the current system, which links 10 transplant centers in Ohio.
Working with a larger pool of colleagues required numerous teleconference calls to iron out details for the statewide program. Among the questions were, “Are we going to make the donor travel, or are we going to cut the kidney out at home and ship the kidney in a box of ice to the place where it’s going to be transplanted?” he recalls. “And we decided that the donor has to travel.”
The first kidney exchange in the state of Ohio was performed in early November 2004. The third was scheduled for mid-April.
Creating one system to be shared by medical institutions that would normally be competitors took some work. “Trying to get us all to play in the same sandbox was very difficult,” Rees acknowledges. “But we did that; we stuck it out. And we all agreed to come up with something that we all think is a great idea and should help our patients.”
Delmonico, who is also a Professor of Surgery at Harvard Medical School and Visiting Surgeon in the Transplant Unit at Massachusetts General Hospital, Boston, has also seen the gratifying cooperation between medical professionals. “Institutions are competitive in terms of medical care—that’s no mystery,” he says. “But in this instance, the physicians have been simply magnificent in trying to help patients. Innovative programs can be developed and sustained through the kind of collaboration that is going on here.”
The New England paired exchange program, dating back to 2002, is a collaboration involving a dozen hospitals. It started with a paper-and-pen effort (blood type–incompatible patients would be brought to the attention of Delmonico, who would then contact each transplant center, seeking others) but now has its own computer system.
New England also has another variation on the exchange program that is unique to the region, according to Delmonico. “Let’s say I wanted to give to you but I can’t. I’ll give to somebody on the list, and as a result of that donation, you would get a priority for the next available deceased donor kidney in New England,” he explains. “We’ve done that about 20 times now.”
Continue for going national >>
GOING NATIONAL
So where does paired exchange go from here? Johns Hopkins’ Montgomery organized a consensus meeting in March to discuss the possibility of creating a national network; Hiller, Rees, and Delmonico attended.
“I think our goal should be to one day have a national program,” Rees says. “But shipping somebody from Toledo down to Cincinnati is a lot easier to sell to a patient than shipping somebody from Toledo to Los Angeles. And the logistics of trying to do that when you have a whole different set of insurance companies … would be a lot more complicated. So, I think the way to begin is to do it on a more regional basis and prove that the concept works, that people can be satisfied with it, and then begin to expand it.”
Delmonico also thinks a national program is essential. “We need to enlarge the possibility of paired donation and exchange,” he says. “It will not happen successfully in a regional system. There aren’t enough patients that can be identified.” Questions to be answered before such a program could exist, Delmonico notes, include where the system will be based and who will administer it.
“There was a lot of agreement—though not total consensus—on the fact that UNOS, the United Network for Organ Sharing, would be the most likely place to ‘house’ and to manage the data,” Hiller reports. “They have all those systems in place already [and] are capable of managing this large database.”
Delmonico, as Vice President of UNOS, points out, “We have no authority to do that yet. Whether or not the country wants us to do that also remains to be determined.” But the UNOS Board of Directors is open to the idea; last year, they endorsed the concept of establishing a national paired exchange program with the understanding that details would have to be worked out over time, according to a UNOS spokesperson.
Another obstacle to widespread paired donation may be perceptions of it in the eyes of the government and critics: Could it be construed as a violation of the 1984 National Organ Transplant Act, which says that an organ should not be transplanted for a “value consideration”? Legal experts have assured Delmonico that paired exchanges can be interpreted as a gift.
“The government is also, properly, not wanting to see this as a slope toward buying and selling organs,” Delmonico says. “And I am adamantly opposed to that. In the instances that we’ve done paired exchange here, that’s not in the mix. That’s not our motivation, nor has it been the motivation of these donors. We wouldn’t do it if we felt that was the case.”
Montgomery says it will take several years to get a national system set up. But the bottom line for transplant surgeons is that a national paired kidney exchange program would do a world of good, two people at a time. “This is clearly what is best for our patients,” Montgomery says.
“The bigger we can get, if we can spread it nationally, the more people it will help,” Rees says. “And so we have to think of a way to do this so that we’re all satisfied that it’s moving forward in a way that will make everyone happy.”
Reprinted from Clinician News. 2005;9(5):cover, 3, 15.
“Doctor, I’m So Tired!” Refining Your Work-up for Chronic Fatigue
CASE Lauren C, age 35, presents with fatigue, which she says started at least eight months ago and has progressively worsened. The patient, a clerical worker, says she manages to do an adequate job but goes home feeling utterly exhausted each night.
Lauren says she sleeps well, getting more than eight hours of sleep per night on weekends but less than seven hours per night during the week. But no matter how long she sleeps, she never awakens feeling refreshed. Lauren reports that she doesn’t smoke, has no more than four alcoholic drinks per month, and adheres to an “average” diet. She is too tired to exercise.
Lauren is single, with no children. Although she says she has a strong network of family and friends, she increasingly finds she has no energy for socializing. If Lauren were your patient, what would you do?
Fatigue is a common presenting symptom in primary care, accounting for about 5% of adult visits.1 Defined as a generalized lack of energy, fatigue that persists despite adequate rest or is severe enough to disrupt an individual’s ability to participate in key social and/or occupational activities warrants a thorough investigation.
Because fatigue is a nonspecific symptom that may be linked to a number of medical and psychiatric illnesses or to medications used to treat them, determining the cause can be difficult. In about half of all cases, no specific etiology is found.2This review, which includes the elements of a work-up and management strategies for patients presenting with ongoing fatigue, will help you arrive at the appropriate diagnosis and provide optimal treatment.
CHRONIC FATIGUE: DEFINING THE TERMS
A definition of chronic fatigue syndrome (CFS) was initially published in 1988.3In subsequent years, the term myalgic encephalomyelitis (ME) became popular. Although the terms are sometimes used interchangeably, ME often refers to patients whose condition is thought to have an infectious cause and for whom postexertional malaise is a hallmark symptom.4
CDC criteria. While several sets of diagnostic criteria for CFS have been developed, the most widely used is that of the CDC, published in 1994 (see Table 1).5,6A diagnosis of CFS is made on the basis of exclusion, subjective clinical interpretation, and patient self-report.
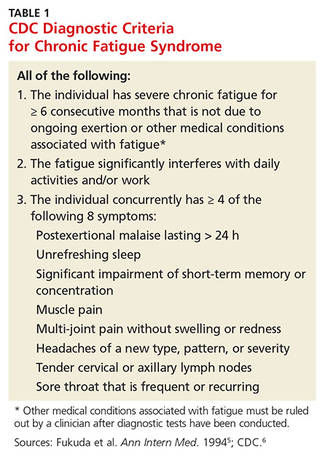
When the first two criteria—fatigue not due to ongoing exertion or other medical conditions that has lasted ≥ 6 months and is severe enough to interfere with daily activities—but fewer than four of the CDC’s eight concurrent symptoms (eg, headache, unrefreshing sleep, and postexertion malaise lasting > 24 h) are present, idiopathic fatigue, rather than CFS, is diagnosed.6
International Consensus Criteria (ICC). In 2011, the ICC for ME were proposed in an effort to provide more specific diagnostic criteria (see Table 2).7The ICC emphasize fatigability, or what the authors identify as “post-exertional neuroimmune exhaustion.”
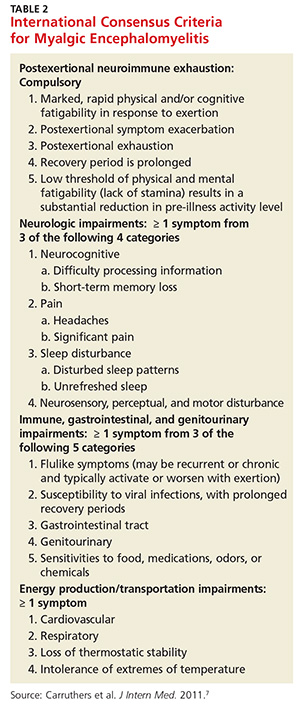
The ICC have not yet been broadly researched. But an Australian study of patients with chronic fatigue found that those who met the ICC definition were sicker and more homogeneous, with significantly lower scores for physical and social functioning and bodily pain, compared with those who fulfilled the CDC criteria alone.8
Continue for common threads of chronic fatigue & neuropsychiatric conditions >>
CHRONIC FATIGUE & NEUROPSYCHIATRIC CONDITIONS: COMMON THREADS
Recent research has made it clear that depression, somatization, and CFS share some biological underpinnings. These include biomarkers for inflammation, cell-mediated immune activation—which may be related to the symptoms of fatigue—autonomic dysfunction, and hyperalgesia.9Evidence suggests that up to two-thirds of patients with CFS also meet the criteria for a psychiatric disorder.10The most common psychiatric conditions are major depressive disorder (MDD), affecting an estimated 22% to 32% of those with CFS; anxiety disorder, affecting about 20%; and somatization disorder, affecting about 10%—at least double the incidence of the general population.10
Others point out, however, that up to half of those with CFS do not have a psychiatric disorder.11A diagnosis of somatization disorder, in particular, depends largely on a subjective interpretation of whether the presenting symptoms have a physical cause.10
CFS and MDD comorbidity. The most widely studied association between CFS and psychiatric disorders involves MDD. Observational studies have found patients with CFS have a lifetime prevalence of MDD of 65%,12,13which is higher than that of patients with other chronic diseases. Overlapping symptoms include fatigue, sleep disturbance, poor concentration, and memory problems. However, those with CFS have fewer symptoms related to anhedonia, poor self-esteem, guilt, and suicidal ideation compared with individuals with MDD.12,13
There are several possible explanations for CFS and MDD comorbidity, which are not necessarily mutually exclusive.10One theory is that CFS is an atypical form of depression; another holds that the disability associated with CFS leads to depression, as is the case with many other chronic illnesses; and a third points to overlapping pathophysiology.10
An emerging body of evidence suggests that CFS and MDD have some common oxidative and nitrosative biochemical pathways. Activated by infection, psychologic stress, and immune disorders, they are believed to have damaging free radical and nitric oxide effects at the cellular level.14The cellular effects can result in fatigue, muscle pain, and flulike malaise.
Cortisol response differs
CFS and MDD might be distinguishable by another pathway—the hypothalamic-pituitary-adrenal (HPA) axis. MDD is classically associated with activation and raised cortisol levels, while CFS is consistently associated with impaired HPA axis functioning and reduced cortisol levels.10The majority of patients with CFS report symptoms of cognitive decline, with the acquisition of new verbal learning and information-processing speed particularly likely to be impaired.15
A meta-analysis of 50 studies of patients with CFS showed deficits in attention, memory, and reaction time, but not in fine motor speed, vocabulary, or reasoning.16Autonomic dysfunction has also been observed, including disordered sympathetic activity. The most frequently observed abnormalities on autonomic testing are postural hypotension, tachycardia syndrome, neurally mediated hypotension, and heart rate variability during tilt table testing.16
THE LINK BETWEEN INFECTION AND CFS
Several infectious agents have been associated with ME/CFS, including the Epstein-Barr virus (EBV), herpes simplex virus 6, parvovirus, Q fever, and Lyme disease.8,17,18 Most agents that have been linked to ME/CFS are associated with persistent infection and thus incitement of the immune system.
Numerous observational studies17,18have documented postinfectious fatigue syndromes after acute viral and bacterial infections and symptoms suggestive of infection, such as fever, myalgias, and respiratory and gastrointestinal distress. In one prospective Australian study,19investigators identified 253 cases of acute EBV, Ross River virus, and Q fever. Of those 253 patients, 12% went on to develop CFS, with a higher likelihood among those with more severe acute symptoms. No correlation with preexisting psychiatric disorders was found.
Muscle mitochondria studies have demonstrated what appear to be acquired abnormalities in those with CFS.20,21Signs of increased oxidative stress have been found in both blood and muscle samples from patients with CFS, and longitudinal studies suggest that oxidative stress is greatest during periods of clinical exacerbation.22Increased lactate levels suggest increased anaerobic metabolism in the central nervous system consistent with mitochondrial dysfunction. Several studies have demonstrated that exercise can precipitate oxidative stress in patients with CFS, in contrast with healthy controls and controls with other chronic illnesses, suggesting a physiologic basis for their postexertional symptoms.17
Autoinflammatory syndrome induced by adjuvants, a rare syndrome associated with vaccine administration, has been linked to postvaccination adverse events, exposure to silicone implants, Gulf War syndrome (related to multiple vaccinations), and macrophagic myofasciitis. All involve exposure to immune adjuvants and have similar clinical manifestations. The corresponding exposures appear to trigger an autoimmune response in susceptible individuals. The hepatitis B vaccine is most often associated with CFS, with symptoms occurring within 90 days of administration.23
Continue for the clinical work-up >>
THE CLINICAL WORK-UP: PUTTING KNOWLEDGE INTO PRACTICE
Familiarity with potential causes of and connections with ME/CFS will help you ensure that patients who say they’re always tired receive a thorough work-up. Start with a medical history, inquiring directly about medical and psychiatric disorders that may contribute to fatigue (see Table 3).5,24,25 Include a medication history as well, to help determine whether the fatigue is drug-related (see Table 4).5,25
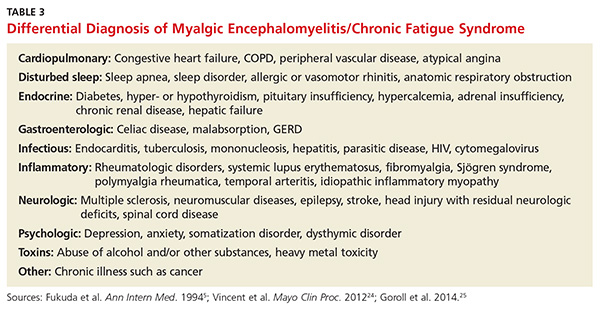
What to ask. Determine the onset, course, duration, daily pattern, and impact of fatigue on the patient’s daily life. Inquire, too, about related symptoms of daytime sleepiness, dyspnea on exertion, generalized weakness, and depressed mood. The prominence of any of these rather than fatigue, per se, point to a diagnosis of a chronic illness other than ME/CFS.
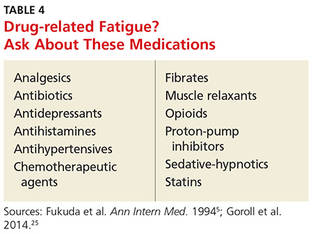
Keep in mind, too, that patients with an organ-based medical illness tend to associate their fatigue with activities that they are unable to complete, such as shopping or light housework. In contrast, those with fatigue that is not organ-based typically say that they’re tired all the time. Their fatigue is not necessarily related to exertion, nor does it improve with rest.26
To address this distinction, take a sleep history, assessing both the quality and quantity of the patient’s sleep to determine how it affects symptoms.27 Consider using a questionnaire designed to help distinguish between sleepiness—and a primary sleep disorder—and fatigue,28 such as the Fatigue Severity Scale of Sleep Disorders (www.healthywomen.org/sites/default/files/FatigueSeverityScale.pdf).
What to rule out. In addition to a medical history, the physical examination should be oriented toward ruling out secondary causes of fatigue. In addition to a system-by-system approach to the differential diagnosis, carefully observe the patient’s general appearance, with attention to his or her level of alertness, grooming, and psychomotor agitation or retardation as possible signs of a psychiatric disorder. To rule out neurologic causes, evaluate muscle bulk, tone, and strength; deep tendon reflexes; and sensory and cranial nerves, as well.29
Lab tests to consider. In most cases of ME/CFS, basic studies—complete blood count with differential, erythrocyte sedimentation rate, blood chemistry, and thyroid-stimulating hormone (TSH) levels—are sufficient. When no medical or psychiatric cause has been found, additional tests may be ordered on a case-by-case basis, although laboratory analysis affects the management of fatigue in less than 5% of such patients.30 Tests to consider include:
• Creatine kinase (for patients who report pain or muscle weakness)
• Pregnancy test (for women of childbearing age)
• Ferritin testing (for young women who might benefit from iron supplementation for levels < 50 ng/mL even if anemia is not present)31
• Hepatitis C screening (recommended by the US Preventive Services Task Force for those born between 1945 and 1965)32
• HIV screening and the purified protein derivative test for tuberculosis (based on patient history).
Forego routine testing for other infections
Routine testing for infectious diseases and conditions associated with fatigue, such as EBV or Lyme disease, immune deficiency (eg, immunoglobulins), inflammatory disease (eg, antinuclear antibodies, rheumatoid factor), celiac disease, vitamin D deficiency, vitamin B12 deficiency, or heavy metal toxicity, is unlikely to be helpful.29 Additional testing simply to reassure a worried patient usually does not accomplish that objective.33
Additional studies, referrals to consider. If you suspect that a patient has a sleep disorder, a referral to a sleep clinic to rule out idiopathic sleep disorders, obstructive sleep apnea, or movement disorders that interfere with sleep may be in order. Spirometry and echocardiography may be helpful for some patients. If you suspect peripheral muscle fatigue, a referral for neuromuscular testing is indicated.
Lauren’s medical history reveals that she also has irritable bowel syndrome, which she manages with diet and OTC medication, as needed for constipation or diarrhea. She denies having any other chronic conditions. Her only other symptoms, she reports, are mild upper back pain after spending long hours at the computer and arthralgias in her left knee and both hands. She admits to being “somewhat depressed” in the last few months but denies the presence of anhedonia.
The patient’s physical examination is normal, and her depression screen does not meet the criteria for MDD. Her metabolic chemistry panel, complete blood count, TSH, and sedimentation rate are all normal, as well.
Continue for symptom management and coping strategies >>
SYMPTOM MANAGEMENT AND COPING STRATEGIES
When no specific cause of chronic fatigue is found, the focus shifts from diagnosis to symptom management and coping strategies. This requires engagement with the patient. It is important to acknowledge the existence of his or her symptoms and to reassure the patient that further investigation may be warranted later, should new symptoms emerge. Advise the patient, too, that periods of remission and relapse are likely.
Strategies designed to motivate patient self-management, as well as the formulation of patient-centered treatment plans, have been shown to reduce symptom scores.34 Participation in a support group, as well as frequent follow-up visits with a primary care provider, a behavioral therapist, or both, may help to provide needed psychologic support.
Evidence of the effectiveness of specific therapies for ME/CFS is limited; however, the best-studied approaches are cognitive behavioral therapy (CBT) and graded exercise therapy.35 Exercise should be low intensity, such as walking or cycling for 30 minutes three times a week, with a gradual increase in duration and frequency over a period of weeks to months. Patients with cancer-related fatigue may benefit from yoga, group therapy, and stress management.36
Associated mood and pain symptoms should be treated, as well. Bupropion, which is somewhat stimulating, may be considered as an initial treatment for patients with depression and clinically significant fatigue.
Other potentially beneficial approaches include a healthy diet, avoidance of more than nominal amounts of alcohol, relative avoidance of caffeine (no more than one cup of a caffeinated beverage in the morning), and stress reduction techniques.
Attention to good sleep hygiene may be especially beneficial, including a regular bedtime routine and sleep schedule, and elimination of bedroom light and noise. Pharmacologic treatments for insomnia should be used with caution, if at all.
Lauren receives a referral for CBT and is scheduled for a return visit in four weeks. At the advice of both her primary care provider and the behavioral therapist, she gradually makes several lifestyle changes. She begins going to bed earlier on weeknights to ensure that she sleeps for at least seven hours. She improves her diet, with increasing emphasis on vegetables, fruits, and whole grains. She also starts a walking program, increasing gradually to a total of three hours per week. After four months, she adds a weekly trip to a gym, where she practices resistance training for about 40 minutes.
Lauren also increases her social activities on weekends and recently accepted an invitation to join a book club. Six months from her initial visit, she notes that although she is still more easily fatigued than most people, she has made significant improvement
REFERENCES
1. Nijrolder I, van der Windt DA, van der Horst HE. Prognosis of fatigue and functioning in primary care: a 1-year follow-up study. Ann Fam Med. 2008;6:519-527.
2. Griffith JP, Zarrouf FA. A systematic review of chronic fatigue syndrome: don’t assume it’s depression. Prim Care Companion J Clin Psychiatry. 2008;10:120-128.
3. Holmes GP, Kaplan JE, Gantz NM, et al. Chronic fatigue syndrome: a working case definition. Ann Intern Med. 1988;108:387-389.
4. Morris G, Maes M. Case definitions and diagnostic criteria for myalgic encephalomyelitis and chronic fatigue syndrome: from clinical consensus to evidence-based case definitions. Neuro Endocrinol Lett. 2013;34:185-199.
5. Fukuda K, Straus SE, Hickie I, et al. The chronic fatigue syndrome: a comprehensive approach to its definition and study. International Chronic Fatigue Syndrome Study Group. Ann Intern Med. 1994;121:953-959.
6. CDC. Chronic fatigue syndrome. www.cdc.gov/cfs/diagnosis/index.html. Accessed December 17, 2015.
7. Carruthers BM, van de Sande MI, De Meirleir KL, et al. Myalgic encephalomyelitis: International Consensus Criteria. J Intern Med. 2011;270:327-338.
8. Johnston SC, Brenu EW, Hardcastle S, et al. A comparison of health status in patients meeting alternative definitions for chronic fatigue syndrome/myalgic encephalomyelitis. Health Qual Life Outcomes. 2014;12:64.
9. Anderson VR, Jason LA, Hlavaty LE, et al. A review and meta-synthesis of qualitative studies on myalgic encephalomyelitis/chronic fatigue syndrome. Patient Educ Couns. 2012;86:147-155.
10. Christley Y, Duffy T, Everall IP, et al. The neuropsychiatric and neuropsychological features of chronic fatigue syndrome: revisiting the enigma. Curr Psychiatry Rep. 2013;15:353.
11. Henningsen P, Zimmermann T, Sattel HH. Medically unexplained physical symptoms, anxiety, and depression: a meta-analytic review. Psychosom Med. 2003;65:528-533.
12. Nater UM, Jones JF, Lin JM, et al. Personality features and personality disorders in chronic fatigue syndrome: a population-based study. Psychother Psychosom. 2010;79:312-318.
13. Taylor RR, Jason LA, Jahn SC. Chronic fatigue and sociodemographic characteristics as predictors of psychiatric disorders in a community-based sample. Psychosom Med. 2003;65:896-901.
14. Leonard B, Maes M. Mechanistic explanations of how cell-mediated immune activation, inflammation and oxidative and nitrosative stress pathways and their sequels and concomitants play a role in the pathophysiology of unipolar depression. Neurosci Biobehav Rev. 2012;36:764-785.
15. DeLuca J, Christodoulou C, Diamond BJ, et al. Working memory deficits in chronic fatigue syndrome: differentiating between speed and accuracy of information processing. J Int Neuropsychol Soc. 2004;10:101-109.
16. Cockshell SJ, Mathias JL. Cognitive functioning in chronic fatigue syndrome: a meta-analysis. Psychol Med. 2010;40:1253-1267.
17. Komaroff AL, Cho TA. Role of infection and neurologic dysfunction in chronic fatigue syndrome. Semin Neurol. 2011;31:325-337.
18. Naess H, Sundal E, Myhr KM, et al. Postinfectious and chronic fatigue syndromes: clinical experience from a tertiary-referral centre in Norway. In Vivo. 2010;24:185-188.
19. Hickie I, Davenport T, Wakefield D, et al; Dubbo Infection Outcomes Study Group. Post-infective and chronic fatigue syndromes precipitated by viral and non-viral pathogens: prospective cohort study. BMJ. 2006;333:575.
20. Plioplys AV, Plioplys S. Electron-microscopic investigation of muscle mitochondria in chronic fatigue syndrome.Neuropsychobiology. 1995;32: 175-181.
21. Vernon SD, Whistler T, Cameron B, et al. Preliminary evidence of mitochondrial dysfunction associated with post-infective fatigue after acute infection with Epstein Barr virus. BMC Infect Dis. 2006;6:15.
22. Miwa K, Fujita M. Fluctuation of serum vitamin E (alpha-tocopherol) concentrations during exacerbation and remission phases in patients with chronic fatigue syndrome. Heart Vessels. 2010;25:319-323.
23. Rosenblum H, Shoenfeld Y, Amital H. The common immunogenic etiology of chronic fatigue syndrome: from infections to vaccines via adjuvants to the ASIA syndrome. Infect Dis Clin North Am. 2011;25:851-863.
24. Vincent A, Brimmer DJ, Whipple MO, et al. Prevalence, incidence, and classification of chronic fatigue syndrome in Olmsted County, Minnesota as estimated using the Rochester Epidemiology Project. Mayo Clin Proc. 2012;87:1145-1152.
25. Goroll AH, Mulley AG. Primary Care Medicine: Office Evaluation and Management of the Adult Patient. 7th ed. Morrisville, PA: Wolters Kluwer; 2014.
26. Brown RF, Schutte NS. Direct and indirect relationships between emotional intelligence and subjective fatigue in university students. J Psychosom Res. 2006;60:585-593.
27. Pigeon WR, Sateia MJ, Ferguson RJ. Distinguishing between excessive daytime sleepiness and fatigue: toward improved detection and treatment. J Psychosom Res. 2003;54:61-69.
28. Bailes S, Libman E, Baltzan M, et al. Brief and distinct empirical sleepiness and fatigue scales. J Psychosom Res. 2006;60:605-613.
29. National Collaborating Centre for Primary Care (UK). Chronic Fatigue Syndrome/Myalgic Encephalomyelitis (or Encephalopathy): Diagnosis and Management of Chronic Fatigue Syndrome/Myalgic Encephalomyelitis (or Encephalopathy) in Adults and Children. London, UK: Royal College of General Practitioners; 2007.
30. Lane TJ, Matthews DA, Manu P. The low yield of physical examinations and laboratory investigations of patients with chronic fatigue. Am J Med Sci. 1990;299:313-318.
31. Vaucher P, Druisw PL, Waldvogel S, et al. Effect of iron supplementation on fatigue in nonanemic menstruating women with low ferritin: a randomized controlled trial.CMAJ. 2012;184:1247-1254.
32. US Preventive Services Task Force. Hepatitis C: Screening. US Preventive Services Task Force Web site. www.uspreventiveservicestaskforce.org/uspstf/uspshepc.htm. Accessed December 17, 2015.
33. Rolfe A, Burton C. Reassurance after diagnostic testing with a low pretest probability of serious disease: a systematic review and meta-analysis. JAMA Intern Med. 2013;173:407-416.
34. Smith RC, Lyles JS, Gardiner JC, et al. Primary care clinicians treat patients with medically unexplained symptoms: a randomized controlled trial. J Gen Intern Med. 2006;21:671-677.
35. White PD, Goldsmith KA, Johnson AL, et al; PACE trial management group. Comparison of adaptive pacing therapy, cognitive behaviour therapy, graded exercise therapy, and specialist medical care for chronic fatigue (PACE): a randomised trial. Lancet. 2011;377:823-836.
36. van Weert E, Hoekstra-Weebers J, Otter R, et al. Cancer-related fatigue: predictors and effects of rehabilitation. Oncologist. 2006;11:184-196.
CASE Lauren C, age 35, presents with fatigue, which she says started at least eight months ago and has progressively worsened. The patient, a clerical worker, says she manages to do an adequate job but goes home feeling utterly exhausted each night.
Lauren says she sleeps well, getting more than eight hours of sleep per night on weekends but less than seven hours per night during the week. But no matter how long she sleeps, she never awakens feeling refreshed. Lauren reports that she doesn’t smoke, has no more than four alcoholic drinks per month, and adheres to an “average” diet. She is too tired to exercise.
Lauren is single, with no children. Although she says she has a strong network of family and friends, she increasingly finds she has no energy for socializing. If Lauren were your patient, what would you do?
Fatigue is a common presenting symptom in primary care, accounting for about 5% of adult visits.1 Defined as a generalized lack of energy, fatigue that persists despite adequate rest or is severe enough to disrupt an individual’s ability to participate in key social and/or occupational activities warrants a thorough investigation.
Because fatigue is a nonspecific symptom that may be linked to a number of medical and psychiatric illnesses or to medications used to treat them, determining the cause can be difficult. In about half of all cases, no specific etiology is found.2This review, which includes the elements of a work-up and management strategies for patients presenting with ongoing fatigue, will help you arrive at the appropriate diagnosis and provide optimal treatment.
CHRONIC FATIGUE: DEFINING THE TERMS
A definition of chronic fatigue syndrome (CFS) was initially published in 1988.3In subsequent years, the term myalgic encephalomyelitis (ME) became popular. Although the terms are sometimes used interchangeably, ME often refers to patients whose condition is thought to have an infectious cause and for whom postexertional malaise is a hallmark symptom.4
CDC criteria. While several sets of diagnostic criteria for CFS have been developed, the most widely used is that of the CDC, published in 1994 (see Table 1).5,6A diagnosis of CFS is made on the basis of exclusion, subjective clinical interpretation, and patient self-report.
When the first two criteria—fatigue not due to ongoing exertion or other medical conditions that has lasted ≥ 6 months and is severe enough to interfere with daily activities—but fewer than four of the CDC’s eight concurrent symptoms (eg, headache, unrefreshing sleep, and postexertion malaise lasting > 24 h) are present, idiopathic fatigue, rather than CFS, is diagnosed.6
International Consensus Criteria (ICC). In 2011, the ICC for ME were proposed in an effort to provide more specific diagnostic criteria (see Table 2).7The ICC emphasize fatigability, or what the authors identify as “post-exertional neuroimmune exhaustion.”
The ICC have not yet been broadly researched. But an Australian study of patients with chronic fatigue found that those who met the ICC definition were sicker and more homogeneous, with significantly lower scores for physical and social functioning and bodily pain, compared with those who fulfilled the CDC criteria alone.8
Continue for common threads of chronic fatigue & neuropsychiatric conditions >>
CHRONIC FATIGUE & NEUROPSYCHIATRIC CONDITIONS: COMMON THREADS
Recent research has made it clear that depression, somatization, and CFS share some biological underpinnings. These include biomarkers for inflammation, cell-mediated immune activation—which may be related to the symptoms of fatigue—autonomic dysfunction, and hyperalgesia.9Evidence suggests that up to two-thirds of patients with CFS also meet the criteria for a psychiatric disorder.10The most common psychiatric conditions are major depressive disorder (MDD), affecting an estimated 22% to 32% of those with CFS; anxiety disorder, affecting about 20%; and somatization disorder, affecting about 10%—at least double the incidence of the general population.10
Others point out, however, that up to half of those with CFS do not have a psychiatric disorder.11A diagnosis of somatization disorder, in particular, depends largely on a subjective interpretation of whether the presenting symptoms have a physical cause.10
CFS and MDD comorbidity. The most widely studied association between CFS and psychiatric disorders involves MDD. Observational studies have found patients with CFS have a lifetime prevalence of MDD of 65%,12,13which is higher than that of patients with other chronic diseases. Overlapping symptoms include fatigue, sleep disturbance, poor concentration, and memory problems. However, those with CFS have fewer symptoms related to anhedonia, poor self-esteem, guilt, and suicidal ideation compared with individuals with MDD.12,13
There are several possible explanations for CFS and MDD comorbidity, which are not necessarily mutually exclusive.10One theory is that CFS is an atypical form of depression; another holds that the disability associated with CFS leads to depression, as is the case with many other chronic illnesses; and a third points to overlapping pathophysiology.10
An emerging body of evidence suggests that CFS and MDD have some common oxidative and nitrosative biochemical pathways. Activated by infection, psychologic stress, and immune disorders, they are believed to have damaging free radical and nitric oxide effects at the cellular level.14The cellular effects can result in fatigue, muscle pain, and flulike malaise.
Cortisol response differs
CFS and MDD might be distinguishable by another pathway—the hypothalamic-pituitary-adrenal (HPA) axis. MDD is classically associated with activation and raised cortisol levels, while CFS is consistently associated with impaired HPA axis functioning and reduced cortisol levels.10The majority of patients with CFS report symptoms of cognitive decline, with the acquisition of new verbal learning and information-processing speed particularly likely to be impaired.15
A meta-analysis of 50 studies of patients with CFS showed deficits in attention, memory, and reaction time, but not in fine motor speed, vocabulary, or reasoning.16Autonomic dysfunction has also been observed, including disordered sympathetic activity. The most frequently observed abnormalities on autonomic testing are postural hypotension, tachycardia syndrome, neurally mediated hypotension, and heart rate variability during tilt table testing.16
THE LINK BETWEEN INFECTION AND CFS
Several infectious agents have been associated with ME/CFS, including the Epstein-Barr virus (EBV), herpes simplex virus 6, parvovirus, Q fever, and Lyme disease.8,17,18 Most agents that have been linked to ME/CFS are associated with persistent infection and thus incitement of the immune system.
Numerous observational studies17,18have documented postinfectious fatigue syndromes after acute viral and bacterial infections and symptoms suggestive of infection, such as fever, myalgias, and respiratory and gastrointestinal distress. In one prospective Australian study,19investigators identified 253 cases of acute EBV, Ross River virus, and Q fever. Of those 253 patients, 12% went on to develop CFS, with a higher likelihood among those with more severe acute symptoms. No correlation with preexisting psychiatric disorders was found.
Muscle mitochondria studies have demonstrated what appear to be acquired abnormalities in those with CFS.20,21Signs of increased oxidative stress have been found in both blood and muscle samples from patients with CFS, and longitudinal studies suggest that oxidative stress is greatest during periods of clinical exacerbation.22Increased lactate levels suggest increased anaerobic metabolism in the central nervous system consistent with mitochondrial dysfunction. Several studies have demonstrated that exercise can precipitate oxidative stress in patients with CFS, in contrast with healthy controls and controls with other chronic illnesses, suggesting a physiologic basis for their postexertional symptoms.17
Autoinflammatory syndrome induced by adjuvants, a rare syndrome associated with vaccine administration, has been linked to postvaccination adverse events, exposure to silicone implants, Gulf War syndrome (related to multiple vaccinations), and macrophagic myofasciitis. All involve exposure to immune adjuvants and have similar clinical manifestations. The corresponding exposures appear to trigger an autoimmune response in susceptible individuals. The hepatitis B vaccine is most often associated with CFS, with symptoms occurring within 90 days of administration.23
Continue for the clinical work-up >>
THE CLINICAL WORK-UP: PUTTING KNOWLEDGE INTO PRACTICE
Familiarity with potential causes of and connections with ME/CFS will help you ensure that patients who say they’re always tired receive a thorough work-up. Start with a medical history, inquiring directly about medical and psychiatric disorders that may contribute to fatigue (see Table 3).5,24,25 Include a medication history as well, to help determine whether the fatigue is drug-related (see Table 4).5,25
What to ask. Determine the onset, course, duration, daily pattern, and impact of fatigue on the patient’s daily life. Inquire, too, about related symptoms of daytime sleepiness, dyspnea on exertion, generalized weakness, and depressed mood. The prominence of any of these rather than fatigue, per se, point to a diagnosis of a chronic illness other than ME/CFS.
Keep in mind, too, that patients with an organ-based medical illness tend to associate their fatigue with activities that they are unable to complete, such as shopping or light housework. In contrast, those with fatigue that is not organ-based typically say that they’re tired all the time. Their fatigue is not necessarily related to exertion, nor does it improve with rest.26
To address this distinction, take a sleep history, assessing both the quality and quantity of the patient’s sleep to determine how it affects symptoms.27 Consider using a questionnaire designed to help distinguish between sleepiness—and a primary sleep disorder—and fatigue,28 such as the Fatigue Severity Scale of Sleep Disorders (www.healthywomen.org/sites/default/files/FatigueSeverityScale.pdf).
What to rule out. In addition to a medical history, the physical examination should be oriented toward ruling out secondary causes of fatigue. In addition to a system-by-system approach to the differential diagnosis, carefully observe the patient’s general appearance, with attention to his or her level of alertness, grooming, and psychomotor agitation or retardation as possible signs of a psychiatric disorder. To rule out neurologic causes, evaluate muscle bulk, tone, and strength; deep tendon reflexes; and sensory and cranial nerves, as well.29
Lab tests to consider. In most cases of ME/CFS, basic studies—complete blood count with differential, erythrocyte sedimentation rate, blood chemistry, and thyroid-stimulating hormone (TSH) levels—are sufficient. When no medical or psychiatric cause has been found, additional tests may be ordered on a case-by-case basis, although laboratory analysis affects the management of fatigue in less than 5% of such patients.30 Tests to consider include:
• Creatine kinase (for patients who report pain or muscle weakness)
• Pregnancy test (for women of childbearing age)
• Ferritin testing (for young women who might benefit from iron supplementation for levels < 50 ng/mL even if anemia is not present)31
• Hepatitis C screening (recommended by the US Preventive Services Task Force for those born between 1945 and 1965)32
• HIV screening and the purified protein derivative test for tuberculosis (based on patient history).
Forego routine testing for other infections
Routine testing for infectious diseases and conditions associated with fatigue, such as EBV or Lyme disease, immune deficiency (eg, immunoglobulins), inflammatory disease (eg, antinuclear antibodies, rheumatoid factor), celiac disease, vitamin D deficiency, vitamin B12 deficiency, or heavy metal toxicity, is unlikely to be helpful.29 Additional testing simply to reassure a worried patient usually does not accomplish that objective.33
Additional studies, referrals to consider. If you suspect that a patient has a sleep disorder, a referral to a sleep clinic to rule out idiopathic sleep disorders, obstructive sleep apnea, or movement disorders that interfere with sleep may be in order. Spirometry and echocardiography may be helpful for some patients. If you suspect peripheral muscle fatigue, a referral for neuromuscular testing is indicated.
Lauren’s medical history reveals that she also has irritable bowel syndrome, which she manages with diet and OTC medication, as needed for constipation or diarrhea. She denies having any other chronic conditions. Her only other symptoms, she reports, are mild upper back pain after spending long hours at the computer and arthralgias in her left knee and both hands. She admits to being “somewhat depressed” in the last few months but denies the presence of anhedonia.
The patient’s physical examination is normal, and her depression screen does not meet the criteria for MDD. Her metabolic chemistry panel, complete blood count, TSH, and sedimentation rate are all normal, as well.
Continue for symptom management and coping strategies >>
SYMPTOM MANAGEMENT AND COPING STRATEGIES
When no specific cause of chronic fatigue is found, the focus shifts from diagnosis to symptom management and coping strategies. This requires engagement with the patient. It is important to acknowledge the existence of his or her symptoms and to reassure the patient that further investigation may be warranted later, should new symptoms emerge. Advise the patient, too, that periods of remission and relapse are likely.
Strategies designed to motivate patient self-management, as well as the formulation of patient-centered treatment plans, have been shown to reduce symptom scores.34 Participation in a support group, as well as frequent follow-up visits with a primary care provider, a behavioral therapist, or both, may help to provide needed psychologic support.
Evidence of the effectiveness of specific therapies for ME/CFS is limited; however, the best-studied approaches are cognitive behavioral therapy (CBT) and graded exercise therapy.35 Exercise should be low intensity, such as walking or cycling for 30 minutes three times a week, with a gradual increase in duration and frequency over a period of weeks to months. Patients with cancer-related fatigue may benefit from yoga, group therapy, and stress management.36
Associated mood and pain symptoms should be treated, as well. Bupropion, which is somewhat stimulating, may be considered as an initial treatment for patients with depression and clinically significant fatigue.
Other potentially beneficial approaches include a healthy diet, avoidance of more than nominal amounts of alcohol, relative avoidance of caffeine (no more than one cup of a caffeinated beverage in the morning), and stress reduction techniques.
Attention to good sleep hygiene may be especially beneficial, including a regular bedtime routine and sleep schedule, and elimination of bedroom light and noise. Pharmacologic treatments for insomnia should be used with caution, if at all.
Lauren receives a referral for CBT and is scheduled for a return visit in four weeks. At the advice of both her primary care provider and the behavioral therapist, she gradually makes several lifestyle changes. She begins going to bed earlier on weeknights to ensure that she sleeps for at least seven hours. She improves her diet, with increasing emphasis on vegetables, fruits, and whole grains. She also starts a walking program, increasing gradually to a total of three hours per week. After four months, she adds a weekly trip to a gym, where she practices resistance training for about 40 minutes.
Lauren also increases her social activities on weekends and recently accepted an invitation to join a book club. Six months from her initial visit, she notes that although she is still more easily fatigued than most people, she has made significant improvement
REFERENCES
1. Nijrolder I, van der Windt DA, van der Horst HE. Prognosis of fatigue and functioning in primary care: a 1-year follow-up study. Ann Fam Med. 2008;6:519-527.
2. Griffith JP, Zarrouf FA. A systematic review of chronic fatigue syndrome: don’t assume it’s depression. Prim Care Companion J Clin Psychiatry. 2008;10:120-128.
3. Holmes GP, Kaplan JE, Gantz NM, et al. Chronic fatigue syndrome: a working case definition. Ann Intern Med. 1988;108:387-389.
4. Morris G, Maes M. Case definitions and diagnostic criteria for myalgic encephalomyelitis and chronic fatigue syndrome: from clinical consensus to evidence-based case definitions. Neuro Endocrinol Lett. 2013;34:185-199.
5. Fukuda K, Straus SE, Hickie I, et al. The chronic fatigue syndrome: a comprehensive approach to its definition and study. International Chronic Fatigue Syndrome Study Group. Ann Intern Med. 1994;121:953-959.
6. CDC. Chronic fatigue syndrome. www.cdc.gov/cfs/diagnosis/index.html. Accessed December 17, 2015.
7. Carruthers BM, van de Sande MI, De Meirleir KL, et al. Myalgic encephalomyelitis: International Consensus Criteria. J Intern Med. 2011;270:327-338.
8. Johnston SC, Brenu EW, Hardcastle S, et al. A comparison of health status in patients meeting alternative definitions for chronic fatigue syndrome/myalgic encephalomyelitis. Health Qual Life Outcomes. 2014;12:64.
9. Anderson VR, Jason LA, Hlavaty LE, et al. A review and meta-synthesis of qualitative studies on myalgic encephalomyelitis/chronic fatigue syndrome. Patient Educ Couns. 2012;86:147-155.
10. Christley Y, Duffy T, Everall IP, et al. The neuropsychiatric and neuropsychological features of chronic fatigue syndrome: revisiting the enigma. Curr Psychiatry Rep. 2013;15:353.
11. Henningsen P, Zimmermann T, Sattel HH. Medically unexplained physical symptoms, anxiety, and depression: a meta-analytic review. Psychosom Med. 2003;65:528-533.
12. Nater UM, Jones JF, Lin JM, et al. Personality features and personality disorders in chronic fatigue syndrome: a population-based study. Psychother Psychosom. 2010;79:312-318.
13. Taylor RR, Jason LA, Jahn SC. Chronic fatigue and sociodemographic characteristics as predictors of psychiatric disorders in a community-based sample. Psychosom Med. 2003;65:896-901.
14. Leonard B, Maes M. Mechanistic explanations of how cell-mediated immune activation, inflammation and oxidative and nitrosative stress pathways and their sequels and concomitants play a role in the pathophysiology of unipolar depression. Neurosci Biobehav Rev. 2012;36:764-785.
15. DeLuca J, Christodoulou C, Diamond BJ, et al. Working memory deficits in chronic fatigue syndrome: differentiating between speed and accuracy of information processing. J Int Neuropsychol Soc. 2004;10:101-109.
16. Cockshell SJ, Mathias JL. Cognitive functioning in chronic fatigue syndrome: a meta-analysis. Psychol Med. 2010;40:1253-1267.
17. Komaroff AL, Cho TA. Role of infection and neurologic dysfunction in chronic fatigue syndrome. Semin Neurol. 2011;31:325-337.
18. Naess H, Sundal E, Myhr KM, et al. Postinfectious and chronic fatigue syndromes: clinical experience from a tertiary-referral centre in Norway. In Vivo. 2010;24:185-188.
19. Hickie I, Davenport T, Wakefield D, et al; Dubbo Infection Outcomes Study Group. Post-infective and chronic fatigue syndromes precipitated by viral and non-viral pathogens: prospective cohort study. BMJ. 2006;333:575.
20. Plioplys AV, Plioplys S. Electron-microscopic investigation of muscle mitochondria in chronic fatigue syndrome.Neuropsychobiology. 1995;32: 175-181.
21. Vernon SD, Whistler T, Cameron B, et al. Preliminary evidence of mitochondrial dysfunction associated with post-infective fatigue after acute infection with Epstein Barr virus. BMC Infect Dis. 2006;6:15.
22. Miwa K, Fujita M. Fluctuation of serum vitamin E (alpha-tocopherol) concentrations during exacerbation and remission phases in patients with chronic fatigue syndrome. Heart Vessels. 2010;25:319-323.
23. Rosenblum H, Shoenfeld Y, Amital H. The common immunogenic etiology of chronic fatigue syndrome: from infections to vaccines via adjuvants to the ASIA syndrome. Infect Dis Clin North Am. 2011;25:851-863.
24. Vincent A, Brimmer DJ, Whipple MO, et al. Prevalence, incidence, and classification of chronic fatigue syndrome in Olmsted County, Minnesota as estimated using the Rochester Epidemiology Project. Mayo Clin Proc. 2012;87:1145-1152.
25. Goroll AH, Mulley AG. Primary Care Medicine: Office Evaluation and Management of the Adult Patient. 7th ed. Morrisville, PA: Wolters Kluwer; 2014.
26. Brown RF, Schutte NS. Direct and indirect relationships between emotional intelligence and subjective fatigue in university students. J Psychosom Res. 2006;60:585-593.
27. Pigeon WR, Sateia MJ, Ferguson RJ. Distinguishing between excessive daytime sleepiness and fatigue: toward improved detection and treatment. J Psychosom Res. 2003;54:61-69.
28. Bailes S, Libman E, Baltzan M, et al. Brief and distinct empirical sleepiness and fatigue scales. J Psychosom Res. 2006;60:605-613.
29. National Collaborating Centre for Primary Care (UK). Chronic Fatigue Syndrome/Myalgic Encephalomyelitis (or Encephalopathy): Diagnosis and Management of Chronic Fatigue Syndrome/Myalgic Encephalomyelitis (or Encephalopathy) in Adults and Children. London, UK: Royal College of General Practitioners; 2007.
30. Lane TJ, Matthews DA, Manu P. The low yield of physical examinations and laboratory investigations of patients with chronic fatigue. Am J Med Sci. 1990;299:313-318.
31. Vaucher P, Druisw PL, Waldvogel S, et al. Effect of iron supplementation on fatigue in nonanemic menstruating women with low ferritin: a randomized controlled trial.CMAJ. 2012;184:1247-1254.
32. US Preventive Services Task Force. Hepatitis C: Screening. US Preventive Services Task Force Web site. www.uspreventiveservicestaskforce.org/uspstf/uspshepc.htm. Accessed December 17, 2015.
33. Rolfe A, Burton C. Reassurance after diagnostic testing with a low pretest probability of serious disease: a systematic review and meta-analysis. JAMA Intern Med. 2013;173:407-416.
34. Smith RC, Lyles JS, Gardiner JC, et al. Primary care clinicians treat patients with medically unexplained symptoms: a randomized controlled trial. J Gen Intern Med. 2006;21:671-677.
35. White PD, Goldsmith KA, Johnson AL, et al; PACE trial management group. Comparison of adaptive pacing therapy, cognitive behaviour therapy, graded exercise therapy, and specialist medical care for chronic fatigue (PACE): a randomised trial. Lancet. 2011;377:823-836.
36. van Weert E, Hoekstra-Weebers J, Otter R, et al. Cancer-related fatigue: predictors and effects of rehabilitation. Oncologist. 2006;11:184-196.
Female Athletes: Unique Challenges Facing Women Warriors
Since Title IX passed in 1972, women have become exponentially more involved in competitive sports, from high school to professional levels. With more women engaging in serious athletics, the specific challenges they face have come to the forefront of sports medicine. These problems include the female athlete triad, concussions, exercise safety in pregnancy, anterior cruciate ligament (ACL) injuries, and continued sex discrimination and social injustice. Orthopedists treating female athletes should be aware of these problems, each of which is discussed in this review.
1. Female athlete triad
In 1992, the term female athlete triad was coined to describe 3 problems that often coexist in high-intensity female athletes.1 Since then, the definition has evolved, but the problem has remained essentially the same. The modern definition incorporates menstrual abnormalities, low energy availability with or without disordered eating, and decreased bone mineral density (BMD).2
With intense exercise and weight loss comes a variety of menstrual disturbances.3 In affected athletes, the hypothalamus is underactivated, and changes in gonadotropin-releasing hormone and luteinizing hormone lead to decreased estrogen production. Research suggests abnormal menses result from having inadequate energy and insufficient caloric intake to support extensive exercise.1 This phenomenon can occur in athletes in any sport but is most prevalent in lean-body sports, such as swimming, gymnastics, and ballet. The incidence of abnormal menses is as high as 79% in ballet dancers but only 5% in the general population.3 Menstrual abnormalities indicate hormonal abnormalities that can interfere with growth and maturation in young athletes.
Although full-blown eating disorders are uncommon among female athletes, disordered eating patterns are often found among women in competitive sports. Disordered eating can involve a spectrum of inadequate caloric intake and purging behavior, such as vomiting or laxative abuse, and has been reported in up to 25% of collegiate female athletes.4 Physicians must recognize these conditions and initiate counseling and treatment when appropriate. Women with disordered eating are at risk for developing electrolyte imbalances, malnutrition syndromes, and osteopenia.
Although careful evaluation and counseling are important, physicians must note that, in most cases, athletics participation may also protect against disordered eating and body image difficulties. A study of 146 college-age women found better body satisfaction among athletes than among nonathletes.5 Lean-sport athletes (eg, swimmers, gymnasts) were at higher risk for disordered eating and body image problems than other athletes were. Similarly, other studies have found that a majority of athletes have healthy eating habits.4
For poorly nourished and hormonally imbalanced female athletes, decreased BMD poses substantial risk. One study found a significant difference in BMD between athletes with amenorrhea and athletes with normal menses.6 In a cohort of female Navy recruits, those with amenorrhea were at 91% higher risk for stress fractures; calcium and vitamin D supplementation reduced risk by 20%.7 Osteopenia may be a special problem for prepubescent athletes. Girls who engage in intense exercise and have delayed menarche may have a low estrogen state, predisposing them to low BMD.3 Osteopenia and osteoporosis are difficult to reverse and can put these athletes at risk for stress fractures the rest of their lives. If unrecognized, stress fractures can end an athlete’s career.
Recommendations for dual-energy X-ray absorptiometry (DXA) include testing female athletes who have a diagnosed eating disorder, body mass index under 17.5, history of delayed menarche, oligomenorrhea, 2 prior stress fractures, or prior abnormal DXA scan. Complete testing recommendations appear in the 2014 consensus statement on the female athlete triad and return to sport.2,8
Orthopedists performing physical examinations for sports participation can screen for the female athlete triad through thoughtful questioning about menstrual history, nutrition habits, and stress fracture symptoms. Best treatment for a diagnosed case of the triad is multidisciplinary care with strong social support. When abnormal menses are an issue, referral to a gynecologist or endocrinologist and consideration of estrogen replacement should be discussed. Some cases require a psychiatrist’s assistance in treating disordered eating. Athletic trainers, coaches, and parents should be involved over the treatment course.1 Orthopedists must counsel women with osteopenia and osteoporosis about decreasing exercise to a safe level, improving nutritional intake, and supplementing with calcium (1200-1500 mg/d) and vitamin D (600-800 IU/d).3,7
2. Concussions
Increasing awareness of males’ sport-related concussions, particularly of concussions that occur during National Football League practice and games, has made physicians and researchers more aware of the rate of concussion in female athletes. That rate has increased, and, according to some reports, the risk for sport-related injury is higher for female athletes.9 A study of high school athletes found that the rate of concussion in girl’s soccer was second only to that in football.10
Concussions are categorized as mild traumatic brain injuries, and manifestations of the diagnosis are divided into physical, emotional, cognitive, and observed symptoms. The spectrum of symptoms is wide, ranging from difficulty concentrating and thinking clearly to headaches and dizziness.11 Compared with male athletes who sustain a concussion, female athletes report more of these concussive symptoms and have worse visual memory scores.12
Efforts to change sports at the player level have been resisted. Helmets have been proposed for field hockey and lacrosse but have not passed stringent concussion testing. In soccer, which has a high rate of concussion, a reform to eliminate heading the ball has been considered. Resistance to these suggestions stems from the thought that changes could alter the traditions of the games. Some individuals have indicated that helmets may give players a false sense of security and thereby cause them to play more aggressively.
Orthopedic surgeons must be aware of concussion symptoms. Multiple concussions may have a cumulative effect on functional ability and emotional well-being and may lead to chronic traumatic encephalopathy.13 Concern about the long-term effects of concussion has led to the implementation of universal “return to play” laws. These laws vary by state but have 3 steps in common: Educate coaches, players, and athletes; remove athletes from play; and obtain health care professionals’ permission to return to play.14 These guidelines set up an action plan for treating an athlete who has sustained a concussion.
Encouraging results of educating coaches have been noted. Coaches who were given Centers for Disease Control and Prevention–sponsored material on preventing, recognizing, and responding to concussions were able to effectively address concussions; 6 months later, 63% were better able to appreciate the severity of concussions.15 Continued education of athletic communities should help bring this injury to the attention of those treating female athletes.
3. Exercise safety in pregnancy
Women in sports can continue their athletic regimens during pregnancy. It is important to address challenges to the pregnant woman and to the fetus when assessing the risks of exercise.
The physiologic changes that occur during pregnancy may affect how a pregnant athlete responds to stress. Plasma volume, red blood cell volume, and cardiac function and output all increase during normal pregnancy.3,16 Abnormal heart rate during pregnancy can adversely affect the fetus. During and after exercise, fetal bradycardia can occur. Therefore, recommendations should include not exceeding pre-pregnancy activity levels.3 Careful monitoring of exercise intensity is recommended by the American College of Obstetrics and Gynecology; the guideline is to maintain less than 70% of maximal heart rate.17,18
The negative effects of exercise on the pregnant athlete are limited, but it is important to educate patients and to consider preventive strategies. One physiologic change that occurs during pregnancy is ligamentous laxity, which is caused by the hormone relaxin.16 Ligamentous laxity has the potential to put pregnant athletes at risk for soft-tissue and bony injury during impact sports. However, the positive effects of exercise during pregnancy include improved appetite, sleep, and emotional health.19 Aerobic exercise during pregnancy may reverse insulin resistance as demonstrated in animal studies; though this outcome has not been demonstrated in human studies,20 women should be reassured that moderate exercise has overall beneficial effects.
Some research suggests that exercise may expose the fetus to hyperthermia, blood sugar changes, physical injury, and premature labor.16 Typically, fetal heat is dissipated from the mother. After intense exercise, maternal body temperature rises and leads to some degree of fetal hyperthermia.16 Animal model studies have suggested that hyperthermia may result in a slightly higher rate of congenital abnormalities. Pregnant women should keep their exercise routines to less than 60 minutes, should exercise in a thermally regulated environment, and should keep themselves hydrated to avoid fetal hyperthermia.18
Reduced blood flow, accompanied by a deficit of oxygen to the uterus and the developing fetus, is another concern for pregnant athletes. During exercise, when more blood is flowing to the muscles, less is flowing to the uterus.16 Furthermore, during the third trimester, women should avoid supine exercise, as venous outflow is poor with the body in that position.21
Elite athletes who continue training during pregnancy should be carefully counseled about adjusting their training regimens. Because of increased cardiac output and blood volume, the heart rate will be lower than usual, demanding an adjustment in interpretation. Blood cell counts do not increase as much as plasma volume does—often leading to relative anemia. For elite athletes, this means iron supplementation is crucial.22 Thermal regulation may be more difficult, as training regimens may demand prolonged exercise. Physicians should recommend adequate hydration for these athletes.18
Although continued exercise is generally safe for a pregnant athlete and her fetus, caution is required when there is increased risk for premature delivery, or other special conditions exist. Multiple gestation, placenta previa, history of early labor or premature births, and incompetent cervix all contraindicate aerobic exercise during pregnancy.18 With these exceptions in mind, physicians can safely counsel pregnant women to do moderate exercise 30 minutes every day.17,18 Other recommendations are listed at the American College of Obstetricians and Gynecologists website.23
4. Anterior cruciate ligament injuries
ACL injuries affect a staggering number of athletes. In the United States, approximately 100,000 people sustain these injuries annually.24 As they occur up to 8 times more often in women than in men, ACL injuries are a top concern for physicians treating female athletes.
This disproportionate injury rate is influenced by differences between male and female anatomy. The width and shape of the femoral intercondylar notch have been studied as potential variables influencing the risk for ACL injury. Analysis of notch-view radiographs revealed a significant inverse relationship between notch width and ACL injury.25 A-shaped notches, notches with a significantly larger base and a narrowed roof, were more prevalent in women but did not correlate with increased risk for ACL injury. Studies have shown that female athletes with a noncontact ACL injury have a higher lateral tibial plateau posterior slope; this slope is associated with increased peak anteromedial ACL strain, which may contribute to injury.26 An analysis of magnetic resonance imaging scans in patients with and without ACL injury revealed that, for female patients, decreased femoral intercondylar notch width at the anterior outlet combined with increased lateral compartment posterior slope correlated best with risk for ACL injury.27
Although static anatomical factors contribute to ACL injuries in female athletes, dynamic neuromuscular influences are potential opportunities for intervention. Female athletes with high relative quadriceps strength and weak hamstring strength may be at increased risk for ACL injury.28 This “quadriceps dominance” becomes important in sports involving high-risk activities, such as running, cutting, pivoting, and jumping. In addition, compared with male athletes, female athletes demonstrate increased lateral trunk motion and knee valgus torque while landing during noncontact ACL tears, making core stability a factor in ACL injury.29
The collaborative efforts of physicians, physical therapists, athletic trainers, and coaches have yielded multifactorial neuromuscular training programs for the prevention of noncontact ACL injuries. Ideal ACL prevention protocols involve sessions that last for at least 10 minutes and take place 3 times a week. At these sessions, exercises are focused on strengthening, balance, and proprioceptive training.30 The programs last about 8 weeks, but sustained benefits require maintenance after the program has been completed and during the off-season. Program adherence must be encouraged and can be facilitated by varying workouts and raising risk awareness. The most effective programs have reduced the relative risk of noncontact ACL injuries by 75% to 100%.31 These promising results have led to increased focus on program implementation in an effort to prevent ACL injury.
5. Continued sex discrimination and social injustice
In 1972, Title IX was passed as part of the Education Amendments Act. Title IX states, “No person in the United States shall, on the basis of sex, be excluded from participation in, be denied the benefits of, or be subjected to discrimination under any educational program or activity receiving Federal financial assistance.” Passage of this law, which has implications outside of athletic participation, marked an important turning point in women’s ability to participate equally in college sports.32,33 The Civil Rights Restoration Act, passed in 1988, strengthened Title IX and made it applicable to all institutions receiving federal funding.34 Before the 1970s, women typically were restricted to club sports, and funding and participation opportunities were weighted heavily toward men. Over the past 40 years, women’s participation in high school, college, and professional sports has taken a huge leap forward.32 For example, the number of women participating in high school sports increased from 294,000 (7.4% of all athletes) in 1972 to 3.4 million (>41% of all athletes) in 2014.
Despite advances in women’s civil rights, examples of inequality in US schools remain, particularly in the distribution of funding, which still strongly favors men’s football.32 Men’s sports receive 90% of media coverage.33 In 2002, women represented 55% of college students but only 42% of varsity athletes.34 The schools that have complied the least with Title IX are schools in the Midwest and the South and those with football teams.34 Women are underrepresented as coaches, and funding continues to be disproportionately spent on men’s sports.
For women, the benefits of participating in sports are far-reaching and significant. These benefits include improvements in academic success, mental health, and responsible behavior.33 Women’s gaining acceptance and respect throughout the athletic world seems to have carried over elsewhere. Although many institutions remain noncompliant with Title IX, efforts continue to have a strongly positive effect on gender equality in the United States.
1. Nattiv A, Loucks AB, Manore MM, Sanborn CF, Sundgot-Borgen J, Warren MP; American College of Sports Medicine. American College of Sports Medicine position stand. The female athlete triad. Med Sci Sports Exerc. 2007;39(10):1867-1882.
2. De Souza MJ, Nattiv A, Joy E, et al; Expert Panel. 2014 Female Athlete Triad Coalition consensus statement on treatment and return to play of the female athlete triad: 1st international conference held in San Francisco, California, May 2012 and 2nd international conference held in Indianapolis, Indiana, May 2013. Br J Sports Med. 2014;48(4):289.
3. Warren MP, Shantha S. The female athlete. Baillieres Best Pract Res Clin Endocrinol Metab. 2000;14(1):37-53.
4. Greenleaf C, Petrie TA, Carter J, Reel JJ. Female collegiate athletes: prevalence of eating disorders and disordered eating behaviors. J Am Coll Health. 2009;57(5):489-495.
5. Reinking MF, Alexander LE. Prevalence of disordered-eating behaviors in undergraduate female collegiate athletes and nonathletes. J Athl Train. 2005;40(1):47-51.
6. Rencken ML, Chesnut CH 3rd, Drinkwater BL. Bone density at multiple skeletal sites in amenorrheic athletes. JAMA. 1996;276(3):238-240.
7. Lappe J, Cullen D, Haynatzki G, Recker R, Ahlf R, Thompson K. Calcium and vitamin D supplementation decreases incidence of stress fractures in female Navy recruits. J Bone Miner Res. 2008;23(5):741-749.
8. De Souza MJ. 2014 Female athlete triad consensus statement on guidelines for treatment and return to play. National Collegiate Athletic Association (NCAA) website. http://www.ncaa.org/health-and-safety/nutrition-and-performance/2014-female-athlete-triad-consensus-statement-guidelines. Accessed November 24, 2015.
9. Preiss-Farzanegan SJ, Chapman B, Wong TM, Wu J, Bazarian JJ. The relationship between gender and postconcussion symptoms after sport-related mild traumatic brain injury. PM R. 2009;1(3):245-253.
10. Marar M, McIlvain NM, Fields SK, Comstock RD. Epidemiology of concussions among United States high school athletes in 20 sports. Am J Sports Med. 2012;40(4):747-755.
11. Uhl RL, Rosenbaum AJ, Czajka C, Mulligan M, King C. Minor traumatic brain injury: a primer for the orthopaedic surgeon. J Am Acad Orthop Surg. 2013;21(10):624-631.
12. Covassin T, Elbin RJ, Harris W, Parker T, Kontos A. The role of age and sex in symptoms, neurocognitive performance, and postural stability in athletes after concussion. Am J Sports Med. 2012;40(6):1303-1312.
13. Covassin T, Moran R, Wilhelm K. Concussion symptoms and neurocognitive performance of high school and college athletes who incur multiple concussions. Am J Sports Med. 2013;41(12):2885-2889.
14. Sports concussion policies and laws: information for parents, coaches, and school & sports professionals. Centers for Disease Control and Prevention website. http://www.cdc.gov/headsup/policy/index.html. Updated February 16, 2015. Accessed November 24, 2015.
15. Covassin T, Elbin RJ, Sarmiento K. Educating coaches about concussion in sports: evaluation of the CDC’s “Heads Up: concussion in youth sports” initiative. J Sch Health. 2012;82(5):233-238.
16. Lumbers ER. Exercise in pregnancy: physiological basis of exercise prescription for the pregnant woman. J Sci Med Sport. 2002;5(1):20-31.
17. ACOG Committee Obstetric Practice. ACOG Committee opinion. Number 267, January 2002: exercise during pregnancy and the postpartum period. Obstet Gynecol. 2002;99(1):171-173.
18. Artal R, O’Toole M. Guidelines of the American College of Obstetricians and Gynecologists for exercise during pregnancy and the postpartum period. Br J Sports Med. 2003;37(1):6-12.
19. Kramer MS. Regular aerobic exercise during pregnancy. Cochrane Database Syst Rev. 2000;(2):CD000180. Update in: Cochrane Database Syst Rev. 2002;(2):CD000180.
20. Stafne SN, Salvesen KA, Romundstad PR, Stuge B, Morkved S. Does regular exercise during pregnancy influence lumbopelvic pain? A randomized controlled trial. Acta Obstet Gynecol Scand. 2012;91(5):552-559.
21. Nascimento SL, Surita FG, Cecatti JG. Physical exercise during pregnancy: a systematic review. Curr Opin Obstet Gynecol. 2012;24(6):387-394.
22. Hale RW, Milne L. The elite athlete and exercise in pregnancy. Semin Perinatol. 1996;20(4):277-284.
23. Exercise during pregnancy. American College of Obstetricians and Gynecologists website. http://www.acog.org/Patients/FAQs/Exercise-During-Pregnancy. Published August 2011. Accessed November 24, 2015.
24. Giugliano DN, Solomon JL. ACL tears in female athletes. Phys Med Rehabil Clin North Am. 2007;18(3):417-438, viii.
25. Ireland ML, Ballantyne BT, Little K, McClay IS. A radiographic analysis of the relationship between the size and shape of the intercondylar notch and anterior cruciate ligament injury. Knee Surg Sports Traumatol Arthrosc. 2001;9(4):200-205.
26. Lipps DB, Oh YK, Ashton-Miller JA, Wojtys EM. Morphologic characteristics help explain the gender difference in peak anterior cruciate ligament strain during a simulated pivot landing. Am J Sports Med. 2012;40(1):32-40.
27. Sturnick DR, Vacek PM, DeSarno MJ, et al. Combined anatomic factors predicting risk of anterior cruciate ligament injury for males and females. Am J Sports Med. 2015;43(4):839-847.
28. Myer GD, Ford KR, Barber Foss KD, Liu C, Nick TG, Hewett TE. The relationship of hamstrings and quadriceps strength to anterior cruciate ligament injury in female athletes. Clin J Sport Med. 2009;19(1):3-8.
29. Hewett TE, Torg JS, Boden BP. Video analysis of trunk and knee motion during non-contact anterior cruciate ligament injury in female athletes: lateral trunk and knee abduction motion are combined components of the injury mechanism. Br J Sports Med. 2009;43(6):417-422.
30. Sutton KM, Bullock JM. Anterior cruciate ligament rupture: differences between males and females. J Am Acad Orthop Surg. 2013;21(1):41-50.
31. Noyes FR, Barber-Westin SD. Neuromuscular retraining intervention programs: do they reduce noncontact anterior cruciate ligament injury rates in adolescent female athletes? Arthroscopy. 2014;30(2):245-255.
32. Ladd AL. The sports bra, the ACL, and Title IX—the game in play. Clin Orthop Relat Res. 2014;472(6):1681-1684.
33. Lopiano DA. Modern history of women in sports. Twenty-five years of Title IX. Clin Sports Med. 2000;19(2):163-173, vii.
34. Anderson DJ, Cheslock JJ, Ehrenberg RG. Gender equity in intercollegiate athletics: determinants of Title IX compliance. J High Educ. 2006;77(2):225-250.
Since Title IX passed in 1972, women have become exponentially more involved in competitive sports, from high school to professional levels. With more women engaging in serious athletics, the specific challenges they face have come to the forefront of sports medicine. These problems include the female athlete triad, concussions, exercise safety in pregnancy, anterior cruciate ligament (ACL) injuries, and continued sex discrimination and social injustice. Orthopedists treating female athletes should be aware of these problems, each of which is discussed in this review.
1. Female athlete triad
In 1992, the term female athlete triad was coined to describe 3 problems that often coexist in high-intensity female athletes.1 Since then, the definition has evolved, but the problem has remained essentially the same. The modern definition incorporates menstrual abnormalities, low energy availability with or without disordered eating, and decreased bone mineral density (BMD).2
With intense exercise and weight loss comes a variety of menstrual disturbances.3 In affected athletes, the hypothalamus is underactivated, and changes in gonadotropin-releasing hormone and luteinizing hormone lead to decreased estrogen production. Research suggests abnormal menses result from having inadequate energy and insufficient caloric intake to support extensive exercise.1 This phenomenon can occur in athletes in any sport but is most prevalent in lean-body sports, such as swimming, gymnastics, and ballet. The incidence of abnormal menses is as high as 79% in ballet dancers but only 5% in the general population.3 Menstrual abnormalities indicate hormonal abnormalities that can interfere with growth and maturation in young athletes.
Although full-blown eating disorders are uncommon among female athletes, disordered eating patterns are often found among women in competitive sports. Disordered eating can involve a spectrum of inadequate caloric intake and purging behavior, such as vomiting or laxative abuse, and has been reported in up to 25% of collegiate female athletes.4 Physicians must recognize these conditions and initiate counseling and treatment when appropriate. Women with disordered eating are at risk for developing electrolyte imbalances, malnutrition syndromes, and osteopenia.
Although careful evaluation and counseling are important, physicians must note that, in most cases, athletics participation may also protect against disordered eating and body image difficulties. A study of 146 college-age women found better body satisfaction among athletes than among nonathletes.5 Lean-sport athletes (eg, swimmers, gymnasts) were at higher risk for disordered eating and body image problems than other athletes were. Similarly, other studies have found that a majority of athletes have healthy eating habits.4
For poorly nourished and hormonally imbalanced female athletes, decreased BMD poses substantial risk. One study found a significant difference in BMD between athletes with amenorrhea and athletes with normal menses.6 In a cohort of female Navy recruits, those with amenorrhea were at 91% higher risk for stress fractures; calcium and vitamin D supplementation reduced risk by 20%.7 Osteopenia may be a special problem for prepubescent athletes. Girls who engage in intense exercise and have delayed menarche may have a low estrogen state, predisposing them to low BMD.3 Osteopenia and osteoporosis are difficult to reverse and can put these athletes at risk for stress fractures the rest of their lives. If unrecognized, stress fractures can end an athlete’s career.
Recommendations for dual-energy X-ray absorptiometry (DXA) include testing female athletes who have a diagnosed eating disorder, body mass index under 17.5, history of delayed menarche, oligomenorrhea, 2 prior stress fractures, or prior abnormal DXA scan. Complete testing recommendations appear in the 2014 consensus statement on the female athlete triad and return to sport.2,8
Orthopedists performing physical examinations for sports participation can screen for the female athlete triad through thoughtful questioning about menstrual history, nutrition habits, and stress fracture symptoms. Best treatment for a diagnosed case of the triad is multidisciplinary care with strong social support. When abnormal menses are an issue, referral to a gynecologist or endocrinologist and consideration of estrogen replacement should be discussed. Some cases require a psychiatrist’s assistance in treating disordered eating. Athletic trainers, coaches, and parents should be involved over the treatment course.1 Orthopedists must counsel women with osteopenia and osteoporosis about decreasing exercise to a safe level, improving nutritional intake, and supplementing with calcium (1200-1500 mg/d) and vitamin D (600-800 IU/d).3,7
2. Concussions
Increasing awareness of males’ sport-related concussions, particularly of concussions that occur during National Football League practice and games, has made physicians and researchers more aware of the rate of concussion in female athletes. That rate has increased, and, according to some reports, the risk for sport-related injury is higher for female athletes.9 A study of high school athletes found that the rate of concussion in girl’s soccer was second only to that in football.10
Concussions are categorized as mild traumatic brain injuries, and manifestations of the diagnosis are divided into physical, emotional, cognitive, and observed symptoms. The spectrum of symptoms is wide, ranging from difficulty concentrating and thinking clearly to headaches and dizziness.11 Compared with male athletes who sustain a concussion, female athletes report more of these concussive symptoms and have worse visual memory scores.12
Efforts to change sports at the player level have been resisted. Helmets have been proposed for field hockey and lacrosse but have not passed stringent concussion testing. In soccer, which has a high rate of concussion, a reform to eliminate heading the ball has been considered. Resistance to these suggestions stems from the thought that changes could alter the traditions of the games. Some individuals have indicated that helmets may give players a false sense of security and thereby cause them to play more aggressively.
Orthopedic surgeons must be aware of concussion symptoms. Multiple concussions may have a cumulative effect on functional ability and emotional well-being and may lead to chronic traumatic encephalopathy.13 Concern about the long-term effects of concussion has led to the implementation of universal “return to play” laws. These laws vary by state but have 3 steps in common: Educate coaches, players, and athletes; remove athletes from play; and obtain health care professionals’ permission to return to play.14 These guidelines set up an action plan for treating an athlete who has sustained a concussion.
Encouraging results of educating coaches have been noted. Coaches who were given Centers for Disease Control and Prevention–sponsored material on preventing, recognizing, and responding to concussions were able to effectively address concussions; 6 months later, 63% were better able to appreciate the severity of concussions.15 Continued education of athletic communities should help bring this injury to the attention of those treating female athletes.
3. Exercise safety in pregnancy
Women in sports can continue their athletic regimens during pregnancy. It is important to address challenges to the pregnant woman and to the fetus when assessing the risks of exercise.
The physiologic changes that occur during pregnancy may affect how a pregnant athlete responds to stress. Plasma volume, red blood cell volume, and cardiac function and output all increase during normal pregnancy.3,16 Abnormal heart rate during pregnancy can adversely affect the fetus. During and after exercise, fetal bradycardia can occur. Therefore, recommendations should include not exceeding pre-pregnancy activity levels.3 Careful monitoring of exercise intensity is recommended by the American College of Obstetrics and Gynecology; the guideline is to maintain less than 70% of maximal heart rate.17,18
The negative effects of exercise on the pregnant athlete are limited, but it is important to educate patients and to consider preventive strategies. One physiologic change that occurs during pregnancy is ligamentous laxity, which is caused by the hormone relaxin.16 Ligamentous laxity has the potential to put pregnant athletes at risk for soft-tissue and bony injury during impact sports. However, the positive effects of exercise during pregnancy include improved appetite, sleep, and emotional health.19 Aerobic exercise during pregnancy may reverse insulin resistance as demonstrated in animal studies; though this outcome has not been demonstrated in human studies,20 women should be reassured that moderate exercise has overall beneficial effects.
Some research suggests that exercise may expose the fetus to hyperthermia, blood sugar changes, physical injury, and premature labor.16 Typically, fetal heat is dissipated from the mother. After intense exercise, maternal body temperature rises and leads to some degree of fetal hyperthermia.16 Animal model studies have suggested that hyperthermia may result in a slightly higher rate of congenital abnormalities. Pregnant women should keep their exercise routines to less than 60 minutes, should exercise in a thermally regulated environment, and should keep themselves hydrated to avoid fetal hyperthermia.18
Reduced blood flow, accompanied by a deficit of oxygen to the uterus and the developing fetus, is another concern for pregnant athletes. During exercise, when more blood is flowing to the muscles, less is flowing to the uterus.16 Furthermore, during the third trimester, women should avoid supine exercise, as venous outflow is poor with the body in that position.21
Elite athletes who continue training during pregnancy should be carefully counseled about adjusting their training regimens. Because of increased cardiac output and blood volume, the heart rate will be lower than usual, demanding an adjustment in interpretation. Blood cell counts do not increase as much as plasma volume does—often leading to relative anemia. For elite athletes, this means iron supplementation is crucial.22 Thermal regulation may be more difficult, as training regimens may demand prolonged exercise. Physicians should recommend adequate hydration for these athletes.18
Although continued exercise is generally safe for a pregnant athlete and her fetus, caution is required when there is increased risk for premature delivery, or other special conditions exist. Multiple gestation, placenta previa, history of early labor or premature births, and incompetent cervix all contraindicate aerobic exercise during pregnancy.18 With these exceptions in mind, physicians can safely counsel pregnant women to do moderate exercise 30 minutes every day.17,18 Other recommendations are listed at the American College of Obstetricians and Gynecologists website.23
4. Anterior cruciate ligament injuries
ACL injuries affect a staggering number of athletes. In the United States, approximately 100,000 people sustain these injuries annually.24 As they occur up to 8 times more often in women than in men, ACL injuries are a top concern for physicians treating female athletes.
This disproportionate injury rate is influenced by differences between male and female anatomy. The width and shape of the femoral intercondylar notch have been studied as potential variables influencing the risk for ACL injury. Analysis of notch-view radiographs revealed a significant inverse relationship between notch width and ACL injury.25 A-shaped notches, notches with a significantly larger base and a narrowed roof, were more prevalent in women but did not correlate with increased risk for ACL injury. Studies have shown that female athletes with a noncontact ACL injury have a higher lateral tibial plateau posterior slope; this slope is associated with increased peak anteromedial ACL strain, which may contribute to injury.26 An analysis of magnetic resonance imaging scans in patients with and without ACL injury revealed that, for female patients, decreased femoral intercondylar notch width at the anterior outlet combined with increased lateral compartment posterior slope correlated best with risk for ACL injury.27
Although static anatomical factors contribute to ACL injuries in female athletes, dynamic neuromuscular influences are potential opportunities for intervention. Female athletes with high relative quadriceps strength and weak hamstring strength may be at increased risk for ACL injury.28 This “quadriceps dominance” becomes important in sports involving high-risk activities, such as running, cutting, pivoting, and jumping. In addition, compared with male athletes, female athletes demonstrate increased lateral trunk motion and knee valgus torque while landing during noncontact ACL tears, making core stability a factor in ACL injury.29
The collaborative efforts of physicians, physical therapists, athletic trainers, and coaches have yielded multifactorial neuromuscular training programs for the prevention of noncontact ACL injuries. Ideal ACL prevention protocols involve sessions that last for at least 10 minutes and take place 3 times a week. At these sessions, exercises are focused on strengthening, balance, and proprioceptive training.30 The programs last about 8 weeks, but sustained benefits require maintenance after the program has been completed and during the off-season. Program adherence must be encouraged and can be facilitated by varying workouts and raising risk awareness. The most effective programs have reduced the relative risk of noncontact ACL injuries by 75% to 100%.31 These promising results have led to increased focus on program implementation in an effort to prevent ACL injury.
5. Continued sex discrimination and social injustice
In 1972, Title IX was passed as part of the Education Amendments Act. Title IX states, “No person in the United States shall, on the basis of sex, be excluded from participation in, be denied the benefits of, or be subjected to discrimination under any educational program or activity receiving Federal financial assistance.” Passage of this law, which has implications outside of athletic participation, marked an important turning point in women’s ability to participate equally in college sports.32,33 The Civil Rights Restoration Act, passed in 1988, strengthened Title IX and made it applicable to all institutions receiving federal funding.34 Before the 1970s, women typically were restricted to club sports, and funding and participation opportunities were weighted heavily toward men. Over the past 40 years, women’s participation in high school, college, and professional sports has taken a huge leap forward.32 For example, the number of women participating in high school sports increased from 294,000 (7.4% of all athletes) in 1972 to 3.4 million (>41% of all athletes) in 2014.
Despite advances in women’s civil rights, examples of inequality in US schools remain, particularly in the distribution of funding, which still strongly favors men’s football.32 Men’s sports receive 90% of media coverage.33 In 2002, women represented 55% of college students but only 42% of varsity athletes.34 The schools that have complied the least with Title IX are schools in the Midwest and the South and those with football teams.34 Women are underrepresented as coaches, and funding continues to be disproportionately spent on men’s sports.
For women, the benefits of participating in sports are far-reaching and significant. These benefits include improvements in academic success, mental health, and responsible behavior.33 Women’s gaining acceptance and respect throughout the athletic world seems to have carried over elsewhere. Although many institutions remain noncompliant with Title IX, efforts continue to have a strongly positive effect on gender equality in the United States.
1. Nattiv A, Loucks AB, Manore MM, Sanborn CF, Sundgot-Borgen J, Warren MP; American College of Sports Medicine. American College of Sports Medicine position stand. The female athlete triad. Med Sci Sports Exerc. 2007;39(10):1867-1882.
2. De Souza MJ, Nattiv A, Joy E, et al; Expert Panel. 2014 Female Athlete Triad Coalition consensus statement on treatment and return to play of the female athlete triad: 1st international conference held in San Francisco, California, May 2012 and 2nd international conference held in Indianapolis, Indiana, May 2013. Br J Sports Med. 2014;48(4):289.
3. Warren MP, Shantha S. The female athlete. Baillieres Best Pract Res Clin Endocrinol Metab. 2000;14(1):37-53.
4. Greenleaf C, Petrie TA, Carter J, Reel JJ. Female collegiate athletes: prevalence of eating disorders and disordered eating behaviors. J Am Coll Health. 2009;57(5):489-495.
5. Reinking MF, Alexander LE. Prevalence of disordered-eating behaviors in undergraduate female collegiate athletes and nonathletes. J Athl Train. 2005;40(1):47-51.
6. Rencken ML, Chesnut CH 3rd, Drinkwater BL. Bone density at multiple skeletal sites in amenorrheic athletes. JAMA. 1996;276(3):238-240.
7. Lappe J, Cullen D, Haynatzki G, Recker R, Ahlf R, Thompson K. Calcium and vitamin D supplementation decreases incidence of stress fractures in female Navy recruits. J Bone Miner Res. 2008;23(5):741-749.
8. De Souza MJ. 2014 Female athlete triad consensus statement on guidelines for treatment and return to play. National Collegiate Athletic Association (NCAA) website. http://www.ncaa.org/health-and-safety/nutrition-and-performance/2014-female-athlete-triad-consensus-statement-guidelines. Accessed November 24, 2015.
9. Preiss-Farzanegan SJ, Chapman B, Wong TM, Wu J, Bazarian JJ. The relationship between gender and postconcussion symptoms after sport-related mild traumatic brain injury. PM R. 2009;1(3):245-253.
10. Marar M, McIlvain NM, Fields SK, Comstock RD. Epidemiology of concussions among United States high school athletes in 20 sports. Am J Sports Med. 2012;40(4):747-755.
11. Uhl RL, Rosenbaum AJ, Czajka C, Mulligan M, King C. Minor traumatic brain injury: a primer for the orthopaedic surgeon. J Am Acad Orthop Surg. 2013;21(10):624-631.
12. Covassin T, Elbin RJ, Harris W, Parker T, Kontos A. The role of age and sex in symptoms, neurocognitive performance, and postural stability in athletes after concussion. Am J Sports Med. 2012;40(6):1303-1312.
13. Covassin T, Moran R, Wilhelm K. Concussion symptoms and neurocognitive performance of high school and college athletes who incur multiple concussions. Am J Sports Med. 2013;41(12):2885-2889.
14. Sports concussion policies and laws: information for parents, coaches, and school & sports professionals. Centers for Disease Control and Prevention website. http://www.cdc.gov/headsup/policy/index.html. Updated February 16, 2015. Accessed November 24, 2015.
15. Covassin T, Elbin RJ, Sarmiento K. Educating coaches about concussion in sports: evaluation of the CDC’s “Heads Up: concussion in youth sports” initiative. J Sch Health. 2012;82(5):233-238.
16. Lumbers ER. Exercise in pregnancy: physiological basis of exercise prescription for the pregnant woman. J Sci Med Sport. 2002;5(1):20-31.
17. ACOG Committee Obstetric Practice. ACOG Committee opinion. Number 267, January 2002: exercise during pregnancy and the postpartum period. Obstet Gynecol. 2002;99(1):171-173.
18. Artal R, O’Toole M. Guidelines of the American College of Obstetricians and Gynecologists for exercise during pregnancy and the postpartum period. Br J Sports Med. 2003;37(1):6-12.
19. Kramer MS. Regular aerobic exercise during pregnancy. Cochrane Database Syst Rev. 2000;(2):CD000180. Update in: Cochrane Database Syst Rev. 2002;(2):CD000180.
20. Stafne SN, Salvesen KA, Romundstad PR, Stuge B, Morkved S. Does regular exercise during pregnancy influence lumbopelvic pain? A randomized controlled trial. Acta Obstet Gynecol Scand. 2012;91(5):552-559.
21. Nascimento SL, Surita FG, Cecatti JG. Physical exercise during pregnancy: a systematic review. Curr Opin Obstet Gynecol. 2012;24(6):387-394.
22. Hale RW, Milne L. The elite athlete and exercise in pregnancy. Semin Perinatol. 1996;20(4):277-284.
23. Exercise during pregnancy. American College of Obstetricians and Gynecologists website. http://www.acog.org/Patients/FAQs/Exercise-During-Pregnancy. Published August 2011. Accessed November 24, 2015.
24. Giugliano DN, Solomon JL. ACL tears in female athletes. Phys Med Rehabil Clin North Am. 2007;18(3):417-438, viii.
25. Ireland ML, Ballantyne BT, Little K, McClay IS. A radiographic analysis of the relationship between the size and shape of the intercondylar notch and anterior cruciate ligament injury. Knee Surg Sports Traumatol Arthrosc. 2001;9(4):200-205.
26. Lipps DB, Oh YK, Ashton-Miller JA, Wojtys EM. Morphologic characteristics help explain the gender difference in peak anterior cruciate ligament strain during a simulated pivot landing. Am J Sports Med. 2012;40(1):32-40.
27. Sturnick DR, Vacek PM, DeSarno MJ, et al. Combined anatomic factors predicting risk of anterior cruciate ligament injury for males and females. Am J Sports Med. 2015;43(4):839-847.
28. Myer GD, Ford KR, Barber Foss KD, Liu C, Nick TG, Hewett TE. The relationship of hamstrings and quadriceps strength to anterior cruciate ligament injury in female athletes. Clin J Sport Med. 2009;19(1):3-8.
29. Hewett TE, Torg JS, Boden BP. Video analysis of trunk and knee motion during non-contact anterior cruciate ligament injury in female athletes: lateral trunk and knee abduction motion are combined components of the injury mechanism. Br J Sports Med. 2009;43(6):417-422.
30. Sutton KM, Bullock JM. Anterior cruciate ligament rupture: differences between males and females. J Am Acad Orthop Surg. 2013;21(1):41-50.
31. Noyes FR, Barber-Westin SD. Neuromuscular retraining intervention programs: do they reduce noncontact anterior cruciate ligament injury rates in adolescent female athletes? Arthroscopy. 2014;30(2):245-255.
32. Ladd AL. The sports bra, the ACL, and Title IX—the game in play. Clin Orthop Relat Res. 2014;472(6):1681-1684.
33. Lopiano DA. Modern history of women in sports. Twenty-five years of Title IX. Clin Sports Med. 2000;19(2):163-173, vii.
34. Anderson DJ, Cheslock JJ, Ehrenberg RG. Gender equity in intercollegiate athletics: determinants of Title IX compliance. J High Educ. 2006;77(2):225-250.

Pigmented Villonodular Synovitis of the Hip: A Systematic Review
Pigmented villonodular synovitis (PVNS) is a rare monoarticular disorder that affects the joints, bursae, or tendon sheaths of 1.8 per million patients.1,2 PVNS is defined by exuberant proliferation of synovial villi and nodules. Although its etiology is unknown, PVNS behaves much as a neoplastic process does, with occasional chromosomal abnormalities, local tissue invasion, and the potential for malignant transformation.3,4 Radiographs show cystic erosions or joint space narrowing, and magnetic resonance imaging shows characteristic low-signal intensity (on T1- and T2-weighted sequences) because of high hemosiderin content. Biopsy remains the gold standard for diagnosis and reveals hemosiderin-laden macrophages, vascularized villi, mononuclear cell infiltration, and sporadic mitotic figures.5 Diffuse PVNS appears as a thickened synovium with matted villi and synovial folds; localized PVNS presents as a pedunculated, firm yellow nodule.6
PVNS has a predilection for large joints, most commonly the knee (up to 80% of cases) and the hip.1,2,7 Treatment strategies for knee PVNS have been well studied and, as an aggregate, show no superiority of arthroscopic or open techniques.8 The literature on hip PVNS is less abundant and more case-based, making it difficult to reach a consensus on effective treatment. Open synovectomy and arthroplasty have been the mainstays of treatment over the past 60 years, but the advent of hip arthroscopy has introduced a new treatment modality.1,9 As arthroscopic management becomes more readily available, it is important to understand and compare the effectiveness of synovectomy and arthroplasty.
We systematically reviewed the treatment modalities for PVNS of the hip to determine how synovectomy and arthroplasty compare with respect to efficacy and revision rates.
Methods
Search Strategy
We systematically reviewed the literature according to PRISMA (Preferred Reporting Items for Systematic Reviews and Meta-Analyses) guidelines using the PRISMA checklist.10 Searches were completed in July 2014 using the PubMed Medline database and the Cochrane Central Register of Clinical Trials. Keyword selection was designed to capture all level I to V evidence English-language studies that reported clinical and/or radiographic outcomes. This was accomplished with a keyword search of all available titles and manuscript abstracts: (pigmented [Title/Abstract] AND villonodular [Title/Abstract] AND synovitis [Title/Abstract]) AND (hip [Title/Abstract]) AND (English [lang])). Abstracts from the 75 resulting studies were reviewed for exclusion criteria, which consisted of any cadaveric, biomechanical, histologic, and/or kinematic results, as well as a lack of any clinical and/or radiographic data (eg, review or technique articles). Studies were also excluded if they did not have clinical follow-up of at least 2 years. Studies not dedicated to hip PVNS specifically were not immediately excluded but were reviewed for outcomes data specific to the hip PVNS subpopulation. If a specific hip PVNS population could be distinguished from other patients, that study was included for review. If a study could not be deconstructed as such or was entirely devoted to one of our exclusion criteria, that study was excluded from our review. This initial search strategy yielded 16 studies.1,6,7,11-28
Bibliographical review of these 16 studies yielded several more for review. To ensure that no patients were counted twice, each study’s authors, data collection period, and ethnic population were reviewed and compared with those of the other studies. If there was any overlap in authorship, period, and place, only the study with the most relevant or comprehensive data was included. After accounting for all inclusion and exclusion criteria, we selected a total of 21 studies with 82 patients (86 hips) for inclusion (Figure 1).
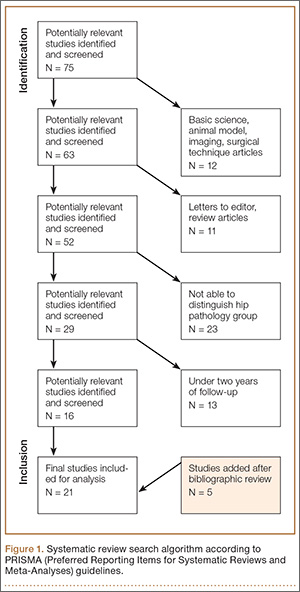
Data Extraction
Details of study design, sample size, and patient demographics, including age, sex, and duration of symptoms, were recorded. Use of diagnostic biopsy, joint space narrowing on radiographs, treatment method, and use of radiation therapy were also abstracted. Some studies described multiple treatment methods. If those methods could not be differentiated into distinct outcomes groups, the study would have been excluded for lack of specific clinical data. Studies with sufficient data were deconstructed such that the patients from each treatment group were isolated.
Fewer than 5 studies reported physical examination findings, validated survey scores, and/or radiographic results. Therefore, the primary outcomes reported and compared between treatment groups were disease recurrence, clinical worsening defined as progressive pain or loss of function, and revision surgery. Revision surgery was subdivided into repeat synovectomy and eventual arthroplasty, arthrodesis, or revision arthroplasty. Time to revision surgery was also documented. Each study’s methodologic quality and bias were evaluated with the Modified Coleman Methodology Score (MCMS), described by Cowan and colleagues.29 MCMS is a 15-item instrument that has been used to assess randomized and nonrandomized patient trials.30,31 It has a scaled potential score ranging from 0 to 100, with scores from 85 through 100 indicating excellent, 70 through 84 good, 55 through 69 fair, and under 55 poor.
Statistical Analysis
We report our data as weighted means (SDs). A mean was calculated for each study reporting on a respective data point, and each mean was then weighted according to the sample size of that study. We multiplied each study’s individual mean by the number of patients enrolled in that study and divided the sum of all the studies’ weighted data points by the number of eligible patients in all relevant studies. The result is that the nonweighted means from studies with a smaller sample size did not carry as much weight as those from larger studies. We then compared 2 groups of patients: those who had only a synovectomy and those who had a combination of synovectomy and arthroplasty. The synovectomy-only group was also compared with a group that underwent total hip arthroplasty (THA) specifically (Figure 2). Groups were compared with Student t test (SPSS Version 18, IBM), and statistical significance was set at α = 0.05.
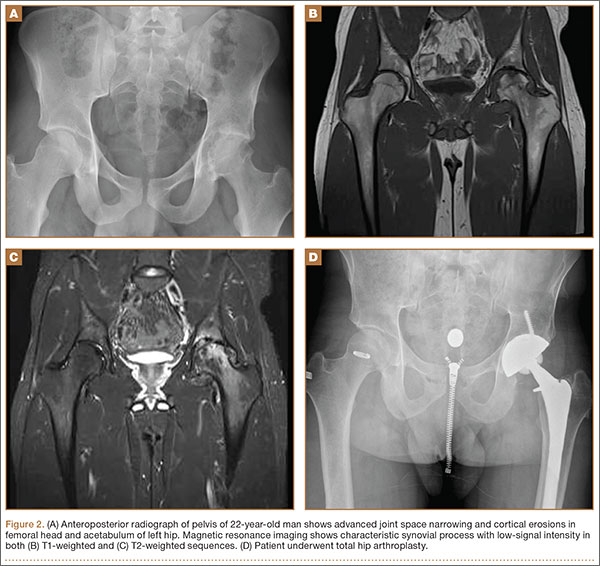
Results
Twenty-one studies (82 patients) were included in the final dataset (Table 1). Of these studies, 19 were retrospective case series (level IV evidence) in which the number of eligible hip PVNS patients ranged from 1 to 15. The other 2 studies were case reports (level V evidence). Mean (SD) MCMS was 25.0 (10.9).
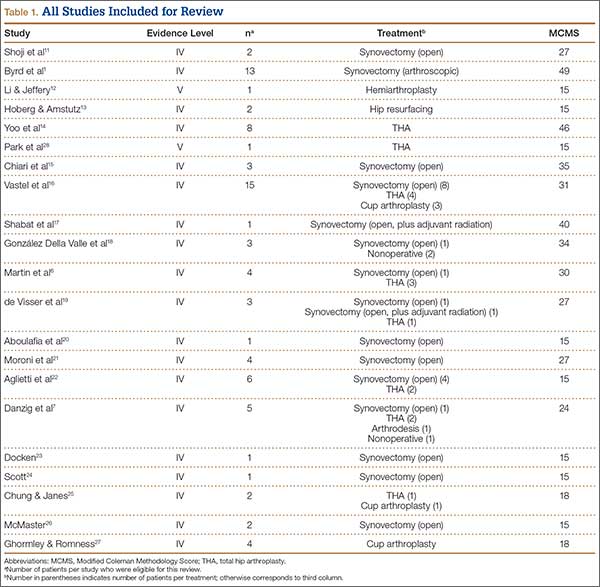
Fifty-one patients (59.3%) were female. Mean (SD) age of all patients was 33.2 (12.6) years. Mean (SD) duration of symptoms was 4.2 (2.7) years. The right hip was affected in 59.5% of patients in whom laterality was documented. Sixty-eight patients (79.1%) had biopsy-proven PVNS; presence or absence of a biopsy was not documented for the other 18 patients.
Of the 82 patients in the study, 45 (54.9%) underwent synovectomy without arthroplasty. Staged radiation was used to augment the synovectomy in 2 of these 45 cases. One series in this group consisted of 15 cases of arthroscopic synovectomy.1 The 37 patients (45.1%) in the other treatment group had arthroplasty at time of synovectomy. These patients underwent 22 THAs, 8 cup arthroplasties, 2 metal-on-metal hip resurfacings, and 1 hemiarthroplasty. The remaining 4 patients were treated nonoperatively (3) or with primary arthrodesis (1).
Comparisons between the synovectomy-only and synovectomy-with-arthroplasty groups are listed in Table 2. Synovectomy patients were younger on average than arthroplasty patients, but the difference was not statistically significant (P = .28). Only 6 studies distinguished between local and diffuse PVNS histology, and the diffuse type was detected in 87.0%, with insufficient data to detect a difference between the synovectomy and arthroplasty groups. In studies with documented radiographic findings, 75.0% of patients had evidence of joint space narrowing, which was significantly (P = .03) more common in the arthroplasty group (96.7% vs 31.3%).
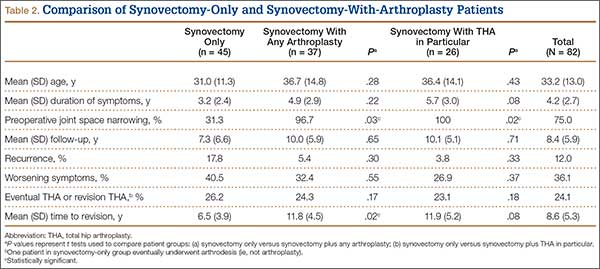
Mean (SD) clinical follow-up was 8.4 (5.9) years for all patients. A larger percentage of synovectomy-only patients experienced recurrence and worsened symptoms, but neither trend achieved statistical significance. The rate of eventual THA or arthrodesis after synovectomy alone was almost identical (P = .17) to the rate of revision THA in the synovectomy-with-arthroplasty group (26.2% vs 24.3%). Time to revision surgery, however, was significantly (P = .02) longer in the arthroplasty group. Two additional patients in the synovectomy-with-arthroplasty group underwent repeat synovectomy alone, but no patients in the synovectomy-only group underwent repeat synovectomy without arthroplasty.
One nonoperatively managed patient experienced symptom progression over the course of 10 years. The other 2 patients were stable after 2- and 4-year follow-up. The arthrodesis patient did not experience recurrence or have a revision operation in the 5 years after the index procedure.
Discussion
PVNS is a proliferative disorder of synovial tissue with a high risk of recurrence.15,32 Metastasis is extremely rare; there is only 1 case report of a fatality, which occurred within 42 months.12 Chiari and colleagues15 suggested that the PVNS recurrence rate is highest in the large joints. Therefore, in hip PVNS, early surgical resection is needed to limit articular destruction and the potential for recurrence. The primary treatment modalities are synovectomy alone and synovectomy with arthroplasty, which includes THA, cup arthroplasty, hip resurfacing, and hemiarthroplasty. According to our systematic review, about one-fourth of all patients in both treatment groups ultimately underwent revision surgery. Mean time to revision was significantly longer for synovectomy-with-arthroplasty patients (almost 12 years) than for synovectomy-only patients (6.5 years). One potential explanation is that arthroplasty component fixation may take longer to loosen than an inadequately synovectomized joint takes to recur. The synovectomy-only group did have a higher recurrence rate, though the difference was not statistically significant.
Open synovectomy is the most widely described technique for addressing hip PVNS. The precise pathophysiology of PVNS remains largely unknown, but most authors agree that aggressive débridement is required to halt its locally invasive course. Scott24 described the invasion of vascular foramina from synovium into bone and thought that radical synovectomy was essential to remove the stalks of these synovial villi. Furthermore, PVNS most commonly affects adults in the third through fifth decades of life,7 and many surgeons want to avoid prosthetic components (which may loosen over time) in this age group. Synovectomy, however, has persistently high recurrence rates, and, without removal of the femoral head and neck, it can be difficult to obtain adequate exposure for complete débridement. Although adjuvant external beam radiation has been used by some authors,17,19,33 its utility is unproven, and other authors have cautioned against unnecessary irradiation of reproductive organs.1,24,34
The high rates of bony involvement, joint destruction, and recurrence after synovectomy have prompted many surgeons to turn to arthroplasty. González Della Valle and colleagues18 theorized that joint space narrowing is more common in hip PVNS because of the poor distensibility of the hip capsule compared with that of the knee and other joints. In turn, bony lesions and arthritis present earlier in hip PVNS.14 Yoo and colleagues14 found a statistically significant increase in Harris Hip Scale (HHS) scores and a high rate of return to athletic activity after THA for PVNS. However, they also reported revisions for component loosening and osteolysis in 2 of 8 patients and periprosthetic osteolysis without loosening in another 2 patients. Vastel and colleagues16 similarly reported aseptic loosening of the acetabular component in half their patient cohort. No studies have determined which condition—PVNS recurrence or debris-related osteolysis—causes the accelerated loosening in this demographic.
Byrd and colleagues1 recently described use of hip arthroscopy in the treatment of PVNS. In a cohort of 13 patients, they found statistically significant improvements in HHS scores, no postoperative complications, and only 1 revision (THA 6 years after surgery). Although there is a prevailing perception that nodular (vs diffuse) PVNS is more appropriately treated with arthroscopic excision, no studies have provided data on this effect, and Byrd and colleagues1 in fact showed a trend of slightly better outcomes in diffuse cases than in nodular cases. The main challenges of hip arthroscopy are the steep learning curve and adequate exposure. Recent innovations include additional arthroscopic portals and enlarged T-capsulotomy, which may be contributing to decreased complication rates in hip arthroscopy in general.35
The limitations of this systematic review were largely imposed by the studies analyzed. The primary limitation was the relative paucity of clinical and radiographic data on hip PVNS. To our knowledge, studies on the treatment of hip PVNS have reported evidence levels no higher than IV. In addition, the studies we reviewed often had only 1 or 2 patient cases satisfying our inclusion criteria. For this reason, we included case reports, which further lowered the level of evidence of studies used. There were no consistently reported physical examination, survey, or radiographic findings that could be used to compare studies. All studies with sufficient data on hip PVNS treatment outcomes were rated poorly with the Modified Coleman Methodology Scoring system.29 Selection bias was minimized by the inclusive nature of studies with level I to V evidence, but this led to a study design bias in that most studies consisted of level IV evidence.
Conclusion
Although the hip PVNS literature is limited, our review provides insight into expected outcomes. No matter which surgery is to be performed, surgeons must counsel patients about the high revision rate. One in 4 patients ultimately undergoes a second surgery, which may be required within 6 or 7 years after synovectomy without arthroplasty. Further development and innovation in hip arthroscopy may transform the treatment of PVNS. We encourage other investigators to conduct prospective, comparative trials with higher evidence levels to assess the utility of arthroscopy and other treatment modalities.
1. Byrd JWT, Jones KS, Maiers GP. Two to 10 years’ follow-up of arthroscopic management of pigmented villonodular synovitis in the hip: a case series. Arthroscopy. 2013;29(11):1783-1787.
2. Myers BW, Masi AT. Pigmented villonodular synovitis and tenosynovitis: a clinical epidemiologic study of 166 cases and literature review. Medicine. 1980;59(3):223-238.
3. Sciot R, Rosai J, Dal Cin P, et al. Analysis of 35 cases of localized and diffuse tenosynovial giant cell tumor: a report from the Chromosomes and Morphology (CHAMP) study group. Mod Pathol. 1999;12(6):576-579.
4. Bertoni F, Unni KK, Beabout JW, Sim FH. Malignant giant cell tumor of the tendon sheaths and joints (malignant pigmented villonodular synovitis). Am J Surg Pathol. 1997;21(2):153-163.
5. Mankin H, Trahan C, Hornicek F. Pigmented villonodular synovitis of joints. J Surg Oncol. 2011;103(5):386-389.
6. Martin RC, Osborne DL, Edwards MJ, Wrightson W, McMasters KM. Giant cell tumor of tendon sheath, tenosynovial giant cell tumor, and pigmented villonodular synovitis: defining the presentation, surgical therapy and recurrence. Oncol Rep. 2000;7(2):413-419.
7. Danzig LA, Gershuni DH, Resnick D. Diagnosis and treatment of diffuse pigmented villonodular synovitis of the hip. Clin Orthop Relat Res. 1982;(168):42-47.
8. Aurégan JC, Klouche S, Bohu Y, Lefèvre N, Herman S, Hardy P. Treatment of pigmented villonodular synovitis of the knee. Arthroscopy. 2014;30(10):1327-1341.
9. Gondolph-Zink B, Puhl W, Noack W. Semiarthroscopic synovectomy of the hip. Int Orthop. 1988;12(1):31-35.
10. Moher D, Liberati A, Tetzlaff J, Altman DG; PRISMA Group. Preferred reporting items for systematic reviews and meta-analyses: the PRISMA statement. J Clin Epidemiol. 2009;62(10):1006-1012.
11. Shoji T, Yasunaga Y, Yamasaki T, et al. Transtrochanteric rotational osteotomy combined with intra-articular procedures for pigmented villonodular synovitis of the hip. J Orthop Sci. 2015;20(5):943-950.
12. Li LM, Jeffery J. Exceptionally aggressive pigmented villonodular synovitis of the hip unresponsive to radiotherapy. J Bone Joint Surg Br. 2011;93(7):995-997.
13. Hoberg M, Amstutz HC. Metal-on-metal hip resurfacing in patients with pigmented villonodular synovitis: a report of two cases. Orthopedics. 2010;33(1):50-53.
14. Yoo JJ, Kwon YS, Koo KH, Yoon KS, Min BW, Kim HJ. Cementless total hip arthroplasty performed in patients with pigmented villonodular synovitis. J Arthroplasty. 2010;25(4):552-557.
15. Chiari C, Pirich C, Brannath W, Kotz R, Trieb K. What affects the recurrence and clinical outcome of pigmented villonodular synovitis? Clin Orthop Relat Res. 2006;(450):172-178.
16. Vastel L, Lambert P, De Pinieux G, Charrois O, Kerboull M, Courpied JP. Surgical treatment of pigmented villonodular synovitis of the hip. J Bone Joint Surg Am. 2005;87(5):1019-1024.
17. Shabat S, Kollender Y, Merimsky O, et al. The use of surgery and yttrium 90 in the management of extensive and diffuse pigmented villonodular synovitis of large joints. Rheumatology. 2002;41(10):1113-1118.
18. González Della Valle A, Piccaluga F, Potter HG, Salvati EA, Pusso R. Pigmented villonodular synovitis of the hip: 2- to 23-year followup study. Clin Orthop Relat Res. 2001;(388):187-199.
19. de Visser E, Veth RP, Pruszczynski M, Wobbes T, Van de Putte LB. Diffuse and localized pigmented villonodular synovitis: evaluation of treatment of 38 patients. Arch Orthop Trauma Surg. 1999;119(7-8):401-404.
20. Aboulafia AJ, Kaplan L, Jelinek J, Benevenia J, Monson DK. Neuropathy secondary to pigmented villonodular synovitis of the hip. Clin Orthop Relat Res. 1996;(325):174-180.
21. Moroni A, Innao V, Picci P. Pigmented villonodular synovitis of the hip. Study of 9 cases. Ital J Orthop Traumatol. 1983;9(3):331-337.
22. Aglietti P, Di Muria GV, Salvati EA, Stringa G. Pigmented villonodular synovitis of the hip joint (review of the literature and report of personal case material). Ital J Orthop Traumatol. 1983;9(4):487-496.
23. Docken WP. Pigmented villonodular synovitis: a review with illustrative case reports. Semin Arthritis Rheum. 1979;9(1):1-22.
24. Scott PM. Bone lesions in pigmented villonodular synovitis. J Bone Joint Surg Br. 1968;50(2):306-311.
25. Chung SM, Janes JM. Diffuse pigmented villonodular synovitis of the hip joint. Review of the literature and report of four cases. J Bone Joint Surg Am. 1965;47:293-303.
26. McMaster PE. Pigmented villonodular synovitis with invasion of bone. Report of six cases. Rheumatology. 1960;42(7):1170-1183.
27. Ghormley RK, Romness JO. Pigmented villonodular synovitis (xanthomatosis) of the hip joint. Proc Staff Meet Mayo Clin. 1954;29(6):171-180.
28. Park KS, Diwanji SR, Yang HK, Yoon TR, Seon JK. Pigmented villonodular synovitis of the hip presenting as a buttock mass treated by total hip arthroplasty. J Arthroplasty. 2010;25(2):333.e9-e12.
29. Cowan J, Lozano-Calderón S, Ring D. Quality of prospective controlled randomized trials. Analysis of trials of treatment for lateral epicondylitis as an example. J Bone Joint Surg Am. 2007;89(8):1693-1699.
30. Harris JD, Siston RA, Pan X, Flanigan DC. Autologous chondrocyte implantation: a systematic review. J Bone Joint Surg Am. 2010;92(12):2220-2233.
31. Harris JD, Siston RA, Brophy RH, Lattermann C, Carey JL, Flanigan DC. Failures, re-operations, and complications after autologous chondrocyte implantation—a systematic review. Osteoarthritis Cartilage. 2011;19(7):779-791.
32. Rao AS, Vigorita VJ. Pigmented villonodular synovitis (giant-cell tumor of the tendon sheath and synovial membrane). A review of eighty-one cases. J Bone Joint Surg Am. 1984;66(1):76-94.
33. Kat S, Kutz R, Elbracht T, Weseloh G, Kuwert T. Radiosynovectomy in pigmented villonodular synovitis. Nuklearmedizin. 2000;39(7):209-213.
34. Gitelis S, Heligman D, Morton T. The treatment of pigmented villonodular synovitis of the hip. A case report and literature review. Clin Orthop Relat Res. 1989;(239):154-160.
35. Harris JD, McCormick FM, Abrams GD, et al. Complications and reoperations during and after hip arthroscopy: a systematic review of 92 studies and more than 6,000 patients. Arthroscopy. 2013;29(3):589-595.
Pigmented villonodular synovitis (PVNS) is a rare monoarticular disorder that affects the joints, bursae, or tendon sheaths of 1.8 per million patients.1,2 PVNS is defined by exuberant proliferation of synovial villi and nodules. Although its etiology is unknown, PVNS behaves much as a neoplastic process does, with occasional chromosomal abnormalities, local tissue invasion, and the potential for malignant transformation.3,4 Radiographs show cystic erosions or joint space narrowing, and magnetic resonance imaging shows characteristic low-signal intensity (on T1- and T2-weighted sequences) because of high hemosiderin content. Biopsy remains the gold standard for diagnosis and reveals hemosiderin-laden macrophages, vascularized villi, mononuclear cell infiltration, and sporadic mitotic figures.5 Diffuse PVNS appears as a thickened synovium with matted villi and synovial folds; localized PVNS presents as a pedunculated, firm yellow nodule.6
PVNS has a predilection for large joints, most commonly the knee (up to 80% of cases) and the hip.1,2,7 Treatment strategies for knee PVNS have been well studied and, as an aggregate, show no superiority of arthroscopic or open techniques.8 The literature on hip PVNS is less abundant and more case-based, making it difficult to reach a consensus on effective treatment. Open synovectomy and arthroplasty have been the mainstays of treatment over the past 60 years, but the advent of hip arthroscopy has introduced a new treatment modality.1,9 As arthroscopic management becomes more readily available, it is important to understand and compare the effectiveness of synovectomy and arthroplasty.
We systematically reviewed the treatment modalities for PVNS of the hip to determine how synovectomy and arthroplasty compare with respect to efficacy and revision rates.
Methods
Search Strategy
We systematically reviewed the literature according to PRISMA (Preferred Reporting Items for Systematic Reviews and Meta-Analyses) guidelines using the PRISMA checklist.10 Searches were completed in July 2014 using the PubMed Medline database and the Cochrane Central Register of Clinical Trials. Keyword selection was designed to capture all level I to V evidence English-language studies that reported clinical and/or radiographic outcomes. This was accomplished with a keyword search of all available titles and manuscript abstracts: (pigmented [Title/Abstract] AND villonodular [Title/Abstract] AND synovitis [Title/Abstract]) AND (hip [Title/Abstract]) AND (English [lang])). Abstracts from the 75 resulting studies were reviewed for exclusion criteria, which consisted of any cadaveric, biomechanical, histologic, and/or kinematic results, as well as a lack of any clinical and/or radiographic data (eg, review or technique articles). Studies were also excluded if they did not have clinical follow-up of at least 2 years. Studies not dedicated to hip PVNS specifically were not immediately excluded but were reviewed for outcomes data specific to the hip PVNS subpopulation. If a specific hip PVNS population could be distinguished from other patients, that study was included for review. If a study could not be deconstructed as such or was entirely devoted to one of our exclusion criteria, that study was excluded from our review. This initial search strategy yielded 16 studies.1,6,7,11-28
Bibliographical review of these 16 studies yielded several more for review. To ensure that no patients were counted twice, each study’s authors, data collection period, and ethnic population were reviewed and compared with those of the other studies. If there was any overlap in authorship, period, and place, only the study with the most relevant or comprehensive data was included. After accounting for all inclusion and exclusion criteria, we selected a total of 21 studies with 82 patients (86 hips) for inclusion (Figure 1).
Data Extraction
Details of study design, sample size, and patient demographics, including age, sex, and duration of symptoms, were recorded. Use of diagnostic biopsy, joint space narrowing on radiographs, treatment method, and use of radiation therapy were also abstracted. Some studies described multiple treatment methods. If those methods could not be differentiated into distinct outcomes groups, the study would have been excluded for lack of specific clinical data. Studies with sufficient data were deconstructed such that the patients from each treatment group were isolated.
Fewer than 5 studies reported physical examination findings, validated survey scores, and/or radiographic results. Therefore, the primary outcomes reported and compared between treatment groups were disease recurrence, clinical worsening defined as progressive pain or loss of function, and revision surgery. Revision surgery was subdivided into repeat synovectomy and eventual arthroplasty, arthrodesis, or revision arthroplasty. Time to revision surgery was also documented. Each study’s methodologic quality and bias were evaluated with the Modified Coleman Methodology Score (MCMS), described by Cowan and colleagues.29 MCMS is a 15-item instrument that has been used to assess randomized and nonrandomized patient trials.30,31 It has a scaled potential score ranging from 0 to 100, with scores from 85 through 100 indicating excellent, 70 through 84 good, 55 through 69 fair, and under 55 poor.
Statistical Analysis
We report our data as weighted means (SDs). A mean was calculated for each study reporting on a respective data point, and each mean was then weighted according to the sample size of that study. We multiplied each study’s individual mean by the number of patients enrolled in that study and divided the sum of all the studies’ weighted data points by the number of eligible patients in all relevant studies. The result is that the nonweighted means from studies with a smaller sample size did not carry as much weight as those from larger studies. We then compared 2 groups of patients: those who had only a synovectomy and those who had a combination of synovectomy and arthroplasty. The synovectomy-only group was also compared with a group that underwent total hip arthroplasty (THA) specifically (Figure 2). Groups were compared with Student t test (SPSS Version 18, IBM), and statistical significance was set at α = 0.05.
Results
Twenty-one studies (82 patients) were included in the final dataset (Table 1). Of these studies, 19 were retrospective case series (level IV evidence) in which the number of eligible hip PVNS patients ranged from 1 to 15. The other 2 studies were case reports (level V evidence). Mean (SD) MCMS was 25.0 (10.9).
Fifty-one patients (59.3%) were female. Mean (SD) age of all patients was 33.2 (12.6) years. Mean (SD) duration of symptoms was 4.2 (2.7) years. The right hip was affected in 59.5% of patients in whom laterality was documented. Sixty-eight patients (79.1%) had biopsy-proven PVNS; presence or absence of a biopsy was not documented for the other 18 patients.
Of the 82 patients in the study, 45 (54.9%) underwent synovectomy without arthroplasty. Staged radiation was used to augment the synovectomy in 2 of these 45 cases. One series in this group consisted of 15 cases of arthroscopic synovectomy.1 The 37 patients (45.1%) in the other treatment group had arthroplasty at time of synovectomy. These patients underwent 22 THAs, 8 cup arthroplasties, 2 metal-on-metal hip resurfacings, and 1 hemiarthroplasty. The remaining 4 patients were treated nonoperatively (3) or with primary arthrodesis (1).
Comparisons between the synovectomy-only and synovectomy-with-arthroplasty groups are listed in Table 2. Synovectomy patients were younger on average than arthroplasty patients, but the difference was not statistically significant (P = .28). Only 6 studies distinguished between local and diffuse PVNS histology, and the diffuse type was detected in 87.0%, with insufficient data to detect a difference between the synovectomy and arthroplasty groups. In studies with documented radiographic findings, 75.0% of patients had evidence of joint space narrowing, which was significantly (P = .03) more common in the arthroplasty group (96.7% vs 31.3%).
Mean (SD) clinical follow-up was 8.4 (5.9) years for all patients. A larger percentage of synovectomy-only patients experienced recurrence and worsened symptoms, but neither trend achieved statistical significance. The rate of eventual THA or arthrodesis after synovectomy alone was almost identical (P = .17) to the rate of revision THA in the synovectomy-with-arthroplasty group (26.2% vs 24.3%). Time to revision surgery, however, was significantly (P = .02) longer in the arthroplasty group. Two additional patients in the synovectomy-with-arthroplasty group underwent repeat synovectomy alone, but no patients in the synovectomy-only group underwent repeat synovectomy without arthroplasty.
One nonoperatively managed patient experienced symptom progression over the course of 10 years. The other 2 patients were stable after 2- and 4-year follow-up. The arthrodesis patient did not experience recurrence or have a revision operation in the 5 years after the index procedure.
Discussion
PVNS is a proliferative disorder of synovial tissue with a high risk of recurrence.15,32 Metastasis is extremely rare; there is only 1 case report of a fatality, which occurred within 42 months.12 Chiari and colleagues15 suggested that the PVNS recurrence rate is highest in the large joints. Therefore, in hip PVNS, early surgical resection is needed to limit articular destruction and the potential for recurrence. The primary treatment modalities are synovectomy alone and synovectomy with arthroplasty, which includes THA, cup arthroplasty, hip resurfacing, and hemiarthroplasty. According to our systematic review, about one-fourth of all patients in both treatment groups ultimately underwent revision surgery. Mean time to revision was significantly longer for synovectomy-with-arthroplasty patients (almost 12 years) than for synovectomy-only patients (6.5 years). One potential explanation is that arthroplasty component fixation may take longer to loosen than an inadequately synovectomized joint takes to recur. The synovectomy-only group did have a higher recurrence rate, though the difference was not statistically significant.
Open synovectomy is the most widely described technique for addressing hip PVNS. The precise pathophysiology of PVNS remains largely unknown, but most authors agree that aggressive débridement is required to halt its locally invasive course. Scott24 described the invasion of vascular foramina from synovium into bone and thought that radical synovectomy was essential to remove the stalks of these synovial villi. Furthermore, PVNS most commonly affects adults in the third through fifth decades of life,7 and many surgeons want to avoid prosthetic components (which may loosen over time) in this age group. Synovectomy, however, has persistently high recurrence rates, and, without removal of the femoral head and neck, it can be difficult to obtain adequate exposure for complete débridement. Although adjuvant external beam radiation has been used by some authors,17,19,33 its utility is unproven, and other authors have cautioned against unnecessary irradiation of reproductive organs.1,24,34
The high rates of bony involvement, joint destruction, and recurrence after synovectomy have prompted many surgeons to turn to arthroplasty. González Della Valle and colleagues18 theorized that joint space narrowing is more common in hip PVNS because of the poor distensibility of the hip capsule compared with that of the knee and other joints. In turn, bony lesions and arthritis present earlier in hip PVNS.14 Yoo and colleagues14 found a statistically significant increase in Harris Hip Scale (HHS) scores and a high rate of return to athletic activity after THA for PVNS. However, they also reported revisions for component loosening and osteolysis in 2 of 8 patients and periprosthetic osteolysis without loosening in another 2 patients. Vastel and colleagues16 similarly reported aseptic loosening of the acetabular component in half their patient cohort. No studies have determined which condition—PVNS recurrence or debris-related osteolysis—causes the accelerated loosening in this demographic.
Byrd and colleagues1 recently described use of hip arthroscopy in the treatment of PVNS. In a cohort of 13 patients, they found statistically significant improvements in HHS scores, no postoperative complications, and only 1 revision (THA 6 years after surgery). Although there is a prevailing perception that nodular (vs diffuse) PVNS is more appropriately treated with arthroscopic excision, no studies have provided data on this effect, and Byrd and colleagues1 in fact showed a trend of slightly better outcomes in diffuse cases than in nodular cases. The main challenges of hip arthroscopy are the steep learning curve and adequate exposure. Recent innovations include additional arthroscopic portals and enlarged T-capsulotomy, which may be contributing to decreased complication rates in hip arthroscopy in general.35
The limitations of this systematic review were largely imposed by the studies analyzed. The primary limitation was the relative paucity of clinical and radiographic data on hip PVNS. To our knowledge, studies on the treatment of hip PVNS have reported evidence levels no higher than IV. In addition, the studies we reviewed often had only 1 or 2 patient cases satisfying our inclusion criteria. For this reason, we included case reports, which further lowered the level of evidence of studies used. There were no consistently reported physical examination, survey, or radiographic findings that could be used to compare studies. All studies with sufficient data on hip PVNS treatment outcomes were rated poorly with the Modified Coleman Methodology Scoring system.29 Selection bias was minimized by the inclusive nature of studies with level I to V evidence, but this led to a study design bias in that most studies consisted of level IV evidence.
Conclusion
Although the hip PVNS literature is limited, our review provides insight into expected outcomes. No matter which surgery is to be performed, surgeons must counsel patients about the high revision rate. One in 4 patients ultimately undergoes a second surgery, which may be required within 6 or 7 years after synovectomy without arthroplasty. Further development and innovation in hip arthroscopy may transform the treatment of PVNS. We encourage other investigators to conduct prospective, comparative trials with higher evidence levels to assess the utility of arthroscopy and other treatment modalities.
1. Byrd JWT, Jones KS, Maiers GP. Two to 10 years’ follow-up of arthroscopic management of pigmented villonodular synovitis in the hip: a case series. Arthroscopy. 2013;29(11):1783-1787.
2. Myers BW, Masi AT. Pigmented villonodular synovitis and tenosynovitis: a clinical epidemiologic study of 166 cases and literature review. Medicine. 1980;59(3):223-238.
3. Sciot R, Rosai J, Dal Cin P, et al. Analysis of 35 cases of localized and diffuse tenosynovial giant cell tumor: a report from the Chromosomes and Morphology (CHAMP) study group. Mod Pathol. 1999;12(6):576-579.
4. Bertoni F, Unni KK, Beabout JW, Sim FH. Malignant giant cell tumor of the tendon sheaths and joints (malignant pigmented villonodular synovitis). Am J Surg Pathol. 1997;21(2):153-163.
5. Mankin H, Trahan C, Hornicek F. Pigmented villonodular synovitis of joints. J Surg Oncol. 2011;103(5):386-389.
6. Martin RC, Osborne DL, Edwards MJ, Wrightson W, McMasters KM. Giant cell tumor of tendon sheath, tenosynovial giant cell tumor, and pigmented villonodular synovitis: defining the presentation, surgical therapy and recurrence. Oncol Rep. 2000;7(2):413-419.
7. Danzig LA, Gershuni DH, Resnick D. Diagnosis and treatment of diffuse pigmented villonodular synovitis of the hip. Clin Orthop Relat Res. 1982;(168):42-47.
8. Aurégan JC, Klouche S, Bohu Y, Lefèvre N, Herman S, Hardy P. Treatment of pigmented villonodular synovitis of the knee. Arthroscopy. 2014;30(10):1327-1341.
9. Gondolph-Zink B, Puhl W, Noack W. Semiarthroscopic synovectomy of the hip. Int Orthop. 1988;12(1):31-35.
10. Moher D, Liberati A, Tetzlaff J, Altman DG; PRISMA Group. Preferred reporting items for systematic reviews and meta-analyses: the PRISMA statement. J Clin Epidemiol. 2009;62(10):1006-1012.
11. Shoji T, Yasunaga Y, Yamasaki T, et al. Transtrochanteric rotational osteotomy combined with intra-articular procedures for pigmented villonodular synovitis of the hip. J Orthop Sci. 2015;20(5):943-950.
12. Li LM, Jeffery J. Exceptionally aggressive pigmented villonodular synovitis of the hip unresponsive to radiotherapy. J Bone Joint Surg Br. 2011;93(7):995-997.
13. Hoberg M, Amstutz HC. Metal-on-metal hip resurfacing in patients with pigmented villonodular synovitis: a report of two cases. Orthopedics. 2010;33(1):50-53.
14. Yoo JJ, Kwon YS, Koo KH, Yoon KS, Min BW, Kim HJ. Cementless total hip arthroplasty performed in patients with pigmented villonodular synovitis. J Arthroplasty. 2010;25(4):552-557.
15. Chiari C, Pirich C, Brannath W, Kotz R, Trieb K. What affects the recurrence and clinical outcome of pigmented villonodular synovitis? Clin Orthop Relat Res. 2006;(450):172-178.
16. Vastel L, Lambert P, De Pinieux G, Charrois O, Kerboull M, Courpied JP. Surgical treatment of pigmented villonodular synovitis of the hip. J Bone Joint Surg Am. 2005;87(5):1019-1024.
17. Shabat S, Kollender Y, Merimsky O, et al. The use of surgery and yttrium 90 in the management of extensive and diffuse pigmented villonodular synovitis of large joints. Rheumatology. 2002;41(10):1113-1118.
18. González Della Valle A, Piccaluga F, Potter HG, Salvati EA, Pusso R. Pigmented villonodular synovitis of the hip: 2- to 23-year followup study. Clin Orthop Relat Res. 2001;(388):187-199.
19. de Visser E, Veth RP, Pruszczynski M, Wobbes T, Van de Putte LB. Diffuse and localized pigmented villonodular synovitis: evaluation of treatment of 38 patients. Arch Orthop Trauma Surg. 1999;119(7-8):401-404.
20. Aboulafia AJ, Kaplan L, Jelinek J, Benevenia J, Monson DK. Neuropathy secondary to pigmented villonodular synovitis of the hip. Clin Orthop Relat Res. 1996;(325):174-180.
21. Moroni A, Innao V, Picci P. Pigmented villonodular synovitis of the hip. Study of 9 cases. Ital J Orthop Traumatol. 1983;9(3):331-337.
22. Aglietti P, Di Muria GV, Salvati EA, Stringa G. Pigmented villonodular synovitis of the hip joint (review of the literature and report of personal case material). Ital J Orthop Traumatol. 1983;9(4):487-496.
23. Docken WP. Pigmented villonodular synovitis: a review with illustrative case reports. Semin Arthritis Rheum. 1979;9(1):1-22.
24. Scott PM. Bone lesions in pigmented villonodular synovitis. J Bone Joint Surg Br. 1968;50(2):306-311.
25. Chung SM, Janes JM. Diffuse pigmented villonodular synovitis of the hip joint. Review of the literature and report of four cases. J Bone Joint Surg Am. 1965;47:293-303.
26. McMaster PE. Pigmented villonodular synovitis with invasion of bone. Report of six cases. Rheumatology. 1960;42(7):1170-1183.
27. Ghormley RK, Romness JO. Pigmented villonodular synovitis (xanthomatosis) of the hip joint. Proc Staff Meet Mayo Clin. 1954;29(6):171-180.
28. Park KS, Diwanji SR, Yang HK, Yoon TR, Seon JK. Pigmented villonodular synovitis of the hip presenting as a buttock mass treated by total hip arthroplasty. J Arthroplasty. 2010;25(2):333.e9-e12.
29. Cowan J, Lozano-Calderón S, Ring D. Quality of prospective controlled randomized trials. Analysis of trials of treatment for lateral epicondylitis as an example. J Bone Joint Surg Am. 2007;89(8):1693-1699.
30. Harris JD, Siston RA, Pan X, Flanigan DC. Autologous chondrocyte implantation: a systematic review. J Bone Joint Surg Am. 2010;92(12):2220-2233.
31. Harris JD, Siston RA, Brophy RH, Lattermann C, Carey JL, Flanigan DC. Failures, re-operations, and complications after autologous chondrocyte implantation—a systematic review. Osteoarthritis Cartilage. 2011;19(7):779-791.
32. Rao AS, Vigorita VJ. Pigmented villonodular synovitis (giant-cell tumor of the tendon sheath and synovial membrane). A review of eighty-one cases. J Bone Joint Surg Am. 1984;66(1):76-94.
33. Kat S, Kutz R, Elbracht T, Weseloh G, Kuwert T. Radiosynovectomy in pigmented villonodular synovitis. Nuklearmedizin. 2000;39(7):209-213.
34. Gitelis S, Heligman D, Morton T. The treatment of pigmented villonodular synovitis of the hip. A case report and literature review. Clin Orthop Relat Res. 1989;(239):154-160.
35. Harris JD, McCormick FM, Abrams GD, et al. Complications and reoperations during and after hip arthroscopy: a systematic review of 92 studies and more than 6,000 patients. Arthroscopy. 2013;29(3):589-595.