User login
Children and COVID: Weekly cases may have doubled in early January
Although new COVID-19 cases in children, as measured by the American Academy of Pediatrics and the Children’s Hospital Association, have remained fairly steady in recent months, data from the Centers for Diseases Control and Prevention suggest that weekly cases took a big jump in early January.
For the most recent week covered . New cases for the first 2 weeks of the year – 31,000 for the week of Dec. 30 to Jan. 5 and 26,000 during Jan. 6-12 – were consistent with the AAP/CHA assertion that “weekly reported child cases have plateaued at an average of about 32,000 cases ... over the past 4 months.”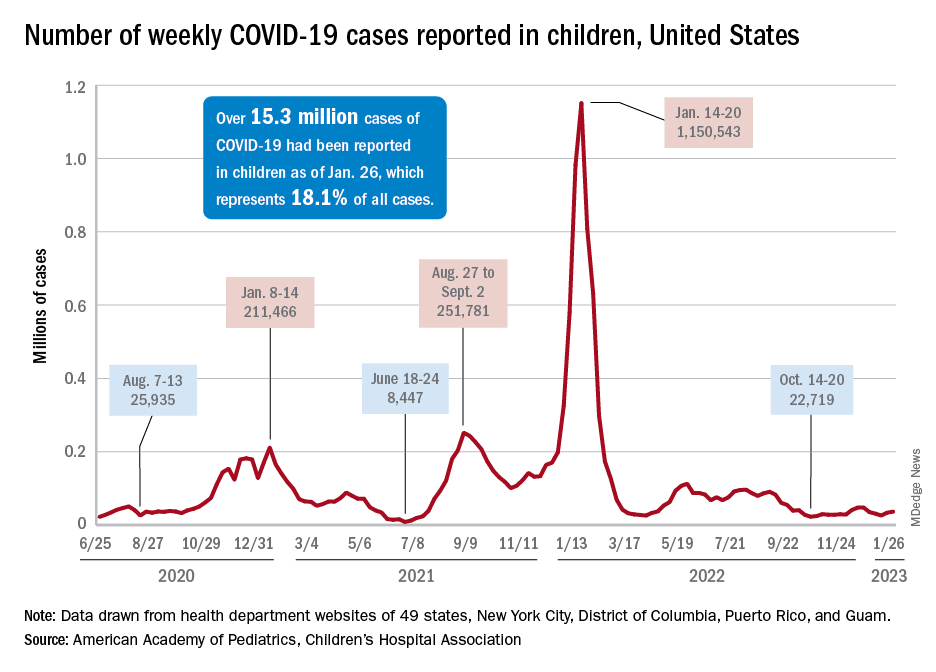
The CDC data, however, show that new cases doubled during the week of Jan. 1-7 to over 65,000, compared with the end of December, and stayed at that level for Jan. 8-14, and since CDC figures are subject to a 6-week reporting delay, the final numbers are likely to be even higher. The composition by age changed somewhat between the 2 weeks, though, as those aged 0-4 years went from almost half of all cases in the first week down to 40% in the second, while cases rose for children aged 5-11 and 12-15, based on data from the COVID-19 response team.
Emergency department visits for January do not show a corresponding increase. ED visits among children aged 0-11 years with COVID-19, measured as a percentage of all ED visits, declined over the course of the month, as did visits for 16- and 17-year-olds, while those aged 12-15 started the month at 1.4% and were at 1.4% on Jan. 27, with a slight dip down to 1.2% in between, the CDC said on its COVID Data Tracker. Daily hospitalizations for children aged 0-17 also declined through mid-January and did not reflect the jump in new cases.
Meanwhile, vaccinated children are still in the minority: 57% of those under age 18 have received no COVID vaccine yet, the AAP said in a separate report. Just 7.4% of children under age 2 years had received at least one dose as of Jan. 25, as had 10.1% of those aged 2-4 years, 39.6% of 5- to 11-year-olds and 71.8% of those 12-17 years old, according to the CDC, with corresponding figures for completion of the primary series at 3.5%, 5.3%, 32.5%, and 61.5%.
Fungal Osler Nodes Indicate Candidal Infective Endocarditis
To the Editor:
A 44-year-old woman presented with a low-grade fever (temperature, 38.0 °C) and painful acral lesions of 1 week’s duration. She had a history of hepatitis C viral infection and intravenous (IV) drug use, as well as polymicrobial infective endocarditis that involved the tricuspid and aortic valves; pathogenic organisms were identified via blood culture as Enterococcus faecalis, Serratia species, Streptococcus viridans, and Candida albicans. The patient had received a mechanical aortic valve and bioprosthetic tricuspid valve replacement 5 months prior with warfarin therapy and had completed a postsurgical 6-week course of high-dose micafungin. She reported that she had developed painful, violaceous, thin papules on the plantar surface of the left foot 2 weeks prior to presentation. Her symptoms improved with a short systemic steroid taper; however, within a week she developed new tender, erythematous, thin papules on the plantar surface of the right foot and the palmar surface of the left hand with associated lower extremity swelling. She denied other symptoms, including fever, chills, neurologic symptoms, shortness of breath, chest pain, nausea, vomiting, hematuria, and hematochezia. Due to worsening cutaneous findings, the patient presented to the emergency department, prompting hospital admission for empiric antibacterial therapy with vancomycin and piperacillin-tazobactam for suspected infectious endocarditis. Dermatology was consulted after 1 day of antibacterial therapy without improvement to determine the etiology of the patient’s skin findings.
Physical examination revealed the patient was afebrile with partially blanching violaceous to purpuric, tender, edematous papules on the left fourth and fifth finger pads, as well as scattered, painful, purpuric patches with stellate borders on the right plantar foot (Figure 1). Laboratory test results revealed mild anemia (hemoglobin, 11.9 g/dL [reference range, 12.0–15.0 g/dL], mild neutrophilia (neutrophils, 8.4×10⁹/L [reference range, 1.9–7.9×10⁹/L], elevated acute-phase reactants (erythrocyte sedimentation rate, 71 mm/h [reference range, 0–20 mm/h]; C-reactive protein, 5.7 mg/dL [reference range, 0.0–0.5 mg/dL]), and positive hepatitis C virus antibody with an undetectable viral load. At the time of dermatologic evaluation, admission blood cultures and transthoracic echocardiogram were negative. Additionally, a transesophageal echocardiogram, limited by artifact from the mechanical aortic valve, was equivocal for valvular pathology. Subsequent ophthalmologic evaluation was negative for lesions associated with endocarditis, such as retinal hemorrhages.
.")
Punch biopsies of the left fourth finger pad were submitted for histopathologic analysis and tissue cultures. Histopathology demonstrated deep dermal perivascular neutrophilic inflammation with multiple intravascular thrombi, perivascular fibrin, and karyorrhectic debris (Figure 2). Periodic acid–Schiff and Grocott-Gomori methenamine-silver stains revealed fungal spores with rare pseudohyphae within the thrombosed vascular spaces and the perivascular dermis, consistent with fungal septic emboli (Figure 3).
. B, Higher power showed a thrombus with surrounding fibrin...")
Empiric systemic antifungal coverage composed of IV liposomal amphotericin B and oral flucytosine was initiated, and the patient’s tender acral papules rapidly improved. Within 48 hours of biopsy, skin tissue culture confirmed the presence of C albicans. Four days after the preliminary dermatopathology report, confirmatory blood cultures resulted with pansensitive C albicans. Final tissue and blood cultures were negative for bacteria including mycobacteria. In addition to a 6-week course of IV amphotericin B and flucytosine, repeat surgical intervention was considered, and lifelong suppressive antifungal oral therapy was recommended. Unfortunately, the patient did not present for follow-up. Three months later, she presented to the emergency department with peritonitis; in the operating room, she was found to have ischemia of the entirety of the small and large intestines and died shortly thereafter.
. B, Grocott-Gomori methenamine-silver stain demonstrated fungal spores in the thrombosed vascular space")
Fungal endocarditis is rare, tending to develop in patient populations with particular risk factors such as immune compromise, structural heart defects or prosthetic valves, and IV drug use. Candida infective endocarditis (CIE) represents less than 2% of infective endocarditis cases and carries a high mortality rate (30%–80%).1-3 Diagnosis may be challenging, as the clinical presentation varies widely. Although some patients may present with classic features of infective endocarditis, including fever, cardiac murmurs, and positive blood cultures, many cases of infective endocarditis present with nonspecific symptoms, raising a broad clinical differential diagnosis. Delay in diagnosis, which is seen in 82% of patients with fungal endocarditis, may be attributed to the slow progression of symptoms, inconclusive cardiac imaging, or negative blood cultures seen in almost one-third of cases.2,3 The feared complication of systemic embolization via infective endocarditis may occur in up to one-half of cases, with the highest rates associated with staphylococcal or fungal pathogens.2 The risk for embolization in fungal endocarditis is independent of the size of the cardiac valve vegetations; accordingly, sequelae of embolic complications may arise despite negative cardiac imaging.4 Embolic complications, which typically are seen within the first 2 to 4 weeks of treatment, may serve as the presenting feature of endocarditis and may even occur after completion of antimicrobial therapy.
Detection of cutaneous manifestations of infective endocarditis, including Janeway lesions, Osler nodes, and splinter hemorrhages, may allow for earlier diagnosis. Despite eponymous recognition, Janeway lesions and Osler nodes are relatively uncommon manifestations of infective endocarditis and may be found in only 5% to 15% of cases.5 Biopsies of suspected Janeway lesions and Osler nodes may allow for recognition of relevant vascular pathology, identification of the causative pathogen, and strong support for the diagnosis of infective endocarditis.4-7
The initial photomicrograph of corresponding Janeway lesion histopathology was published by Kerr in 1955 and revealed dermal microabscesses posited to be secondary to bacterial emboli.8,9 Additional cases through the years have reported overlapping histopathologic features of Janeway lesions and Osler nodes, with the latter often defined by the presence of vasculitis.4 Although there appears to be ongoing debate and overlap between the 2 integumentary findings, a general consensus on differentiation takes into account both the clinical signs and symptoms as well as the histopathologic findings.10,11
Osler nodes present as tender, violaceous, subcutaneous nodules on the acral surfaces, usually on the pads of the fingers and toes.5 The pathogenesis involves the deposition of immune complexes as a sequela of vascular occlusion by microthrombi classically seen in the late phase of subacute endocarditis. Janeway lesions present as nontender erythematous macules on the acral surfaces and are thought to represent microthrombi with dermal microabscesses, more common in acute endocarditis. Our patient demonstrated features of both Osler nodes and Janeway lesions. Despite the presence of fungal thrombi—a pathophysiology closer to that of Janeway lesions—the clinical presentation of painful acral nodules affecting finger pads and histologic features of vasculitis may be better characterized as Osler nodes. Regardless of pathogenesis, these cutaneous findings serve as a minor clinical criterion in the Duke criteria for the diagnosis of infective endocarditis when present.12
Candida infective endocarditis should be suspected in a patient with a history of valvular disease or prior infective endocarditis with fungemia, unexplained neurologic signs, or manifestations of peripheral embolization despite negative blood cultures.3 Particularly in the setting of negative cardiac imaging, recognition of CIE requires heightened diagnostic acumen and clinicopathologic correlation. Although culture and pathologic examination of valvular vegetations represents the gold standard for diagnosis of CIE, aspiration and culture of easily accessible septic emboli may provide rapid identification of the etiologic pathogen. In 1976, Alpert et al13 identified C albicans from an aspirated Osler node. Postmortem examination revealed extensive involvement of the homograft valve and aortic root with C albicans.13 Many other examples exist in the literature demonstrating matching pathogenic isolates from microbiologic cultures of skin and blood.4,9,14,15 Thadepalli and Francis7 investigated 26 cases of endocarditis in heroin users in which the admitting diagnosis was endocarditis in only 4 cases. The etiologic pathogen was aspirated from secondary sites of localized infections secondary to emboli, including cutaneous lesions in 10 of the cases. Gram stain and culture revealed the causative organism leading to the ultimate diagnosis and management in 17 of 26 patients with endocarditis.7
The incidence of fungal endocarditis is increasing, with a reported 67% of cases caused by nosocomial infection.1 Given the rising incidence of fungal endocarditis and its accompanying diagnostic difficulties, including frequently negative blood cultures and cardiac imaging, clinicians must perform careful skin examinations, employ judicious use of skin biopsy, and carefully correlate clinical and pathologic findings to improve recognition of this disease and guide patient care.
- Arnold CJ, Johnson M, Bayer AS, et al. Infective endocarditis: an observational cohort study with a focus on therapy. Antimicrob Agents Chemother. 2015;59:2365. doi:10.1128/AAC.04867-14
- Chaudhary SC, Sawlani KK, Arora R, et al. Native aortic valve fungal endocarditis. BMJ Case Rep. 2013;2013:bcr2012007144. doi:10.1136/bcr-2012-007144
- Ellis ME, Al-Abdely H, Sandridge A, et al. Fungal endocarditis: evidence in the world literature, 1965–1995. Clin Infect Dis. 2001;32:50-62. doi:10.1086/317550
- Gil MP, Velasco M, Botella R, et al. Janeway lesions: differential diagnosis with Osler’s nodes. Int J Dermatol. 1993;32:673-674. doi:10.1111/j.1365-4362.1993.tb04025.x
- Gomes RT, Tiberto LR, Bello VNM, et al. Dermatologic manifestations of infective endocarditis. An Bras Dermatol. 2016;91:92-94.
- Yee JM. Osler’s nodes and the recognition of infective endocarditis: a lesion of diagnostic importance. South Med J. 1987;80:753-757.
- Thadepalli H, Francis C. Diagnostic clues in metastatic lesions of endocarditia in addicts. West J Med. 1978;128:1-5.
- Kerr A Jr. Subacute Bacterial Endocarditis. Charles C. Thomas; 1955.
- Kerr A Jr, Tan JS. Biopsies of the Janeway lesion of infective endocarditis. J Cutan Pathol. 1979;6:124-129. doi:10.1111/j.1600-0560.1979.tb01113.x
- Marrie TJ. Osler’s nodes and Janeway lesions. Am J Med. 2008;121:105-106. doi:10.1016/j.amjmed.2007.07.035
- Gunson TH, Oliver GF. Osler’s nodes and Janeway lesions. Australas J Dermatol. 2007;48:251-255. doi:10.1111/j.1440-0960.2007.00397.x
- Durack DT, Lukes AS, Bright DK, et al. New criteria for diagnosis of infective endocarditis: utilization of specific echocardiographic findings. Am J Med. 1994;96:200-209.
- Alpert JS, Krous HF, Dalen JE, et al. Pathogenesis of Osler’s nodes. Ann Intern Med. 1976;85:471-473. doi:10.7326/0003-4819-85-4-471
- Cardullo AC, Silvers DN, Grossman ME. Janeway lesions and Osler’s nodes: a review of histopathologic findings. J Am Acad Dermatol. 1990;22:1088-1090. doi:10.1016/0190-9622(90)70157-D
- Vinson RP, Chung A, Elston DM, et al. Septic microemboli in a Janeway lesion of bacterial endocarditis. J Am Acad Dermatol. 1996;35:984-985. doi:10.1016/S0190-9622(96)90125-5
To the Editor:
A 44-year-old woman presented with a low-grade fever (temperature, 38.0 °C) and painful acral lesions of 1 week’s duration. She had a history of hepatitis C viral infection and intravenous (IV) drug use, as well as polymicrobial infective endocarditis that involved the tricuspid and aortic valves; pathogenic organisms were identified via blood culture as Enterococcus faecalis, Serratia species, Streptococcus viridans, and Candida albicans. The patient had received a mechanical aortic valve and bioprosthetic tricuspid valve replacement 5 months prior with warfarin therapy and had completed a postsurgical 6-week course of high-dose micafungin. She reported that she had developed painful, violaceous, thin papules on the plantar surface of the left foot 2 weeks prior to presentation. Her symptoms improved with a short systemic steroid taper; however, within a week she developed new tender, erythematous, thin papules on the plantar surface of the right foot and the palmar surface of the left hand with associated lower extremity swelling. She denied other symptoms, including fever, chills, neurologic symptoms, shortness of breath, chest pain, nausea, vomiting, hematuria, and hematochezia. Due to worsening cutaneous findings, the patient presented to the emergency department, prompting hospital admission for empiric antibacterial therapy with vancomycin and piperacillin-tazobactam for suspected infectious endocarditis. Dermatology was consulted after 1 day of antibacterial therapy without improvement to determine the etiology of the patient’s skin findings.
Physical examination revealed the patient was afebrile with partially blanching violaceous to purpuric, tender, edematous papules on the left fourth and fifth finger pads, as well as scattered, painful, purpuric patches with stellate borders on the right plantar foot (Figure 1). Laboratory test results revealed mild anemia (hemoglobin, 11.9 g/dL [reference range, 12.0–15.0 g/dL], mild neutrophilia (neutrophils, 8.4×10⁹/L [reference range, 1.9–7.9×10⁹/L], elevated acute-phase reactants (erythrocyte sedimentation rate, 71 mm/h [reference range, 0–20 mm/h]; C-reactive protein, 5.7 mg/dL [reference range, 0.0–0.5 mg/dL]), and positive hepatitis C virus antibody with an undetectable viral load. At the time of dermatologic evaluation, admission blood cultures and transthoracic echocardiogram were negative. Additionally, a transesophageal echocardiogram, limited by artifact from the mechanical aortic valve, was equivocal for valvular pathology. Subsequent ophthalmologic evaluation was negative for lesions associated with endocarditis, such as retinal hemorrhages.
Punch biopsies of the left fourth finger pad were submitted for histopathologic analysis and tissue cultures. Histopathology demonstrated deep dermal perivascular neutrophilic inflammation with multiple intravascular thrombi, perivascular fibrin, and karyorrhectic debris (Figure 2). Periodic acid–Schiff and Grocott-Gomori methenamine-silver stains revealed fungal spores with rare pseudohyphae within the thrombosed vascular spaces and the perivascular dermis, consistent with fungal septic emboli (Figure 3).
Empiric systemic antifungal coverage composed of IV liposomal amphotericin B and oral flucytosine was initiated, and the patient’s tender acral papules rapidly improved. Within 48 hours of biopsy, skin tissue culture confirmed the presence of C albicans. Four days after the preliminary dermatopathology report, confirmatory blood cultures resulted with pansensitive C albicans. Final tissue and blood cultures were negative for bacteria including mycobacteria. In addition to a 6-week course of IV amphotericin B and flucytosine, repeat surgical intervention was considered, and lifelong suppressive antifungal oral therapy was recommended. Unfortunately, the patient did not present for follow-up. Three months later, she presented to the emergency department with peritonitis; in the operating room, she was found to have ischemia of the entirety of the small and large intestines and died shortly thereafter.
Fungal endocarditis is rare, tending to develop in patient populations with particular risk factors such as immune compromise, structural heart defects or prosthetic valves, and IV drug use. Candida infective endocarditis (CIE) represents less than 2% of infective endocarditis cases and carries a high mortality rate (30%–80%).1-3 Diagnosis may be challenging, as the clinical presentation varies widely. Although some patients may present with classic features of infective endocarditis, including fever, cardiac murmurs, and positive blood cultures, many cases of infective endocarditis present with nonspecific symptoms, raising a broad clinical differential diagnosis. Delay in diagnosis, which is seen in 82% of patients with fungal endocarditis, may be attributed to the slow progression of symptoms, inconclusive cardiac imaging, or negative blood cultures seen in almost one-third of cases.2,3 The feared complication of systemic embolization via infective endocarditis may occur in up to one-half of cases, with the highest rates associated with staphylococcal or fungal pathogens.2 The risk for embolization in fungal endocarditis is independent of the size of the cardiac valve vegetations; accordingly, sequelae of embolic complications may arise despite negative cardiac imaging.4 Embolic complications, which typically are seen within the first 2 to 4 weeks of treatment, may serve as the presenting feature of endocarditis and may even occur after completion of antimicrobial therapy.
Detection of cutaneous manifestations of infective endocarditis, including Janeway lesions, Osler nodes, and splinter hemorrhages, may allow for earlier diagnosis. Despite eponymous recognition, Janeway lesions and Osler nodes are relatively uncommon manifestations of infective endocarditis and may be found in only 5% to 15% of cases.5 Biopsies of suspected Janeway lesions and Osler nodes may allow for recognition of relevant vascular pathology, identification of the causative pathogen, and strong support for the diagnosis of infective endocarditis.4-7
The initial photomicrograph of corresponding Janeway lesion histopathology was published by Kerr in 1955 and revealed dermal microabscesses posited to be secondary to bacterial emboli.8,9 Additional cases through the years have reported overlapping histopathologic features of Janeway lesions and Osler nodes, with the latter often defined by the presence of vasculitis.4 Although there appears to be ongoing debate and overlap between the 2 integumentary findings, a general consensus on differentiation takes into account both the clinical signs and symptoms as well as the histopathologic findings.10,11
Osler nodes present as tender, violaceous, subcutaneous nodules on the acral surfaces, usually on the pads of the fingers and toes.5 The pathogenesis involves the deposition of immune complexes as a sequela of vascular occlusion by microthrombi classically seen in the late phase of subacute endocarditis. Janeway lesions present as nontender erythematous macules on the acral surfaces and are thought to represent microthrombi with dermal microabscesses, more common in acute endocarditis. Our patient demonstrated features of both Osler nodes and Janeway lesions. Despite the presence of fungal thrombi—a pathophysiology closer to that of Janeway lesions—the clinical presentation of painful acral nodules affecting finger pads and histologic features of vasculitis may be better characterized as Osler nodes. Regardless of pathogenesis, these cutaneous findings serve as a minor clinical criterion in the Duke criteria for the diagnosis of infective endocarditis when present.12
Candida infective endocarditis should be suspected in a patient with a history of valvular disease or prior infective endocarditis with fungemia, unexplained neurologic signs, or manifestations of peripheral embolization despite negative blood cultures.3 Particularly in the setting of negative cardiac imaging, recognition of CIE requires heightened diagnostic acumen and clinicopathologic correlation. Although culture and pathologic examination of valvular vegetations represents the gold standard for diagnosis of CIE, aspiration and culture of easily accessible septic emboli may provide rapid identification of the etiologic pathogen. In 1976, Alpert et al13 identified C albicans from an aspirated Osler node. Postmortem examination revealed extensive involvement of the homograft valve and aortic root with C albicans.13 Many other examples exist in the literature demonstrating matching pathogenic isolates from microbiologic cultures of skin and blood.4,9,14,15 Thadepalli and Francis7 investigated 26 cases of endocarditis in heroin users in which the admitting diagnosis was endocarditis in only 4 cases. The etiologic pathogen was aspirated from secondary sites of localized infections secondary to emboli, including cutaneous lesions in 10 of the cases. Gram stain and culture revealed the causative organism leading to the ultimate diagnosis and management in 17 of 26 patients with endocarditis.7
The incidence of fungal endocarditis is increasing, with a reported 67% of cases caused by nosocomial infection.1 Given the rising incidence of fungal endocarditis and its accompanying diagnostic difficulties, including frequently negative blood cultures and cardiac imaging, clinicians must perform careful skin examinations, employ judicious use of skin biopsy, and carefully correlate clinical and pathologic findings to improve recognition of this disease and guide patient care.
- Arnold CJ, Johnson M, Bayer AS, et al. Infective endocarditis: an observational cohort study with a focus on therapy. Antimicrob Agents Chemother. 2015;59:2365. doi:10.1128/AAC.04867-14
- Chaudhary SC, Sawlani KK, Arora R, et al. Native aortic valve fungal endocarditis. BMJ Case Rep. 2013;2013:bcr2012007144. doi:10.1136/bcr-2012-007144
- Ellis ME, Al-Abdely H, Sandridge A, et al. Fungal endocarditis: evidence in the world literature, 1965–1995. Clin Infect Dis. 2001;32:50-62. doi:10.1086/317550
- Gil MP, Velasco M, Botella R, et al. Janeway lesions: differential diagnosis with Osler’s nodes. Int J Dermatol. 1993;32:673-674. doi:10.1111/j.1365-4362.1993.tb04025.x
- Gomes RT, Tiberto LR, Bello VNM, et al. Dermatologic manifestations of infective endocarditis. An Bras Dermatol. 2016;91:92-94.
- Yee JM. Osler’s nodes and the recognition of infective endocarditis: a lesion of diagnostic importance. South Med J. 1987;80:753-757.
- Thadepalli H, Francis C. Diagnostic clues in metastatic lesions of endocarditia in addicts. West J Med. 1978;128:1-5.
- Kerr A Jr. Subacute Bacterial Endocarditis. Charles C. Thomas; 1955.
- Kerr A Jr, Tan JS. Biopsies of the Janeway lesion of infective endocarditis. J Cutan Pathol. 1979;6:124-129. doi:10.1111/j.1600-0560.1979.tb01113.x
- Marrie TJ. Osler’s nodes and Janeway lesions. Am J Med. 2008;121:105-106. doi:10.1016/j.amjmed.2007.07.035
- Gunson TH, Oliver GF. Osler’s nodes and Janeway lesions. Australas J Dermatol. 2007;48:251-255. doi:10.1111/j.1440-0960.2007.00397.x
- Durack DT, Lukes AS, Bright DK, et al. New criteria for diagnosis of infective endocarditis: utilization of specific echocardiographic findings. Am J Med. 1994;96:200-209.
- Alpert JS, Krous HF, Dalen JE, et al. Pathogenesis of Osler’s nodes. Ann Intern Med. 1976;85:471-473. doi:10.7326/0003-4819-85-4-471
- Cardullo AC, Silvers DN, Grossman ME. Janeway lesions and Osler’s nodes: a review of histopathologic findings. J Am Acad Dermatol. 1990;22:1088-1090. doi:10.1016/0190-9622(90)70157-D
- Vinson RP, Chung A, Elston DM, et al. Septic microemboli in a Janeway lesion of bacterial endocarditis. J Am Acad Dermatol. 1996;35:984-985. doi:10.1016/S0190-9622(96)90125-5
PRACTICE POINTS
- Fungal infective endocarditis is rare, and diagnostic tests such as blood cultures and echocardiography may not detect the disease.
- The mortality rate of fungal endocarditis is high, with improved clinical outcomes if diagnosed and treated early.
- Clinicopathologic correlation between integumentary examination and skin biopsy findings may provide timely diagnosis, thereby guiding appropriate therapy.

Managing respiratory symptoms in the ‘tripledemic’ era
Is it COVID-19, flu, or even RSV? I recently described just such a patient, an obese woman with type 2 diabetes, presenting with fever, cough, myalgia, and fatigue. I asked readers whether they agreed with my management of this patient.
Thank you for your comments as we continue to react to high rates of URIs. Your comments highlight the importance of local resources and practice habits when managing patients with URI.
It was clear that readers value testing to distinguish between infections. However, access to testing is highly variable around the world and is likely to be routinely used only in high-income countries. The Kaiser Family Foundation performed a cost analysis of testing for SARS-CoV-2 in 2020 and found, not surprisingly, wide variability in the cost of testing. Medicare covers tests at rates of $36-$143 per test; a study of list prices for SARS-CoV-2 tests at 93 hospitals found a median cost of $148 per test. And this does not include collection or facility fees. About 20% of tests cost more than $300.
These costs are prohibitive for many health systems. However, more devices have been introduced since that analysis, and competition and evolving technology should drive down prices. Generally, multiplex polymerase chain reaction (PCR) testing for multiple pathogens is less expensive than ordering two or three separate molecular tests and is more convenient for patients and practices alike.
Other reader comments focused on the challenges of getting accurate data on viral epidemiology, and there is certainly a time lag between infection trends and public health reports. This is exacerbated by underreporting of symptoms and more testing at home using antigen tests.
But please do not give up on epidemiology! If a test such as PCR is 90% sensitive for identifying infection, the yield in terms of the number of individuals infected with a particular virus should be high, and that is true when infection is in broad circulation. If 20% of a population of 1,000 has an infection and the test sensitivity is 90%, the yield of testing is 180 true cases versus 20 false positives.
However, if just 2% of the population of 1,000 has the infection in this same scenario, then only 18 true cases are identified. The effect on public health is certainly less, and a lower prevalence rate means that confounding variables, such as how long an individual might shed viral particles and the method of sample collection, have an outsized effect on results. This reduces the validity of diagnostic tests.
Even trends on a national level can provide some insight regarding whom to test. Traditionally, our practice has been to not routinely test patients for influenza or RSV from late spring to early fall unless there was a compelling reason, such as recent travel to an area where these infections were more prevalent. The loss of temporality for these infections since 2020 has altered this approach and made us pay more attention to reports from public health organizations.
I also appreciate the discussion of how to treat Agnes’s symptoms as she waits to improve, and anyone who suffers with or treats a viral URI knows that there are few interventions effective for such symptoms as cough and congestion. A systematic review of 29 randomized controlled trials of over-the-counter medications for cough yielded mixed and largely negative results.
Antihistamines alone do not seem to work, and guaifenesin was successful in only one of three trials. Combinations of different drug classes appeared to be slightly more effective.
My personal favorite for the management of acute cough is something that kids generally love: honey. In a review of 14 studies, 9 of which were limited to pediatric patients, honey was associated with significant reductions in cough frequency, cough severity, and total symptom score. However, there was a moderate risk of bias in the included research, and evidence of honey’s benefit in placebo-controlled trials was limited. Honey used in this research came in a variety of forms, so the best dosage is uncertain.
Clearly, advancements are needed. Better symptom management in viral URI will almost certainly improve productivity across the population and will probably reduce the inappropriate use of antibiotics as well. I have said for years that the scientists who can solve the Gordian knot of pediatric mucus deserve three Nobel prizes. I look forward to that golden day.
Dr. Vega is a clinical professor of family medicine at the University of California, Irvine. He reported a conflict of interest with McNeil Pharmaceuticals.
A version of this article first appeared on Medscape.com.
Novel nomogram distinguishes pneumonias
A model incorporating factors such as lymphocytes and lung lesions differentiated adenovirus pneumonias from Chlamydia psittaci (CPP) in a multicenter study of nearly 200 individuals.
Symptoms of pneumonia caused by CPP are often confused with other respiratory infections, particularly adenovirus pneumonia (AVP), which can delay correct diagnosis and impact treatment, Yi Li, MD, of Xiangya Hospital, Central South University, Changsha, China, and colleagues wrote. Detailed comparisons of the two conditions are lacking.
In a retrospective study published in the International Journal of Infectious Diseases, the researchers examined laboratory, clinical, and radiological differences and created a nomogram to distinguish CPP from AVP. The study population included 78 adults with CPP and 102 with AVP who were seen at a single center in China. The mean ages of the CPP and AVP patients were 61.0 years and 38.5 years, and 57.7% men and 91.2% men, respectively. Patients with CPP were significantly more likely to have hypertension and diabetes at baseline, compared with the AVP group.
The primary outcome was 30-day mortality after hospital admission, which was 10.3% and 14.7% for the CPP and AVP patients, respectively (P = 0.376). However, the incidence of cardiac injury was significantly higher in AVP patients versus those with CPP (48.0% vs. 11.5%; P < 0.001).
In a multivariate analysis, age, sex, nervous system symptoms, lymphocyte count, C-reactive protein level (CRP), and bilateral lung lesions were risk factors for CPP. The researchers combined these factors into a nomogram that showed a concordance value of 0.949 for differentiating between the CPP and AVP groups.
Overall, CPP patients were older, had more nervous system symptoms, and had higher CRP levels, compared with patients with AVP, who were more likely to be men and to have higher lymphocyte percentages and more bilateral lung lesions on chest imaging.
The current study is the first known to provide a way to distinguish CPP and AVP, the researchers wrote. “The antibiotic treatments, prognoses, and life support measures of CPP and AVP are considerably different. Therefore, differentiating the two diseases through early identification of specific clinical characteristics is vital.”
The findings were limited by several factors including the small sample size, retrospective design, and the use of mNGS to diagnose CPP in the absence of standard clinical diagnostic kits, which may have resulted in underestimated CPP incidence, the researchers noted.
However, “the nomogram we established combines patient data on age, sex, and readily available laboratory results to reasonably predict CPP, thus making rapid and direct diagnosis possible,” they said.
The study was supported by the Key R&D Program of Hunan Province, Project Program of National Clinical Research Center for Geriatric Disorders, National Natural Science Foundation of China, Hunan Natural Science Youth Foundation, and the national key clinical specialist construction programs of China. The researchers had no financial conflicts to disclose.
FROM THE INTERNATIONAL JOURNAL OF INFECTIOUS DISEASES
Long COVID affecting more than one-third of college students, faculty
With a median age of 23 years, the study is unique for evaluating mostly healthy, young adults and for its rare look at long COVID in a university community.
The more symptoms during a bout with COVID, the greater the risk for long COVID, the researchers found. That lines up with previous studies. Also, the more vaccinations and booster shots against SARS-CoV-2, the virus that causes COVID, the lower the long COVID risk.
Women were more likely than men to be affected. Current or prior smoking, seeking medical care for COVID, and receiving antibody treatment also were linked to higher chances for developing long COVID.
Lead author Megan Landry, DrPH, MPH, and colleagues were already assessing students, staff, and faculty at George Washington University, Washington, who tested positive for COVID. Then they started seeing symptoms that lasted 28 days or more after their 10-day isolation period.
“We were starting to recognize that individuals ... were still having symptoms longer than the typical isolation period,” said Dr. Landry. So they developed a questionnaire to figure out the how long these symptoms last and how many people are affected by them.
The list of potential symptoms was long and included trouble thinking, fatigue, loss of smell or taste, shortness of breath, and more.
The study was published online in Emerging Infectious Diseases. Results are based on records and responses from 1,388 students, faculty, and staff from July 2021 to March 2022.
People had a median of four long COVID symptoms, about 63% were women, and 56% were non-Hispanic White. About three-quarters were students and the remainder were faculty and staff.
The finding that 36% of people with a history of COVID reported long COVID symptoms did not surprise Dr. Landry.
“Based on the literature that’s currently out there, it ranges from a 10% to an 80% prevalence of long COVID,” she said. “We kind of figured that we would fall somewhere in there.”
In contrast, that figure seemed high to Eric Topol, MD.
“That’s really high,” said Dr. Topol, founder and director of the Scripps Research Translational Institute in La Jolla, Calif. He added most studies estimate that about 10% of people with a history of acute infection develop long COVID.
Even at 10%, which could be an underestimate, that’s a lot of affected people globally.
“At least 65 million individuals around the world have long COVID, based on a conservative estimated incidence of 10% of infected people and more than 651 million documented COVID-19 cases worldwide; the number is likely much higher due to many undocumented cases,” Dr. Topol and colleagues wrote in a long COVID review article published in Nature Reviews Microbiology.
About 30% of study participants were fully vaccinated with an initial vaccine series, 42% had received a booster dose, and 29% were not fully vaccinated at the time of their first positive test for COVID. Those who were not fully vaccinated were significantly more likely to report symptoms of long COVID.
“I know a lot of people wish they could put COVID on the back burner or brush it under the rug, but COVID is still a real thing. We need to continue supporting vaccines and boosters and make sure people are up to date. Not only for COVID, but for flu as well,” Dr. Topol said
Research continues
“Long COVID is still evolving and we continue to learn more about it every day,” Landry said. “It’s just so new and there are still a lot of unknowns. That’s why it’s important to get this information out.”
People with long COVID often have a hard time with occupational, educational, social, or personal activities, compared with before COVID, with effects that can last for more than 6 months, the authors noted.
“I think across the board, universities in general need to consider the possibility of folks on their campuses are having symptoms of long COVID,” Dr. Landry said.
Moving forward, Dr. Landry and colleagues would like to continue investigating long COVID. For example, in the current study, they did not ask about severity of symptoms or how the symptoms affected daily functioning.
“I would like to continue this and dive deeper into how disruptive their symptoms of long COVID are to their everyday studying, teaching, or their activities to keeping a university running,” Dr. Landry said.
A version of this article originally appeared on WebMD.com.
FROM EMERGING INFECTIOUS DISEASES
Consider this tool to reduce antibiotic-associated adverse events in patients with sepsis
ILLUSTRATIVE CASE
A 52-year-old woman presents to the emergency department complaining of dysuria and a fever. Her work-up yields a diagnosis of sepsis secondary to pyelonephritis and bacteremia. She is admitted and started on broad-spectrum antimicrobial therapy. The patient’s symptoms improve significantly over the next 48 hours of treatment. When should antibiotic therapy be discontinued to reduce the patient’s risk for antibiotic-associated AEs and to optimize antimicrobial stewardship?
Antimicrobial resistance is a growing public health risk associated with considerable morbidity and mortality, extended hospitalization, and increased medical expenditures.2-4 Antibiotic stewardship is vital in curbing antimicrobial resistance. The predictive biomarker PCT has emerged as both a diagnostic and prognostic agent for numerous infectious diseases. It has recently received much attention as an adjunct to clinical judgment for discontinuation of antibiotic therapy in hospitalized patients with lower respiratory tract infections and/or sepsis.5-11 Indeed, use of PCT guidance in these patients has resulted in decreased AEs, as well as an enhanced survival benefit.5-15
The utility of PCT-guided early discontinuation of antibiotics had yet to be studied in an expanded population of hospitalized patients with sepsis—especially with regard to AEs associated with multidrug-resistant organisms (MDROs) and Clostridioides difficile (formerly Clostridium difficile). The Surviving Sepsis Campaign’s 2021 international guidelines support the use of PCT in conjunction with clinical evaluation for shortening the duration of antibiotic therapy (“weak recommendation, low quality of evidence”).16 They also suggest daily reassessment for de-escalation of antibiotic use (“weak recommendation, very low quality of evidence”) as a possible way to decrease MDROs and AEs but state that more and better trials are needed.15
STUDY SUMMARY
PCT-guided intervention reduced infection-associated AEs
This pragmatic, real-world, multicenter, randomized clinical trial evaluated the use of PCT-guided early discontinuation of antibiotic therapy in patients with sepsis, in hopes of decreasing infection-associated AEs related to prolonged antibiotic exposure.1 The trial took place in 7 hospitals in Athens, Greece, with 266 patients randomized to the PCT-guided intervention or the standard of care (SOC)—the 2016 international guidelines for the management of sepsis and septic shock from the Surviving Sepsis campaign.17 Study participants had sepsis, as defined by a sequential organ failure assessment (SOFA) score ≥ 2, and infections that included pneumonia, pyelonephritis, or bacteremia.16 Pregnancy, lactation, HIV infection with a low CD4 count, neutropenia, cystic fibrosis, and viral, parasitic, or tuberculosis infections were exclusion criteria. Of note, all patients were managed on general medical wards and not in intensive care units.
Serum PCT samples were collected at baseline and then at Day 5 of therapy. Discontinuation of antibiotic therapy in the PCT trial arm occurred once PCT levels were ≤ 0.5 mcg/L or were reduced by at least 80%. If PCT levels did not meet one of these criteria, the lab test would be repeated daily and antibiotic therapy would continue until the rule was met. Neither patients nor investigators were blinded to the treatment assignments, but investigators in the SOC arm were kept unaware of Day 5 PCT results. In the PCT arm, 71% of participants met Day 5 criteria for stopping antibiotics, and a retrospective analysis indicated that a near-identical 70% in the SOC arm also would have met the same criteria.
The assessment of stool colonization with either C difficile or MDROs was done by stool cultures at baseline and on Days 7, 28, and 180.
The primary outcome of infection-associated AEs, which was evaluated at 180 days, was defined as new cases of C difficile or MDRO infection, or death associated with baseline infection with either C difficile or an MDRO. Of the 133 participants allocated to each trial arm, 8 patients in the intervention group and 2 in the SOC group withdrew consent prior to treatment in the intervention group, with the remaining 125 and 131 participants, respectively, completing the interventions and not lost to follow-up.
Continue to: In an intention-to-treat analysis...
In an intention-to-treat analysis, 9 participants (7.2%; 95% CI, 3.8%-13.1%) in the PCT group compared with 20 participants (15.3%; 95% CI, 10.1%-22.4%) in the SOC group experienced the primary outcome of an antibiotic-associated AE at 180 days, resulting in a hazard ratio (HR) of 0.45 (95% CI, 0.2-0.98).
Secondary outcomes also favored the PCT arm regarding 28-day mortality (19 vs 37 patients; HR = 0.51; 95% CI, 0.29-0.89), median length of antibiotic treatment (5 days in the PCT group and 10 days in the SOC group; P < .001), and median hospitalization cost (24% greater in the SOC group; P = .05). Results for 180-day mortality were 30.4% in the PCT arm and 38.2% in the SOC arm (HR = 0.71; 95% CI, 0.42-1.19), thereby not achieving statistical significance.
WHAT'S NEW
An effective tool in reducing AEs in patients with sepsis
In this multicenter trial, PCT proved successful as a clinical decision tool for discontinuing antibiotic therapy and decreasing infection-associated AEs in patients with sepsis.
Caveats
A promising approach but its superiority is uncertain
The confidence interval for the AE hazard ratio was very wide, but significant, suggesting greater uncertainty and less precision in the chance of obtaining improved outcomes with PCT-guided intervention. However, these data also clarify that outcomes should (at least) not be worse with PCT-directed therapy.
CHALLENGES TO IMPLEMENTATION
Assay limitations and potential resistance to a new decision tool
The primary challenge to implementation is likely the availability of the PCT assay and the immediacy of turnaround time to enable physicians to make daily decisions regarding antibiotic therapy de-escalation. Additionally, as with any new knowledge, local culture and physician buy-in may limit implementation of this ever-more-valuable patient care tool.
1. Kyriazopoulou E, Liaskou-Antoniou L, Adamis G, et al. Procalcitonin to reduce long-term infection-associated adverse events in sepsis: a randomized trial. Am J Respir Crit Care Med. 2021;203:202-210. doi: 10.1164/rccm.202004-1201OC
2. European Centre for Disease Prevention and Control. US CDC report on antibiotic resistance threats in the United States, 2013. ECDC comment. September 18, 2013. Accessed December 29, 2022. www.ecdc.europa.eu/en/news-events/us-cdc-report-antibiotic-resistance-threats-united-states-2013
3. Peters L, Olson L, Khu DTK, et al. Multiple antibiotic resistance as a risk factor for mortality and prolonged hospital stay: a cohort study among neonatal intensive care patients with hospital-acquired infections caused by gram-negative bacteria in Vietnam. PloS One. 2019;14:e0215666. doi: 10.1371/journal.pone.0215666
4. Cosgrove SE. The relationship between antimicrobial resistance and patient outcomes: mortality, length of hospital stay, and health care costs. Clin Infect Dis. 2006;42(suppl 2):S82-S89. doi: 10.1086/499406
5. Schuetz P, Beishuizen A, Broyles M, et al. Procalcitonin (PCT)-guided antibiotic stewardship: an international experts consensus on optimized clinical use. Clin Chem Lab Med. 2019;57:1308-1318. doi: 10.1515/cclm-2018-1181
6. Schuetz P, Christ-Crain M, Thomann R, et al; ProHOSP Study Group. Effect of procalcitonin-based guidelines vs standard guidelines on antibiotic use in lower respiratory tract infections: the ProHOSP randomized controlled trial. JAMA. 2009;302:1059-1066. doi: 10.1001/jama.2009.1297
7. Bouadma L, Luyt CE, Tubach F, et al; PRORATA trial group. Use of procalcitonin to reduce patients’ exposure to antibiotics in intensive care units (PRORATA trial): a multicentre randomised controlled trial. Lancet. 2010;375:463-474. doi: 10.1016/S0140-6736(09)61879-1
8. Christ-Crain M, Jaccard-Stolz D, Bingisser R, et al. Effect of procalcitonin-guided treatment on antibiotic use and outcome in lower respiratory tract infections: cluster-randomised, single-blinded intervention trial. Lancet. 2004;363:600-607. doi: 10.1016/S0140-6736(04)15591-8
9. Christ-Crain M, Stolz D, Bingisser R, et al. Procalcitonin guidance of antibiotic therapy in community-acquired pneumonia: a randomized trial. Am J Respir Crit Care Med. 2006;174:84-93. doi: 10.1164/rccm.200512-1922OC
10. de Jong E, van Oers JA, Beishuizen A, et al. Efficacy and safety of procalcitonin guidance in reducing the duration of antibiotic treatment in critically ill patients: a randomised, controlled, open-label trial. Lancet Infect Dis. 2016;16:819-827. doi: 10.1016/S1473-3099(16)00053-0
11. Nobre V, Harbarth S, Graf JD, et al. Use of procalcitonin to shorten antibiotic treatment duration in septic patients: a randomized trial. Am J Respir Crit Care Med. 2008;177:498-505. doi: 10.1164/rccm.200708-1238OC
12. Schuetz P, Wirz Y, Sager R, et al. Effect of procalcitonin-guided antibiotic treatment on mortality in acute respiratory infections: a patient level meta-analysis. Lancet Infect Dis. 2018;18:95-107. doi: 10.1016/S1473-3099(17)30592-3
13. Schuetz P, Chiappa V, Briel M, et al. Procalcitonin algorithms for antibiotic therapy decisions: a systematic review of randomized controlled trials and recommendations for clinical algorithms. Arch Intern Med. 2011;171:1322-1331. doi: 10.1001/archin ternmed.2011.318
14. Wirz Y, Meier MA, Bouadma L, et al. Effect of procalcitonin-guided antibiotic treatment on clinical outcomes in intensive care unit patients with infection and sepsis patients: a patient-level meta-analysis of randomized trials. Crit Care. 2018;22:191. doi: 10.1186/s13054-018-2125-7
15. Elnajdy D, El-Dahiyat F. Antibiotics duration guided by biomarkers in hospitalized adult patients; a systematic review and meta-analysis. Infect Dis (Lond). 2022;54:387-402. doi: 10.1080/23744235.2022.2037701
16. Evans L, Rhodes A, Alhazzani W, et al. Surviving Sepsis Campaign: international guidelines for management of sepsis and septic shock 2021. Crit Care Med. 2021;49:e1063-e1143. doi: 10.1097/CCM.0000000000005337
17. Rhodes A, Evans LE, Alhazzani W, et al. Surviving Sepsis Campaign: international guidelines for management of sepsis and septic shock: 2016. Intensive Care Med. 2017;43:304-377. doi: 10.1007/s00134-017-4683-6
ILLUSTRATIVE CASE
A 52-year-old woman presents to the emergency department complaining of dysuria and a fever. Her work-up yields a diagnosis of sepsis secondary to pyelonephritis and bacteremia. She is admitted and started on broad-spectrum antimicrobial therapy. The patient’s symptoms improve significantly over the next 48 hours of treatment. When should antibiotic therapy be discontinued to reduce the patient’s risk for antibiotic-associated AEs and to optimize antimicrobial stewardship?
Antimicrobial resistance is a growing public health risk associated with considerable morbidity and mortality, extended hospitalization, and increased medical expenditures.2-4 Antibiotic stewardship is vital in curbing antimicrobial resistance. The predictive biomarker PCT has emerged as both a diagnostic and prognostic agent for numerous infectious diseases. It has recently received much attention as an adjunct to clinical judgment for discontinuation of antibiotic therapy in hospitalized patients with lower respiratory tract infections and/or sepsis.5-11 Indeed, use of PCT guidance in these patients has resulted in decreased AEs, as well as an enhanced survival benefit.5-15
The utility of PCT-guided early discontinuation of antibiotics had yet to be studied in an expanded population of hospitalized patients with sepsis—especially with regard to AEs associated with multidrug-resistant organisms (MDROs) and Clostridioides difficile (formerly Clostridium difficile). The Surviving Sepsis Campaign’s 2021 international guidelines support the use of PCT in conjunction with clinical evaluation for shortening the duration of antibiotic therapy (“weak recommendation, low quality of evidence”).16 They also suggest daily reassessment for de-escalation of antibiotic use (“weak recommendation, very low quality of evidence”) as a possible way to decrease MDROs and AEs but state that more and better trials are needed.15
STUDY SUMMARY
PCT-guided intervention reduced infection-associated AEs
This pragmatic, real-world, multicenter, randomized clinical trial evaluated the use of PCT-guided early discontinuation of antibiotic therapy in patients with sepsis, in hopes of decreasing infection-associated AEs related to prolonged antibiotic exposure.1 The trial took place in 7 hospitals in Athens, Greece, with 266 patients randomized to the PCT-guided intervention or the standard of care (SOC)—the 2016 international guidelines for the management of sepsis and septic shock from the Surviving Sepsis campaign.17 Study participants had sepsis, as defined by a sequential organ failure assessment (SOFA) score ≥ 2, and infections that included pneumonia, pyelonephritis, or bacteremia.16 Pregnancy, lactation, HIV infection with a low CD4 count, neutropenia, cystic fibrosis, and viral, parasitic, or tuberculosis infections were exclusion criteria. Of note, all patients were managed on general medical wards and not in intensive care units.
Serum PCT samples were collected at baseline and then at Day 5 of therapy. Discontinuation of antibiotic therapy in the PCT trial arm occurred once PCT levels were ≤ 0.5 mcg/L or were reduced by at least 80%. If PCT levels did not meet one of these criteria, the lab test would be repeated daily and antibiotic therapy would continue until the rule was met. Neither patients nor investigators were blinded to the treatment assignments, but investigators in the SOC arm were kept unaware of Day 5 PCT results. In the PCT arm, 71% of participants met Day 5 criteria for stopping antibiotics, and a retrospective analysis indicated that a near-identical 70% in the SOC arm also would have met the same criteria.
The assessment of stool colonization with either C difficile or MDROs was done by stool cultures at baseline and on Days 7, 28, and 180.
The primary outcome of infection-associated AEs, which was evaluated at 180 days, was defined as new cases of C difficile or MDRO infection, or death associated with baseline infection with either C difficile or an MDRO. Of the 133 participants allocated to each trial arm, 8 patients in the intervention group and 2 in the SOC group withdrew consent prior to treatment in the intervention group, with the remaining 125 and 131 participants, respectively, completing the interventions and not lost to follow-up.
Continue to: In an intention-to-treat analysis...
In an intention-to-treat analysis, 9 participants (7.2%; 95% CI, 3.8%-13.1%) in the PCT group compared with 20 participants (15.3%; 95% CI, 10.1%-22.4%) in the SOC group experienced the primary outcome of an antibiotic-associated AE at 180 days, resulting in a hazard ratio (HR) of 0.45 (95% CI, 0.2-0.98).
Secondary outcomes also favored the PCT arm regarding 28-day mortality (19 vs 37 patients; HR = 0.51; 95% CI, 0.29-0.89), median length of antibiotic treatment (5 days in the PCT group and 10 days in the SOC group; P < .001), and median hospitalization cost (24% greater in the SOC group; P = .05). Results for 180-day mortality were 30.4% in the PCT arm and 38.2% in the SOC arm (HR = 0.71; 95% CI, 0.42-1.19), thereby not achieving statistical significance.
WHAT'S NEW
An effective tool in reducing AEs in patients with sepsis
In this multicenter trial, PCT proved successful as a clinical decision tool for discontinuing antibiotic therapy and decreasing infection-associated AEs in patients with sepsis.
Caveats
A promising approach but its superiority is uncertain
The confidence interval for the AE hazard ratio was very wide, but significant, suggesting greater uncertainty and less precision in the chance of obtaining improved outcomes with PCT-guided intervention. However, these data also clarify that outcomes should (at least) not be worse with PCT-directed therapy.
CHALLENGES TO IMPLEMENTATION
Assay limitations and potential resistance to a new decision tool
The primary challenge to implementation is likely the availability of the PCT assay and the immediacy of turnaround time to enable physicians to make daily decisions regarding antibiotic therapy de-escalation. Additionally, as with any new knowledge, local culture and physician buy-in may limit implementation of this ever-more-valuable patient care tool.
1. Kyriazopoulou E, Liaskou-Antoniou L, Adamis G, et al. Procalcitonin to reduce long-term infection-associated adverse events in sepsis: a randomized trial. Am J Respir Crit Care Med. 2021;203:202-210. doi: 10.1164/rccm.202004-1201OC
2. European Centre for Disease Prevention and Control. US CDC report on antibiotic resistance threats in the United States, 2013. ECDC comment. September 18, 2013. Accessed December 29, 2022. www.ecdc.europa.eu/en/news-events/us-cdc-report-antibiotic-resistance-threats-united-states-2013
3. Peters L, Olson L, Khu DTK, et al. Multiple antibiotic resistance as a risk factor for mortality and prolonged hospital stay: a cohort study among neonatal intensive care patients with hospital-acquired infections caused by gram-negative bacteria in Vietnam. PloS One. 2019;14:e0215666. doi: 10.1371/journal.pone.0215666
4. Cosgrove SE. The relationship between antimicrobial resistance and patient outcomes: mortality, length of hospital stay, and health care costs. Clin Infect Dis. 2006;42(suppl 2):S82-S89. doi: 10.1086/499406
5. Schuetz P, Beishuizen A, Broyles M, et al. Procalcitonin (PCT)-guided antibiotic stewardship: an international experts consensus on optimized clinical use. Clin Chem Lab Med. 2019;57:1308-1318. doi: 10.1515/cclm-2018-1181
6. Schuetz P, Christ-Crain M, Thomann R, et al; ProHOSP Study Group. Effect of procalcitonin-based guidelines vs standard guidelines on antibiotic use in lower respiratory tract infections: the ProHOSP randomized controlled trial. JAMA. 2009;302:1059-1066. doi: 10.1001/jama.2009.1297
7. Bouadma L, Luyt CE, Tubach F, et al; PRORATA trial group. Use of procalcitonin to reduce patients’ exposure to antibiotics in intensive care units (PRORATA trial): a multicentre randomised controlled trial. Lancet. 2010;375:463-474. doi: 10.1016/S0140-6736(09)61879-1
8. Christ-Crain M, Jaccard-Stolz D, Bingisser R, et al. Effect of procalcitonin-guided treatment on antibiotic use and outcome in lower respiratory tract infections: cluster-randomised, single-blinded intervention trial. Lancet. 2004;363:600-607. doi: 10.1016/S0140-6736(04)15591-8
9. Christ-Crain M, Stolz D, Bingisser R, et al. Procalcitonin guidance of antibiotic therapy in community-acquired pneumonia: a randomized trial. Am J Respir Crit Care Med. 2006;174:84-93. doi: 10.1164/rccm.200512-1922OC
10. de Jong E, van Oers JA, Beishuizen A, et al. Efficacy and safety of procalcitonin guidance in reducing the duration of antibiotic treatment in critically ill patients: a randomised, controlled, open-label trial. Lancet Infect Dis. 2016;16:819-827. doi: 10.1016/S1473-3099(16)00053-0
11. Nobre V, Harbarth S, Graf JD, et al. Use of procalcitonin to shorten antibiotic treatment duration in septic patients: a randomized trial. Am J Respir Crit Care Med. 2008;177:498-505. doi: 10.1164/rccm.200708-1238OC
12. Schuetz P, Wirz Y, Sager R, et al. Effect of procalcitonin-guided antibiotic treatment on mortality in acute respiratory infections: a patient level meta-analysis. Lancet Infect Dis. 2018;18:95-107. doi: 10.1016/S1473-3099(17)30592-3
13. Schuetz P, Chiappa V, Briel M, et al. Procalcitonin algorithms for antibiotic therapy decisions: a systematic review of randomized controlled trials and recommendations for clinical algorithms. Arch Intern Med. 2011;171:1322-1331. doi: 10.1001/archin ternmed.2011.318
14. Wirz Y, Meier MA, Bouadma L, et al. Effect of procalcitonin-guided antibiotic treatment on clinical outcomes in intensive care unit patients with infection and sepsis patients: a patient-level meta-analysis of randomized trials. Crit Care. 2018;22:191. doi: 10.1186/s13054-018-2125-7
15. Elnajdy D, El-Dahiyat F. Antibiotics duration guided by biomarkers in hospitalized adult patients; a systematic review and meta-analysis. Infect Dis (Lond). 2022;54:387-402. doi: 10.1080/23744235.2022.2037701
16. Evans L, Rhodes A, Alhazzani W, et al. Surviving Sepsis Campaign: international guidelines for management of sepsis and septic shock 2021. Crit Care Med. 2021;49:e1063-e1143. doi: 10.1097/CCM.0000000000005337
17. Rhodes A, Evans LE, Alhazzani W, et al. Surviving Sepsis Campaign: international guidelines for management of sepsis and septic shock: 2016. Intensive Care Med. 2017;43:304-377. doi: 10.1007/s00134-017-4683-6
PRACTICE CHANGER
For patients hospitalized with sepsis, consider procalcitonin (PCT)-guided early discontinuation of antibiotic therapy for fewer infection-associated adverse events (AEs).
STRENGTH OF RECOMMENDATION
Kyriazopoulou E, Liaskou-Antoniou L, Adamis G, et al. Procalcitonin to reduce long-term infection-associated adverse events in sepsis. A randomized trial. Am J Respir Crit Care Med. 2021;203:202-210. doi: 10.1164/rccm.202004-1201OC

Flu, other common viruses linked to neurologic disease
People hospitalized with viral infections like the flu are more likely to have disorders that degrade the nervous system, like Alzheimer’s or Parkinson’s, later in life, a new analysis shows.
The viruses included influenza, encephalitis, herpes, hepatitis, pneumonia, meningitis, and shingles. Those viruses were linked to one or more of these conditions: Alzheimer’s disease, Parkinson’s disease, amyotrophic lateral sclerosis (ALS), dementia, and multiple sclerosis.
The authors of the study, which was published this month in the journal Neuron, cautioned that their findings stopped short of saying the viruses caused the disorders.
“Neurodegenerative disorders are a collection of diseases for which there are very few effective treatments and many risk factors,” study author and National Institutes of Health researcher Andrew B. Singleton, PhD, said in a news release from the NIH. “Our results support the idea that viral infections and related inflammation in the nervous system may be common – and possibly avoidable – risk factors for these types of disorders.”
For the study, two data sets were analyzed with a combined 800,000 medical records for people in Finland and the United Kingdom. People who were hospitalized with COVID-19 were excluded from the study.
Generalized dementia was the condition linked to the most viruses. People exposed to viral encephalitis, which causes brain inflammation, were 20 times more likely to be diagnosed with Alzheimer’s, compared with those who were not diagnosed with that virus.
Both influenza and pneumonia were also associated with all of the neurodegenerative disorder diagnoses studied, with the exception of multiple sclerosis. The researchers found that severe flu cases were linked to the most risks.
“Keep in mind that the individuals we studied did not have the common cold. Their infections made them so sick that they had to go to the hospital,” said study author and NIH researcher Michael Nalls, PhD. “Nevertheless, the fact that commonly used vaccines reduce the risk or severity of many of the viral illnesses observed in this study raises the possibility that the risks of neurodegenerative disorders might also be mitigated.”
The researchers examined the time from when someone was infected with a virus to the time when they were diagnosed with one of the neurodegenerative disorders. They found that most had a high risk within 1 year of infection. But in six scenarios, there were significant links that showed up after 5-15 years.
The authors wrote that vaccines that are available for some of the viruses studied may be a way to reduce the risk of getting diseases that degrade the nervous system.
A version of this article first appeared on WebMD.com.
FROM NEURON
FDA wants annual COVID boosters, just like annual flu shots
The U.S. Food and Drug Administration is suggesting a single annual shot. The formulation would be selected in June targeting the most threatening COVID-19 strains, and then people could get a shot in the fall when people begin spending more time indoors and exposure increases.
Some people, such as those who are older or immunocompromised, may need more than one dose.
A national advisory committee is expected to vote on the proposal at a meeting Jan. 26.
People in the United States have been much less likely to get an updated COVID-19 booster shot, compared with widespread uptake of the primary vaccine series. In its proposal, the FDA indicated it hoped a single annual shot would overcome challenges created by the complexity of the process – both in messaging and administration – attributed to that low booster rate. Nine in 10 people age 12 or older got the primary vaccine series in the United States, but only 15% got the latest booster shot for COVID-19.
About half of children and adults in the U.S. get an annual flu shot, according to Centers for Disease Control and Prevention data.
The FDA also wants to move to a single COVID-19 vaccine formulation that would be used for primary vaccine series and for booster shots.
COVID-19 cases, hospitalizations, and deaths are trending downward, according to the data tracker from the New York Times. Cases are down 28%, with 47,290 tallied daily. Hospitalizations are down 22%, with 37,474 daily. Deaths are down 4%, with an average of 489 per day as of Jan. 22.
A version of this article originally appeared on WebMD.com.
Mpox: Dermatology registry data pinpoints unique signs
that frequently appeared before systemic illness and a much lower overall numbers of lesions.
“Just these two findings alone show how important it is to remain clinically vigilant as dermatologists,” Esther Freeman, MD, PhD, director of global health dermatology at Massachusetts General Hospital, Boston, said in an interview. She is the corresponding author of the study, which analyzed 101 mpox cases from 13 countries and was published online on in the Journal of the American Academy of Dermatology.
“Mpox appeared to manifest differently than in previous outbreaks with morphologic and clinical evolutions much different than previously reported in endemic and prior outbreaks,” added Dr. Freeman. “Dermatologists should continue to keep mpox on the differential as it continues to circulate at low levels in the population and is a mimicker of many other common skin diseases.”
According to the Centers for Disease Control and Prevention, as of Jan. 20, 2023, there have been 30,061 cases of mpox in the United States during the outbreak that began in 2022; 23 people died. Worldwide, the number of cases neared 85,000.

Most of the affected cases were among gay, bisexual, and other men who have sex with men. A vaccination effort began last summer, and the number of cases soon plummeted. The national daily case count in January has been in the single digits.
For the new report, dermatologists tracked cases via the American Academy of Dermatology/International League of Dermatologic Societies (AAD/ILDS) Dermatology COVID-19, Monkeypox (mpox), and Emerging Infections Registry. The new report includes data about cases entered from Aug. 4 to Nov. 13. Of these cases, 97% were male, median age was 35 years, 62% were White, 20% were Hispanic, and 11% were Black.
Just over half (54%) of patients reported skin lesions as the first sign of disease, while others had signs such as fever (16%) and malaise (9%). “This is a sharp contrast to endemic or prior outbreaks in which a ‘flu-like’ prodrome preceded lesions,” Dr. Freeman said. “Dermatologists should be aware that patients may come in with mpox skin lesions as their only initial symptoms.”
In contrast to past outbreaks where patients may have had dozens or hundreds of lesions, 20% had only 1 lesion, while 52% had 2-5 lesions, and 20% had 6-20 lesions. “There may be only a few lesions, so index of suspicion needs to be high,” Dr. Freeman said.
According to the study, “the most common skin lesion morphologies and secondary characteristics reported included papules, vesicles/blisters, pustules, erosions/ulcers and crust/scabs.” Dr. Freeman cautioned that “lesions may not go through the ‘typical’ progression from papule to pustule. The initial lesion could even be an ulceration or a crust. For dermatologists, this means you need to have a high index of suspicion, especially if you see a new onset lesion in the groin or perianal area, though they can also start elsewhere.”
She added that “the lesion you see on exam could be a classic pustule/pseudopustule, but it might not be – it could be a small perianal erosion or ulceration. If you have any concern it could be mpox, it’s a good idea to test by PCR.”
Morbilliform rash, scarring reported
The study also highlighted 10 cases of morbilliform rash. “A morbilliform exanthem is pretty nonspecific, and usually cases of mpox have more specific features,” dermatologist and study coauthor Misha Rosenbach, MD, of the University of Pennsylvania, Philadelphia, said in an interview.

“Given the current low rates of mpox, I do not think most dermatologists need to worry about mpox when evaluating morbilliform exanthems. However, in high-risk patients or patients with other morphologies, it is worth noting that there’s a chance that this may be related.”
Emory University dermatologist Howa Yeung, MD, MSc, who wasn’t involved with the study, said in an interview that morbilliform rashes in the mouth/tongue area, mostly on days 1-5, should be considered a possible sign of mpox. “While I didn’t typically think of monkeypox virus as a cause of viral exanthems, I will now add it to my differential diagnoses.”

In the report, 13% of patients had scarring, “an outcome underemphasized in the current literature” that could have long-term emotional and mental effects, the authors noted. “Some patients, particularly immunosuppressed patients, have had very large and/or ulceronecrotic lesions,” Dr. Rosenbach said. “Their scarring can be quite significant. There is, to date, very little guidance for clinicians or patients on how to mitigate this risk and, if scarring is developing, how best to manage it.”
As for lessons from the findings, Dr. Yeung said, “dermatologists need to be aware that patients with mpox can have multiple morphologies at the same time and lesions can skip stages.” And, he pointed out, it’s clear that wound care is important to prevent scarring.
The AAD has a resource page on skin care in patients with mpox that includes information about preventing scarring. Examples of mpox rashes are available on the CDC website.
The study was supported by a grant from the International League of Dermatologic Societies and in-kind support from the American Academy of Dermatology. Dr. Freeman is a coauthor for UpToDate. Dr. Freeman and Dr. Rosenbach are members of the AAD Ad Hoc Task Force to Create Monkeypox Content. Study authors reported no other disclosures, and Dr. Yeung has no disclosures.
that frequently appeared before systemic illness and a much lower overall numbers of lesions.
“Just these two findings alone show how important it is to remain clinically vigilant as dermatologists,” Esther Freeman, MD, PhD, director of global health dermatology at Massachusetts General Hospital, Boston, said in an interview. She is the corresponding author of the study, which analyzed 101 mpox cases from 13 countries and was published online on in the Journal of the American Academy of Dermatology.
“Mpox appeared to manifest differently than in previous outbreaks with morphologic and clinical evolutions much different than previously reported in endemic and prior outbreaks,” added Dr. Freeman. “Dermatologists should continue to keep mpox on the differential as it continues to circulate at low levels in the population and is a mimicker of many other common skin diseases.”
According to the Centers for Disease Control and Prevention, as of Jan. 20, 2023, there have been 30,061 cases of mpox in the United States during the outbreak that began in 2022; 23 people died. Worldwide, the number of cases neared 85,000.
Most of the affected cases were among gay, bisexual, and other men who have sex with men. A vaccination effort began last summer, and the number of cases soon plummeted. The national daily case count in January has been in the single digits.
For the new report, dermatologists tracked cases via the American Academy of Dermatology/International League of Dermatologic Societies (AAD/ILDS) Dermatology COVID-19, Monkeypox (mpox), and Emerging Infections Registry. The new report includes data about cases entered from Aug. 4 to Nov. 13. Of these cases, 97% were male, median age was 35 years, 62% were White, 20% were Hispanic, and 11% were Black.
Just over half (54%) of patients reported skin lesions as the first sign of disease, while others had signs such as fever (16%) and malaise (9%). “This is a sharp contrast to endemic or prior outbreaks in which a ‘flu-like’ prodrome preceded lesions,” Dr. Freeman said. “Dermatologists should be aware that patients may come in with mpox skin lesions as their only initial symptoms.”
In contrast to past outbreaks where patients may have had dozens or hundreds of lesions, 20% had only 1 lesion, while 52% had 2-5 lesions, and 20% had 6-20 lesions. “There may be only a few lesions, so index of suspicion needs to be high,” Dr. Freeman said.
According to the study, “the most common skin lesion morphologies and secondary characteristics reported included papules, vesicles/blisters, pustules, erosions/ulcers and crust/scabs.” Dr. Freeman cautioned that “lesions may not go through the ‘typical’ progression from papule to pustule. The initial lesion could even be an ulceration or a crust. For dermatologists, this means you need to have a high index of suspicion, especially if you see a new onset lesion in the groin or perianal area, though they can also start elsewhere.”
She added that “the lesion you see on exam could be a classic pustule/pseudopustule, but it might not be – it could be a small perianal erosion or ulceration. If you have any concern it could be mpox, it’s a good idea to test by PCR.”
Morbilliform rash, scarring reported
The study also highlighted 10 cases of morbilliform rash. “A morbilliform exanthem is pretty nonspecific, and usually cases of mpox have more specific features,” dermatologist and study coauthor Misha Rosenbach, MD, of the University of Pennsylvania, Philadelphia, said in an interview.
“Given the current low rates of mpox, I do not think most dermatologists need to worry about mpox when evaluating morbilliform exanthems. However, in high-risk patients or patients with other morphologies, it is worth noting that there’s a chance that this may be related.”
Emory University dermatologist Howa Yeung, MD, MSc, who wasn’t involved with the study, said in an interview that morbilliform rashes in the mouth/tongue area, mostly on days 1-5, should be considered a possible sign of mpox. “While I didn’t typically think of monkeypox virus as a cause of viral exanthems, I will now add it to my differential diagnoses.”
In the report, 13% of patients had scarring, “an outcome underemphasized in the current literature” that could have long-term emotional and mental effects, the authors noted. “Some patients, particularly immunosuppressed patients, have had very large and/or ulceronecrotic lesions,” Dr. Rosenbach said. “Their scarring can be quite significant. There is, to date, very little guidance for clinicians or patients on how to mitigate this risk and, if scarring is developing, how best to manage it.”
As for lessons from the findings, Dr. Yeung said, “dermatologists need to be aware that patients with mpox can have multiple morphologies at the same time and lesions can skip stages.” And, he pointed out, it’s clear that wound care is important to prevent scarring.
The AAD has a resource page on skin care in patients with mpox that includes information about preventing scarring. Examples of mpox rashes are available on the CDC website.
The study was supported by a grant from the International League of Dermatologic Societies and in-kind support from the American Academy of Dermatology. Dr. Freeman is a coauthor for UpToDate. Dr. Freeman and Dr. Rosenbach are members of the AAD Ad Hoc Task Force to Create Monkeypox Content. Study authors reported no other disclosures, and Dr. Yeung has no disclosures.
FROM THE JOURNAL OF THE AMERICAN ACADEMY OF DERMATOLOGY
COVID dramatically increases death risk during pregnancy: Study
Women infected with COVID-19 during pregnancy are seven times more likely to die during childbirth or during the pregnancy than uninfected pregnant women, a new study shows. The new report also warns of many other severe complications linked with the virus during pregnancy, as well as risks to the baby after birth.
But the researchers said they did not find that COVID-19 infection during pregnancy impacted the risk of stillbirth or a baby’s growth rate during pregnancy.
The study, which was a meta-analysis of previous research, was published Jan. 16 in the journal BMJ Global Health. Data from 12 studies from 12 countries were combined so researchers could analyze outcomes for 13,136 pregnant women.
Babies born to mothers who were infected with COVID during pregnancy had almost double the risk of needing stays in the neonatal intensive care unit and also were more likely to be born preterm, compared with babies who were born to pregnant women who didn’t get COVID.
The researchers also found that pregnant women who got COVID were more likely to be admitted to intensive care units, need a ventilator to help them survive, develop dangerous blood clots, or develop preeclampsia, which is a high blood pressure disorder that can be fatal for the mother or baby.
One of the strengths of the study was that it included women in different trimesters during pregnancy.
“That’s something new here too is that COVID at any time during pregnancy did bring this extra risk onto mom and babies,” said lead author Emily R. Smith, ScD, MPH, assistant professor of global health at the George Washington University, in a video statement.
The report is prompting calls for improved efforts to convince pregnant women to get vaccinated for COVID-19. The rate among them remains low: About 1 in 5 pregnant women had received the most updated COVID-19 booster as of Jan. 7, according to the CDC.
“The implications here are that it’s really important that if you’re pregnant or if you’re thinking about becoming pregnant, to get vaccinated,” Dr. Smith said. “This can really reduce the risk of having some of these bad outcomes for mom or for baby.”
A version of this article first appeared on WebMD.com.