User login
Deutetrabenazine modestly reduces chorea of Huntington disease
A deuterated form of the vesicular monoamine transporter type 2 inhibitor tetrabenazine, called deutetrabenazine, modestly reduced chorea of Huntington disease over 12 weeks in a phase III, double-blind, randomized, placebo-controlled trial.
First author Samuel Frank, MD, of Beth Israel Deaconess Medical Center in Boston and his colleagues in the Huntington Study Group wrote that the observed treatment effect of 2.5 points on the primary end point of total maximal chorea score, “taken together with improvements in patient-centered end points, such as PGIC [Patient Global Impression of Change] and SF-36 [36-Item Short Form] physical functioning component scales, may be of clinical relevance, although this remains to be determined. The difference in total maximal chorea score associated with deutetrabenazine treatment that was observed in this study is notable given the progressive decline in total maximal chorea score and total motor score that has been previously described as part of the natural history of Huntington disease.”
The phase III trial is the first to use an active ingredient with deuterium substituted for hydrogen at key positions. The use of deuterium in the molecule, according to the investigators, prolongs “plasma half-life and reduce[s] metabolic variability, without changing target pharmacology,” and its “longer half-life and unique pharmacokinetic profile ... may enable less frequent and lower daily doses, thus achieving similar systemic exposure with lower peak concentrations and simplified dosing, compared with tetrabenazine.”
Tetrabenazine (Xenazine) is used worldwide and is the only U.S. Food and Drug Administration–approved therapy for treating chorea associated with Huntington disease.
The trial enrolled 90 patients with genetically diagnosed Huntington disease across 34 centers in the United States and Canada. The patients had a baseline total maximal chorea score of 8 or higher (range 0-28) and were randomized on a 1:1 ratio to receive deuterated tetrabenazine (deutetrabenazine) or placebo. The deutetrabenazine group had a mean age of 55 years and 49% were male. The placebo group had a mean age of 52 years and 62% were men. Patients on the active drug were commenced at a total daily dose of 6 mg (divided into two doses) for the first week. Doses were then increased weekly by 6 mg daily until either chorea was adequately controlled or the maximum dose of 48 mg a day was reached. The final dose was maintained for an additional 4 weeks for a total of 12 weeks, followed by a 1-week washout (JAMA 2016;316[1]:40-50. doi: 10.1001/jama.2016.8655).
The total maximal chorea score, in which higher scores represent worse chorea, that was measured from baseline to an average across the maintenance period during weeks 9 through 12 of therapy declined by a statistically significant 4.4 points – from a mean of 12.1 to 7.7 – in the deutetrabenazine group, compared with a decline of 1.9 points – from a mean of 13.2 to 11.3 – in the placebo group.
Improvements in secondary endpoints such as PGIC and SF-36 physical functioning component scales were also seen in the treatment group, although no improvement was seen in the Berg Balance Test.
Adverse events were similar between the deutetrabenazine and placebo groups, including depression, anxiety, and akathisia.
“Further research is needed to assess the clinical importance of the effect size, and to determine longer-term efficacy and safety,” the study authors concluded.
The study was supported by Auspex Pharmaceuticals, a wholly owned subsidiary of Teva Pharmaceutical Industries. Dr. Frank reported receiving grants from the Huntington Study Group, and many other authors in the group reported financial ties to pharmaceutical companies, including Auspex and Teva. Several authors are employees of Auspex.
The study demonstrated a proof of principle that deutetrabenazine, compared with placebo, provided improvement on chorea over 12 weeks and allowed less frequent drug dosing with fewer adverse effects, but it’s not possible to determine how the drug compares with tetrabenazine.
An ideal trial would involve three groups comparing deutetrabenazine, tetrabenazine, and placebo. A head-to-head, noninferiority comparison of deutetrabenazine against tetrabenazine, as was recommended by one of the developers of the compound, would also have been useful.
Nevertheless, tetrabenazine was approved by the FDA for the treatment of chorea in Huntington disease essentially based on efficacy data similar to the current study. Assuming deutetrabenazine was not priced significantly higher than tetrabenazine, its “favorable profile” would offer an additional option for patients and clinicians if and when the drug is approved.
The ongoing ARC-HD (Alternatives for Reducing Chorea in Huntington Disease) study is examining the safety and tolerability of patients with Huntington disease who switch from tetrabenazine to deutetrabenazine (and also includes patients from the current deutetrabenazine study who chose to switch to open-label deutetrabenazine). It should help to resolve whether the effect sizes are clinically meaningful and stable over a period longer than 12 weeks.
Michael D. Geschwind, MD, PhD, and Nick Paras, PhD, are in the department of neurology at the University of California, San Francisco. Dr. Geschwind reported receiving grants from the National Institute on Aging and from many sources in industry, including travel support from Teva. Dr. Paras reported receiving research support from Daiichi-Sankyo, the U.S. Department of Defense, and the Tau Consortium. Their comments are derived from an editorial accompanying the phase III trial’s paper (JAMA. 2016;316[1]:33-5).
A deuterated form of the vesicular monoamine transporter type 2 inhibitor tetrabenazine, called deutetrabenazine, modestly reduced chorea of Huntington disease over 12 weeks in a phase III, double-blind, randomized, placebo-controlled trial.
First author Samuel Frank, MD, of Beth Israel Deaconess Medical Center in Boston and his colleagues in the Huntington Study Group wrote that the observed treatment effect of 2.5 points on the primary end point of total maximal chorea score, “taken together with improvements in patient-centered end points, such as PGIC [Patient Global Impression of Change] and SF-36 [36-Item Short Form] physical functioning component scales, may be of clinical relevance, although this remains to be determined. The difference in total maximal chorea score associated with deutetrabenazine treatment that was observed in this study is notable given the progressive decline in total maximal chorea score and total motor score that has been previously described as part of the natural history of Huntington disease.”
The phase III trial is the first to use an active ingredient with deuterium substituted for hydrogen at key positions. The use of deuterium in the molecule, according to the investigators, prolongs “plasma half-life and reduce[s] metabolic variability, without changing target pharmacology,” and its “longer half-life and unique pharmacokinetic profile ... may enable less frequent and lower daily doses, thus achieving similar systemic exposure with lower peak concentrations and simplified dosing, compared with tetrabenazine.”
Tetrabenazine (Xenazine) is used worldwide and is the only U.S. Food and Drug Administration–approved therapy for treating chorea associated with Huntington disease.
The trial enrolled 90 patients with genetically diagnosed Huntington disease across 34 centers in the United States and Canada. The patients had a baseline total maximal chorea score of 8 or higher (range 0-28) and were randomized on a 1:1 ratio to receive deuterated tetrabenazine (deutetrabenazine) or placebo. The deutetrabenazine group had a mean age of 55 years and 49% were male. The placebo group had a mean age of 52 years and 62% were men. Patients on the active drug were commenced at a total daily dose of 6 mg (divided into two doses) for the first week. Doses were then increased weekly by 6 mg daily until either chorea was adequately controlled or the maximum dose of 48 mg a day was reached. The final dose was maintained for an additional 4 weeks for a total of 12 weeks, followed by a 1-week washout (JAMA 2016;316[1]:40-50. doi: 10.1001/jama.2016.8655).
The total maximal chorea score, in which higher scores represent worse chorea, that was measured from baseline to an average across the maintenance period during weeks 9 through 12 of therapy declined by a statistically significant 4.4 points – from a mean of 12.1 to 7.7 – in the deutetrabenazine group, compared with a decline of 1.9 points – from a mean of 13.2 to 11.3 – in the placebo group.
Improvements in secondary endpoints such as PGIC and SF-36 physical functioning component scales were also seen in the treatment group, although no improvement was seen in the Berg Balance Test.
Adverse events were similar between the deutetrabenazine and placebo groups, including depression, anxiety, and akathisia.
“Further research is needed to assess the clinical importance of the effect size, and to determine longer-term efficacy and safety,” the study authors concluded.
The study was supported by Auspex Pharmaceuticals, a wholly owned subsidiary of Teva Pharmaceutical Industries. Dr. Frank reported receiving grants from the Huntington Study Group, and many other authors in the group reported financial ties to pharmaceutical companies, including Auspex and Teva. Several authors are employees of Auspex.
FROM JAMA
Key clinical point: Use of a deuterated form of tetrabenazine resulted in modest reductions in chorea of Huntington disease over 12 weeks, compared with placebo.
Major finding: The total maximal chorea score measured from baseline to maintenance therapy was reduced by a statistically significant 4.4 points in patients taking deutetrabenazine, compared with 1.9 point in those taking placebo.
Data source: A double-blind, randomized, placebo-controlled trial involving 90 patients genetically diagnosed with Huntington disease.
Disclosures: The study was supported by Auspex Pharmaceuticals, a wholly owned subsidiary of Teva Pharmaceutical Industries. Dr. Frank reported receiving grants from the Huntington Study Group, and many other authors in the group reported financial ties to pharmaceutical companies, including Auspex and Teva. Several authors are employees of Auspex.
Erythema and Induration on the Right Ear and Maxilla
Lepromatous Leprosy
Lepromatous leprosy (LL) is a chronic, cutaneous, granulomatous infection caused by Mycobacterium leprae or the newly discovered Mycobacterium lepromatosis, both acid-fast, intracellular, bacillus bacterium.1 Although decreasing in prevalence due to effective treatment with antimicrobials, LL continues to be endemic in warm tropical or subtropical areas in Southeast Asia, sub-Saharan Africa, the Indian subcontinent, and South America.1 The mode of transmission of infection is not well established.
The cutaneous manifestation of leprosy was previously classified based on the cell-mediated immune response of the patient, as described by Ridley and Jopling,2 ranging from tuberculoid leprosy (TT) to LL. In this spectrum of leprosy are the borderline lesions including borderline tuberculoid, borderline, and borderline lepromatous.2,3 Although this classification is popular, in 2012 the World Health Organization implemented a new 2-category classification system to standardize treatment regimens: paucibacillary (2–5 lesions or 1 nerve involvement) and multibacillary (>5 lesions or multiple nerve involvement).4
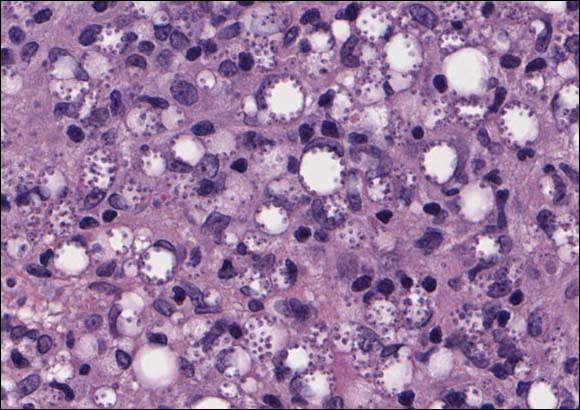
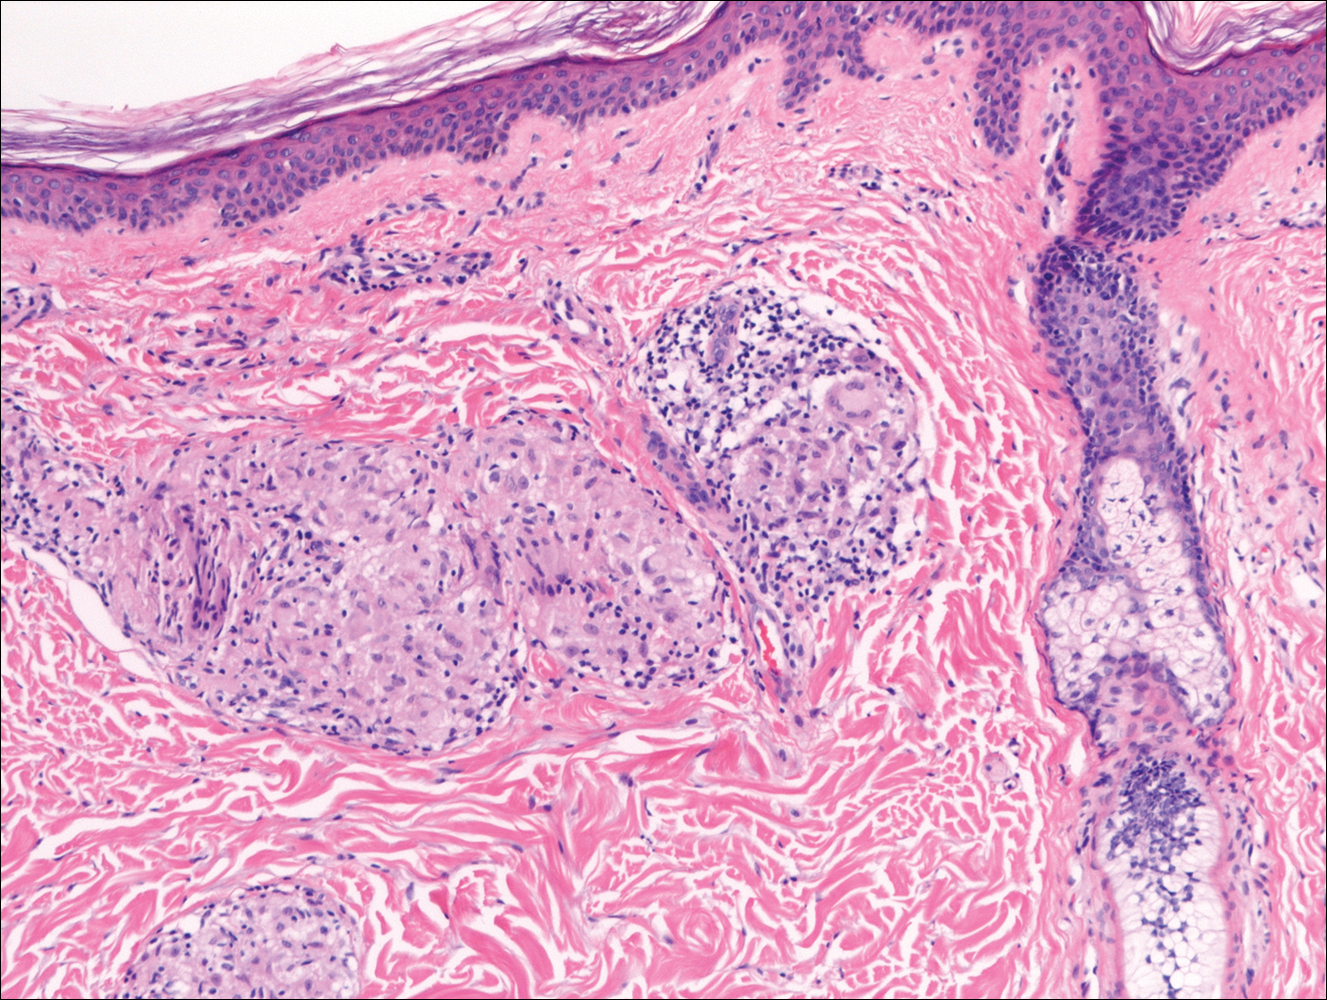
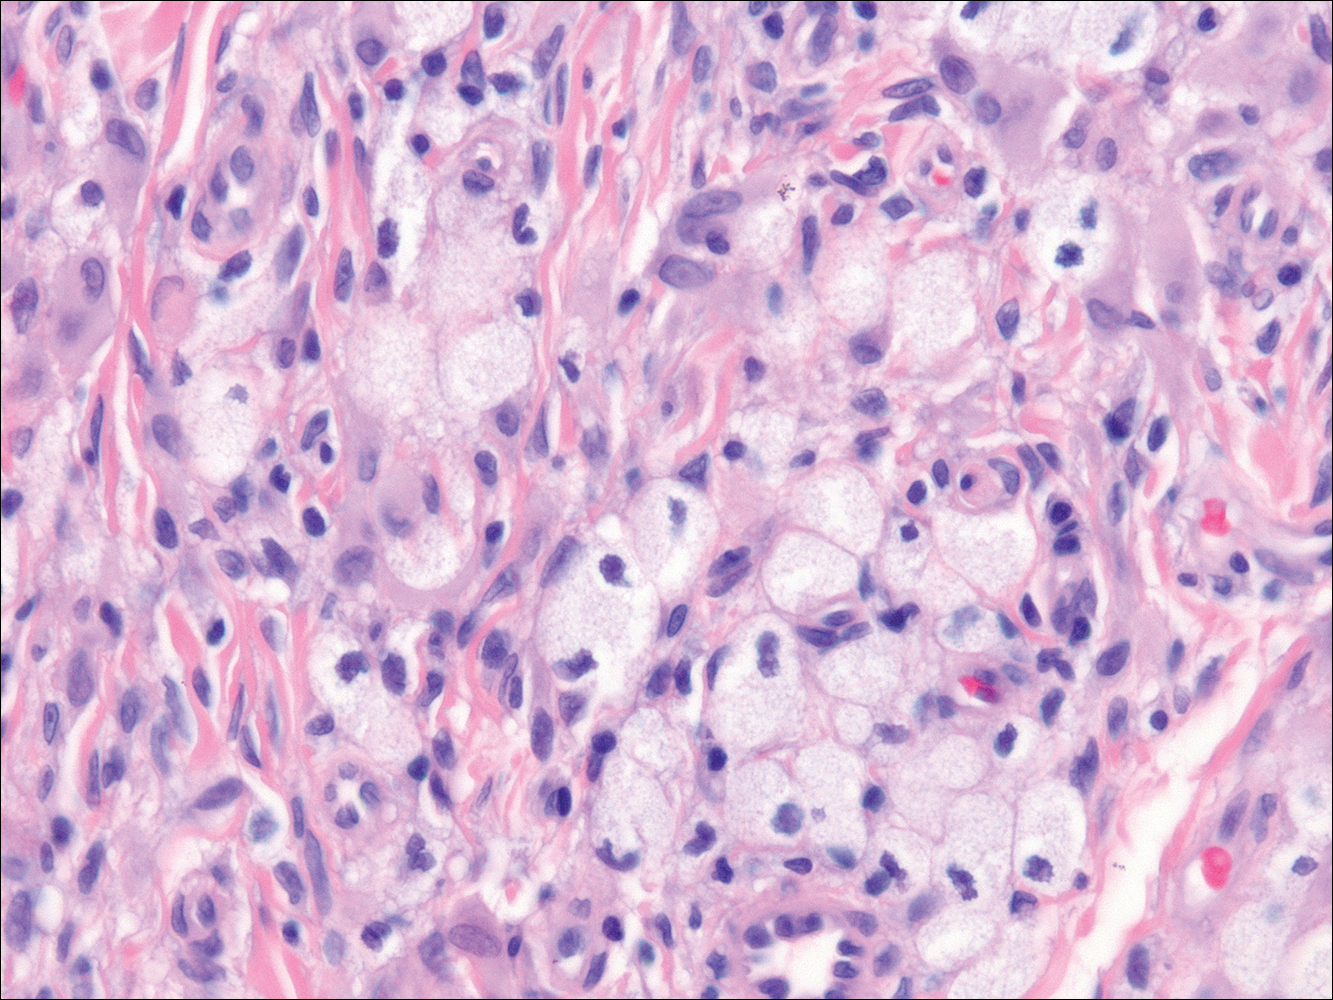
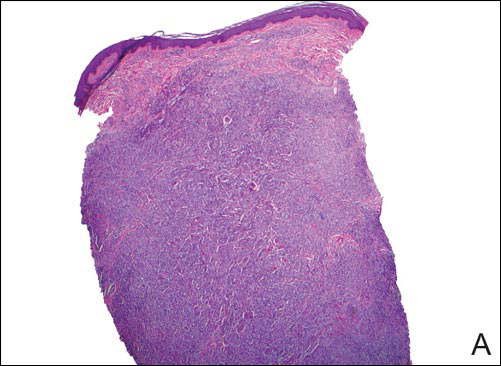
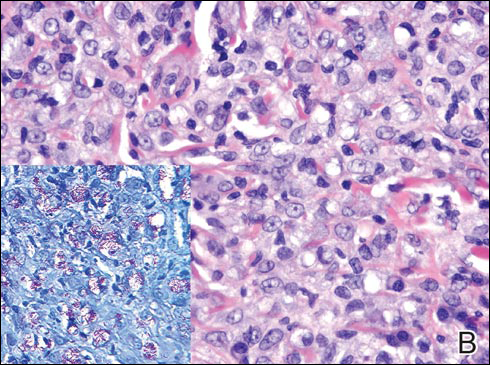
In LL, a cell-mediated immune response is not mounted against the infection in the patient. Clinically, the disease can manifest as macular and nodular erythematous cutaneous lesions with poorly defined borders that are preferentially located on the face, earlobes, and nasal mucosa. Chronic infections are associated with sensory loss. Histologically, the dermis is densely infiltrated by foamy macrophages (Virchow cells or lepra cells), which do not form granulomas (quiz image A). The infiltrate may have varying accompanying lymphocytes and plasma cells, which can extend deep into the subcutaneous adipose tissue. Between the dermal infiltrate and epidermis is an uninvolved band of superficial dermis called the Grenz zone. The epidermis is flattened and atrophic. Nerves often are surrounded by macrophages with degrees of hyalinization but rarely are swollen. On acid-fast staining (Wade-Fite or Ziehl-Neelsen), numerous acid-fast bacilli are present within dermal cells in densely packed, intracellular collections called globi (quiz image B).2,3,5
In TT, the robust immune response causes epithelioid granuloma formation, similar to cutaneous sarcoidosis, and few, if any, organisms can be found on special stains. The remaining borderline lesions have varying numbers of bacilli and varying amounts of granuloma formation.3,6,7 Many cases of TT resolve without specific treatment. For most leprous diseases, the World Health Organization currently recommends a regimen of dapsone, rifampin, and clofazimine combination treatments for 6 to 12 months depending on the type of leprosy.8
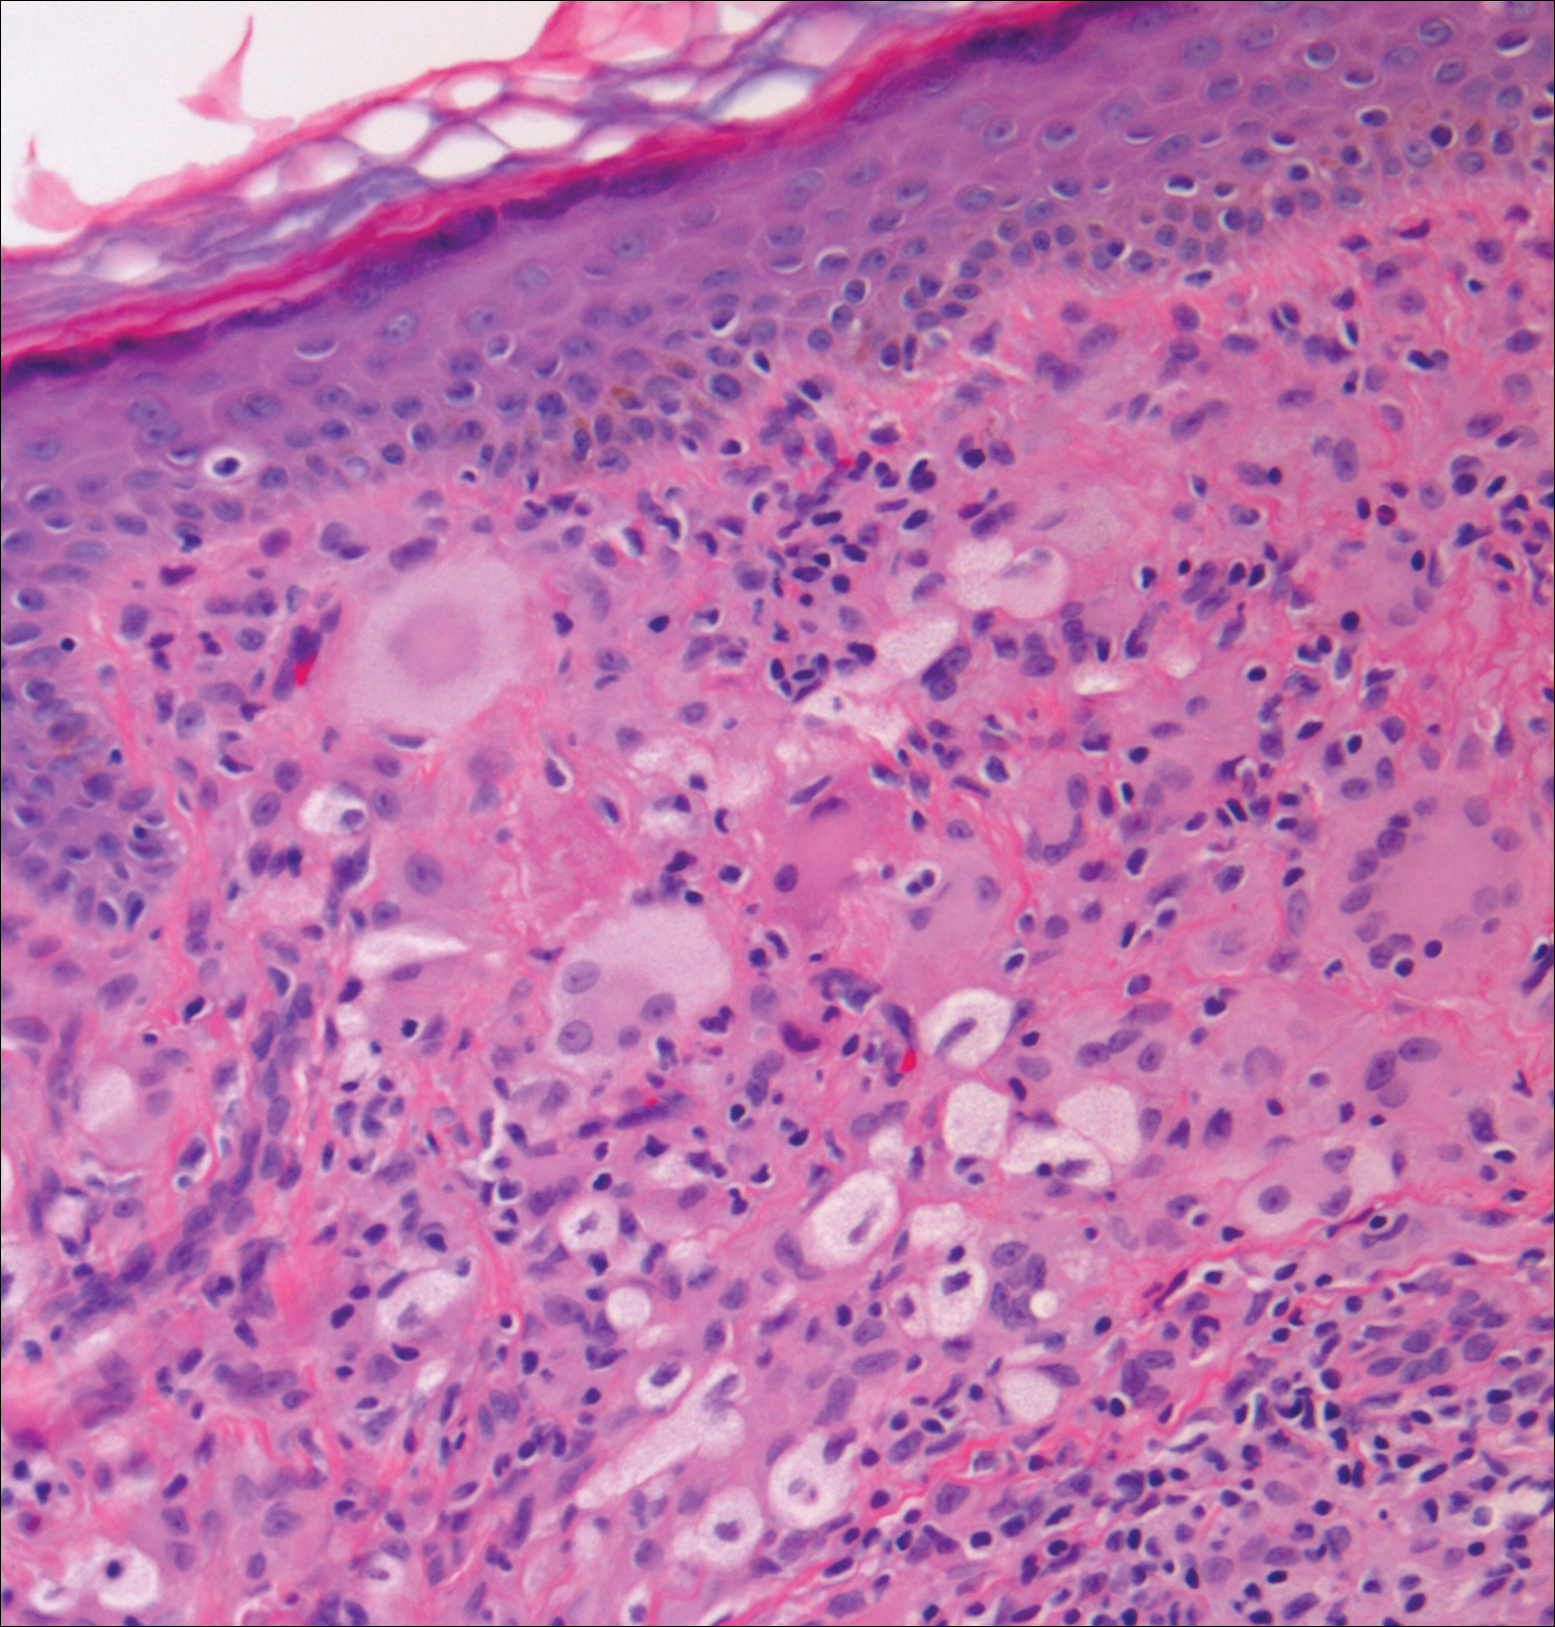
Cutaneous leishmaniasis should be included in the differential diagnosis for patients from LL endemic areas. Early lesions can have a histiocytic infiltration with associated mixed inflammation and prominent epidermal hyperplasia. These early lesions usually have parasitic organisms located within the periphery of the cytoplasm of macrophages (“marquee sign”) to help differentiate it from leprous diseases (Figure 1).9
In nonendemic areas, leprous diseases often are mistaken for sarcoidosis, xanthomas, granular cell tumors, paraffinomas, or other histiocytic-rich lesions.10 Cutaneous sarcoidosis may be difficult to distinguish from TT, as both have noncaseating granulomas (Figure 2). Rare acid-fast bacilli may aid in the diagnosis, and sarcoid granulomas are not typically associated with cutaneous nerve involvement. New diagnostic tools such as polymerase chain reaction or genome sequencing can pick up rare organisms.
Xanthogranuolomas and xanthomas may histologically resemble LL with a dense dermal infiltrate of foamy histiocytes. No organisms are found in the infiltrate. Histologically, xanthogranulomas (juvenile or adult) will be a mixed infiltrate with foamy histiocytes; giant cell formation, especially Touton giant cells; lymphocytes; and granulocytes (Figure 3). Touton giant cells have a wreathlike formation of nuclei and an outer vacuolated cytoplasm. Xanthomas have sheets of large histiocytes with a foamy, lipid-filled interior and mild lymphocytic infiltrate (Figure 4).
- Han XY, Seo YH, Sizer KC, et al. A new Mycobacterium species causing diffuse lepromatous leprosy. Am J Clin Pathol. 2008;130:856-864.
- Ridley DS, Jopling WH. Classification of leprosy according to immunity. a five-group system. Int J Lepr Other Mycobact Dis. 1966;34:255-273.
- Ridley DS. Histological classification and the immunological spectrum of leprosy. Bull World Health Organ. 1974;51:451-465.
- World Health Organization. WHO Expert Committee on Leprosy. World Health Organ Tech Rep Ser. 2012;968:1-61.
- Massone C, Belachew WA, Schettini A. Histopathology of the lepromatous skin biopsy. Clin Dermatol. 2015;33:38-45.
- Britton WJ, Lockwood DN. Leprosy. Lancet. 2004;363:1209-1219.
- Crowson AN, Magro C, Mihm M Jr. Treponemal diseases. In: Elder DE, Elenitsas R, Johnson Jr BL, et al. Lever’s Histopathology of the Skin. 10th ed. Philadelphia, PA: Lippincott Williams & Wilkins; 2009:540-579.
- Dacso MM, Jacobson RR, Scollard DM, et al. Evaluation of multi-drug therapy for leprosy in the United States using daily rifampin. South Med J. 2011;104:689-694.
- Handler MZ, Patel PA, Kapila R, et al. Cutaneous and mucocutaneous leishmaniasis: differential diagnosis, diagnosis, histopathology, and management. J Am Acad Dermatol. 2015;73:911-926.
- Massone C, Nunzi E, Cerroni L. Histopathologic diagnosis of leprosy in a nonendemic area. Am J Dermatopathol. 2010;32:417-419.
Lepromatous Leprosy
Lepromatous leprosy (LL) is a chronic, cutaneous, granulomatous infection caused by Mycobacterium leprae or the newly discovered Mycobacterium lepromatosis, both acid-fast, intracellular, bacillus bacterium.1 Although decreasing in prevalence due to effective treatment with antimicrobials, LL continues to be endemic in warm tropical or subtropical areas in Southeast Asia, sub-Saharan Africa, the Indian subcontinent, and South America.1 The mode of transmission of infection is not well established.
The cutaneous manifestation of leprosy was previously classified based on the cell-mediated immune response of the patient, as described by Ridley and Jopling,2 ranging from tuberculoid leprosy (TT) to LL. In this spectrum of leprosy are the borderline lesions including borderline tuberculoid, borderline, and borderline lepromatous.2,3 Although this classification is popular, in 2012 the World Health Organization implemented a new 2-category classification system to standardize treatment regimens: paucibacillary (2–5 lesions or 1 nerve involvement) and multibacillary (>5 lesions or multiple nerve involvement).4
In LL, a cell-mediated immune response is not mounted against the infection in the patient. Clinically, the disease can manifest as macular and nodular erythematous cutaneous lesions with poorly defined borders that are preferentially located on the face, earlobes, and nasal mucosa. Chronic infections are associated with sensory loss. Histologically, the dermis is densely infiltrated by foamy macrophages (Virchow cells or lepra cells), which do not form granulomas (quiz image A). The infiltrate may have varying accompanying lymphocytes and plasma cells, which can extend deep into the subcutaneous adipose tissue. Between the dermal infiltrate and epidermis is an uninvolved band of superficial dermis called the Grenz zone. The epidermis is flattened and atrophic. Nerves often are surrounded by macrophages with degrees of hyalinization but rarely are swollen. On acid-fast staining (Wade-Fite or Ziehl-Neelsen), numerous acid-fast bacilli are present within dermal cells in densely packed, intracellular collections called globi (quiz image B).2,3,5
In TT, the robust immune response causes epithelioid granuloma formation, similar to cutaneous sarcoidosis, and few, if any, organisms can be found on special stains. The remaining borderline lesions have varying numbers of bacilli and varying amounts of granuloma formation.3,6,7 Many cases of TT resolve without specific treatment. For most leprous diseases, the World Health Organization currently recommends a regimen of dapsone, rifampin, and clofazimine combination treatments for 6 to 12 months depending on the type of leprosy.8
Cutaneous leishmaniasis should be included in the differential diagnosis for patients from LL endemic areas. Early lesions can have a histiocytic infiltration with associated mixed inflammation and prominent epidermal hyperplasia. These early lesions usually have parasitic organisms located within the periphery of the cytoplasm of macrophages (“marquee sign”) to help differentiate it from leprous diseases (Figure 1).9
In nonendemic areas, leprous diseases often are mistaken for sarcoidosis, xanthomas, granular cell tumors, paraffinomas, or other histiocytic-rich lesions.10 Cutaneous sarcoidosis may be difficult to distinguish from TT, as both have noncaseating granulomas (Figure 2). Rare acid-fast bacilli may aid in the diagnosis, and sarcoid granulomas are not typically associated with cutaneous nerve involvement. New diagnostic tools such as polymerase chain reaction or genome sequencing can pick up rare organisms.
Xanthogranuolomas and xanthomas may histologically resemble LL with a dense dermal infiltrate of foamy histiocytes. No organisms are found in the infiltrate. Histologically, xanthogranulomas (juvenile or adult) will be a mixed infiltrate with foamy histiocytes; giant cell formation, especially Touton giant cells; lymphocytes; and granulocytes (Figure 3). Touton giant cells have a wreathlike formation of nuclei and an outer vacuolated cytoplasm. Xanthomas have sheets of large histiocytes with a foamy, lipid-filled interior and mild lymphocytic infiltrate (Figure 4).
- Han XY, Seo YH, Sizer KC, et al. A new Mycobacterium species causing diffuse lepromatous leprosy. Am J Clin Pathol. 2008;130:856-864.
- Ridley DS, Jopling WH. Classification of leprosy according to immunity. a five-group system. Int J Lepr Other Mycobact Dis. 1966;34:255-273.
- Ridley DS. Histological classification and the immunological spectrum of leprosy. Bull World Health Organ. 1974;51:451-465.
- World Health Organization. WHO Expert Committee on Leprosy. World Health Organ Tech Rep Ser. 2012;968:1-61.
- Massone C, Belachew WA, Schettini A. Histopathology of the lepromatous skin biopsy. Clin Dermatol. 2015;33:38-45.
- Britton WJ, Lockwood DN. Leprosy. Lancet. 2004;363:1209-1219.
- Crowson AN, Magro C, Mihm M Jr. Treponemal diseases. In: Elder DE, Elenitsas R, Johnson Jr BL, et al. Lever’s Histopathology of the Skin. 10th ed. Philadelphia, PA: Lippincott Williams & Wilkins; 2009:540-579.
- Dacso MM, Jacobson RR, Scollard DM, et al. Evaluation of multi-drug therapy for leprosy in the United States using daily rifampin. South Med J. 2011;104:689-694.
- Handler MZ, Patel PA, Kapila R, et al. Cutaneous and mucocutaneous leishmaniasis: differential diagnosis, diagnosis, histopathology, and management. J Am Acad Dermatol. 2015;73:911-926.
- Massone C, Nunzi E, Cerroni L. Histopathologic diagnosis of leprosy in a nonendemic area. Am J Dermatopathol. 2010;32:417-419.
A 43-year-old man from Ghana presented with erythema and induration on the skin of the right maxillary region and right ear of several weeks’ duration.
The best diagnosis is:
a. cutaneous leishmaniasis
b. lepromatous leprosy
c. sarcoidosis
d. xanthogranuloma
e. xanthoma
Global Visits, 99024, and MACRA: 3 Things You Should Think About and Lose Sleep Over But Probably Do Not
How does the global period affect dermatologists?
Global period is a term used to describe what is included in the payment for performance of a procedure using Current Procedural Terminology (CPT) codes. These global periods can either be 0 (000), 10 (010), or 90 (090) days. In dermatology, we have all three. Most codes used by dermatologists fall under global periods of 0 and 10 days, while 90-day codes are used for all adjacent tissue transfers and split- and full-thickness grafts. In documents listing global periods for CPT codes,1 you also may see “XXX” when the global period concept does not apply to a particular code, “YYY” when the payer decides on whether a global period applies and what it will be, and “ZZZ” when a certain code is an add-on to another service and is therefore included in the global period for that service.
The contents of a service are defined by the global period. Although the procedure itself is an obvious component, CPT codes with a global period of 000 (eg, biopsy of a skin lesion, simple repairs) have no preoperative or postoperative periods, and an evaluation and management (E&M) service usually is not payable if it was done in relation to the procedure. If the patient returns the following day for any reason, including concerns about the procedure itself, these visits may be reported separately.
For CPT codes with global periods of 010 (eg, excisions, intermediate and complex repairs, destructions), there also is no preoperative period and a visit on the day of the procedure generally is not payable as a separate service. The day of the procedure and the 10 days after are included in the global period, and any visits relating to the procedure on that day and the 10 days following the procedure are not payable separately. Typically, the value of one 99212 or 99213 E&M visit is included in the payment for the procedure.
For CPT codes with global periods of 090, the day before the procedure, the day of the procedure, and 90 days following the procedure are all included. Typically, more than one established patient visit along with hospital management and discharge planning where deemed necessary by the Centers for Medicare & Medicaid Services (CMS) are included, which seems straightforward, but there is a sort of paradox here. An initial evaluation by the surgeon who determines the need for the 090 code (by definition, 090 means major surgery and major surgery means 090) can be separately reported for E&M using modifier -57 (decision for surgery), which means the surgeon seeing the hot abdomen in the emergency department can report an E&M code in addition to the procedure, as can the surgeon who decides to repair a defect after removal of a skin tumor with a flap or graft. The same is not applicable if one performs a simple repair (included with benign or malignant excisions) following Mohs micrographic surgery or an intermediate or complex repair after any form of skin cancer removal. In any event, you are making a decision about what repair is best for the patient and sharing that with him/her while obtaining patient consent, but only 090 codes allow the capture of the decision to perform the procedure.
Which modifiers can you use on the same day as a procedure during the global period?
All is not lost if you perform other activities on the same day as the procedure or during the global period if those other activities are unrelated, which means complications of the procedure cannot be separately reported. If the unrelated cognitive work is reported on the day of a procedure with an E&M code, it should be accompanied by modifier -25 (significant, separately identifiable E&M service by the same physician or other qualified health care professional on the same day of the procedure or other service). If you have an E&M visit unrelated to the procedure within the global period, report it using modifier -24 (unrelated E&M service by the same physician or other qualified health care professional during a postoperative period).
If you perform another procedure on the same day as the primary one, you can use modifier -51 (multiple procedures) to let the payer know you provided other services that are separately reportable. If you do multiples of the same procedure, use modifier -59 (distinct procedural service) to let the payer know that you indeed did multiple procedures and did not submit a typographical error. Modifier -59 also is used when you perform a pair of procedures on separate and distinct lesions that would be disallowed by Mutually Exclusive Edits if done on a single lesion. For example, if you perform a biopsy of a lesion and immediately curette it, you should wait for the pathology report; if the lesion is malignant, only the destruction should be reported, and if it is benign, the only medically necessary service was the biopsy. When biopsy and curettage are performed on 2 separate lesions on the same date of service, payer software will disallow the biopsy charge unless a -59 modifier is attached to indicate that the biopsy was performed on a separate lesion. Medicare has introduced the -XS modifier, which is planned to be phased in to replace the -59 modifier for Medicare patients,2 if and when the CMS sets up their systems to accept the modifier.
If you repeat a procedure during the global period (eg, reexcision for a positive margin), it is appropriate to use modifier -58 (staged or related procedure or service by the same physician or other qualified health care professional during the postoperative period). If an unrelated procedure is performed during the global period, such as removing another lesion at a different site, modifier -79 (unrelated procedure or service by the same physician or other qualified health care professional during the postoperative period) lets you report it.
There are 2 available modifiers that you might think twice before using. Modifier -76 (repeat procedure or service by same physician or other qualified health care professional) may be used if, for example, a wound opens and you have to sew it up again. The more common usage is more pedestrian; a second electrocardiogram reading on the same day is a common use.3 Modifier -78 (unplanned return to the operating/procedure room by the same physician or other qualified health care professional following initial procedure for a related procedure during the postoperative period) is used when something goes awry, such as an aneurysm repair that is bleeding postoperatively, necessitating a trip back to the operating room.4
How might these modifiers be used in dermatology? One example may be if a wound dehisces or needs to be seen for a bleeding issue that might necessitate opening and exploring the wound; if a patient has one of these problems after fixing the plumbing and hits himself with a wrench, use of these modifiers is reasonable. On the other hand, if the patient is waiting in your office to be picked up and the problem happens, using these modifiers may not be the wisest thing to do. Let common sense prevail!
What is CPT code 99024?
Likely a code you have never used in your private office, the descriptor for 99024 states “postoperative follow-up visit, normally included in the surgical package, to indicate that an E&M service was performed during a postoperative period for a reason(s) related to the original procedure,” which translates to “here for an included visit so why am I billing this and having the cost of a claim with no reimbursement?” Why indeed. You may be using it as a space holder—one more check and balance so no patient leaves the office without a superbill or its electronic equivalent being submitted to your billing staff—or you may simply never use it. The CMS is interested in it as a way to see if the visits embedded in global periods actually take place. This is especially important as CMS is legally mandated under the Medicare Access and CHIP Reauthorization Act of 2015 (MACRA)5 to see if these visits actually take place.6 There are billions of dollars paid out for visits that are part of the global package and this code is one way the government may track them. If you are not using this code at all, you might consider it, even if you do not submit a claim. Your staff will know you did not forget to report a service and the reporting of the code by you internally and it lets you document for the billing side of the practice that they were there and a code report has been performed and not simply forgotten.
Final Thoughts
Following this discussion of global periods and CPT code 99024, you may be wondering why you get paid what you do and how the visits all link together. The buzzword is intensity, and we will explore that concept and IWPUT (intraservice work per unit of time), which I have coined as meaning “I Will Persevere Until Then,” in the next column.
- Revisions to Payment Policies under the Physician Fee Schedule and Other Revisions to Part B for CY 2016. Addendum B—Relative Value Units and Related Information Used in CY 2016 Final Rule. Centers for Medicare & Medicaid Services website. https://www.cms.gov/Medicare/Medicare-Fee-for-Service-Payment/PhysicianFeeSched?Downloads?CY2016-PFS-FC-Addenda.zip. Updated November 5, 2015. Accessed June 1, 2016.
- Modifier 59 article. Centers for Medicare & Medicaid Services website. https://www.cms.gov/Medicare/Coding/NationalCorrectCodInitEd/downloads/modifier59.pdf. Accessed June 20, 2016.
- Modifier dictionary FAQ. American College of Emergency Physicians website. https://www.acep.org/Physician-Resources/Practice-Resources/Administration/Financial-Issues-/-Reimbursement/Modifier-Dictionary-FAQ/. Updated April 2014. Accessed June 2, 2016.
- Modifier 78 fact sheet. Wisconsin Physicians Service Insurance Corporation website. http://wpsmedicare.com/j8macpartb/resources/modifiers/modifier-78.shtml. Accessed June 2, 2016.
- Medicare Access and CHIP Reauthorization Act of 2015, HR 2, 114th Cong, 1st Sess (2015).
- Medicare Learning Network. Collecting data on global surgery as required by MACRA: listening session. Centers for Medicare & Medicaid Services website. https://www.cms.gov/Outreach-and-Education/Outreach/NPC/Downloads/2016-01-20-MACRA-Transcript.pdf. Posted January 20, 2016. Accessed June 2, 2016.
How does the global period affect dermatologists?
Global period is a term used to describe what is included in the payment for performance of a procedure using Current Procedural Terminology (CPT) codes. These global periods can either be 0 (000), 10 (010), or 90 (090) days. In dermatology, we have all three. Most codes used by dermatologists fall under global periods of 0 and 10 days, while 90-day codes are used for all adjacent tissue transfers and split- and full-thickness grafts. In documents listing global periods for CPT codes,1 you also may see “XXX” when the global period concept does not apply to a particular code, “YYY” when the payer decides on whether a global period applies and what it will be, and “ZZZ” when a certain code is an add-on to another service and is therefore included in the global period for that service.
The contents of a service are defined by the global period. Although the procedure itself is an obvious component, CPT codes with a global period of 000 (eg, biopsy of a skin lesion, simple repairs) have no preoperative or postoperative periods, and an evaluation and management (E&M) service usually is not payable if it was done in relation to the procedure. If the patient returns the following day for any reason, including concerns about the procedure itself, these visits may be reported separately.
For CPT codes with global periods of 010 (eg, excisions, intermediate and complex repairs, destructions), there also is no preoperative period and a visit on the day of the procedure generally is not payable as a separate service. The day of the procedure and the 10 days after are included in the global period, and any visits relating to the procedure on that day and the 10 days following the procedure are not payable separately. Typically, the value of one 99212 or 99213 E&M visit is included in the payment for the procedure.
For CPT codes with global periods of 090, the day before the procedure, the day of the procedure, and 90 days following the procedure are all included. Typically, more than one established patient visit along with hospital management and discharge planning where deemed necessary by the Centers for Medicare & Medicaid Services (CMS) are included, which seems straightforward, but there is a sort of paradox here. An initial evaluation by the surgeon who determines the need for the 090 code (by definition, 090 means major surgery and major surgery means 090) can be separately reported for E&M using modifier -57 (decision for surgery), which means the surgeon seeing the hot abdomen in the emergency department can report an E&M code in addition to the procedure, as can the surgeon who decides to repair a defect after removal of a skin tumor with a flap or graft. The same is not applicable if one performs a simple repair (included with benign or malignant excisions) following Mohs micrographic surgery or an intermediate or complex repair after any form of skin cancer removal. In any event, you are making a decision about what repair is best for the patient and sharing that with him/her while obtaining patient consent, but only 090 codes allow the capture of the decision to perform the procedure.
Which modifiers can you use on the same day as a procedure during the global period?
All is not lost if you perform other activities on the same day as the procedure or during the global period if those other activities are unrelated, which means complications of the procedure cannot be separately reported. If the unrelated cognitive work is reported on the day of a procedure with an E&M code, it should be accompanied by modifier -25 (significant, separately identifiable E&M service by the same physician or other qualified health care professional on the same day of the procedure or other service). If you have an E&M visit unrelated to the procedure within the global period, report it using modifier -24 (unrelated E&M service by the same physician or other qualified health care professional during a postoperative period).
If you perform another procedure on the same day as the primary one, you can use modifier -51 (multiple procedures) to let the payer know you provided other services that are separately reportable. If you do multiples of the same procedure, use modifier -59 (distinct procedural service) to let the payer know that you indeed did multiple procedures and did not submit a typographical error. Modifier -59 also is used when you perform a pair of procedures on separate and distinct lesions that would be disallowed by Mutually Exclusive Edits if done on a single lesion. For example, if you perform a biopsy of a lesion and immediately curette it, you should wait for the pathology report; if the lesion is malignant, only the destruction should be reported, and if it is benign, the only medically necessary service was the biopsy. When biopsy and curettage are performed on 2 separate lesions on the same date of service, payer software will disallow the biopsy charge unless a -59 modifier is attached to indicate that the biopsy was performed on a separate lesion. Medicare has introduced the -XS modifier, which is planned to be phased in to replace the -59 modifier for Medicare patients,2 if and when the CMS sets up their systems to accept the modifier.
If you repeat a procedure during the global period (eg, reexcision for a positive margin), it is appropriate to use modifier -58 (staged or related procedure or service by the same physician or other qualified health care professional during the postoperative period). If an unrelated procedure is performed during the global period, such as removing another lesion at a different site, modifier -79 (unrelated procedure or service by the same physician or other qualified health care professional during the postoperative period) lets you report it.
There are 2 available modifiers that you might think twice before using. Modifier -76 (repeat procedure or service by same physician or other qualified health care professional) may be used if, for example, a wound opens and you have to sew it up again. The more common usage is more pedestrian; a second electrocardiogram reading on the same day is a common use.3 Modifier -78 (unplanned return to the operating/procedure room by the same physician or other qualified health care professional following initial procedure for a related procedure during the postoperative period) is used when something goes awry, such as an aneurysm repair that is bleeding postoperatively, necessitating a trip back to the operating room.4
How might these modifiers be used in dermatology? One example may be if a wound dehisces or needs to be seen for a bleeding issue that might necessitate opening and exploring the wound; if a patient has one of these problems after fixing the plumbing and hits himself with a wrench, use of these modifiers is reasonable. On the other hand, if the patient is waiting in your office to be picked up and the problem happens, using these modifiers may not be the wisest thing to do. Let common sense prevail!
What is CPT code 99024?
Likely a code you have never used in your private office, the descriptor for 99024 states “postoperative follow-up visit, normally included in the surgical package, to indicate that an E&M service was performed during a postoperative period for a reason(s) related to the original procedure,” which translates to “here for an included visit so why am I billing this and having the cost of a claim with no reimbursement?” Why indeed. You may be using it as a space holder—one more check and balance so no patient leaves the office without a superbill or its electronic equivalent being submitted to your billing staff—or you may simply never use it. The CMS is interested in it as a way to see if the visits embedded in global periods actually take place. This is especially important as CMS is legally mandated under the Medicare Access and CHIP Reauthorization Act of 2015 (MACRA)5 to see if these visits actually take place.6 There are billions of dollars paid out for visits that are part of the global package and this code is one way the government may track them. If you are not using this code at all, you might consider it, even if you do not submit a claim. Your staff will know you did not forget to report a service and the reporting of the code by you internally and it lets you document for the billing side of the practice that they were there and a code report has been performed and not simply forgotten.
Final Thoughts
Following this discussion of global periods and CPT code 99024, you may be wondering why you get paid what you do and how the visits all link together. The buzzword is intensity, and we will explore that concept and IWPUT (intraservice work per unit of time), which I have coined as meaning “I Will Persevere Until Then,” in the next column.
- Revisions to Payment Policies under the Physician Fee Schedule and Other Revisions to Part B for CY 2016. Addendum B—Relative Value Units and Related Information Used in CY 2016 Final Rule. Centers for Medicare & Medicaid Services website. https://www.cms.gov/Medicare/Medicare-Fee-for-Service-Payment/PhysicianFeeSched?Downloads?CY2016-PFS-FC-Addenda.zip. Updated November 5, 2015. Accessed June 1, 2016.
- Modifier 59 article. Centers for Medicare & Medicaid Services website. https://www.cms.gov/Medicare/Coding/NationalCorrectCodInitEd/downloads/modifier59.pdf. Accessed June 20, 2016.
- Modifier dictionary FAQ. American College of Emergency Physicians website. https://www.acep.org/Physician-Resources/Practice-Resources/Administration/Financial-Issues-/-Reimbursement/Modifier-Dictionary-FAQ/. Updated April 2014. Accessed June 2, 2016.
- Modifier 78 fact sheet. Wisconsin Physicians Service Insurance Corporation website. http://wpsmedicare.com/j8macpartb/resources/modifiers/modifier-78.shtml. Accessed June 2, 2016.
- Medicare Access and CHIP Reauthorization Act of 2015, HR 2, 114th Cong, 1st Sess (2015).
- Medicare Learning Network. Collecting data on global surgery as required by MACRA: listening session. Centers for Medicare & Medicaid Services website. https://www.cms.gov/Outreach-and-Education/Outreach/NPC/Downloads/2016-01-20-MACRA-Transcript.pdf. Posted January 20, 2016. Accessed June 2, 2016.
Practice Points
- Global period refers to payment for performance of a procedure and can be either 0 (000), 10 (010), or 90 (090) days. Most codes used by dermatologists fall under global periods of 0 and 10 days.
- Modifiers can be used if you perform other activities on the same day as the procedure or during the global period if those other activities are unrelated.
- Current Procedural Terminology code 99024 allows you to document for the billing side of the practice that the patient was there for a postoperative visit and may be a useful way to let payers know the visit occurred.

Pediatric Rosacea
Rosacea is a chronic skin disease characterized by flushing, erythema, telangiectasia, papules, and pustules in the central face region.1 It most often affects middle-aged women (age range, 30–50 years).2 Rosacea is rare in the pediatric population, especially before puberty.3 There are 3 subtypes of pediatric rosacea: vascular, papulopustular, and ocular. Phymatous/rhinophymatous rosacea is only seen in the adult population.3 Recommendations for the management of pediatric rosacea heavily rely on data from retrospective chart reviews and case series.
Etiology of Pediatric Rosacea
Rosacea is thought to be a consequence of vasomotor instability in both adults and children. A family history of rosacea is sometimes reported in patients with pediatric rosacea.4 Patients often are sensitive to heat, sunlight, topical corticosteroids, spicy foods, hot liquids, and certain soaps and cleansers.1,3,4 In a review of the literature by Vemuri et al,5 the various reported triggers of rosacea include harsh climates that damage the blood vessels and dermal connective tissue, defects in the endothelium and dermal matrix, perivascular inflammation, orally ingested chemicals, changes in the flora of the hair follicles, excessive antimicrobial peptides, and the presence of free radicals. Overall, it is unclear which of these factors are triggers of pediatric rosacea.
The molecular basis of rosacea has been elucidated. It is well known that rosacea patients have higher levels of cathelicidins in the facial skin. Furthermore, they appear to have different processed forms of cathelicidin peptides compared to adults without rosacea, possibly due to changes in posttranslational processing.6 One such peptide, cathelicidin LL-37, also has been implicated in atopic dermatitis7 and psoriasis.8 Its role in rosacea appears to be multifaceted. Cathelicidin LL-37 helps to attract neutrophils, monocytes, and T lymphocytes, and also has antimicrobial properties; therefore, it plays a role in both the innate and adaptive immune systems.9 Cathelicidin LL-37 also has been implicated in inducing angiogenesis10 and suppressing dermal fibroblasts.11
Muto et al12 found that there is an increased number of mast cells in the dermis of patients with rosacea. Mast cells contribute to vasodilation, angiogenesis, and the recruitment of other inflammatory cells.12 Importantly, human mast cells are a source of cathelicidins including cathelicidin LL-37; these proteins play a vital role in the antimicrobial capabilities of mast cells.13
Clinical Presentation and Comorbidities
Vascular rosacea presents with characteristic flushing and erythema, which lasts more than a few minutes as compared to physiologic erythema,1 and sometimes telangiectasia is seen.3 The cheeks, chin, and nasolabial folds are most commonly involved.2 In papulopustular rosacea, papules and pustules are seen overlying the erythema.1,3 Open and closed comedones also have been documented in case reports but are not commonly seen.2 Pediatric rosacea often begins with flushing of the face and then progresses to the development of papules and pustules.4
Ocular rosacea can occur with or without cutaneous findings. In a retrospective study of 20 pediatric patients (aged 1–15 years), 11 (55%) patients had both ocular and cutaneous rosacea, 3 (15%) only had ocular symptoms, and 6 (30%) only had cutaneous symptoms. The most common form of rosacea in this study was papulopustular rosacea.14 Ocular symptoms often are bilateral15 and can include blepharitis, conjunctival injection, recurrent chalazion, conjunctivitis,2 and less commonly corneal ulceration and scarring.16 Patients also may report photophobia or a foreign body sensation.17 Importantly, ocular symptoms often precede the cutaneous symptoms and can delay the diagnosis of rosacea,14,16,18 as these symptoms often are misdiagnosed as viral or bacterial infections.15 Fortunately, ocular disease responds well to treatment if diagnosed early.
Weston and Morelli19 conducted a retrospective study of 106 children (46 males; 60 females) 13 years and younger with steroid rosacea; 29 children were younger than 3 years. A family history of rosacea was present in 20% of participants, and prior use of class 7 steroids was reported in 54%, whereas only 3% had used class 1 topical steroids. Ninety-eight participants had perinasal involvement, 94 had perioral involvement, and 44 had periorbital involvement of the lower eyelids.19
Rosacea fulminans (also known as pyoderma faciale) is a rare acute-onset eruption typically found in young women in their 20s and 30s.20 Rosacea fulminans is characterized by papules, pustules, nodules, cysts, draining sinuses, communicating sinus tracts, and less commonly comedones.20,21 The skin can appear erythematous, cyanotic, or dull red.21 Most of the lesions are found on the face, particularly on the forehead, cheeks, nose, and chin,21 but lesions on the chest and back have been documented in adult patients.20 In an examination of prior case series, most patients were otherwise healthy. There are case reports documenting rosacea fulminans in teenagers,20 but the youngest patient recorded was an otherwise healthy 3-year-old girl who developed a sudden onset of erythematous papules, pustules, cysts, and purulent discharging sinuses on the cheeks that spread to the chin, perioral, and paranasal areas.21
Differential Diagnosis
Rosacea is rare in children, so other papulopustular disorders must be ruled out, including acne vulgaris, periorificial/perioral dermatitis, sarcoidosis, systemic lupus erythematosus, steroid-induced rosacea, ataxia telangiectasia, and demodicosis.
Acne vulgaris commonly presents in older adolescents and teenagers with open and closed comedones, inflammatory papules, and pustules.2 Intense facial flushing and telangiectasia usually is not seen.
In perioral dermatitis, skin lesions often are clustered around the mouth, nose, and eyes. Typically there are no telangiectases or ocular complications.3 Facial flushing and telangiectases are uncommon, except in steroid-induced perioral dermatitis.2
The cutaneous findings of sarcoidosis include red-brown papules on the face and lips, and patients also may have ocular involvement such as uveitis and iritis.3 However, there are typically other systemic findings such as pulmonary symptoms, weight loss, fatigue, lethargy, fever, and erythema nodosum.2,3 Chest radiograph findings (eg, bilateral hilar lym-phadenopathy), ophthalmologic examination, and laboratory data (eg, elevated alkaline phosphate and/or elevated angiotensin-converting enzyme) can help confirm or rule out the diagnosis of sarcoidosis.2,3
Unlike systemic lupus erythematosus, patients with rosacea will have involvement of sun-protected areas of the skin. Patients with systemic lupus erythematosus typically report arthralgia and severe photosensitivity and will have elevated antinuclear antibody titers. Skin biopsies and immunofluorescence can help confirm the diagnosis.3 Importantly, some patients with rosacea will have a positive lupus band test.22,23
Steroid-induced rosacea typically occurs 2 weeks after discontinuing therapy with topical fluorinated glucocorticosteroids.24 Children present with monomorphic papules, pustules, and telangiectases4 on the eyelids and lateral face as opposed to the central face regions.24
Ataxia telangiectasia can present with telangiectases, skin atrophy, café au lait spots, and premature graying.25 A 15-year-old adolescent girl with ataxia telangiectasia presented with granulomatous acne rosacea that improved after 4 weeks of treatment with isotretinoin 0.5 mg/kg daily. The lesions cleared almost completely after 5 months.25
Demodicosis is a disorder of the pilosebaceous units caused by the human Demodex mite.26 It typically involves the periorificial regions in adults and the elderly population. Patients can present with fine, white-yellow, scaly changes of the sebaceous hair follicles, with minimal erythema and inflammation. Papules and pustules also can be present.26
Diagnosis and Histopathology
Because rosacea is rare in children, it is important to thoroughly evaluate other possible diagnoses. The diagnosis of pediatric rosacea is clinical and biopsies are rarely performed. Laboratory tests such as cultures generally are not useful.
Marks and Harcourt-Webster27 reviewed the biopsies of 108 adult patients with rosacea. The biopsies of patients with predominantly erythema and telangiectasia showed evidence of vascular dilatation with a perivascular infiltrate composed predominantly of lymphocytes and 39 specimens that were compared to controls showed more solar elastosis. Biopsies of papular rosacea contained inflammatory infiltrates in the upper and mid dermis composed primarily of lymphocytes and histiocytes. In some patients, neutrophils, plasma cells, and giant cells also were observed. Hair follicle abnormalities were present in 20% of the biopsies, with 19% showing evidence of the Demodex mite. Vascular dilatation also was common. Overall, common findings included lymphohistiocytic infiltrates around the blood vessels of the upper dermis, dilated vessels, edema, elastosis, and disorganization of connective tissue in the upper dermis.
Helm et al28 reviewed histopathologic patterns from 53 patients with granulomatous rosacea. Findings included a mixed lymphohistiocytic infiltrate (predominantly lymphocytic in 40% of patients and predominantly histiocytic with occasional giant cells in 34% of patients), epithelioid granulomas (11% of patients), and epithelioid granulomas with caseation necrosis (11% of patients).
The histopathology of rosacea fulminans is characterized by dense perivascular and periadnexal infiltrates composed of granulocytes, eosinophils, and epithelioid granulomas, as well as panniculitis.20
Treatment and Clinical Outcomes
Certain lifestyle recommendations are integral components of disease management, including avoidance of triggers such as extreme temperatures, hot drinks, spicy food, and topical agents that could be irritating (especially topical corticosteroids).29 Patients should be advised to use daily sunscreen containing physical blockers such as titanium dioxide or zinc oxide. Teenagers should avoid the use of cosmetics and makeup, especially products containing sodium lauryl sulfate, menthol, and camphor. Daily use of emollients can help some patients.29
There are both topical and systemic therapies available for pediatric rosacea; however, most of the data are based on the use of these treatments in the adult population. Patients with mild to moderate disease often can be managed using topical agents. Metronidazole (0.75% cream, 1% gel, or 0.75% lotion) has been studied extensively in adult patients, and when used once daily for 12 weeks, it has been able to control moderate to severe disease.30,31 In one study conducted in adult patients, topical metronidazole was able to maintain remission in adults who had previously been treated with a combination of oral tetracycline and metronidazole gel.31 Sodium sulfacetamide 10%–sulfur 5% (cleanser or lotion) has been successful in adult patients and often is used in combination with other therapies such as topical metronidazole.32-34 Azelaic acid cream 20%,35 benzoyl peroxide (wash or gel),29 topical clindamycin,36 topical erythromycin,29,37 tacrolimus ointment 0.1%,38 and tretinoin cream also have been studied in adults.3,39 Several of these topical agents can cause irritation on application (eg, metronidazole, sulfur-based agents, azelaic acid, benzoyl peroxide, erythromycin, tretinoin).3
The use of systemic treatments in pediatric patients is heavily based on case reports and case series.2,14,16,40 Therapies have included tetracycline (500 mg twice daily tapered to 250 mg daily),29 minocycline (50–100 mg twice daily), doxycycline (50–100 mg twice daily or 4 times daily), erythromycin (30–50 mg/kg daily), clarithromycin (15 mg/kg twice daily for 4 weeks and then daily for 4 weeks), and azithromycin (5–10 mg/kg daily).3 Tetracycline antibiotics should not be used in children 8 years or younger.
In a case series by Drolet and Paller,2 an 11-year-old girl was treated with tetracycline 500 mg (later tapered to 250 mg daily) and metronidazole gel 0.75%, both used twice daily. Previously, she had not responded to topical steroids, tretinoin cream 0.05%, benzoyl peroxide 5%, or systemic prednisone. After 6 weeks of treatment, the pustules and chalazion had resolved and she had only minimal erythema of the skin and conjunctiva. Sixteen months after the start of treatment, a regimen of tetracycline 250 mg daily and metronidazole gel resulted in disease clearance on the face.2
A 9-year-old girl with concurrent systemic lupus erythematosus was treated with tetracycline 250 mg and topical erythromycin 2%, both used twice daily.2 After 4 weeks her face was clear. Four months later she developed new telangiectases and topical erythromycin was replaced with topical metronidazole. Eventually the dose of tetracycline was reduced to 250 mg daily.2
An 11-year-old boy with likely granulomatous rosacea was treated with erythromycin 250 mg 4 times daily, alclometasone dipropionate cream 0.05% twice daily, and topical clindamycin twice daily.2 Marked improvement was noticed after 3 weeks of treatment. Metronidazole gel 0.75% was added and 3 months later the patient’s face was clear, without evidence of scarring. The dose of erythromycin was later reduced to 500 mg daily, and eventually the patient experienced clearance with the use of metronidazole gel daily.2
In another case series, 4 female patients (age range, 4–12 years) were treated with systemic erythromycin 20 mg/kg daily (ocular involvement only) or doxycycline 2.2 mg/kg daily used in two 12-year-old patients with ocular and cutaneous involvement for at least 12 months. All 4 patients showed considerable improvement within 1 month and remained free of disease throughout a mean follow-up period of 25.5 months.40
As evidenced by these case reports, there is a wide array of treatments that have been used for pediatric rosacea. Although there are no formal evidence-based guidelines, there are certain considerations that must be taken into account when choosing treatment plans. Doxycycline and minocycline are known to cause less gastrointestinal upset than tetracycline with similar efficacy.41 Importantly, the tetracyclines are contraindicated in children younger than 9 years, as they can cause teeth staining and possibly affect skeletal growth.3,4 When used in older children (age range, 9–12 years), patients must be advised not to take their medication with calcium or antacids.3 Clarithromycin and azithromycin tend to have fewer gastrointestinal side effects than erythromycin. Erythromycin and other macrolides can be used in children of all ages and in patients who are allergic to tetracyclines.3
Children with mild ocular symptoms often can control their disease with bacitracin and topical ocular antibiotics such as erythromycin.2,15 For patients who require systemic antibiotics, various tetracyclines and macrolides have been used with success.2,14-16,40
Adults with rosacea fulminans can require treatment with isotretinoin, oral antibiotics, and topical or even systemic corticosteroids.42 The 3-year-old girl with rosacea fulminans initially was treated with oral erythromycin (250 mg 4 times daily), oral prednisolone (0.5 mg/kg daily tapered over 2 weeks), fluocinolone acetonide cream 0.025%, and warm compresses with only moderate improvement.21 She was then started on oral isotretinoin (0.75 mg/kg daily) and within 4 weeks marked improvement was noted. After 8 weeks, the lesions had disappeared completely with only a few pitted scars remaining. Isotretinoin was continued for 24 weeks. One year after completion of treatment, she was still disease free.21
Weston and Morelli19 recommended the following treatment regimen for children with steroid rosacea: abrupt cessation of topical steroid use (as opposed to gradual withdrawal) and initiation of oral erythromycin stearate (30 mg/kg daily) in 2 daily doses for 4 weeks. Children who were unable to tolerate erythromycin (n=6) were told to use topical clindamycin phosphate twice daily for 4 weeks. Within 3 weeks 22% of patients had resolution, while 86% had resolution within 4 weeks. All of the patients cleared within 8 weeks. Importantly, there was no significant difference in duration of time until clearance between children who used the oral antibiotic or topical antibiotic.19
Conclusion
We know that the skin of rosacea patients contains higher levels of cathelicidins, which have been implicated in amplifying and contributing to the inflammatory response in several ways. Mast cells, which are a source of cathelicidins, also are increased in the skin of these patients. Children can present with vascular rosacea (characterized by flushing, erythema, and/or telangiectasia), papulopustular rosacea, or ocular rosacea. Common ocular symptoms include blepharitis, conjunctivitis, and recurrent chalazion. It is important to refer pediatric rosacea patients with ocular symptoms to an ophthalmologist to prevent ocular sequelae.
Rosacea is a clinical diagnosis but biopsy can be performed to rule out other diagnoses. Treatment consists of lifestyle modifications such as avoiding known triggers and the use of topical and/or oral agents. Common topical therapies include metronidazole and erythromycin. Systemic antibiotics include tetracycline, doxycycline, minocycline, azithromycin, and erythromycin. Some children are able to taper systemic agents and maintain disease control with topical therapy, while others may need to continue a low-dose antibiotic. Although flares can be controlled within weeks to months, rosacea is a chronic disorder and childhood rosacea tends to persist into adulthood.
- Crawford GH, Pelle MT, James WD. Rosacea: i. etiology, pathogenesis, and subtype classification. J Am Acad Dermatol. 2004;51:327-341; quiz 342-324.
- Drolet B, Paller AS. Childhood rosacea. Pediatr Dermatol. 1992;9:22-26.
- Kroshinsky D, Glick SA. Pediatric rosacea. Dermatol Ther. 2006;19:196-201.
- Lacz NL, Schwartz RA. Rosacea in the pediatric population. Cutis. 2004;74:99-103.
- Vemuri RC, Gundamaraju R, Sekaran SD, et al. Major pathophysiological correlations of rosacea: a complete clinical appraisal. Int J Med Sci. 2015;12:387-396.
- Yamasaki K, Di Nardo A, Bardan A, et al. Increased serine protease activity and cathelicidin promotes skin inflammation in rosacea. Nat Med. 2007;13:975-980.
- Ong PY, Ohtake T, Brandt C, et al. Endogenous antimicrobial peptides and skin infections in atopic dermatitis. N Engl J Med. 2002;347:1151-1160.
- Lande R, Gregorio J, Facchinetti V, et al. Plasmacytoid dendritic cells sense self-DNA coupled with antimicrobial peptide. Nature. 2007;449:564-569.
- De Y, Chen Q, Schmidt AP, et al. LL-37, the neutrophil granule- and epithelial cell-derived cathelicidin, utilizes formyl peptide receptor-like 1 (FPRL1) as a receptor to chemoattract human peripheral blood neutrophils, monocytes, and T cells. J Exp Med. 2000;192:1069-1074.
- Koczulla R, von Degenfeld G, Kupatt C, et al. An angiogenic role for the human peptide antibiotic LL-37/hCAP-18. J Clin Invest. 2003;111:1665-1672.
- Park HJ, Cho DH, Kim HJ, et al. Collagen synthesis is suppressed in dermal fibroblasts by the human antimicrobial peptide LL-37. J Invest Dermatol. 2009;129:843-850.
- Muto Y, Wang Z, Vanderberghe M, et al. Mast cells are key mediators of cathelicidin-initiated skin inflammation in rosacea. J Invest Dermatol. 2014;134:2728-2736.
- Di Nardo A, Vitiello A, Gallo RL. Cutting edge: mast cell antimicrobial activity is mediated by expression of cathelicidin antimicrobial peptide. J Immunol. 2003;170:2274-2278.
- Leoni S, Mesplie N, Aitali F, et al. Metronidazole: alternative treatment for ocular and cutaneous rosacea in the pediatric population [in French]. J Fr Ophthalmol. 2011;34:703-710.
- Nazir SA, Murphy S, Siatkowski RM, et al. Ocular rosacea in childhood. Am J Ophthalmol. 2004;137:138-144.
- Miguel AI, Salgado MB, Lisboa MS, et al. Pediatric ocular rosacea: 2 cases. Eur J Ophthalmol. 2012;22:664-666.
- Stone DU, Chodosh J. Ocular rosacea: an update on pathogenesis and therapy. Curr Opin Ophthalmol. 2004;15:499-502.
- Mavrakanas N, Schutz JS, Dosso AA. Pediatric ocular rosacea [published online March 22, 2010]. J Pediatr Ophthalmol Strabismus. 2010;47:117-120.
- Weston WL, Morelli JG. Steroid rosacea in prepubertal children. Arch Pediatr Adolesc Med. 2000;154:62-64.
- Plewig G, Jansen T, Kligman AM. Pyoderma faciale. a review and report of 20 additional cases: is it rosacea? Arch Dermatol. 1992;128:1611-1617.
- Firooz A, Firoozabadi MR, Dowlati Y. Rosacea fulminans (pyoderma faciale): successful treatment of a 3-year-old girl with oral isotretinoin. Int J Dermatol. 2001;40:203-205.
- Baart de la Faille H, Baart de la F-K. Immunofluorescent studies of the skin in rosacea. Dermatologica. 1969;139:49-54.
- Wilkin JK. Rosacea. Int J Dermatol. 1983;22:393-400.
- Franco HL, Weston WL. Steroid rosacea in children. Pediatrics. 1979;64:36-38.
- Cantarutti N, Claps A, Angelino G, et al. Multi-drugs resistant acne rosacea in a child affected by ataxia-telangiectasia: successful treatment with isotretinoin. Ital J Pediatr. 2015;41:23.
- Chen W, Plewig G. Human demodicosis: revisit and a proposed classification. Br J Dermatol. 2014;170:1219-1225.
- Marks R, Harcourt-Webster J. Histopathology of rosacea. Arch Dermatol. 1969;100:683-691.
- Helm KF, Menz J, Gibson LE, et al. A clinical and histopathologic study of granulomatous rosacea. J Am Acad Dermatol. 1991;25(6, pt 1):1038-1043.
- Pelle MT, Crawford GH, James WD. Rosacea: II. therapy. J Am Acad Dermatol. 2004;51:499-512; quiz 513-494.
- Dahl MV, Jarratt M, Kaplan D, et al. Once-daily topical metronidazole cream formulations in the treatment of the papules and pustules of rosacea. J Am Acad Dermatol. 2001;45:723-730.
- Dahl MV, Katz HI, Krueger GG, et al. Topical metronidazole maintains remissions of rosacea. Arch Dermatol. 1998;134:679-683.
- Trumbore MW, Goldstein JA, Gurge RM. Treatment of papulopustular rosacea with sodium sulfacetamide 10%/sulfur 5% emollient foam. J Drugs Dermatol. 2009;8:299-304.
- Del Rosso JQ. Evaluating the role of topical therapies in the management of rosacea: focus on combination sodium sulfacetamide and sulfur formulations. Cutis. 2004;73(1 suppl):29-33.
- Del Rosso JQ. A status report on the medical management of rosacea: focus on topical therapies. Cutis. 2002;70:271-275.
- Maddin S. A comparison of topical azelaic acid 20% cream and topical metronidazole 0.75% cream in the treatment of patients with papulopustular rosacea. J Am Acad Dermatol. 1999;40(6, pt 1):961-965.
- Wilkin JK, DeWitt S. Treatment of rosacea: topical clindamycin versus oral tetracycline. Int J Dermatol. 1993;32:65-67.
- Mills OH Jr, Kligman AM. Letter: topically applied erythromycin in rosacea. Arch Dermatol. 1976;112:553-554.
- Hengge UR. Off-label indications for topical tacrolimus [in German]. Hautarzt. 2013;64:752-756.
- Ertl GA, Levine N, Kligman AM. A comparison of the efficacy of topical tretinoin and low-dose oral isotretinoin in rosacea. Arch Dermatol. 1994;130:319-324.
- Cetinkaya A, Akova YA. Pediatric ocular acne rosacea: long-term treatment with systemic antibiotics. Am J Ophthalmol. 2006;142:816-821.
- Maibach H. Second-generation tetracyclines, a dermatologic overview: clinical uses and pharmacology. Cutis. 1991;48:411-417.
- Jansen T, Plewig G, Kligman AM. Diagnosis and treatment of rosacea fulminans. Dermatology. 1994;188:251-254.
Rosacea is a chronic skin disease characterized by flushing, erythema, telangiectasia, papules, and pustules in the central face region.1 It most often affects middle-aged women (age range, 30–50 years).2 Rosacea is rare in the pediatric population, especially before puberty.3 There are 3 subtypes of pediatric rosacea: vascular, papulopustular, and ocular. Phymatous/rhinophymatous rosacea is only seen in the adult population.3 Recommendations for the management of pediatric rosacea heavily rely on data from retrospective chart reviews and case series.
Etiology of Pediatric Rosacea
Rosacea is thought to be a consequence of vasomotor instability in both adults and children. A family history of rosacea is sometimes reported in patients with pediatric rosacea.4 Patients often are sensitive to heat, sunlight, topical corticosteroids, spicy foods, hot liquids, and certain soaps and cleansers.1,3,4 In a review of the literature by Vemuri et al,5 the various reported triggers of rosacea include harsh climates that damage the blood vessels and dermal connective tissue, defects in the endothelium and dermal matrix, perivascular inflammation, orally ingested chemicals, changes in the flora of the hair follicles, excessive antimicrobial peptides, and the presence of free radicals. Overall, it is unclear which of these factors are triggers of pediatric rosacea.
The molecular basis of rosacea has been elucidated. It is well known that rosacea patients have higher levels of cathelicidins in the facial skin. Furthermore, they appear to have different processed forms of cathelicidin peptides compared to adults without rosacea, possibly due to changes in posttranslational processing.6 One such peptide, cathelicidin LL-37, also has been implicated in atopic dermatitis7 and psoriasis.8 Its role in rosacea appears to be multifaceted. Cathelicidin LL-37 helps to attract neutrophils, monocytes, and T lymphocytes, and also has antimicrobial properties; therefore, it plays a role in both the innate and adaptive immune systems.9 Cathelicidin LL-37 also has been implicated in inducing angiogenesis10 and suppressing dermal fibroblasts.11
Muto et al12 found that there is an increased number of mast cells in the dermis of patients with rosacea. Mast cells contribute to vasodilation, angiogenesis, and the recruitment of other inflammatory cells.12 Importantly, human mast cells are a source of cathelicidins including cathelicidin LL-37; these proteins play a vital role in the antimicrobial capabilities of mast cells.13
Clinical Presentation and Comorbidities
Vascular rosacea presents with characteristic flushing and erythema, which lasts more than a few minutes as compared to physiologic erythema,1 and sometimes telangiectasia is seen.3 The cheeks, chin, and nasolabial folds are most commonly involved.2 In papulopustular rosacea, papules and pustules are seen overlying the erythema.1,3 Open and closed comedones also have been documented in case reports but are not commonly seen.2 Pediatric rosacea often begins with flushing of the face and then progresses to the development of papules and pustules.4
Ocular rosacea can occur with or without cutaneous findings. In a retrospective study of 20 pediatric patients (aged 1–15 years), 11 (55%) patients had both ocular and cutaneous rosacea, 3 (15%) only had ocular symptoms, and 6 (30%) only had cutaneous symptoms. The most common form of rosacea in this study was papulopustular rosacea.14 Ocular symptoms often are bilateral15 and can include blepharitis, conjunctival injection, recurrent chalazion, conjunctivitis,2 and less commonly corneal ulceration and scarring.16 Patients also may report photophobia or a foreign body sensation.17 Importantly, ocular symptoms often precede the cutaneous symptoms and can delay the diagnosis of rosacea,14,16,18 as these symptoms often are misdiagnosed as viral or bacterial infections.15 Fortunately, ocular disease responds well to treatment if diagnosed early.
Weston and Morelli19 conducted a retrospective study of 106 children (46 males; 60 females) 13 years and younger with steroid rosacea; 29 children were younger than 3 years. A family history of rosacea was present in 20% of participants, and prior use of class 7 steroids was reported in 54%, whereas only 3% had used class 1 topical steroids. Ninety-eight participants had perinasal involvement, 94 had perioral involvement, and 44 had periorbital involvement of the lower eyelids.19
Rosacea fulminans (also known as pyoderma faciale) is a rare acute-onset eruption typically found in young women in their 20s and 30s.20 Rosacea fulminans is characterized by papules, pustules, nodules, cysts, draining sinuses, communicating sinus tracts, and less commonly comedones.20,21 The skin can appear erythematous, cyanotic, or dull red.21 Most of the lesions are found on the face, particularly on the forehead, cheeks, nose, and chin,21 but lesions on the chest and back have been documented in adult patients.20 In an examination of prior case series, most patients were otherwise healthy. There are case reports documenting rosacea fulminans in teenagers,20 but the youngest patient recorded was an otherwise healthy 3-year-old girl who developed a sudden onset of erythematous papules, pustules, cysts, and purulent discharging sinuses on the cheeks that spread to the chin, perioral, and paranasal areas.21
Differential Diagnosis
Rosacea is rare in children, so other papulopustular disorders must be ruled out, including acne vulgaris, periorificial/perioral dermatitis, sarcoidosis, systemic lupus erythematosus, steroid-induced rosacea, ataxia telangiectasia, and demodicosis.
Acne vulgaris commonly presents in older adolescents and teenagers with open and closed comedones, inflammatory papules, and pustules.2 Intense facial flushing and telangiectasia usually is not seen.
In perioral dermatitis, skin lesions often are clustered around the mouth, nose, and eyes. Typically there are no telangiectases or ocular complications.3 Facial flushing and telangiectases are uncommon, except in steroid-induced perioral dermatitis.2
The cutaneous findings of sarcoidosis include red-brown papules on the face and lips, and patients also may have ocular involvement such as uveitis and iritis.3 However, there are typically other systemic findings such as pulmonary symptoms, weight loss, fatigue, lethargy, fever, and erythema nodosum.2,3 Chest radiograph findings (eg, bilateral hilar lym-phadenopathy), ophthalmologic examination, and laboratory data (eg, elevated alkaline phosphate and/or elevated angiotensin-converting enzyme) can help confirm or rule out the diagnosis of sarcoidosis.2,3
Unlike systemic lupus erythematosus, patients with rosacea will have involvement of sun-protected areas of the skin. Patients with systemic lupus erythematosus typically report arthralgia and severe photosensitivity and will have elevated antinuclear antibody titers. Skin biopsies and immunofluorescence can help confirm the diagnosis.3 Importantly, some patients with rosacea will have a positive lupus band test.22,23
Steroid-induced rosacea typically occurs 2 weeks after discontinuing therapy with topical fluorinated glucocorticosteroids.24 Children present with monomorphic papules, pustules, and telangiectases4 on the eyelids and lateral face as opposed to the central face regions.24
Ataxia telangiectasia can present with telangiectases, skin atrophy, café au lait spots, and premature graying.25 A 15-year-old adolescent girl with ataxia telangiectasia presented with granulomatous acne rosacea that improved after 4 weeks of treatment with isotretinoin 0.5 mg/kg daily. The lesions cleared almost completely after 5 months.25
Demodicosis is a disorder of the pilosebaceous units caused by the human Demodex mite.26 It typically involves the periorificial regions in adults and the elderly population. Patients can present with fine, white-yellow, scaly changes of the sebaceous hair follicles, with minimal erythema and inflammation. Papules and pustules also can be present.26
Diagnosis and Histopathology
Because rosacea is rare in children, it is important to thoroughly evaluate other possible diagnoses. The diagnosis of pediatric rosacea is clinical and biopsies are rarely performed. Laboratory tests such as cultures generally are not useful.
Marks and Harcourt-Webster27 reviewed the biopsies of 108 adult patients with rosacea. The biopsies of patients with predominantly erythema and telangiectasia showed evidence of vascular dilatation with a perivascular infiltrate composed predominantly of lymphocytes and 39 specimens that were compared to controls showed more solar elastosis. Biopsies of papular rosacea contained inflammatory infiltrates in the upper and mid dermis composed primarily of lymphocytes and histiocytes. In some patients, neutrophils, plasma cells, and giant cells also were observed. Hair follicle abnormalities were present in 20% of the biopsies, with 19% showing evidence of the Demodex mite. Vascular dilatation also was common. Overall, common findings included lymphohistiocytic infiltrates around the blood vessels of the upper dermis, dilated vessels, edema, elastosis, and disorganization of connective tissue in the upper dermis.
Helm et al28 reviewed histopathologic patterns from 53 patients with granulomatous rosacea. Findings included a mixed lymphohistiocytic infiltrate (predominantly lymphocytic in 40% of patients and predominantly histiocytic with occasional giant cells in 34% of patients), epithelioid granulomas (11% of patients), and epithelioid granulomas with caseation necrosis (11% of patients).
The histopathology of rosacea fulminans is characterized by dense perivascular and periadnexal infiltrates composed of granulocytes, eosinophils, and epithelioid granulomas, as well as panniculitis.20
Treatment and Clinical Outcomes
Certain lifestyle recommendations are integral components of disease management, including avoidance of triggers such as extreme temperatures, hot drinks, spicy food, and topical agents that could be irritating (especially topical corticosteroids).29 Patients should be advised to use daily sunscreen containing physical blockers such as titanium dioxide or zinc oxide. Teenagers should avoid the use of cosmetics and makeup, especially products containing sodium lauryl sulfate, menthol, and camphor. Daily use of emollients can help some patients.29
There are both topical and systemic therapies available for pediatric rosacea; however, most of the data are based on the use of these treatments in the adult population. Patients with mild to moderate disease often can be managed using topical agents. Metronidazole (0.75% cream, 1% gel, or 0.75% lotion) has been studied extensively in adult patients, and when used once daily for 12 weeks, it has been able to control moderate to severe disease.30,31 In one study conducted in adult patients, topical metronidazole was able to maintain remission in adults who had previously been treated with a combination of oral tetracycline and metronidazole gel.31 Sodium sulfacetamide 10%–sulfur 5% (cleanser or lotion) has been successful in adult patients and often is used in combination with other therapies such as topical metronidazole.32-34 Azelaic acid cream 20%,35 benzoyl peroxide (wash or gel),29 topical clindamycin,36 topical erythromycin,29,37 tacrolimus ointment 0.1%,38 and tretinoin cream also have been studied in adults.3,39 Several of these topical agents can cause irritation on application (eg, metronidazole, sulfur-based agents, azelaic acid, benzoyl peroxide, erythromycin, tretinoin).3
The use of systemic treatments in pediatric patients is heavily based on case reports and case series.2,14,16,40 Therapies have included tetracycline (500 mg twice daily tapered to 250 mg daily),29 minocycline (50–100 mg twice daily), doxycycline (50–100 mg twice daily or 4 times daily), erythromycin (30–50 mg/kg daily), clarithromycin (15 mg/kg twice daily for 4 weeks and then daily for 4 weeks), and azithromycin (5–10 mg/kg daily).3 Tetracycline antibiotics should not be used in children 8 years or younger.
In a case series by Drolet and Paller,2 an 11-year-old girl was treated with tetracycline 500 mg (later tapered to 250 mg daily) and metronidazole gel 0.75%, both used twice daily. Previously, she had not responded to topical steroids, tretinoin cream 0.05%, benzoyl peroxide 5%, or systemic prednisone. After 6 weeks of treatment, the pustules and chalazion had resolved and she had only minimal erythema of the skin and conjunctiva. Sixteen months after the start of treatment, a regimen of tetracycline 250 mg daily and metronidazole gel resulted in disease clearance on the face.2
A 9-year-old girl with concurrent systemic lupus erythematosus was treated with tetracycline 250 mg and topical erythromycin 2%, both used twice daily.2 After 4 weeks her face was clear. Four months later she developed new telangiectases and topical erythromycin was replaced with topical metronidazole. Eventually the dose of tetracycline was reduced to 250 mg daily.2
An 11-year-old boy with likely granulomatous rosacea was treated with erythromycin 250 mg 4 times daily, alclometasone dipropionate cream 0.05% twice daily, and topical clindamycin twice daily.2 Marked improvement was noticed after 3 weeks of treatment. Metronidazole gel 0.75% was added and 3 months later the patient’s face was clear, without evidence of scarring. The dose of erythromycin was later reduced to 500 mg daily, and eventually the patient experienced clearance with the use of metronidazole gel daily.2
In another case series, 4 female patients (age range, 4–12 years) were treated with systemic erythromycin 20 mg/kg daily (ocular involvement only) or doxycycline 2.2 mg/kg daily used in two 12-year-old patients with ocular and cutaneous involvement for at least 12 months. All 4 patients showed considerable improvement within 1 month and remained free of disease throughout a mean follow-up period of 25.5 months.40
As evidenced by these case reports, there is a wide array of treatments that have been used for pediatric rosacea. Although there are no formal evidence-based guidelines, there are certain considerations that must be taken into account when choosing treatment plans. Doxycycline and minocycline are known to cause less gastrointestinal upset than tetracycline with similar efficacy.41 Importantly, the tetracyclines are contraindicated in children younger than 9 years, as they can cause teeth staining and possibly affect skeletal growth.3,4 When used in older children (age range, 9–12 years), patients must be advised not to take their medication with calcium or antacids.3 Clarithromycin and azithromycin tend to have fewer gastrointestinal side effects than erythromycin. Erythromycin and other macrolides can be used in children of all ages and in patients who are allergic to tetracyclines.3
Children with mild ocular symptoms often can control their disease with bacitracin and topical ocular antibiotics such as erythromycin.2,15 For patients who require systemic antibiotics, various tetracyclines and macrolides have been used with success.2,14-16,40
Adults with rosacea fulminans can require treatment with isotretinoin, oral antibiotics, and topical or even systemic corticosteroids.42 The 3-year-old girl with rosacea fulminans initially was treated with oral erythromycin (250 mg 4 times daily), oral prednisolone (0.5 mg/kg daily tapered over 2 weeks), fluocinolone acetonide cream 0.025%, and warm compresses with only moderate improvement.21 She was then started on oral isotretinoin (0.75 mg/kg daily) and within 4 weeks marked improvement was noted. After 8 weeks, the lesions had disappeared completely with only a few pitted scars remaining. Isotretinoin was continued for 24 weeks. One year after completion of treatment, she was still disease free.21
Weston and Morelli19 recommended the following treatment regimen for children with steroid rosacea: abrupt cessation of topical steroid use (as opposed to gradual withdrawal) and initiation of oral erythromycin stearate (30 mg/kg daily) in 2 daily doses for 4 weeks. Children who were unable to tolerate erythromycin (n=6) were told to use topical clindamycin phosphate twice daily for 4 weeks. Within 3 weeks 22% of patients had resolution, while 86% had resolution within 4 weeks. All of the patients cleared within 8 weeks. Importantly, there was no significant difference in duration of time until clearance between children who used the oral antibiotic or topical antibiotic.19
Conclusion
We know that the skin of rosacea patients contains higher levels of cathelicidins, which have been implicated in amplifying and contributing to the inflammatory response in several ways. Mast cells, which are a source of cathelicidins, also are increased in the skin of these patients. Children can present with vascular rosacea (characterized by flushing, erythema, and/or telangiectasia), papulopustular rosacea, or ocular rosacea. Common ocular symptoms include blepharitis, conjunctivitis, and recurrent chalazion. It is important to refer pediatric rosacea patients with ocular symptoms to an ophthalmologist to prevent ocular sequelae.
Rosacea is a clinical diagnosis but biopsy can be performed to rule out other diagnoses. Treatment consists of lifestyle modifications such as avoiding known triggers and the use of topical and/or oral agents. Common topical therapies include metronidazole and erythromycin. Systemic antibiotics include tetracycline, doxycycline, minocycline, azithromycin, and erythromycin. Some children are able to taper systemic agents and maintain disease control with topical therapy, while others may need to continue a low-dose antibiotic. Although flares can be controlled within weeks to months, rosacea is a chronic disorder and childhood rosacea tends to persist into adulthood.
- Crawford GH, Pelle MT, James WD. Rosacea: i. etiology, pathogenesis, and subtype classification. J Am Acad Dermatol. 2004;51:327-341; quiz 342-324.
- Drolet B, Paller AS. Childhood rosacea. Pediatr Dermatol. 1992;9:22-26.
- Kroshinsky D, Glick SA. Pediatric rosacea. Dermatol Ther. 2006;19:196-201.
- Lacz NL, Schwartz RA. Rosacea in the pediatric population. Cutis. 2004;74:99-103.
- Vemuri RC, Gundamaraju R, Sekaran SD, et al. Major pathophysiological correlations of rosacea: a complete clinical appraisal. Int J Med Sci. 2015;12:387-396.
- Yamasaki K, Di Nardo A, Bardan A, et al. Increased serine protease activity and cathelicidin promotes skin inflammation in rosacea. Nat Med. 2007;13:975-980.
- Ong PY, Ohtake T, Brandt C, et al. Endogenous antimicrobial peptides and skin infections in atopic dermatitis. N Engl J Med. 2002;347:1151-1160.
- Lande R, Gregorio J, Facchinetti V, et al. Plasmacytoid dendritic cells sense self-DNA coupled with antimicrobial peptide. Nature. 2007;449:564-569.
- De Y, Chen Q, Schmidt AP, et al. LL-37, the neutrophil granule- and epithelial cell-derived cathelicidin, utilizes formyl peptide receptor-like 1 (FPRL1) as a receptor to chemoattract human peripheral blood neutrophils, monocytes, and T cells. J Exp Med. 2000;192:1069-1074.
- Koczulla R, von Degenfeld G, Kupatt C, et al. An angiogenic role for the human peptide antibiotic LL-37/hCAP-18. J Clin Invest. 2003;111:1665-1672.
- Park HJ, Cho DH, Kim HJ, et al. Collagen synthesis is suppressed in dermal fibroblasts by the human antimicrobial peptide LL-37. J Invest Dermatol. 2009;129:843-850.
- Muto Y, Wang Z, Vanderberghe M, et al. Mast cells are key mediators of cathelicidin-initiated skin inflammation in rosacea. J Invest Dermatol. 2014;134:2728-2736.
- Di Nardo A, Vitiello A, Gallo RL. Cutting edge: mast cell antimicrobial activity is mediated by expression of cathelicidin antimicrobial peptide. J Immunol. 2003;170:2274-2278.
- Leoni S, Mesplie N, Aitali F, et al. Metronidazole: alternative treatment for ocular and cutaneous rosacea in the pediatric population [in French]. J Fr Ophthalmol. 2011;34:703-710.
- Nazir SA, Murphy S, Siatkowski RM, et al. Ocular rosacea in childhood. Am J Ophthalmol. 2004;137:138-144.
- Miguel AI, Salgado MB, Lisboa MS, et al. Pediatric ocular rosacea: 2 cases. Eur J Ophthalmol. 2012;22:664-666.
- Stone DU, Chodosh J. Ocular rosacea: an update on pathogenesis and therapy. Curr Opin Ophthalmol. 2004;15:499-502.
- Mavrakanas N, Schutz JS, Dosso AA. Pediatric ocular rosacea [published online March 22, 2010]. J Pediatr Ophthalmol Strabismus. 2010;47:117-120.
- Weston WL, Morelli JG. Steroid rosacea in prepubertal children. Arch Pediatr Adolesc Med. 2000;154:62-64.
- Plewig G, Jansen T, Kligman AM. Pyoderma faciale. a review and report of 20 additional cases: is it rosacea? Arch Dermatol. 1992;128:1611-1617.
- Firooz A, Firoozabadi MR, Dowlati Y. Rosacea fulminans (pyoderma faciale): successful treatment of a 3-year-old girl with oral isotretinoin. Int J Dermatol. 2001;40:203-205.
- Baart de la Faille H, Baart de la F-K. Immunofluorescent studies of the skin in rosacea. Dermatologica. 1969;139:49-54.
- Wilkin JK. Rosacea. Int J Dermatol. 1983;22:393-400.
- Franco HL, Weston WL. Steroid rosacea in children. Pediatrics. 1979;64:36-38.
- Cantarutti N, Claps A, Angelino G, et al. Multi-drugs resistant acne rosacea in a child affected by ataxia-telangiectasia: successful treatment with isotretinoin. Ital J Pediatr. 2015;41:23.
- Chen W, Plewig G. Human demodicosis: revisit and a proposed classification. Br J Dermatol. 2014;170:1219-1225.
- Marks R, Harcourt-Webster J. Histopathology of rosacea. Arch Dermatol. 1969;100:683-691.
- Helm KF, Menz J, Gibson LE, et al. A clinical and histopathologic study of granulomatous rosacea. J Am Acad Dermatol. 1991;25(6, pt 1):1038-1043.
- Pelle MT, Crawford GH, James WD. Rosacea: II. therapy. J Am Acad Dermatol. 2004;51:499-512; quiz 513-494.
- Dahl MV, Jarratt M, Kaplan D, et al. Once-daily topical metronidazole cream formulations in the treatment of the papules and pustules of rosacea. J Am Acad Dermatol. 2001;45:723-730.
- Dahl MV, Katz HI, Krueger GG, et al. Topical metronidazole maintains remissions of rosacea. Arch Dermatol. 1998;134:679-683.
- Trumbore MW, Goldstein JA, Gurge RM. Treatment of papulopustular rosacea with sodium sulfacetamide 10%/sulfur 5% emollient foam. J Drugs Dermatol. 2009;8:299-304.
- Del Rosso JQ. Evaluating the role of topical therapies in the management of rosacea: focus on combination sodium sulfacetamide and sulfur formulations. Cutis. 2004;73(1 suppl):29-33.
- Del Rosso JQ. A status report on the medical management of rosacea: focus on topical therapies. Cutis. 2002;70:271-275.
- Maddin S. A comparison of topical azelaic acid 20% cream and topical metronidazole 0.75% cream in the treatment of patients with papulopustular rosacea. J Am Acad Dermatol. 1999;40(6, pt 1):961-965.
- Wilkin JK, DeWitt S. Treatment of rosacea: topical clindamycin versus oral tetracycline. Int J Dermatol. 1993;32:65-67.
- Mills OH Jr, Kligman AM. Letter: topically applied erythromycin in rosacea. Arch Dermatol. 1976;112:553-554.
- Hengge UR. Off-label indications for topical tacrolimus [in German]. Hautarzt. 2013;64:752-756.
- Ertl GA, Levine N, Kligman AM. A comparison of the efficacy of topical tretinoin and low-dose oral isotretinoin in rosacea. Arch Dermatol. 1994;130:319-324.
- Cetinkaya A, Akova YA. Pediatric ocular acne rosacea: long-term treatment with systemic antibiotics. Am J Ophthalmol. 2006;142:816-821.
- Maibach H. Second-generation tetracyclines, a dermatologic overview: clinical uses and pharmacology. Cutis. 1991;48:411-417.
- Jansen T, Plewig G, Kligman AM. Diagnosis and treatment of rosacea fulminans. Dermatology. 1994;188:251-254.
Practice Points
- Although rosacea is largely a diagnosis of adults, it also can begin in childhood and adolescence.
- Ocular rosacea and papulopustular disease are common clinical findings in younger patients.
- Usage of topical metronidazole and age-appropriate oral antibiotics are the mainstay of management.

Case series describes melanoma-associated leukoderma presenting as atypical vitiligo
Consider melanoma-associated leukoderma (MAL) as a possible diagnosis in patients presenting with atypical vitiligo-like skin depigmentation that is refractory to standard treatment, advised the authors of a series of seven such cases.
In a research letter published online in the British Journal of Dermatology, Dr. H.E. Teulings and colleagues from the department of dermatology and the Netherlands Institute for Pigment Disorders at the University of Amsterdam, presented a retrospective analysis of seven patients diagnosed with MAL from 2009-2014, who had been initially diagnosed with nonsegmental vitiligo.
The authors defined MAL as “depigmentation that developed within 1 year before the detection of a primary melanoma or within 3 years before the detection of melanoma metastases with an unknown primary tumour.”
The five women and two men were white and were older (aged 45 to 72 years). They had experienced a sudden onset of highly progressive hypo- and depigmentation, which the authors described as often consisting of “round, patchy, confetti-like lesions” measuring 4-5 mm in diameter; most were scattered symmetrically over the trunk, extremities, and/or face (Br J Dermatol. 2016 Jun 7. doi: 10.1111/bjd.14790).
The authors noted that this presentation was unlike typical vitiligo, “which is often bilaterally distributed in an acrofacial pattern, or scattered symmetrically over the entire body with a predilection for extensor surfaces with a relatively early onset in life and a slowly evolving disease course over time.”
The lesions were also generally resistant to topical steroids and UV phototherapy, and six of the seven patients had no family history of vitiligo. The patients were either diagnosed with a primary melanoma at first presentation or were later diagnosed with metastatic melanoma. The majority responded well to immunotherapy, although one patient died.
“In conclusion, although MAL only constitutes a small percentage of patients presenting with vitiligo-like depigmentation, awareness of this phenomenon and correct diagnosis of these patients is crucial to limit further melanoma treatment delay,” the authors wrote. “Many dermatologists are not aware of the diagnosis MAL and may easily diagnose and treat these patients as having nonsegmental vitiligo, thereby overlooking the underlying (metastatic) melanoma,” they added.
Dr. Teulings is supported by a grant from the Dutch Cancer Society. The authors had no conflicts of interest to declare.
FROM THE BRITISH JOURNAL OF DERMATOLOGY
Key clinical point: Doctors should consider melanoma-associated leukoderma (MAL) as a possible diagnosis in patients presenting with atypical vitiligo-like depigmentation that is refractory to standard treatment.
Major finding: Seven patients with MAL, who were initially diagnosed with nonsegmental vitiligo, were older; had late onset, progressive symptoms; and had presentations that were not like typical vitiligo.
Data source: A retrospective case series of seven patients diagnosed with MAL at a tertiary vitiligo center.
Disclosures: One author was supported by a grant from the Dutch Cancer Society. No conflicts of interest were declared.
Below-knee angioplasty for limb salvage: Keep it simple
PARIS – Below-the-knee plain balloon angioplasty is an effective strategy for limb-salvage in patients with critical limb ischemia who otherwise face the prospect of a major amputation, Ana P. Mollon, MD, said at the annual congress of the European Association of Percutaneous Cardiovascular Interventions.
Dr. Mollon of Posadas National Hospital in Buenos Aires, presented a retrospective series of 82 consecutive patients who underwent below-the-knee percutaneous angioplasty for critical limb ischemia with multivessel involvement. The amputation-free survival rate at a mean of 15.1 months of follow-up was 88%.

Sixty of the 82 patients had triple-artery involvement below the knee. The other 22 had two involved arteries. As is typical in patients with critical limb ischemia, comorbid conditions were common: Seventy-five patients had diabetes, 58 were hypertensive, and 48 were current smokers.
Of the 124 arteries treated by Dr. Mollon and coworkers, the posterior tibial artery was addressed in 41% of cases, the anterior tibial artery in 39%, and the peroneal artery in 18%. Two percent of patients received dilatation of plantar arch lesions.
Seventy percent of treated lesions were total occlusions, nearly half of which were more than 5 cm in length.
The treatment was plain balloon angioplasty in 78% of cases, drug-coated balloons in 12%, bare metal stenting in 7%, and drug-eluting stents in 3%. An antegrade approach was used in 95% of cases, and the remainder received a dual antegrade/retrograde approach.
Roughly 80% of patients were Rutherford category 5 or 6 before treatment. At 12 months post angioplasty, most patients were category 1 or 2, and about one-quarter were category 5 or 6.
Angioplasty was unsuccessful in restoring straight line flow in six patients.
All 10 patients who underwent a major amputation had triple-vessel involvement below the knee; in 9 of the 10, interventionalists were able to treat one of the three severely diseased arteries. Five of the 10 amputees had osteomyelitis.
Session chair Flavio Ribichini, MD, applauded Dr. Mollon and her Argentine colleagues for their predominant use of plain balloon angioplasty in this setting.
“I absolutely share your view on this. It’s the simplest and cheapest approach. The point is that you’re saving the foot now. It’s not that important what’s going to happen in 1 year. I don’t think it makes sense to use drug-coated balloons in this setting. It’s much more sensible to use a simple procedure and see how it goes,” said Dr. Ribichini, professor of cardiovascular medicine at the University of Verona (Italy).
Dr. Mollon said that several years ago her group briefly turned to the use of drug-coated balloons for below-the-knee limb salvage, but they soon switched back to plain balloon angioplasty because they didn’t see any advantage in patient outcomes with the more elaborate technology.
Discussant Benjamin Honton, MD, of the Pasteur Clinic in Toulouse, France, said, “We, too, have been disappointed with the drug-coated balloon, especially in the posterior tibial artery.”
Dr. Mollon reported having no financial conflicts.
PARIS – Below-the-knee plain balloon angioplasty is an effective strategy for limb-salvage in patients with critical limb ischemia who otherwise face the prospect of a major amputation, Ana P. Mollon, MD, said at the annual congress of the European Association of Percutaneous Cardiovascular Interventions.
Dr. Mollon of Posadas National Hospital in Buenos Aires, presented a retrospective series of 82 consecutive patients who underwent below-the-knee percutaneous angioplasty for critical limb ischemia with multivessel involvement. The amputation-free survival rate at a mean of 15.1 months of follow-up was 88%.
Sixty of the 82 patients had triple-artery involvement below the knee. The other 22 had two involved arteries. As is typical in patients with critical limb ischemia, comorbid conditions were common: Seventy-five patients had diabetes, 58 were hypertensive, and 48 were current smokers.
Of the 124 arteries treated by Dr. Mollon and coworkers, the posterior tibial artery was addressed in 41% of cases, the anterior tibial artery in 39%, and the peroneal artery in 18%. Two percent of patients received dilatation of plantar arch lesions.
Seventy percent of treated lesions were total occlusions, nearly half of which were more than 5 cm in length.
The treatment was plain balloon angioplasty in 78% of cases, drug-coated balloons in 12%, bare metal stenting in 7%, and drug-eluting stents in 3%. An antegrade approach was used in 95% of cases, and the remainder received a dual antegrade/retrograde approach.
Roughly 80% of patients were Rutherford category 5 or 6 before treatment. At 12 months post angioplasty, most patients were category 1 or 2, and about one-quarter were category 5 or 6.
Angioplasty was unsuccessful in restoring straight line flow in six patients.
All 10 patients who underwent a major amputation had triple-vessel involvement below the knee; in 9 of the 10, interventionalists were able to treat one of the three severely diseased arteries. Five of the 10 amputees had osteomyelitis.
Session chair Flavio Ribichini, MD, applauded Dr. Mollon and her Argentine colleagues for their predominant use of plain balloon angioplasty in this setting.
“I absolutely share your view on this. It’s the simplest and cheapest approach. The point is that you’re saving the foot now. It’s not that important what’s going to happen in 1 year. I don’t think it makes sense to use drug-coated balloons in this setting. It’s much more sensible to use a simple procedure and see how it goes,” said Dr. Ribichini, professor of cardiovascular medicine at the University of Verona (Italy).
Dr. Mollon said that several years ago her group briefly turned to the use of drug-coated balloons for below-the-knee limb salvage, but they soon switched back to plain balloon angioplasty because they didn’t see any advantage in patient outcomes with the more elaborate technology.
Discussant Benjamin Honton, MD, of the Pasteur Clinic in Toulouse, France, said, “We, too, have been disappointed with the drug-coated balloon, especially in the posterior tibial artery.”
Dr. Mollon reported having no financial conflicts.
AT EUROPCR 2016
Key clinical point: Experts agree that plain balloon angioplasty is the way to go for limb salvage in patients with critical limb ischemia.
Major finding: The amputation-free survival rate in a consecutive series of patients who underwent below-the-knee angioplasty for critical limb ischemia was 88% at a mean of 15.1 months of follow-up.
Data source: A retrospective case series comprising 82 consecutive patients.
Disclosures: The presenter reported having no financial conflicts.

Education, Networking Opportunities Inspire Arizona Hospitalist Vishal Verma, MD, to Start New SHM Chapter

This month, The Hospitalist spotlights Vishal Verma, MD, medical director of the hospitalist program at 4C Medical Group in Scottsdale, Ariz. In addition to being an active SHM member and regular attendee at SHM meetings, Dr. Verma recently purchased a group membership for his hospitalist team. He also started an Arizona chapter of SHM, based on his positive experiences with SHM. He recently spoke with The Hospitalist to share his path to hospital medicine and his inspiration to expand the society’s reach in Arizona.
Question: How did you arrive at a career in hospital medicine?
Answer: After finishing my medical school training at Kasturba Medical College in Manipal, India, I traveled to the United States to further my education and begin my internship and residency. I started my internship in internal medicine at a downtown Brooklyn, N.Y., hospital in 2006. Internship year, though often considered to be a hectic and laborious year, was when I learned for the first time how to care for hospitalized patients. I was chosen by the chief residents as intern of the month in my first month of training. This honor, and the experience of training in an inner-city hospital, further ignited my passion to practice medicine.
It was during my time as an intern and resident when I fully realized the critical role hospitalists play as the main coordinators of care and witnessed their influence on care outcomes. I later served as chief medical resident and was elected by my fellow residents as president of house staff. I was also elected as vice president of the Committee of Interns and Residents (CIR) and served on CIR’s National Executive Board, where I passionately advocated for my patients and fellow colleagues. Serving in various roles provided me with an in-depth knowledge of hospital medicine and helped me build it as my career.
Q: In your current role, how does your membership with SHM help you improve quality of patient care?
A: Our group consists of 14 hospitalists who serve in two community hospitals. Being a member of SHM for many years has been a rewarding experience as it keeps me informed about changes and advances in hospital medicine. Through the Journal of Hospital Medicine, regular webinars, and SHM conferences and annual meetings, SHM helps us enrich our knowledge base on quality, performance, patient experience, coding, practice management, acute and post-acute care, and other aspects of hospital medicine.
At our recent visit to HM16 in San Diego, a few members of our team attended sessions on post-acute care and value-based reimbursements. At the sessions, we learned of the importance of stressing quality and engaging sub-acute rehab facilities in meaningful ways so as to improve the quality of care in skilled nursing facilities and also help to decrease the length of stay from 30 days to closer to 15 days. 4C Medical Group has implemented many suggestions from these lectures and is in the process of transforming our post-acute-care teams.
I also serve as a member of the board of directors for 4C Medical Group, where my association with SHM has helped me give valuable input while we manage the care of over 20,000 patients in acute, sub-acute, and home-based teams as well as outpatient clinics. SHM provides its members with a platform to sharpen their leadership skills and enables members to build a strong network among fellow leaders, which helps us learn about and share best practices, which translates to better quality of care.
For example, a recent presentation by SHM member Dr. Jesse Theisen-Toupal on inpatient management of opioid use disorder was an eye-opener. Learning about harm-reduction strategies for opioid misuse during the presentation was very helpful to us, and we shared the suggestions with our hospitalist team.
Q: What inspired you to start an Arizona chapter in Scottsdale and purchase a group membership for your team?
A: At HM16, I met Debra Beach, manager of membership and outreach programs at SHM, and we discussed how our company can align with SHM and bring our hospitalists on board as members to provide them with a greater network of resources. I was surprised that Arizona did not have a dedicated SHM chapter. Phoenix, one of the U.S.’s largest metropolitan areas, has many large hospital systems employing and contracting thousands of hospitalists. I saw an opening for a great opportunity to take the lead on developing an SHM chapter in Arizona with the support of my 4C colleagues. After discussing this opportunity with other hospitalist groups in Arizona, we came to the conclusion that it would benefit not only our team at 4C but hospitalists statewide.
I am confident that the Arizona chapter of SHM will not only be successful but soon will be contributing nationally to the hospitalist movement. Moreover, SHM will help keep our members educated and informed about the upcoming changes as we transition to a pay-for-performance model of reimbursement and any other healthcare system changes still to come.
I believe in the famous Chinese proverb, “A journey of a thousand miles begins with a single step.” We have taken the first step in our hospitalist group, and without a doubt, SHM’s journey in the state of Arizona shall be a success story. All our members are excited with this new beginning.
Q: How do you see hospital medicine evolving over the next 20 years?
A: 2016 has already been designated as the “Year of the Hospitalist.” I will take it a step further and predict that the next decade will be a decade of hospital medicine. Inpatient care is transforming at a rapid pace, and we need a dedicated and well-trained stream of doctors who are specialists in managing hospitalized patients. Care of hospitalized patients was once fragmented and costly; now with hospitalists as captains of the ship, care can be delivered in more comprehensive, cost-effective ways with better quality and increased performance. The introduction of a separate specialist billing code for hospitalists by the CMS is a step in the right direction.
In the next few years, I would enjoy seeing a separate board for hospitalists with hospital medicine’s own specialty certification. The potential for hospital medicine’s continued growth is tremendous, and I look forward to being a part of its future. TH
Brett Radler is SHM’s communications specialist.

Get up to Speed on the Latest in Pediatric Hospital Medicine

Register, book your hotel, and see the full course schedule at www.phmmeeting.org.
Brett Radler is SHM’s communications coordinator.
Register, book your hotel, and see the full course schedule at www.phmmeeting.org.
Brett Radler is SHM’s communications coordinator.
Register, book your hotel, and see the full course schedule at www.phmmeeting.org.
Brett Radler is SHM’s communications coordinator.

Team identifies potential therapeutic target for AML

New research suggests that E proteins and their antagonists, Id proteins, can play key roles in acute myeloid leukemia (AML).
The study showed that overexpression of the Id2 protein or knockdown of the E2-2 protein can suppress both mixed-lineage leukemia (MLL)-rearranged AML and t(8;21) AML.
These findings, published in Cancer Cell, suggest the Id2/E-protein axis may be a promising therapeutic target for AML.
“There is a particularly urgent need for new, targeted, drug-based therapies for AML, and with every discovery of what’s driving the cancer, we take a step closer to achieving that,” said study author Ricky Johnstone, PhD, of Peter MacCallum Cancer Centre in Melbourne, Victoria, Australia.
“What we found in this case was the suppression of Id2 protein plays an important, and previously unrecognized, role in allowing MLL re-arranged AML cancer cells to take hold and spread. Drugs that influence levels of this protein, or stop it being suppressed by the cancer, could provide a much-needed new avenue to combatting this disease.”
The researchers first found that Id2 regulates leukemia stem cell (LSC) potential. Specifically, low Id2 expression is associated with LSC enrichment, and Id2 overexpression hinders leukemia development.
Further investigation revealed that the fusion protein MLL-AF9 suppresses Id2 and activates E2-2 expression, while E2-2 depletion phenocopies Id2 overexpression in MLL-AF9-AML cells.
The team also found that Id2’s tumor-suppressive function is conserved in t(8;21) AML. And low expression of Id2 and its associated gene signature are associated with poor prognosis in patients with MLL-rearranged AML or t(8;21) AML. ![]()
Caregiver Partners in Care Transitions
Under the national leadership of AARP, 42 states and territories have introduced the Caregiver Advise Record and Enable (CARE) Act, 32 have passed it, and the following 30 have enacted it into law: Arkansas, California, Colorado, Connecticut, District of Columbia, Illinois, Indiana, Louisiana, Maine, Maryland, Michigan, Minnesota, Mississippi, Nebraska, Nevada, New Hampshire, New Jersey, New Mexico, New York, Oklahoma, Oregon, Pennsylvania, Puerto Rico, Rhode Island, Utah, Virginia, Virgin Islands, West Virginia, Washington and Wyoming (as of June 6, 2016). The CARE Act requires hospitals to: (1) record the name of the family caregiver in the medical record, (2) inform the family caregiver when the patient is to be discharged, and (3) provide the family caregiver with education and instruction on the medical tasks that he or she will need to perform for the patient upon return home.[1, 2]
The family caregiver is to be identified by the patient. Because the patient is the source of the information, Health Insurance Portability and Accountability Act concerns are minimal. A family caregiver need not be related to the patient by blood or marriage; a friend, neighbor, partner, or paid caregiver could be identified by the patient as serving in this role. If the patient does not identify a family caregiver (due to the absence of such an individual, concern for potential burden on a loved one, desire for confidentiality, transient or progressive cognitive impairment, or other reasons), this also needs to be documented, though the additional provisions of the CARE Act would not be applicable. As some states have made additions or individual modifications to the CARE Act, the reader is encouraged to learn more about state‐specific differences that might impact implementation.[2, 3]
The impetus for the CARE Act emerges from challenges faced by both family caregivers and healthcare professionals. The 3 care elements included in the Act appear to have considerable face validity for what would constitute good transitional care. To further explore why this is necessary, we need to begin by asking why are these 3 care elements not routine, and why did an advocacy organization resort to a legislative solution to formally recognize and include family caregivers in discharge preparation?
Family caregivers, when able and willing, often play an instrumental role in the care of their loved ones, particularly during the vulnerable time of transitions out of the hospital.[4, 5] They are often the first line of defense for detecting lapses in quality or safety as care is transitioned from the hospital. Family caregivers frequently take on a primary or secondary role in operationalizing and executing the discharge plan. Nearly half of family caregivers perform skilled medical or nursing tasks for their loved ones (eg, wound care, injections, complex medication management, operating specialized medical equipment) often with insufficient assistance or training from healthcare professionals.[6]
Lack of sufficient time might be a major reason why the 3 care elements identified in the CARE Act are not routinely addressed by the discharging team, which may include hospitalists, nurses, pharmacists, social workers, and other clinicians. However, there may be other reasons as well, including a lack of knowledge, confidence, or tools for how to best prepare the patient and family caregiver. This is compounded by the absence of routine feedback loops for gauging the effectiveness of discharge preparation beyond a patient's readmission to the same facility. If hospital‐based clinicians were asked to rank order their daily tasks from greatest sense of professional gratification to lowest, discharge preparation would likely appear toward the bottom of the list.[7, 8]
Meanwhile, hospitalists and hospital clinical leaders are struggling to keep pace with a confluence of new demands that include value‐based purchasing initiatives and population health efforts, to name but a few. Although current Centers for Medicare and Medicaid Services' (CMS) Hospital Conditions of Participation for Discharge Planning do not require recognition or preparation of family caregivers, CMS' newly proposed revisions emphasize better preparation of family caregivers to be active partners upon hospital discharge.[9] Thus, although it might be reflexive to view the CARE Act in isolation as yet 1 more initiative requiring new effort and resources to address, widening the lens may confirm that the contributions of family caregivers are integral and aligned across nearly all efforts aimed at promoting greater value, and in this light could be viewed as complementary rather than competitive.
Innovation or new resources may be needed to implement the CARE Act. In the absence of a step‐by‐step user's guide, hospitals may wish to take advantage of valuable publicly available resources that encourage more effective collaboration between family caregivers and healthcare professionals (Table 1).
| Organization (URL) | Relevant Resources for Implementing the CARE Act |
|---|---|
| |
| AARP ( |
Family caregiver video guides to managing medications |
| Alzheimer's Association ( |
Addresses the unique needs of persons with dementia: |
| Ensuring that all treating physicians and medical professions are aware of the diagnosis of Alzheimer's or other dementia | |
| If the person with dementia has difficulty communicating, the family caregiver may help medical staff by offering suggestions about what the person may want or need | |
| The family caregiver may alert medical staff of triggers that may cause unpredictable behavior | |
| Considerations for discharge to a residential facility or assisted living | |
| Care Transitions Program ( |
Provides a wide range of resources for professionals, patients, and family caregivers: |
| The FCAT tool | |
| Hospital discharge checklist | |
| Tips for managing care at home | |
| Tips for recognizing and responding to red flags | |
| Tips for effective medication management | |
| Institute for Patient‐ and Family‐Centered Care ( |
Offers practical advice for establishing patient and family advisory councils: |
| Qualities and skills of patient/family advisors | |
| Recruitment | |
| Development of bylaws | |
| Meeting schedule | |
| National Transitions of Care Coalition ( |
Provides a wide variety of tools and resources: |
| Taking Care of MY Health Care developed as a guide to help patients and family caregivers feel better prepared | |
| My Medicine List helps patients and family caregivers gather important information about medications | |
| Cultural competence tool provides strategies and resources to enhance professionals' capacity to deliver culturally competent services to patients and family caregivers during transitions of care | |
| Next Step in Care ( |
The most comprehensive site supporting both family caregivers and health professionals; includes: |
| A toolkit for working with family caregivers | |
| HIPAA considerations for family caregivers | |
| Tips on identifying the family caregiver | |
| Assessment tool for family caregivers' needs | |
| Tips for referring patients and family caregivers to community‐based services | |
|
Project BOOST( |
Extensive toolkit includes: |
| Self‐assessment questions to promote planning for how to include family | |
| Return on investment calculator that includes patient as well as family satisfaction | |
| Teach back approach applicable to patient and family caregivers | |
| Patient and family caregiver preparedness tool | |
|
Project RED( |
Extensive toolkit includes: |
| Five steps to integrating family caregivers into the discharge plan | |
| Understanding and enhancing the role of family caregivers in RED | |
Operationalizing the CARE Act may initially appear simple but in practice will not be easy. The first care element focuses on identifying the family caregiver. Next, Step in Care offers a practical guide for how to identify the family caregiver in a busy hospital environment (Table 1). The guide advises health professionals on how to identify the person most likely to assume responsibility for care after discharge by asking a series of questions: Who assists you at home? Who do you call in case of emergency? Who helps with medications or doctor appointments? The guide cautions health professionals not to assume that individuals encountered at the patient's bedside are necessarily the family caregivers. They may be covering for the family caregiver, who has other duties (eg, job, child care).
The second CARE Act element entails informing the family caregiver when the patient will be discharged. At present there is no standardization of this practice. Many hospitals conduct interdisciplinary rounds, during which a discharge date is frequently estimated. A designated member of the inpatient team (eg, primary nurse, social worker, care manager) might be tasked with notifying the family caregiver of this estimated date (either in person, by telephone, or using other approved mode[s] of communication). Ideally, this notification should be conveyed as soon as the inpatient care team can foresee a discharge date, as it would be preferable to give the family caregiver an estimate that turns out to be a day or 2 off and needs to be revised than to inform the family caregiver at the last minute. The white board in the patient's room may serve as a reminder to both the patient and family caregiver as well as to other members of the inpatient care team.
The third CARE Act element could be facilitated with the Family Caregiver Activation in Transitions (FCAT) tool, a self‐efficacy measure of transition specific tasks. The FCAT tool is designed to facilitate more productive interactions and guide the care team in understanding what common transition‐related areas family caregivers would like to feel more prepared for or confident with. The FCAT tool can be administered by a health professional or self‐administered by a family caregiver and takes approximately 2 minutes to complete[10] (Table 1).
Hospital leaders might consider creating an interdisciplinary team charged with facilitating the implementation of the CARE Act. Specifically, this team might develop guidelines and serve as a forum whereby clinicians might share particularly challenging cases. Similarly, for ongoing input and suggestions for how to further improve all aspects of hospital care, including the discharge experience, hospitals are encouraged to form and foster patient and family advisory councils (Table 1).
Finally, when it comes to improving the hospital discharge experience for family caregivers, there is no us and them. Despite our professional advantages, each of has had or will likely have an opportunity to overcome the many gaps in hospital discharge planning, not just as healthcare professionals but also in our roles as adult children, spouses, and parents. In this regard, we are all invested in improving the discharge experience.
Disclosures
Support for this work was provided by the Gordon and Betty Moore Foundation. The sponsor had no role in the preparation, review, or approval of this article. The author reports no conflicts of interest.
- . One caregiver's regret: how the CARE Act could have helped. Available at: http://blog.aarp.org/2016/04/18/one‐caregivers‐regret‐how‐the‐care‐act‐could‐have‐helped. Published April 18, 2016. Accessed June 7, 2016.
- , . Stepping up to support family caregivers. Available at: http://blog.aarp.org/2016/06/07/stepping‐up‐to‐support‐family‐caregivers. Published June 7, 2016. Accessed June 7, 2016.
- . New state laws support millions of Americans who minister to aging relatives and form the backbone of the nation's long‐term care system. Available at: http://www.ncsl.org/research/human‐services/helping‐the‐helpers.aspx. Published February 1, 2015. Accessed June 7, 2016.
- , . Family caregivers' experiences during transitions out of the hospital. J Healthc Qual. 2015;37:12–21.
- . The critical role of caregivers in achieving patient‐centered care. JAMA. 2013;310:575–576.
- , , . Home alone: family caregivers providing complex chronic care, 2012. Available at: http://www.aarp.org/home‐family/caregiving/info‐10‐2012/home‐alone‐family‐caregivers‐providing‐complex‐chronic‐care.html. Accessed June 7, 2016.
- , , , et al. Transition of care for hospitalized elderly patients—development of a discharge checklist for hospitalists. J Hosp Med. 2006;1:354–360.
- , , , , . Out of sight, out of mind: housestaff perceptions of quality‐limiting factors in discharge care at teaching hospitals. J Hosp Med. 2012:7:376–381.
- Centers for Medicare and Medicaid Services. Proposed revisions to requirements for discharge planning for hospitals, critical access hospitals, and home health agencies. Fed Regist. 2015;80:68125–68155.
- , , . The Family Caregiver Activation in Transitions tool (FCAT): a new measure of family caregiver self‐efficacy. Jt Comm J Qual Patient Saf. 2015;41:502–507.
Under the national leadership of AARP, 42 states and territories have introduced the Caregiver Advise Record and Enable (CARE) Act, 32 have passed it, and the following 30 have enacted it into law: Arkansas, California, Colorado, Connecticut, District of Columbia, Illinois, Indiana, Louisiana, Maine, Maryland, Michigan, Minnesota, Mississippi, Nebraska, Nevada, New Hampshire, New Jersey, New Mexico, New York, Oklahoma, Oregon, Pennsylvania, Puerto Rico, Rhode Island, Utah, Virginia, Virgin Islands, West Virginia, Washington and Wyoming (as of June 6, 2016). The CARE Act requires hospitals to: (1) record the name of the family caregiver in the medical record, (2) inform the family caregiver when the patient is to be discharged, and (3) provide the family caregiver with education and instruction on the medical tasks that he or she will need to perform for the patient upon return home.[1, 2]
The family caregiver is to be identified by the patient. Because the patient is the source of the information, Health Insurance Portability and Accountability Act concerns are minimal. A family caregiver need not be related to the patient by blood or marriage; a friend, neighbor, partner, or paid caregiver could be identified by the patient as serving in this role. If the patient does not identify a family caregiver (due to the absence of such an individual, concern for potential burden on a loved one, desire for confidentiality, transient or progressive cognitive impairment, or other reasons), this also needs to be documented, though the additional provisions of the CARE Act would not be applicable. As some states have made additions or individual modifications to the CARE Act, the reader is encouraged to learn more about state‐specific differences that might impact implementation.[2, 3]
The impetus for the CARE Act emerges from challenges faced by both family caregivers and healthcare professionals. The 3 care elements included in the Act appear to have considerable face validity for what would constitute good transitional care. To further explore why this is necessary, we need to begin by asking why are these 3 care elements not routine, and why did an advocacy organization resort to a legislative solution to formally recognize and include family caregivers in discharge preparation?
Family caregivers, when able and willing, often play an instrumental role in the care of their loved ones, particularly during the vulnerable time of transitions out of the hospital.[4, 5] They are often the first line of defense for detecting lapses in quality or safety as care is transitioned from the hospital. Family caregivers frequently take on a primary or secondary role in operationalizing and executing the discharge plan. Nearly half of family caregivers perform skilled medical or nursing tasks for their loved ones (eg, wound care, injections, complex medication management, operating specialized medical equipment) often with insufficient assistance or training from healthcare professionals.[6]
Lack of sufficient time might be a major reason why the 3 care elements identified in the CARE Act are not routinely addressed by the discharging team, which may include hospitalists, nurses, pharmacists, social workers, and other clinicians. However, there may be other reasons as well, including a lack of knowledge, confidence, or tools for how to best prepare the patient and family caregiver. This is compounded by the absence of routine feedback loops for gauging the effectiveness of discharge preparation beyond a patient's readmission to the same facility. If hospital‐based clinicians were asked to rank order their daily tasks from greatest sense of professional gratification to lowest, discharge preparation would likely appear toward the bottom of the list.[7, 8]
Meanwhile, hospitalists and hospital clinical leaders are struggling to keep pace with a confluence of new demands that include value‐based purchasing initiatives and population health efforts, to name but a few. Although current Centers for Medicare and Medicaid Services' (CMS) Hospital Conditions of Participation for Discharge Planning do not require recognition or preparation of family caregivers, CMS' newly proposed revisions emphasize better preparation of family caregivers to be active partners upon hospital discharge.[9] Thus, although it might be reflexive to view the CARE Act in isolation as yet 1 more initiative requiring new effort and resources to address, widening the lens may confirm that the contributions of family caregivers are integral and aligned across nearly all efforts aimed at promoting greater value, and in this light could be viewed as complementary rather than competitive.
Innovation or new resources may be needed to implement the CARE Act. In the absence of a step‐by‐step user's guide, hospitals may wish to take advantage of valuable publicly available resources that encourage more effective collaboration between family caregivers and healthcare professionals (Table 1).
| Organization (URL) | Relevant Resources for Implementing the CARE Act |
|---|---|
| |
| AARP ( |
Family caregiver video guides to managing medications |
| Alzheimer's Association ( |
Addresses the unique needs of persons with dementia: |
| Ensuring that all treating physicians and medical professions are aware of the diagnosis of Alzheimer's or other dementia | |
| If the person with dementia has difficulty communicating, the family caregiver may help medical staff by offering suggestions about what the person may want or need | |
| The family caregiver may alert medical staff of triggers that may cause unpredictable behavior | |
| Considerations for discharge to a residential facility or assisted living | |
| Care Transitions Program ( |
Provides a wide range of resources for professionals, patients, and family caregivers: |
| The FCAT tool | |
| Hospital discharge checklist | |
| Tips for managing care at home | |
| Tips for recognizing and responding to red flags | |
| Tips for effective medication management | |
| Institute for Patient‐ and Family‐Centered Care ( |
Offers practical advice for establishing patient and family advisory councils: |
| Qualities and skills of patient/family advisors | |
| Recruitment | |
| Development of bylaws | |
| Meeting schedule | |
| National Transitions of Care Coalition ( |
Provides a wide variety of tools and resources: |
| Taking Care of MY Health Care developed as a guide to help patients and family caregivers feel better prepared | |
| My Medicine List helps patients and family caregivers gather important information about medications | |
| Cultural competence tool provides strategies and resources to enhance professionals' capacity to deliver culturally competent services to patients and family caregivers during transitions of care | |
| Next Step in Care ( |
The most comprehensive site supporting both family caregivers and health professionals; includes: |
| A toolkit for working with family caregivers | |
| HIPAA considerations for family caregivers | |
| Tips on identifying the family caregiver | |
| Assessment tool for family caregivers' needs | |
| Tips for referring patients and family caregivers to community‐based services | |
|
Project BOOST( |
Extensive toolkit includes: |
| Self‐assessment questions to promote planning for how to include family | |
| Return on investment calculator that includes patient as well as family satisfaction | |
| Teach back approach applicable to patient and family caregivers | |
| Patient and family caregiver preparedness tool | |
|
Project RED( |
Extensive toolkit includes: |
| Five steps to integrating family caregivers into the discharge plan | |
| Understanding and enhancing the role of family caregivers in RED | |
Operationalizing the CARE Act may initially appear simple but in practice will not be easy. The first care element focuses on identifying the family caregiver. Next, Step in Care offers a practical guide for how to identify the family caregiver in a busy hospital environment (Table 1). The guide advises health professionals on how to identify the person most likely to assume responsibility for care after discharge by asking a series of questions: Who assists you at home? Who do you call in case of emergency? Who helps with medications or doctor appointments? The guide cautions health professionals not to assume that individuals encountered at the patient's bedside are necessarily the family caregivers. They may be covering for the family caregiver, who has other duties (eg, job, child care).
The second CARE Act element entails informing the family caregiver when the patient will be discharged. At present there is no standardization of this practice. Many hospitals conduct interdisciplinary rounds, during which a discharge date is frequently estimated. A designated member of the inpatient team (eg, primary nurse, social worker, care manager) might be tasked with notifying the family caregiver of this estimated date (either in person, by telephone, or using other approved mode[s] of communication). Ideally, this notification should be conveyed as soon as the inpatient care team can foresee a discharge date, as it would be preferable to give the family caregiver an estimate that turns out to be a day or 2 off and needs to be revised than to inform the family caregiver at the last minute. The white board in the patient's room may serve as a reminder to both the patient and family caregiver as well as to other members of the inpatient care team.
The third CARE Act element could be facilitated with the Family Caregiver Activation in Transitions (FCAT) tool, a self‐efficacy measure of transition specific tasks. The FCAT tool is designed to facilitate more productive interactions and guide the care team in understanding what common transition‐related areas family caregivers would like to feel more prepared for or confident with. The FCAT tool can be administered by a health professional or self‐administered by a family caregiver and takes approximately 2 minutes to complete[10] (Table 1).
Hospital leaders might consider creating an interdisciplinary team charged with facilitating the implementation of the CARE Act. Specifically, this team might develop guidelines and serve as a forum whereby clinicians might share particularly challenging cases. Similarly, for ongoing input and suggestions for how to further improve all aspects of hospital care, including the discharge experience, hospitals are encouraged to form and foster patient and family advisory councils (Table 1).
Finally, when it comes to improving the hospital discharge experience for family caregivers, there is no us and them. Despite our professional advantages, each of has had or will likely have an opportunity to overcome the many gaps in hospital discharge planning, not just as healthcare professionals but also in our roles as adult children, spouses, and parents. In this regard, we are all invested in improving the discharge experience.
Disclosures
Support for this work was provided by the Gordon and Betty Moore Foundation. The sponsor had no role in the preparation, review, or approval of this article. The author reports no conflicts of interest.
- . One caregiver's regret: how the CARE Act could have helped. Available at: http://blog.aarp.org/2016/04/18/one‐caregivers‐regret‐how‐the‐care‐act‐could‐have‐helped. Published April 18, 2016. Accessed June 7, 2016.
- , . Stepping up to support family caregivers. Available at: http://blog.aarp.org/2016/06/07/stepping‐up‐to‐support‐family‐caregivers. Published June 7, 2016. Accessed June 7, 2016.
- . New state laws support millions of Americans who minister to aging relatives and form the backbone of the nation's long‐term care system. Available at: http://www.ncsl.org/research/human‐services/helping‐the‐helpers.aspx. Published February 1, 2015. Accessed June 7, 2016.
- , . Family caregivers' experiences during transitions out of the hospital. J Healthc Qual. 2015;37:12–21.
- . The critical role of caregivers in achieving patient‐centered care. JAMA. 2013;310:575–576.
- , , . Home alone: family caregivers providing complex chronic care, 2012. Available at: http://www.aarp.org/home‐family/caregiving/info‐10‐2012/home‐alone‐family‐caregivers‐providing‐complex‐chronic‐care.html. Accessed June 7, 2016.
- , , , et al. Transition of care for hospitalized elderly patients—development of a discharge checklist for hospitalists. J Hosp Med. 2006;1:354–360.
- , , , , . Out of sight, out of mind: housestaff perceptions of quality‐limiting factors in discharge care at teaching hospitals. J Hosp Med. 2012:7:376–381.
- Centers for Medicare and Medicaid Services. Proposed revisions to requirements for discharge planning for hospitals, critical access hospitals, and home health agencies. Fed Regist. 2015;80:68125–68155.
- , , . The Family Caregiver Activation in Transitions tool (FCAT): a new measure of family caregiver self‐efficacy. Jt Comm J Qual Patient Saf. 2015;41:502–507.