User login
Little drops of gold
Is it more difficult to get blood from a stone or urine from a 3-month-old infant with a fever for which there is no apparent cause? Silly question? Not if you’re a pediatrician, and it’s 4:30 on a Friday afternoon before a 3-day holiday weekend.
You would probably prefer your chances with the stone. You have been there before. You have been peed on more than once by a 3-month-old baby you were examining. But you know from experience that when you really need just a milliliter or two of urine from a sick infant to rule out a diagnosis, those few drops of golden liquid will be hard to come by.

But of course the child’s exam hasn’t changed, and you can’t convince yourself that your training can be ignored. You must have that urine. Can you bring yourself to launch an invasive attack on the child with a catheter? Despite your reassurances and explanations and your confidence with the technique, catheterization isn’t easy with the child’s parents watching. You wonder again, “Do I really need that urine?” You have done one or two needle bladder aspirations during your training years ago, but that prospect has even less appeal than the catheterization. Of course, there is always the urine bag and its significant risk of providing you with a contaminated sample or leaking even if it has been properly applied.
If only the patient were old enough to follow directions and give you a clean catch midstream sample. But you have chosen to be a pediatrician, and with that comes the reality that most of your sick young patients with unexplained fevers aren’t going to be able to comply by producing a urine sample. Sometimes you get lucky, and as the child is being prepped for catheterization or application of the collecting bag, she will surprise you by squirting out a small arc of urine that can be caught in midair – that is, if you or your assistant is prepared with an open sterile (or even just clean) cup and quick hands. After several missed opportunities over the first several years in practice, I have tried to remember to always have my assistants ready with an open container. And remind them to keep their eyes on the exposed perineum of any infant from whom we might need a clean urine sample.
But there is another option, and you can find it in this September’s Pediatrics (Evaluation of a New Strategy for Clean-Catch Urine in Infants, Labrosse et al. 2016 Sept;138[3]). The Canadian investigators describe a technique in which the infant is stimulated to void. After giving the child 20 minutes to drink and gently cleaning the perineum, the child is held vertically, the girls with their hips flexed. The physician or nurse then taps the suprapubic area at a rate of 100 taps per minute for 30 seconds and then gently massages the lumbar paravertebral area for 30 seconds. The two stimulation maneuvers are then alternated until the child voids. The investigators recommend stopping if no urine is obtained in 300 seconds, or 5 minutes.
The results are very encouraging with a success rate of 49% on a series of 126 infants. The investigators report a contamination rate of 16% that is not statistically different from collections using an invasive technique. Median time to success was 45 seconds.
You can look at the photos for yourself, but it looks like you would need at least one assistant in addition to a parent who is holding the child. I suspect that it also helps to have quick hands once the voiding starts.
It certainly sounds like a technique worth trying. The authors claim that when used as the first attempt at collection, the number of catheterizations could be cut by a third. I suspect that just like with any technique, some folks on your staff will emerge as the ones with the magic hands and might have a success rate well above that reported in this article. Groom and treasure those in-house experts at collecting those little yellow drops. They are worth their weight in gold.
Dr. Wilkoff practiced primary care pediatrics in Brunswick, Maine, for nearly 40 years. He has authored several books on behavioral pediatrics including “How to Say No to Your Toddler.” Email him at [email protected].
Is it more difficult to get blood from a stone or urine from a 3-month-old infant with a fever for which there is no apparent cause? Silly question? Not if you’re a pediatrician, and it’s 4:30 on a Friday afternoon before a 3-day holiday weekend.
You would probably prefer your chances with the stone. You have been there before. You have been peed on more than once by a 3-month-old baby you were examining. But you know from experience that when you really need just a milliliter or two of urine from a sick infant to rule out a diagnosis, those few drops of golden liquid will be hard to come by.
But of course the child’s exam hasn’t changed, and you can’t convince yourself that your training can be ignored. You must have that urine. Can you bring yourself to launch an invasive attack on the child with a catheter? Despite your reassurances and explanations and your confidence with the technique, catheterization isn’t easy with the child’s parents watching. You wonder again, “Do I really need that urine?” You have done one or two needle bladder aspirations during your training years ago, but that prospect has even less appeal than the catheterization. Of course, there is always the urine bag and its significant risk of providing you with a contaminated sample or leaking even if it has been properly applied.
If only the patient were old enough to follow directions and give you a clean catch midstream sample. But you have chosen to be a pediatrician, and with that comes the reality that most of your sick young patients with unexplained fevers aren’t going to be able to comply by producing a urine sample. Sometimes you get lucky, and as the child is being prepped for catheterization or application of the collecting bag, she will surprise you by squirting out a small arc of urine that can be caught in midair – that is, if you or your assistant is prepared with an open sterile (or even just clean) cup and quick hands. After several missed opportunities over the first several years in practice, I have tried to remember to always have my assistants ready with an open container. And remind them to keep their eyes on the exposed perineum of any infant from whom we might need a clean urine sample.
But there is another option, and you can find it in this September’s Pediatrics (Evaluation of a New Strategy for Clean-Catch Urine in Infants, Labrosse et al. 2016 Sept;138[3]). The Canadian investigators describe a technique in which the infant is stimulated to void. After giving the child 20 minutes to drink and gently cleaning the perineum, the child is held vertically, the girls with their hips flexed. The physician or nurse then taps the suprapubic area at a rate of 100 taps per minute for 30 seconds and then gently massages the lumbar paravertebral area for 30 seconds. The two stimulation maneuvers are then alternated until the child voids. The investigators recommend stopping if no urine is obtained in 300 seconds, or 5 minutes.
The results are very encouraging with a success rate of 49% on a series of 126 infants. The investigators report a contamination rate of 16% that is not statistically different from collections using an invasive technique. Median time to success was 45 seconds.
You can look at the photos for yourself, but it looks like you would need at least one assistant in addition to a parent who is holding the child. I suspect that it also helps to have quick hands once the voiding starts.
It certainly sounds like a technique worth trying. The authors claim that when used as the first attempt at collection, the number of catheterizations could be cut by a third. I suspect that just like with any technique, some folks on your staff will emerge as the ones with the magic hands and might have a success rate well above that reported in this article. Groom and treasure those in-house experts at collecting those little yellow drops. They are worth their weight in gold.
Dr. Wilkoff practiced primary care pediatrics in Brunswick, Maine, for nearly 40 years. He has authored several books on behavioral pediatrics including “How to Say No to Your Toddler.” Email him at [email protected].
Beaded Papules Along the Eyelid Margins
The Diagnosis: Lipoid Proteinosis
Lipoid proteinosis (LP), also known as hyalinosis cutis et mucosae or Urbach-Wiethe disease, is a rare autosomal-recessive disorder. It is characterized by deposition of hyalinelike material in multiple organs including the skin, oral mucosa, larynx, and brain. The underlying defect is mutations in the extracellular matrix protein 1 gene, ECM1, which binds to various proteins (eg, perlecan, fibulins, matrix metalloproteinase 9) and plays a role in angiogenesis and epidermal differentiation.1-4
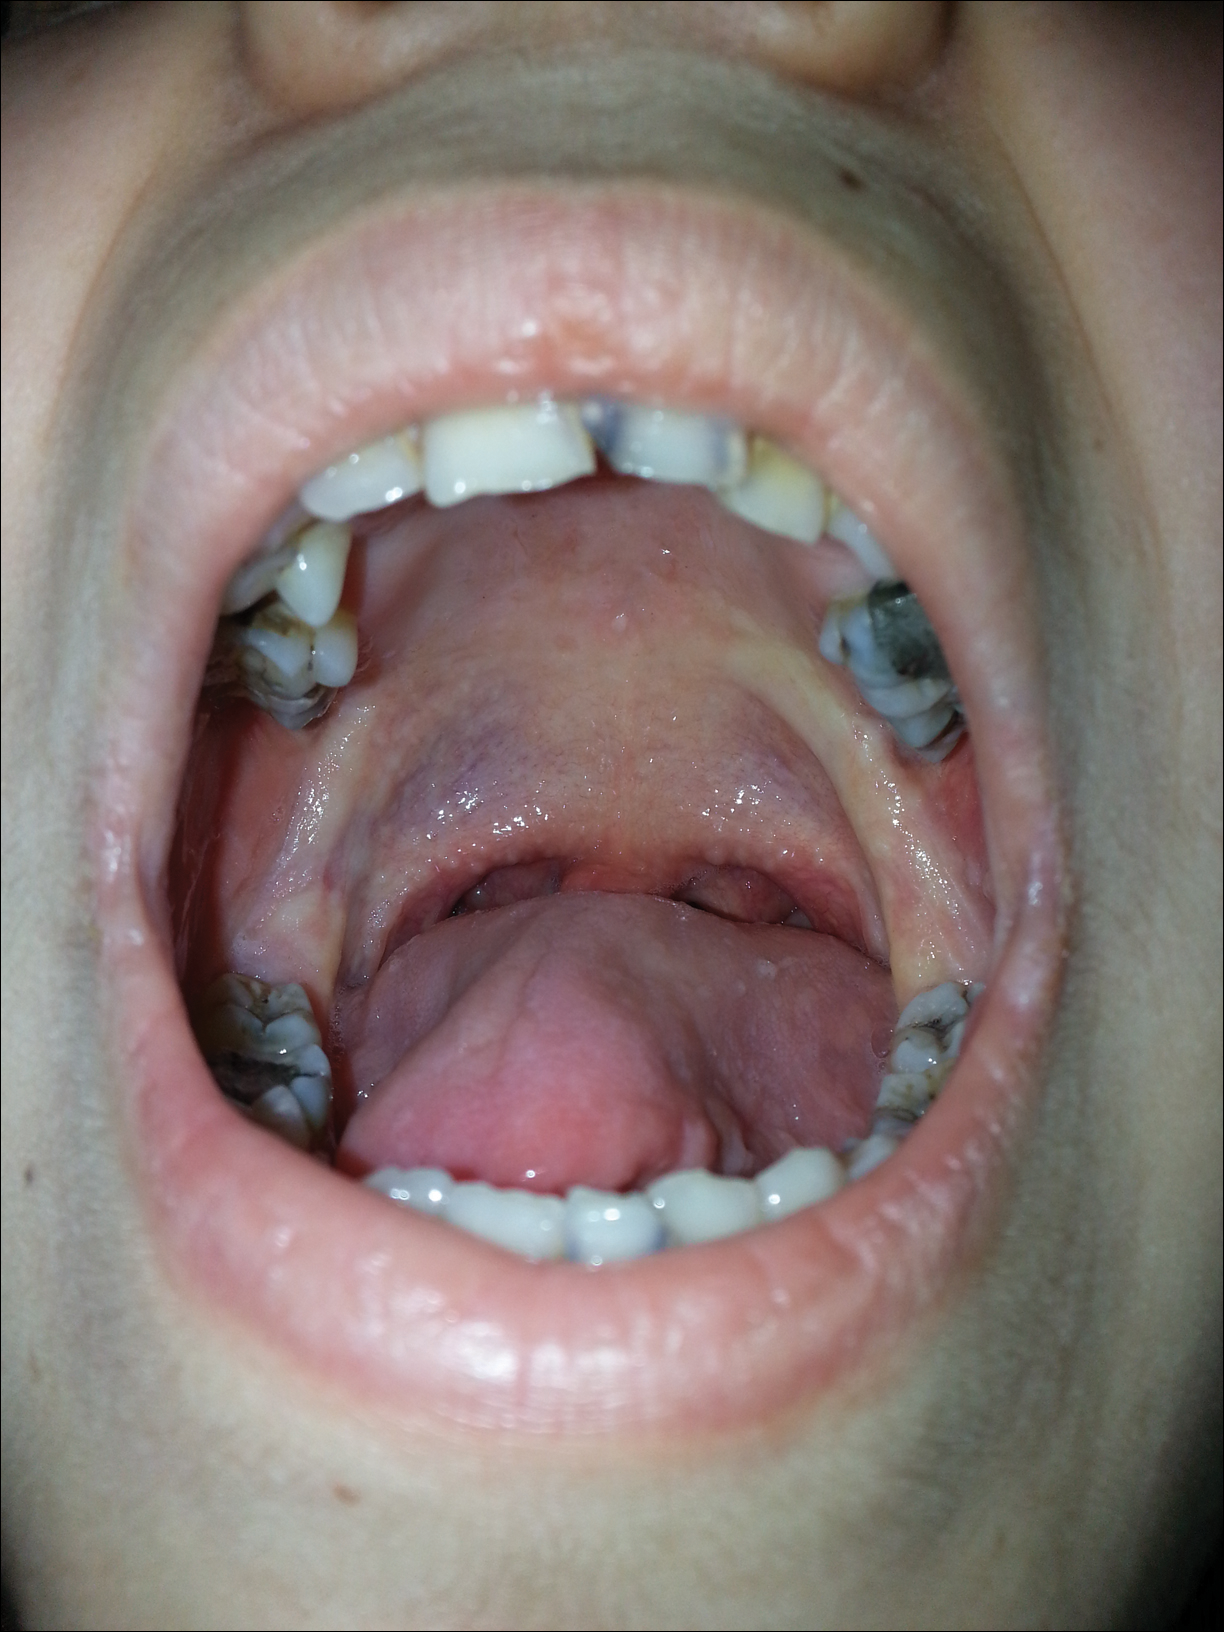
The clinical spectrum of LP is primarily related to respiratory, skin, and neurologic manifestations, but any organ involvement may be seen. A childhood-onset weak cry or hoarseness usually is the first clinical sign of LP due to infiltration of the laryngeal mucosa.3-6 A thickened frenulum, which manifests as restricted tongue movements, is another reliable clinical sign of LP.7 In addition, yellow-white submucous infiltrates on other mucosal surfaces (eg, pharynx, tongue, soft palate, esophagus)(Figure 1), occlusion of the salivary ducts (recurrent parotitis), dental anomalies, and dental caries (Figure 2) also may be seen.5,7

Related to cutaneous manifestations of LP, lesions that present in early childhood are characterized by vesicles, erosions, and hemorrhagic crusts that result in pocklike (Figure 3), linear, or cribriform scarring on the face and extremities, either following trauma or spontaneously.6,7 Second-stage skin lesions are beaded papules (moniliform blepharosis) along the eyelid margins; generalized cutaneous thickening with yellowish discoloration; and waxy papules, hyperkeratosis, or verrucous plaques/nodules on the hands, forehead, axillae, scrotum, elbows, or knees.1,5

Neurological manifestations usually occur as epilepsy and psychiatric problems, which are likely due to intracranial calcification within the amygdala or the temporal lobe. Bean-shaped calcification in the temporal lobe is seen as a pathognomonic radiographic finding.7 Other manifestations including drusenlike fundal lesions, corneal deposits with diminution of vision, and visceral involvement may be seen.7,8
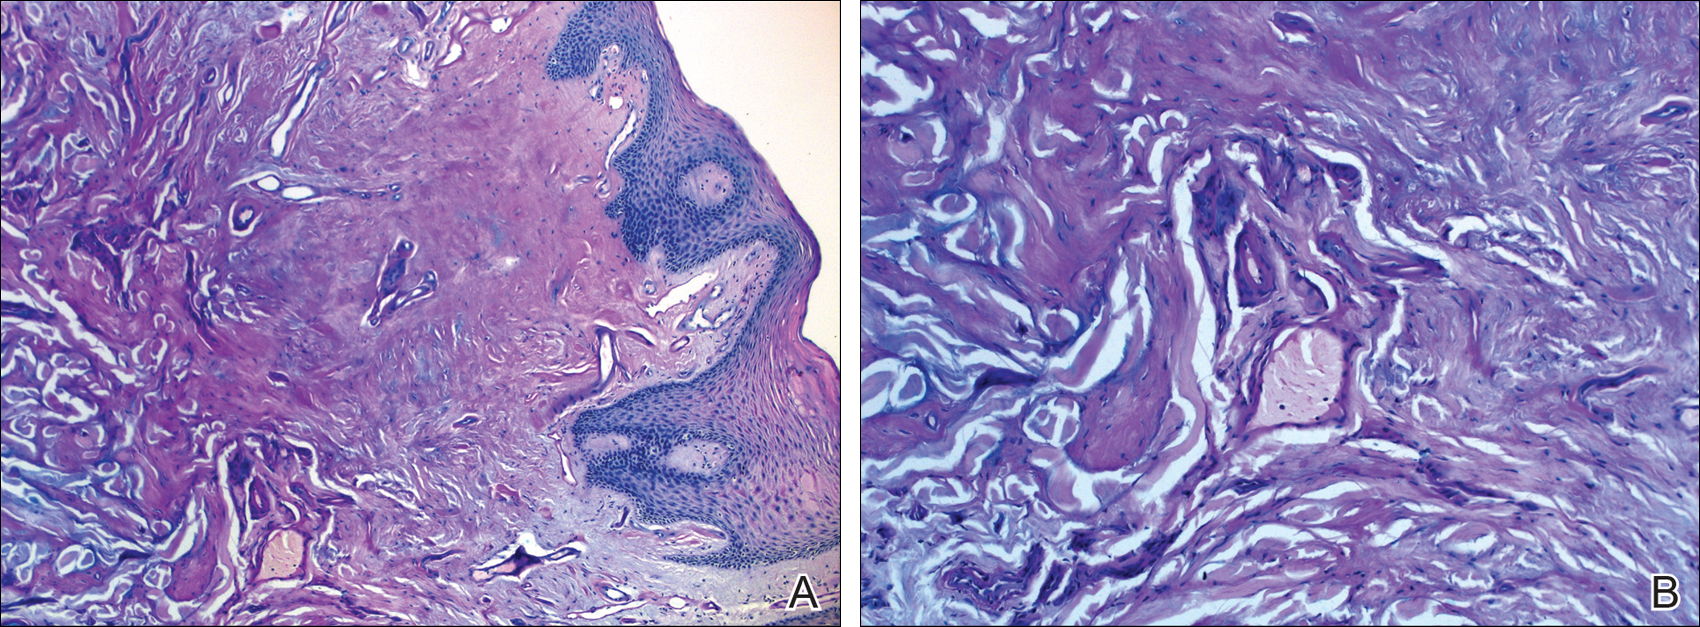
Histologically, deposition of eosinophilic homogeneous material is seen around the blood vessels and sweat glands as well as in the dermis and dermoepidermal junction (Figure 4).1,5 Although most patients with LP have a slowly progressive benign course that stabilizes in early adult life, some morbidities and complications may occur (eg, rarely upper respiratory tract involvement can progress and require tracheostomy). There presently is no cure for LP, but some drugs (eg, oral dimethyl sulfoxide, etretinate, acitretin, penicillamine) and laser ablation/dermabrasion of papules are helpful in some cases.1,7
- Sarkany RPE, Breathnach S, Morris AAM, et al. Metabolic and nutritional disorders. In: Burns T, Breathnach S, Cox N, et al, eds. Rook's Textbook of Dermatology. 8th ed. Vol 2. Singapore: Wiley-Blackwell; 2010:59.41-59.42.
- Hamada T, McLean WH, Ramsay M, et al. Lipoid proteinosis maps to 1q21and is caused by mutations in the extracellular matrix protein 1 gene (ECM1). Hum Mol Genet. 2002;11:833-840.
- Bakry OA, Samaka RM, Houla NS, et al. Two Egyptian cases of lipoid proteinosis successfully treated with acitretin. J Dermatol Case Rep. 2014;8:29-34.
- Dogramaci AC, Celik MM, Celik E, et al. Lipoid proteinosis in the eastern Mediterranean region of Turkey. Indian J Dermatol Venereol Leprol. 2012;78:318-322.
- Franke I, Gollnick H. Deposition diseases. In: Bolognia JL, Jorizzo JL, Rapini RP, eds. Dermatology. 2nd ed. Spain: Mosby Elsevier; 2008:633-640.
- Parmar NV, Krishna CV, De D, et al. Papules, pock-like scars, and hoarseness of voice. lipoid proteinosis. Indian J Dermatol Venereol Leprol. 2013;79:136.
- Dyer JA. Lipoid proteinosis. In: Wolff K, Goldsmith LA, Katz SI, et al, eds. Fitzpatrick's Dermatology in General Medicine. 7th ed. New York, NY: McGraw-Hill; 2007:1288-1292.
- Gutte R, Sanghvi S, Tamhankar P, et al. Lipoid proteinosis: histopathological characterization of early papulovesicular lesions. Indian Dermatol Online J. 2012;3:148-149.
The Diagnosis: Lipoid Proteinosis
Lipoid proteinosis (LP), also known as hyalinosis cutis et mucosae or Urbach-Wiethe disease, is a rare autosomal-recessive disorder. It is characterized by deposition of hyalinelike material in multiple organs including the skin, oral mucosa, larynx, and brain. The underlying defect is mutations in the extracellular matrix protein 1 gene, ECM1, which binds to various proteins (eg, perlecan, fibulins, matrix metalloproteinase 9) and plays a role in angiogenesis and epidermal differentiation.1-4
The clinical spectrum of LP is primarily related to respiratory, skin, and neurologic manifestations, but any organ involvement may be seen. A childhood-onset weak cry or hoarseness usually is the first clinical sign of LP due to infiltration of the laryngeal mucosa.3-6 A thickened frenulum, which manifests as restricted tongue movements, is another reliable clinical sign of LP.7 In addition, yellow-white submucous infiltrates on other mucosal surfaces (eg, pharynx, tongue, soft palate, esophagus)(Figure 1), occlusion of the salivary ducts (recurrent parotitis), dental anomalies, and dental caries (Figure 2) also may be seen.5,7
Related to cutaneous manifestations of LP, lesions that present in early childhood are characterized by vesicles, erosions, and hemorrhagic crusts that result in pocklike (Figure 3), linear, or cribriform scarring on the face and extremities, either following trauma or spontaneously.6,7 Second-stage skin lesions are beaded papules (moniliform blepharosis) along the eyelid margins; generalized cutaneous thickening with yellowish discoloration; and waxy papules, hyperkeratosis, or verrucous plaques/nodules on the hands, forehead, axillae, scrotum, elbows, or knees.1,5
Neurological manifestations usually occur as epilepsy and psychiatric problems, which are likely due to intracranial calcification within the amygdala or the temporal lobe. Bean-shaped calcification in the temporal lobe is seen as a pathognomonic radiographic finding.7 Other manifestations including drusenlike fundal lesions, corneal deposits with diminution of vision, and visceral involvement may be seen.7,8
Histologically, deposition of eosinophilic homogeneous material is seen around the blood vessels and sweat glands as well as in the dermis and dermoepidermal junction (Figure 4).1,5 Although most patients with LP have a slowly progressive benign course that stabilizes in early adult life, some morbidities and complications may occur (eg, rarely upper respiratory tract involvement can progress and require tracheostomy). There presently is no cure for LP, but some drugs (eg, oral dimethyl sulfoxide, etretinate, acitretin, penicillamine) and laser ablation/dermabrasion of papules are helpful in some cases.1,7
- Sarkany RPE, Breathnach S, Morris AAM, et al. Metabolic and nutritional disorders. In: Burns T, Breathnach S, Cox N, et al, eds. Rook's Textbook of Dermatology. 8th ed. Vol 2. Singapore: Wiley-Blackwell; 2010:59.41-59.42.
- Hamada T, McLean WH, Ramsay M, et al. Lipoid proteinosis maps to 1q21and is caused by mutations in the extracellular matrix protein 1 gene (ECM1). Hum Mol Genet. 2002;11:833-840.
- Bakry OA, Samaka RM, Houla NS, et al. Two Egyptian cases of lipoid proteinosis successfully treated with acitretin. J Dermatol Case Rep. 2014;8:29-34.
- Dogramaci AC, Celik MM, Celik E, et al. Lipoid proteinosis in the eastern Mediterranean region of Turkey. Indian J Dermatol Venereol Leprol. 2012;78:318-322.
- Franke I, Gollnick H. Deposition diseases. In: Bolognia JL, Jorizzo JL, Rapini RP, eds. Dermatology. 2nd ed. Spain: Mosby Elsevier; 2008:633-640.
- Parmar NV, Krishna CV, De D, et al. Papules, pock-like scars, and hoarseness of voice. lipoid proteinosis. Indian J Dermatol Venereol Leprol. 2013;79:136.
- Dyer JA. Lipoid proteinosis. In: Wolff K, Goldsmith LA, Katz SI, et al, eds. Fitzpatrick's Dermatology in General Medicine. 7th ed. New York, NY: McGraw-Hill; 2007:1288-1292.
- Gutte R, Sanghvi S, Tamhankar P, et al. Lipoid proteinosis: histopathological characterization of early papulovesicular lesions. Indian Dermatol Online J. 2012;3:148-149.

A 21-year-old woman (born of consanguineous parents) presented with asymptomatic, waxy, white, beaded papules along the eyelid margins of 6 years' duration. Physical examination revealed moniliform blepharosis over the eyelid margins, multiple linear and pocklike scars on the face and arm, pebbling on the lower lip and oropharynx, and hoarseness that was present since early infancy. Medical history was unremarkable for systemic disorders and routine laboratory tests were within reference range. Pathological examination of a papule on the lower lip mucosae revealed perivascular deposition of eosinophilic homogeneous material.

HHS Awards Grants to Improve Rural Patient Care
The Health Resources and Services Administration has awarded more than $16 million to improve access to quality healthcare in rural communities. The awards include funding to expand use of telehealth technology for veterans and other patients.
Administered by the Federal Office of Rural Health Policy (FORHP), the awards will support 60 rural communities in 32 states, along with 7 Rural Health Research Centers.
Related: Shared Medical Appointments for Glycemic Management in Rural Veterans
Flex Rural Veterans Health Access Program will receive 3 awards of $300,000 for 3 years to use telehealth and health information technology to bring mental health and other health services to veterans in rural areas. The program began 3 years ago in collaboration with the VA Office of Rural Health, and has helped test the effectiveness of community partnerships that can be replicated in other remote areas.
Telehealth Network Grant Program will receive approximately $300,000 annually for 21 community health organizations for up to 3 years to help build sustainable telehealth programs and networks in medically underserved areas. The program particularly encourages teleconnections to School Based Health Centers; all networks receiving the award include at least 1.
Related: Telehealth for Native Americans With PTSD
Seven Rural Health Research Centers will receive $700,000 annually for 4 years to conduct rural-focused health services research that helps health care providers and decision makers better understand the challenges faced by rural communities.
Another $4,065,624 will go to 21 member organizations of the Small Health Care Provider Quality Improvement project over 3 years. The organizations will use the money to improve the quality of care for populations with high rates of chronic conditions. The program focus on supporting rural primary care providers as they implement quality improvement activities and furthering coordination of care using evidence-based treatment.
Related: Clinical Video Telehealth for Gait and Balance
“These grants encourage and support collaboration at the community level, expanding and strengthening the safety net with networks of care in rural areas,” says FORHP Associate Administrator Tom Morris. “Collaboration among different providers of health and social services within a community means shared resources, shared expertise, and shared innovations.”
Palliative Care May Improve End-of-Life Care for Patients with ESRD, Cardiopulmonary Failure, Frailty
Clinical Question: Is there a difference in family-rated quality of care for patients dying with different serious illnesses?

Background: End-of-life care has focused largely on cancer patients. However, other conditions lead to more deaths than cancer in the United States.
Study Design: A retrospective cross-sectional study.
Setting: 146 inpatient Veterans Affairs (VA) facilities.
Synopsis: This study included 57,753 patients who died in inpatient facilities with a diagnosis of cancer, dementia, end-stage renal disease (ESRD), cardiopulmonary failure (heart failure or chronic obstructive pulmonary disease), or frailty. Measures included palliative care consultations, do-not-resuscitate (DNR) orders, death in inpatient hospice, death in the intensive care unit (ICU), and family-reported quality of end-of-life care. Palliative care consultations were given to 73.5% of patients with cancer and 61.4% of patients with dementia, which was significantly more than patients with other diagnoses (P < .001).
Approximately one-third of patients with diagnoses other than cancer or dementia died in the ICU, which was more than double the rate among patients with cancer or dementia (P < .001). Rates of excellent quality of end-of-life care were similar for patients with cancer and dementia (59.2% and 59.3%) but lower for other conditions (P = 0.02 when compared with cancer patient). This was mediated by palliative care consultation, setting of death, and DNR status. Difficulty defining frailty and restriction to only the VA system are limitations of this study.
Bottom Line: Increasing access to palliative care, goals-of-care discussions, and preferred setting of death may improve overall quality of end-of-life care.
Citation: Wachterman MW, Pilver C, Smith D, Ersek M, Lipsitz SR, Keating NL. Quality of end-of-life care provided to patients with different serious illnesses. JAMA Intern Med. 2016;176(8):1095-1102. doi:10.1001/jamainternmed.2016.1200.
Clinical Question: Is there a difference in family-rated quality of care for patients dying with different serious illnesses?
Background: End-of-life care has focused largely on cancer patients. However, other conditions lead to more deaths than cancer in the United States.
Study Design: A retrospective cross-sectional study.
Setting: 146 inpatient Veterans Affairs (VA) facilities.
Synopsis: This study included 57,753 patients who died in inpatient facilities with a diagnosis of cancer, dementia, end-stage renal disease (ESRD), cardiopulmonary failure (heart failure or chronic obstructive pulmonary disease), or frailty. Measures included palliative care consultations, do-not-resuscitate (DNR) orders, death in inpatient hospice, death in the intensive care unit (ICU), and family-reported quality of end-of-life care. Palliative care consultations were given to 73.5% of patients with cancer and 61.4% of patients with dementia, which was significantly more than patients with other diagnoses (P < .001).
Approximately one-third of patients with diagnoses other than cancer or dementia died in the ICU, which was more than double the rate among patients with cancer or dementia (P < .001). Rates of excellent quality of end-of-life care were similar for patients with cancer and dementia (59.2% and 59.3%) but lower for other conditions (P = 0.02 when compared with cancer patient). This was mediated by palliative care consultation, setting of death, and DNR status. Difficulty defining frailty and restriction to only the VA system are limitations of this study.
Bottom Line: Increasing access to palliative care, goals-of-care discussions, and preferred setting of death may improve overall quality of end-of-life care.
Citation: Wachterman MW, Pilver C, Smith D, Ersek M, Lipsitz SR, Keating NL. Quality of end-of-life care provided to patients with different serious illnesses. JAMA Intern Med. 2016;176(8):1095-1102. doi:10.1001/jamainternmed.2016.1200.

Patients’ Out-of-Pocket Spending Increasing
Clinical Question: How much are insured nonelderly adult patients paying out of pocket for inpatient care, and does that amount vary over time or by patient characteristics, region, or type of insurance?
Background: Prior estimates have been based on patient-reported survey data. This is the first study to find nationwide out-of-pocket expenditure for inpatient hospitalizations.
Study Design: Retrospective analysis.
Setting: Medical claims data from Aetna, UnitedHealthcare, and Humana including 7.3 million hospitalizations from 2009 to 2013.
Synopsis: Authors used the Health Care Cost Institute (HCCI) database and studied inpatient hospitalization for ages 18–64. The adjusted total cost sharing per inpatient hospitalization increased by 37% (from $738 in 2009 to $1,013 in 2013). Both the mean amount of coinsurance and deductibles increased during this period by 33% (from $518 to $688) and 86% (from $145 to $270), respectively. The mean copayment decreased by 27% (from $75 to $55).
Increase in cost sharing was lowest in individual-market and consumer-directed health plans, although both had highest cost sharing.
Total cost sharing increased in every state. The largest increases were seen in Georgia, Louisiana, and Colorado. In 2013, the states with the highest cost sharing were Utah, Alaska, and Oregon.
Acute myocardial infarction and acute appendicitis saw maximum rise in out-of-pocket spending; both surpassed $1,500 in 2013. Cost sharing associated with procedures was lower.
Bottom Line: Even after adjusting for inflation and case-mix differences, the total cost sharing per inpatient hospitalization increased between 2009 and 2013. Policymakers and patients need to pay attention to these trends.
Citation: Adrion ER, Ryan AM, Seltzer AC, Chen LM, Ayanian JZ, Nallamothu BK. Out-of-pocket spending for hospitalizations among nonelderly adults. JAMA Intern Med. 2016;176(9)1325-1332.
Short Take
Aspirin Is Being Used Instead of Anticoagulation in Afib
Despite recommendations to anticoagulate patients with CHADS2 /CHA2DS2-VASc scores of ≥2, more than one-third of the patients in a large population of cardiology outpatients were treated with aspirin alone.
Citation: Hsu JC, Maddox TM, Kennedy K, et al. Aspirin instead of oral anticoagulant prescription in atrial fibrillation patients at risk for stroke. J Am Coll Cardiol. 2016;67(25):2913-2923.
Finally, Some Good News!
August 2016 provided 2 impressive news stories. These stories have far more salience and granularity than I can began to entertain in this brief editorial, but they show that the VA with all its systemic problems has unrivaled potential to promote what Aristotle called human flourishing.
A past director of mine greeted any small success or positive accomplishment of the facility and its employees with the folksy aphorism “You have to celebrate when you can in this outfit.” He was wise, for he knew that taking a respite to recognize a job well done is crucial to the emotional wellness of the workforce. And after that moment of satisfaction, everyone gets back to work at least a little bit recharged. So in this editorial, I will praise a few recent, unique VA achievements that underscore the importance of keeping the organization not only upright, but also doing right.
On August 1, President Obama announced that since 2010 veteran homelessness had been reduced by almost half. VA Secretary Robert A. McDonald also applauded a 56% decrease in unsheltered homeless veterans. Yet just as quickly, he refocused the collaborating agencies on the goal of ending veteran homelessness, which seemed a long shot when initially announced but now seems to have a realistic chance of success. “Although this achievement is noteworthy, we will not rest until every veteran in need is permanently housed,” McDonald said.
Three large government agencies and extensive partnerships cooperated to keep 360,000 veterans and their families from being homeless. But each veteran also had the outreach and support of a HUD-VASH (U.S. Department of Housing and Urban Development and VA Supportive Housing) worker and counterparts in the community. It is hard to see how any other health care organization could leverage this large an effort or would choose to dedicate its federal, state, and city resources to meet a need so basic that without it few persons can move up Maslow’s hierarchy of human actualization.
The same week the VA Research and Development program gave all of us in federal service a reason to hold up our collective heads a little higher announcing that the Million Veteran Program (MVP) had enrolled its 500,000th participant, making it the largest genomic database in the world. Once again, it is difficult to imagine any other health care organization, except another federal agency like the National Institutes of Health, mounting such an ambitious research initiative.
The MVP offers a databank—the likes of which has never been assembled—to study some of the most common and debilitating conditions, such as mental illness, substance use, and kidney and heart disease among many others. The combination of environmental genetics and clinical and psychosocial data will open doors of discoveries for thousands of people, veteran and nonveteran alike. Secretary McDonald applauded the most important ethical aspect of the project, the incomparable altruism of veterans, “Many of our veterans have saved lives on the battlefield and because of their participation in MVP, their participation has the potential to save countless lives—now and for generations to come.”
These 2 amazing initiatives have more in common than may seem apparent at first glance. Besides their intrinsic worth in humanist service and scientific creativity, respectively, putting veterans in homes and constructing a repository of scientific knowledge show that the VA—once accused of being a dinosaur ignoring the plummeting temperatures of its own ice age—has demonstrated remarkable instantiation of the I CARE Core Characteristics of agility and innovation (available at http://www.va.gov/icare) in the campaign to end homelessness and the MVP initiative.
These good-news stories celebrate the immense power of the VA to change the world for the better. This is reason enough to keep the faith that VA will emerge from the hearings and the headlines as a workforce proud of their privilege to care for veterans and contribute to the common good.
Immunotherapy produces CRs in kids with rel/ref ALL
The bispecific T-cell engager (BiTE®) antibody blinatumomab can produce complete responses (CRs) in pediatric patients with relapsed/refractory B-cell precursor acute lymphoblastic leukemia (ALL), according to a phase 1/2 study published in the Journal of Clinical Oncology.
Of the patients who received the recommended dosage of blinatumomab, 39% achieved a CR within the first 2 treatment cycles.
And 52% of these patients achieved a complete minimal residual disease (MRD) response.
“This study showed that [blinatumomab] can induce deep molecular remissions in children with highly refractory, multiply relapsed ALL,” said study author Lia Gore, MD, of University of Colorado Anschutz Medical Campus in Aurora, Colorado.
However, most of these remissions did not last. Although a few of the complete responders were still alive and in CR at the study’s 2-year follow-up, more than half had relapsed, and two-thirds had died.
This trial, known as Study ‘205, was supported by Amgen.
Study ‘205 included 93 pediatric patients with relapsed or refractory B-cell precursor ALL. Patients received blinatumomab as a continuous intravenous infusion—49 patients in the phase 1 portion of the trial and 44 in phase 2. The patients were followed for 2 years.
Toxicities and recommended dose
There were 4 dose-limiting toxicities during the phase 1 portion of the trial, and 2 of these events were fatal. One patient treated at 15 μg/m2/day developed grade 4 cytokine release syndrome (CRS), which was deemed related to grade 4 gastrointestinal hemorrhage.
Two patients treated at 30 μg/m2/day had grade 4 CRS. One case was attributed to grade 5 cardiac failure, and the other was treated successfully with tocilizumab.
One patient treated at 15 μg/m2/day had grade 5 respiratory failure with cardiac arrest after hypotonia and muscle weakness after 7 days of infusion with blinatumomab. This patient experienced febrile neutropenia and pneumonia shortly before the start of the infusion.
Based on these toxicities, the maximum-tolerated dose of blinatumomab was 15 μg/m2/day, but a step-wise dosage was recommended to reduce the risk of CRS.
So the recommended dose was 5 μg/m2/day on days 1-7 and 15 μg/m2/day on days 8-28 for cycle 1, and 15 μg/m2/day on days 1-28 for subsequent cycles.
Dose adjustment was possible in case of adverse events. Patients who responded to blinatumomab but later relapsed had the option to be retreated with blinatumomab.
Treatment at recommended dose
Seventy patients received at least 1 infusion of blinatumomab at the recommended dose. The median number of treatment cycles was 1 (range, 1 to 5).
The patients’ median age was 8 years (range, 7 months to 17 years). Forty patients (57%) had undergone allogeneic transplant prior to receiving blinatumomab, and 39 (56%) had refractory disease. Four patients had less than the 25% bone marrow blasts required for protocol entry but had more than 5% blasts.
Adverse events
The most common adverse events among the patients who received the recommended dose of blinatumomab were pyrexia (80%), anemia (41%), nausea (33%), and headache (30%).
The most frequent grade 3 or higher events were anemia (36%), thrombocytopenia (21%), febrile neutropenia (17%), hypokalemia (17%), and neutropenia (17%).
Eight patients developed CRS. Three had grade 3 and 1 had grade 4 CRS. Two of these patients had treatment interruptions, and 2 discontinued treatment permanently. All 4 patients achieved a CR.
Ten patients (14%) had treatment interruptions due to adverse events, and 4 (6%) discontinued treatment permanently because of adverse events.
Six patients had fatal adverse events. Three died after they went on to allogeneic transplant—1 of multiorgan failure, 1 of sepsis, and 1 of respiratory failure. The 3 other deaths were due to fungal infection, multiorgan failure, and thrombocytopenia.
Response and follow-up
Among the 70 patients who received the recommended dose of blinatumomab, 27 (39%) achieved a CR within the first 2 cycles. Fourteen of these patients (52%) achieved complete MRD response.
CRs were achieved across subgroups, and complete MRD response rates were similar across subgroups.
Thirteen of the 27 patients (48%) who achieved a CR went on to receive an allogeneic transplant.
At the end of the 2-year follow-up, 4 of the 27 complete responders were still in remission.
Two of the patients had relapsed but were still alive, 3 had withdrawn consent (1 in CR and 2 after relapse), 3 had died in CR after transplant, and 15 had relapsed and died.
Of the 43 patients who did not achieve a CR within the first 2 treatment cycles, 8 were still alive at the end of the 2-year follow-up. ![]()
Speaker outlines importance of cell of origin in DLBCL

NEW YORK—The importance of cell of origin in choosing a treatment for diffuse large B-cell lymphoma (DLBCL) is a topic “that has been kicking around for 16 years,” according to a speaker at the NCCN 11th Annual Congress: Hematologic Malignancies.
Cell of origin was first described in the year 2000 as a distinguishing factor in large-cell lymphoma, said the speaker, Andrew Zelenetz, MD, PhD, of Memorial Sloan Kettering Cancer Center in New York, New York.
The cell of origin in DLBCL—whether it’s germinal center B cell (GCB), activated B cell (ABC), or unclassified—contributes to biological and clinical heterogeneity of the disease.
“And more importantly, activated B-cell diffuse large B-cell lymphoma and germinal center diffuse large B-cell lymphoma are simply different diseases,” Dr Zelenetz said.
He then elaborated on the importance of cell of origin in treating DLBCL.
Biology
Dr Zelenetz noted that ABC and GCB lymphomas have different molecular pathways. ABC lymphomas are very dependent on the NF-kB pathway and have more active signaling through the B-cell receptor.
The GCB lymphomas tend to have more tonic regulation, and the PI3 kinase/mTOR pathway is more critical. GCB lymphomas have more genomic instability.
“So cell of origin determination identifies tumors with distinct biology, may provide prognostic information, and may be predictive for treatment selection,” Dr Zelenetz said. “Unfortunately, cell of origin is not the whole story.”
Gene mutations occur in large-cell lymphoma “just like every other cancer,” Dr Zelenetz said. And the vast majority occur in both lymphoma subtypes, he added, further complicating our understanding of the biology of these tumors.
Some of these mutations predict for sensitivity to treatment, while others predict for resistance. For example, CARD11 predicts for resistance to ibrutinib, while CD79b predicts for sensitivity.
Determining the cell of origin
Gene-expression profiling on fresh tissue is considered the gold standard, but “it is clearly not a clinical tool,” Dr Zelenetz said. It requires the Wright classifier, a statistical method based on Bayes’ rule, to make patient-level assignments to 1 of the 3 subgroups.
Immunohistochemistry is widely available, but reproducibility may be difficult. Many assays exist, such as the Hans, Choi, and Muris assays, but, in many studies, there may be a lack of correlation with gene-expression profiling.
In the last few years, gene-expression profiling of formalin‐fixed paraffin‐embedded (FFPE) tissue has emerged as a reliable method. The assay is reproducible between laboratories, and it’s reproducible between different sets of reagents.
“[T]here is tremendous correlation between the Lymph2Cx assay and the gold standard,” Dr Zelenetz added.
“So here we have a robust assay,” he said, which allows investigators to explore whether the cell of origin is prognostic in large-cell lymphoma.
Prognosis
In a data set of 339 patients with de novo DLBCL treated with R-CHOP (rituximab, cyclophosphamide, doxorubicin, vincristine, and prednisone), the Lymph2Cx assay showing cell of origin was predictive of overall and progression-free survival.
However, the same exact assay applied to the RICOVER-60 data from the German High-Grade Non-Hodgkin Lymphoma Study group was not predictive, Dr Zelenetz reported, based on a personal communication from one of the investigators. There was a slight trend in favor of GCB tumors, but it was not statistically significant.
And the REMoDL-B study, using gene-expression profiling of FFPE tissue with the DASL assay, also didn’t show any difference in outcome between ABC or GCB tumors.
So gene-expression profiling of FFPE tissue does not universally show a prognostic difference, Dr Zelenetz said.
Influence of chemotherapy by cell of origin
CALGB 59910 showed that GCB tumors had a superior event-free, progression-free, and overall survival with dose-adjusted EPOCH-R (etoposide, prednisone, vincristine, cyclophosphamide, doxorubicin, and rituximab) compared to ABC tumors.
“However, this is a phase 2, hypothesis-generating experiment,” Dr Zelenetz pointed out, and the results of the confirmatory study comparing dose-adjusted EPOCH-R and R-CHOP21 (CALGB 50303) will be presented later this year at the ASH Annual Meeting.
Sequential, non-cross-resistant chemotherapy
Data from the Memorial Sloan Kettering study (MSKCC 01-142/08-146; NCT00712582) of sequential therapy with R-CHOP followed by ICE (ifosfamide, carboplatin, and etoposide) demonstrate “excellent” progression-free and overall survival, Dr Zelenetz said.
“When we analyzed the outcome by cell of origin, there was a suggestion that the patients with the non-germinal center tumors were actually doing better than the germinal center tumors,” he added.
He pointed out one of the limitations of the study is that the cell of origin was determined by the Hans model. Nevertheless, the study raised another testable hypothesis: sequential therapy might overcome the adverse impact of the non-germinal center tumors.
Cell of origin analysis of the prospective, randomized study (LNH 03-2B) comparing R-ACVBP (rituximab, doxorubicin, cyclophosphamide, vindesine, bleomycin, and prednisone) to R-CHOP showed that whether patients with GCB tumors received CHOP or ACVBP didn’t make “a whit of difference,” Dr Zelenetz said, in terms of progression-free and overall survival.
However, patients with ABC tumors demonstrated an “enormous difference in favor of R-ACVBP,” he said.
“Again, evidence that you can overcome the adverse effect of the ABC tumors with chemotherapy.”
Dr Zelenetz pointed out that R-ACVBP and R-CHOP followed by ICE are “actually remarkably similar regimens.” Both are sequential, both include consolidation, and both incorporate high-dose ifosfamide and etoposide.
“[S]o they actually reinforce each other,” he said, “demonstrating a similar result.”
Lenalidomide
Lenalidomide in the relapsed/refractory setting has modest activity in DLBCL, with most of the benefit accruing to patients with non-germinal center tumors.
Two clinical studies evaluated the impact of adding lenalidomide to standard chemotherapy.
In an Italian series using lenalidomide (L) plus R-CHOP21 in elderly untreated patients, the combination produced outstanding progression-free and event-free survival, but with no significant differences between the subtypes.
A US study of RL-CHOP versus R-CHOP included 87 matched historical controls treated with R-CHOP and 64 patients treated with RL-CHOP. Patients with non-germinal center tumors treated with RL-CHOP fared much better than historical controls treated with R-CHOP.
However, among germinal center tumors, “there was not a hint of any difference,” Dr Zelenetz noted.
Two studies—E1412, using an unselected population, and the international ROBUST study, selecting for patients with ABC tumors—are underway to confirm that the benefit with lenalidomide is in patients with activated B-cell tumors.
Ibrutinib
Ibrutinib, a Bruton’s tyrosine kinase inhibitor, also has modest activity as a single agent in an unselected patient population with relapsed/refractory DLBCL. And most of the patients who demonstrated benefit had activated B-cell tumors.
Upon further analysis, investigators found that response was enhanced by the CD79b mutation, but it was not necessary for a response. And patients with CARD11 had no response.
MYD88 mutations seemed to cause resistance to ibrutinib, unless the mutation was associated with the CD79b mutation, and then patients had a “great” response, Dr Zelenetz explained.
In the upfront setting, a phase 1b study of R-CHOP plus ibrutinib demonstrated the safety of the combination, which had an overall survival rate of 100% and a complete response rate of 91%.
The prospective, randomized, phase 3 PHOENIX trial (NCT01855750) evaluating the combination in newly diagnosed non-germinal center DLBCL has completed accrual, but analysis is still pending.
Conclusion
“The prognostic significance of cell of origin is still controversial,” Dr Zelenetz wrapped up, “although I actually believe there is a prognostic difference in unselected registry patients.”
Sequential chemotherapy with ifosfamide and etoposide consolidation does very well in activated B-cell tumors, both in phase 2 and phase 3 studies.
“Importantly, small molecules seem to have differential effects totally predictable based on the biology of the difference between activated B-cell and germinal center tumors,” Dr Zelenetz said.
“But the big wild card here is somatic mutations further complicate things and will have to be incorporated into our understanding in the selection of patients.” ![]()
Study shows more bleeding with rivaroxaban than dabigatran

A large, retrospective study comparing first-time users of rivaroxaban and dabigatran suggests that rivaroxaban poses a higher risk of bleeding in elderly patients with nonvalvular atrial fibrillation (NVAF).
Treatment with rivaroxaban was associated with significant increases in intracranial hemorrhage (ICH) and major extracranial bleeding, a nonsignificant reduction in thromboembolic stroke, and a nonsignificant increase in mortality.
David J. Graham, MD, of the US Food and Drug Administration in Silver Spring, Maryland, and his colleagues reported these results in JAMA Internal Medicine.
The investigators analyzed 118,891 NVAF patients older than 65 who were enrolled in Medicare. The patients had started treatment with dabigatran (150 mg twice daily) or rivaroxaban (20 mg once daily) from November 4, 2011, through June 30, 2014.
There were 52,240 patients receiving dabigatran and 66,651 receiving rivaroxaban.
The study’s primary outcomes were thromboembolic stroke, ICH, major extracranial bleeding events (including major gastrointestinal bleeding), and mortality.
The investigators adjusted for differences in baseline characteristics and calculated hazard ratios (HRs) for the primary outcomes. They also calculated adjusted incidence rate differences.
The data showed that, compared to patients who received dabigatran, those who received rivaroxaban had:
- 1.8 fewer cases of thromboembolic stroke per 1000 person-years (HR=0.81; 95% CI, 0.65-1.01; P=0.07)
- 2.3 excess cases of ICH per 1000 person-years (HR=1.65; 95% CI, 1.20-2.26; P=0.002)
- 13.0 excess cases of major extracranial bleeding per 1000 person-years (HR=1.48; 95% CI, 1.32-1.67; P<0.001)
- 9.4 excess cases of major gastrointestinal bleeding per 1000 person-years (HR=1.40; 95% CI, 1.23-1.59; P<0.001)
- 3.1 excess deaths per 1000 person-years (HR=1.15; 95% CI, 1.00-1.32; P=0.051).
The investigators noted that this study had several limitations. The mean follow-up time was 4 months, which led to a smaller sample size at longer durations of use.
In addition, the study was restricted to patients age 65 and older. Although this age group accounts for 80% of patients with NVAF, the comparative effects of treatment with dabigatran and rivaroxaban could be different in younger populations.
Because the study was observational, it may also be subject to residual confounding by unmeasured factors.
And finally, the investigators examined warfarin-naïve, first-time users of dabigatran and rivaroxaban. Results could differ in patients switching from warfarin to a novel oral anticoagulant. ![]()
Triplet improves PFS in relapsed/refractory MM
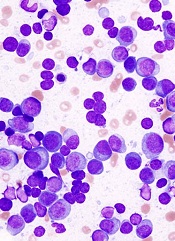
Results of the phase 3 POLLUX trial suggest that adding daratumumab to treatment with lenalidomide and dexamethasone can improve progression-free survival (PFS) in patients with relapsed or refractory multiple myeloma (MM).
Compared to patients who received only lenalidomide and dexamethasone, those who received daratumumab as well had a significantly higher response rate and longer PFS.
Treatment with daratumumab was also associated with infusion-related reactions and a higher incidence of neutropenia.
These results were published in NEJM. They were previously presented at the 21st Congress of the European Hematology Association. The POLLUX trial was funded by Janssen Research and Development.
POLLUX enrolled 569 patients who had relapsed or refractory MM. The patients were randomized to receive either daratumumab, lenalidomide, and dexamethasone (DRd, n=286) or lenalidomide and dexamethasone alone (Rd, n=283).
Patient characteristics were similar between the treatment arms. The median age was 65 in both arms (overall range, 34-89). About half of patients in each arm had ISS stage I disease, about half had an ECOG performance score of 1 or 2, and patients were, roughly, a median of 4 years from diagnosis.
In both arms, patients had a median of 1 prior lines of therapy (overall range, 1-11).
More than 60% of patients in both arms (63%-64%) had received a prior transplant; 86% had received a proteasome inhibitor; 55% had received an immunomodulatory agent; 44% had received a proteasome inhibitor and an immunomodulatory agent; and 41%-43% had received a proteasome inhibitor, an immunomodulatory agent, and an alkylating agent.
Discontinuation
At the clinical cutoff date on March 7, 2016, 23.3% (n=66) of patients in the DRd arm and 47.0% (n=132) of those in the Rd arm discontinued treatment.
The most common reasons for discontinuation were progression (14.1% in the DRd arm and 34.2% in the Rd arm) and adverse events (6.7% and 8.2%, respectively).
Response
The overall response rate among evaluable patients (281 in the DRd arm and 276 in the Rd arm) was 92.9% in DRd arm and 76.4% in the Rd arm (P<0.001).
The rates of complete response or better were 43.1% and 19.2%, respectively. And the rates of stringent complete response were 18.1% and 7.2%, respectively.
In the DRd arm, 22.4% of patients had results below the threshold for minimal residual disease (1 tumor cell per 105 white cells). The same was true for 4.6% of patients in the Rd arm (P<0.001).
PFS and OS
At a median follow-up of 13.5 months, there were 169 events of disease progression or death. The incidence was 18.5% (53/286) in the DRd arm and 41% (116/283) in the Rd arm. The hazard ratio was 0.37 (P<0.001).
At 12 months, the rate of PFS was 83.2% in the DRd arm and 60.1% in the Rd arm. The median PFS has not been reached in the DRd arm but was 18.4 months for patients in the Rd arm.
The improvement in PFS for the DRd arm was seen across all patient subgroups, regardless of age, ISS stage, prior treatment, etc.
In addition, there was an overall survival (OS) advantage with DRd. The 12-month OS was 92.1% in the DRd arm and 86.8% in the Rd arm.
The median OS was not reached in the DRd arm and was 20.3 months in the Rd arm. The hazard ratio was 0.64 (P=0.0534). The researchers said follow-up for long-term survival is ongoing.
Safety
The most common hematologic adverse events (in the DRd and Rd arms, respectively) were neutropenia (59.4% and 43.1%), anemia (31.1% and 34.9%), thrombocytopenia (26.9% and 27.4%), lymphopenia (6.0% and 5.3%), and febrile neutropenia (5.7% and 2.5%). Deep vein thrombosis occurred in 1.8% and 3.9% of patients, respectively.
The most common non-hematologic adverse events (in the DRd and Rd arms, respectively) were diarrhea (42.8% and 24.6%), fatigue (35.3% and 27.8%), upper respiratory tract infection (31.8% and 20.6%), constipation (29.3% and 25.3%), cough (29.0% and 12.5%), muscle spasms (25.8% and 18.5%), and pneumonia (14.1% and 13.2%).
Patients in the DRd arm had a higher rate of several grade 3/4 events, including neutropenia (51.9% and 37.0%), diarrhea (5.3% and 3.2%), fatigue (6.4% and 2.5%), nausea (1.4% and 0%), dyspnea (3.2% and 0.7%), and infection (28.3% and 22.8%).
Serious adverse events occurred in 48.8% of patients in the DRd arm and 42.0% in the Rd arm. Pneumonia was the most common serious event, occurring in 8.1% and 8.5% of patients, respectively.
Daratumumab-infusion-related reactions occurred in 47.7% of patients, were mostly grade 1/2, and occurred predominantly during the first infusion.
The researchers also noted that daratumumab interferes with laboratory-based blood compatibility tests because the drug binds to CD38 on red cells.
Daratumumab development
Data from the phase 3 CASTOR trial—in which researchers compared daratumumab, bortezomib, and dexamethasone to bortezomib and dexamethasone alone—were also recently published in NEJM.
“Following the publication of the phase 3 CASTOR data, we are pleased that the positive data from the phase 3 POLLUX study has now also been published in the New England Journal of Medicine,” said Jan van de Winkel, PhD, chief executive officer of Genmab.
“The data from this study formed the basis, along with data from the CASTOR study, of 2 regulatory submissions in August—the supplemental Biologics License Application submitted to the US Food and Drug Administration and the submission of the variation to the Marketing Authorization to the European Medicines Agency.”
Both submissions seek to expand the current indication for daratumumab so the drug can be used in combination with lenalidomide and dexamethasone or bortezomib and dexamethasone to treat MM patients who have received at least 1 prior therapy.
Daratumumab currently has conditional approval from the European Commission as monotherapy for adults with relapsed and refractory MM who progressed on their last therapy and have received treatment with a proteasome inhibitor and an immunomodulatory agent.
Daratumumab has accelerated approval in the US as monotherapy for MM patients who have received at least 3 prior lines of therapy, including a proteasome inhibitor and an immunomodulatory agent, or who are double-refractory to a proteasome inhibitor and an immunomodulatory agent.
Daratumumab is being developed by Janssen Biotech, Inc. under an exclusive worldwide license from Genmab to develop, manufacture, and commercialize daratumumab. ![]()