User login
How Should Common Symptoms at the End of Life be Managed?
Case
A 58-year-old male with colon cancer metastatic to the liver and lungs presents with vomiting, dyspnea, and abdominal pain. His disease has progressed through third-line chemotherapy and his care is now focused entirely on symptom management. He has not had a bowel movement in five days and he began vomiting two days ago.
Overview
The majority of patients in the United States die in acute-care hospitals. The Study to Understand Prognosis and Preferences for Outcomes and Risks of Treatments (SUPPORT), which evaluated the courses of close to 10,000 hospitalized patients with serious and life-limiting illnesses, illustrated that patients’ end-of-life (EOL) experiences often are characterized by poor symptom management and invasive care that is not congruent with the patients’ overall goals of care.1 Studies of factors identified as priorities in EOL care have consistently shown that excellent pain and symptom management are highly valued by patients and families. As the hospitalist movement continues to grow, hospitalists will play a large role in caring for patients at EOL and will need to know how to provide adequate pain and symptom management so that high-quality care can be achieved.
Pain: A Basic Tenet
A basic tenet of palliative medicine is to evaluate and treat all types of suffering.2 Physical pain at EOL is frequently accompanied by other types of pain, such as psychological, social, religious, or existential pain. However, this review will focus on the pharmacologic management of physical pain.
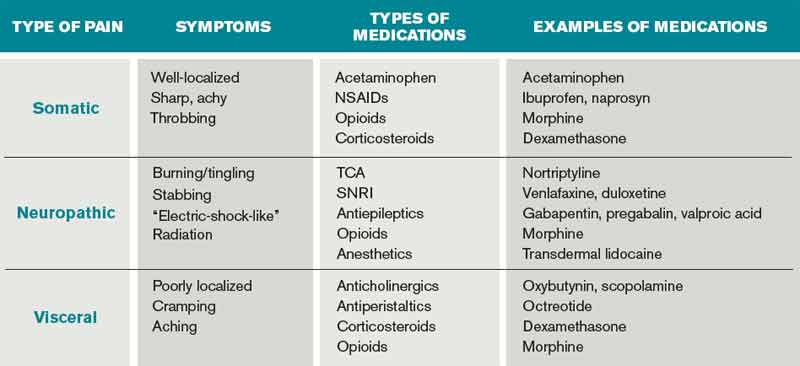
Pain management must begin with a thorough evaluation of the severity, location, and characteristics of the discomfort to assess which therapies are most likely to be beneficial (see Table 1).3 The consistent use of one scale of pain severity (such as 0-10, or mild/moderate/severe) assists in the choice of initial dose of pain medication, in determining the response to the medication, and in assessing the need for change in dose.4
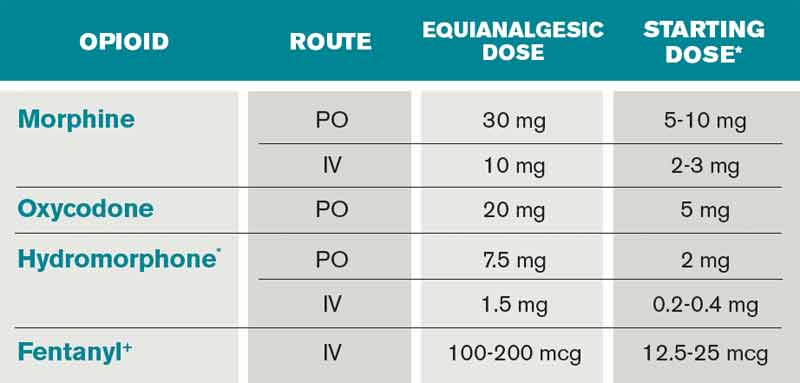
Opioids are the foundation of pain management in advanced diseases because they are available in a number of formulations and, when dosed appropriately, they are effective and safe. Starting doses and equianalgesic doses of common opioids are presented in Table 2. Guidelines recommend the use of short-acting opioids for dose titration to gain control of poorly controlled pain.3 If a patient is experiencing mild pain on a specific regimen, the medication dose can be increased up to 25%; by 25% to 50%, if pain is moderate; and 50% to 100%, if severe.5 When the pain is better-controlled, the total amount of pain medication used in 24 hours (24-hour dose) can be converted to a long-acting formulation for more consistent pain management. Because there is a constant component to most advanced pain syndromes, it is recommended that pain medication is given on a standing basis, with as-needed (prn) doses available for exacerbations of pain.3 Prn doses of short-acting medication (equivalent to approximately 10% of the 24-hour dose of medication) should be available at one- or two-hour intervals prn (longer if hepatic or renal impairment is present) for IV or PO medications, respectively.
Opioids often are categorized as low potency (i.e. codeine, hydrocodone) and high-potency (i.e. oxycodone, morphine, hydromorphone, fentanyl). When given in “equianalgesic doses,” the analgesic effect and common side effects (nausea/vomiting, constipation, sedation, confusion, pruritis) of different opioids can vary in different patients. Due to differences in levels of expressed subtypes of opioid receptors, a given patient might be more sensitive to the analgesic effect or side effects of a specific medication. Therefore, if dose escalation of one opioid is inadequate to control pain and further increases in dose are limited by intolerable side effects, rotation to another opioid is recommended.4 Tables documenting equianalgesic doses of different opioids are based on only moderate evidence from equivalency trials performed in healthy volunteers.6 Due to interpatient differences in responses, it is recommended that the equianalgesic dose of the new medication be decreased by 25% to 50% for initial dosing.5
Certain treatments are indicated for specific pain syndromes. Bony metastases respond to NSAIDs, bisphosphonates, and radiation therapy in addition to opioid medications. As focal back pain is the first symptom of spinal cord compression, clinicians should have a high index of suspicion for compression in any patient with malignancy and new back pain. Steroids and radiation therapy are considered emergent treatments for pain control and to prevent paralysis in this circumstance. Pain due to bowel obstruction is usually colicky in nature and responds well to octreotide as discussed in the section on nausea and vomiting. Steroids (such as dexamethasone 4 mg PO bid-tid) might be an effective adjuvant medication in bone pain, tumor pain, or inflammation.
*Half this dose should be used in renal or liver dysfunction and in the elderly.
Preferred in renal dysfunction.
SOURCES: Adapted from Assessment and treatment of physical pain associated with life-limiting illness. Hospice and Palliative Care Training for Physicians: UNIPAC. Vol 3. 3rd ed. Glenview, IL: American Academy of Hospice and Palliative Medicine; 2008, and Evidence-based standards for cancer pain management. J Clin Oncol. 2008;26(23):3879-3885.
Back to the Case
At home, the patient was taking 60 mg of extended-release morphine twice daily and six doses per day of 15-mg immediate-release morphine for breakthrough pain. This is the equivalent of 210 mg of oral morphine in 24 hours. His pain is severe on this regimen, but it is unclear how much of this medication he is absorbing due to his vomiting. Using the IV route of administration and a patient-controlled analgesia (PCA) system will enable rapid dose titration and pain control. The equivalent of the 24-hour dose of 210 mg oral morphine is 70 mg IV morphine, which is equivalent to a drip basal rate of approximately 3 mg IV morphine per hour. This basal rate with a bolus dose of 7 mg (10% of the 24-hour dose) IV morphine q1 hour prn is reasonable as a starting point.
Review of the Data: Nausea and Vomiting
Nausea and vomiting affect 40% to 70% of patients in a palliative setting.7 A thorough history and physical exam can enable one to determine the most likely causes, pathways, and receptors involved in the process of nausea and vomiting. It is important to review the timing, frequency, and triggers of vomiting. The oral, abdominal, neurologic, and rectal exams, in addition to a complete chemistry panel, offer helpful information. The most common etiologies and recommended medications are included in Table 3. It is worthwhile to note that serotonin-antagonists (i.e. ondansetron) are first-line therapies only for chemotherapy and radiation-therapy-induced emesis. If a 24-hour trial of one antiemetic therapy is ineffective, one should reassess the etiology and escalate the antiemetic dose, or add a second therapy with a different (pertinent) mechanism of action. Although most studies of antiemetic therapy are case series, there is good evidence for this mechanistic approach.8
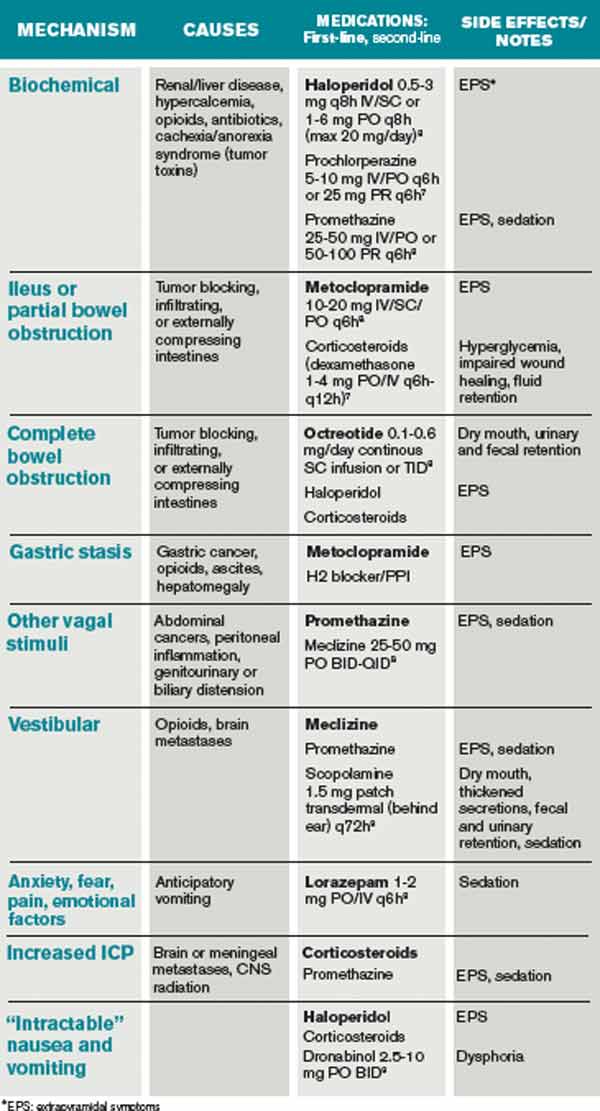
*EPS: extrapyramidal symptoms
The various insults and pathways that can cause vomiting are quite complex. The medullary vomiting center (VC) receives vestibular, peripheral (via splanchnic and vagal nerves), and higher cortical inputs and is the final common pathway in the vomiting reflex. The chemoreceptor trigger zone (CTZ) near the fourth ventricle receives input from the vagal and splanchnic nerves, and generates output to the VC.
General dietary recommendations are to avoid sweet, fatty, and highly salted or spiced foods. Small portions of bland foods without strong odors are best tolerated.7 Constipation commonly contributes to nausea and vomiting and should be managed with disimpaction, enemas, and laxatives as tolerated. Imaging may be required to make the important distinction between partial and complete bowel obstruction, as the treatments differ. Surgical procedures, such as colostomy or placement of a venting gastrostomy tube, can relieve pain and vomiting associated with complete bowel obstruction.
Back to the Case
The patient is found to have a fecal impaction on rectal exam, but vomiting persists after disimpaction and enema use. Imaging documents a complete bowel obstruction at the site of a palpable mass in the right upper quadrant and multiple large hepatic metastases. Octreotide is initiated to decrease intestinal secretions and peristalsis. Steroids are given to decrease tumor burden and associated inflammation in the intestine and liver, as well as to relieve distension of the hepatic capsule. Haloperidol is used in low doses to control episodes of nausea.
Review of the Data: Dyspnea
Dyspnea is a common symptom faced by patients at EOL. An estimated 50% of patients who are evaluated in acute-care hospitals seek treatment for the management of this often-crippling symptom.10 Unfortunately, as disease burden progresses, the incidence of dyspnea increases towards EOL, and the presence and severity of dyspnea is strongly correlated with mortality.
It is imperative for providers to appreciate that dyspnea is a subjective symptom, similar to pain. The presence and severity of dyspnea, therefore, depends on patient report. Given its subjective nature, the degree of dyspnea experienced by a patient might not correlate with objective laboratory findings or test results. In practice, the severity of dyspnea is commonly assessed with a numeric rating scale (0-10), verbal analogue scale, or with verbal descriptors (mild, moderate, severe). It is important to determine the underlying etiology of the dyspnea and, if possible, to target interventions to relieve the underlying cause. However, at the end of life, the burdens of invasive studies to determine the exact cause of dyspnea might outweigh the benefits, and invasive testing might not correlate with patients’ and families’ goals of care. In that instance, the goal of treatment should be aggressive symptom management and providers should use clinical judgment to tailor therapies based on the patient’s underlying illness, physical examination, and perhaps on noninvasive radiological or laboratory findings. Below are nonpharmacological and pharmacological interventions that can be employed to help alleviate dyspnea in the actively dying patient.
Nonpharmacological Management
A handheld fan aimed near the patient’s face has been shown to reduce the sensation of dyspnea.11 This relatively safe and inexpensive intervention has no major side effects and can provide improvement in this distressing symptom.
Often, the first line of therapy in the hospital setting for a patient reporting dyspnea is the administration of oxygen therapy. However, recent evidence does not show superiority of oxygen over air inhalation via nasal prongs for dyspnea in patients with advanced cancer or heart failure.12,13
Pharmacological Management
Opioids are first-line therapy for alleviating dyspnea in patients at EOL. The administration of opioids has been shown in systematic reviews to provide effective management of dyspnea.14,15 Practice guidelines by leading expert groups advocate for the use of opioids in the management of dyspnea for patients with advanced malignant and noncancer diseases.10,16 Fear of causing unintended respiratory sedation with opioids limits the prescription of opioids for dyspnea. However, studies have not found a change in mortality with the use of opioids appropriately titrated to control dyspnea.17
Studies examining the role of benzodiazepines in dyspnea management are conflicting. Anecdotal clinical evidence in actively dying patients supports treating dyspnea with benzodiazepines in conjunction with opioid therapy. Benzodiazepines are most beneficial when there is an anxiety-related component to the dyspnea.
Many patients with advanced disease and evidence of airflow obstruction will benefit from nebulized bronchodilator therapy for dyspnea. Patients with dyspnea from fluid overload (i.e. end-stage congestive heart failure or renal disease) might benefit from systemic diuretics. An increasing number of trials are under way to evaluate the efficacy of nebulized furosemide in the symptomatic management of dyspnea.
Back to the Case
The patient’s clinical course decompensates, and he begins to report worsening dyspnea in addition to his underlying pain. He becomes increasingly anxious about what this new symptom means. In addition to having a discussion about disease progression and prognosis, you increase his PCA basal dose to morphine 4 mg/hour to help him with this new symptom. You also add low-dose lorazepam 0.5 mg IV q8 hours as an adjunct agent for his dyspnea. The patient reports improvement of his symptom burden.
Review of the Data: Secretions
Physiological changes occur as a patient enters the active phase of dying. Two such changes are the loss of the ability to swallow and a reduced cough reflex. These changes culminate in an inability to clear secretions, which pool in the oropharynx and the airways. As the patient breathes, air moves over the pooled secretions and produces a gurgling sound that is referred to as the “death rattle.” The onset of this clinical marker has been shown to have significant prognostic significance for predicting imminent death within a period of hours to days. Proposed treatments for the symptom are listed below.
Nonpharmacological Management
Nonpharmacological options include repositioning the patient in a manner that facilitates postural draining.18 Careful and gentle oral suctioning might help reduce secretions if they are salivary in origin. This will not help to clear deeper bronchial secretions. Suctioning of deeper secretions often causes more burden than benefit, as this can cause repeated trauma and possible bleeding.
Family and caregivers at the bedside can find the “death rattle” quite disturbing and often fear that their loved one is “drowning.” Education and counseling that this is not the case, and that the development of secretions is a natural part of the dying process, can help alleviate this concern. Explaining that pharmacological agents can be titrated to decrease secretions is also reassuring to caregivers.
Pharmacological Management
Pharmacological options for secretion management include utilizing anticholinergic medications to prevent the formation of further secretions. These medications are standard of care for managing the death rattle and have been found to be most efficacious if started earlier in the actively dying phase.19,20 Anticholinergic medications include glycopyrrolate (0.2 mg IV q8 hours), atropine sulfate ophthalmological drops (1% solution, 1-2 drops SL q6 hours), hyoscyamine (0.125 mg one to four times a day), and scopolamine (1.5 mg patch q72 hours). These medications all have possible side effects typical of anticholinergic agents, including delirium, constipation, blurred vision, and urinary retention.
Back to the Case
The patient becomes increasingly lethargic. You meet with his family and explain that he is actively dying. His family reiterates that the goals of medical care should focus on maximizing symptom management. His family is concerned about the “gurgly” sound they hear and want to know if that means he is suffering. You educate the family about expected changes that occur with the dying process and inform them that glycopyrrolate 0.2 mg IV q8 hour will be started to minimize further secretions.
Bottom Line
Pain, nausea, dyspnea, and secretions are common end-of-life symptoms that hospitalists should be competent in treating.
Dr. Litrivis is an associate director and assistant professor at the Mount Sinai School of Medicine in New York, and Dr. Neale is an assistant professor at the University of New Mexico School of Medicine in Albuquerque.
References
- The SUPPORT Principal Investigators. A controlled trial to improve the care for seriously ill hospitalized patients. The study to understand prognoses and preferences for outcomes and risks of treatments (SUPPORT). JAMA. 1995;274(20):1591-1598.
- World Health Organization Definition of Palliative Care. World Health Organization website. Available at: http://www.who.int/cancer/palliative/definition/en/. Accessed April 12, 2012.
- NCCN Guidelines Version 2. 2011 Adult Cancer Pain. National Comprehensive Cancer Network website. Available at: http://www.nccn.org/professionals/physician_gls/pdf/pain.pdf. Accessed April 12, 2012.
- Whitecar PS, Jonas AP, Clasen ME. Managing pain in the dying patient. Am Fam Physician. 2000;61(3):755-764.
- Bial A, Levine S. Assessment and treatment of physical pain associated with life-limiting illness. Hospice and Palliative Care Training for Physicians: UNIPAC. Vol 3. 3rd ed. Glenview, IL: American Academy of Hospice and Palliative Medicine; 2008.
- Sydney M, et al. Evidence-based standards for cancer pain management. J Clin Oncol. 2008;26(23):3879-3885.
- Mannix KA. Gastrointestinal symptoms. In: Doyle D, Hanks G, Cherny N, Calman K, eds. Oxford Textbook of Palliative Medicine. 3rd ed. New York, NY: Oxford University Press; 2005.
- Tyler LS. Nausea and vomiting in palliative care. In: Lipman AG, Jackson KC, Tyler LS, eds. Evidence-Based Symptom Control in Palliative Care. New York, NY: The Hawthorn Press; 2000.
- Policzer JS, Sobel J. Management of Selected Nonpain Symptoms of Life-Limiting Illness. Hospice and Palliative Care Training for Physicians: UNIPAC. Vol 4. 3rd ed. Glenview, IL: American Academy of Hospice and Palliative Medicine; 2008.
- Parshall MB, Schwartzstein RM, Adams L, et al. An official American Thoracic Society statement: update on the mechanisms, assessment, and management of dyspnea. Am J Respir Crit Care Med. 2012;185(4): 435-452.
- Galbraith S, Fagan P, Perkins P, Lynch A, Booth S. Does the use of a handheld fan improve chronic dyspnea? A randomized controlled, crossover trial. J Pain Symptom Manage. 2010;39(5): 831-838.
- Philip J, Gold M, Milner A, Di Iulio J, Miller B, Spruyt O. A randomized, double-blind, crossover trial of the effect of oxygen on dyspnea in patients with advanced cancer. J Pain Symptom Manage. 2006;32(6):541-550.
- Cranston JM, Crockett A, Currow D. Oxygen therapy for dyspnea in adults. Cochrane Database Syst Rev. 2008;(3):CD004769.
- Jennings AL, Davies AN, Higgins JP, Broadley K. Opioids for the palliation of breathlessness in terminal illness. Cochrane Database Syst Rev. 2001;(4):CD002066.
- Ben-Aharon I, Gafter-Gvili A, Paul M, Leibovici, L, Stemmer, SM. Interventions for alleviating cancer-related dyspnea. A systematic review. J Clin Oncol. 2008;26(14): 2396-2404.
- Qaseem A, Snow V, Shekelle P, et al. Evidence-based interventions to improve the palliative care of pain, dyspnea, and depression at the end of life: a clinical practice guideline from the American College of Physicians. Ann Intern Med. 2008;148(2):141-146
- Booth S, Moosavi SH, Higginson IJ. The etiology and management of intractable breathlessness in patients with advanced cancer: a systematic review of pharmacological therapy. Nat Clin Pract Oncol. 2008;5(2):90–100.
- Bickel K, Arnold R. EPERC Fast Facts Documents #109 Death Rattle and Oral Secretions, 2nd ed. Available at: http://www.eperc.mcw.edu/EPERC/FastFactsIndex/ff_109.htm. Accessed April 15, 2012.
- Wildiers H, Dhaenekint C, Demeulenaere P, et al. Atropine, hyoscine butylbromide, or scopalamine are equally effective for the treatment of death rattle in terminal care. J Pain Symptom Manage. 2009;38(1):124-133.
- Hugel H, Ellershaw J, Gambles M. Respiratory tract secretions in the dying patient: a comparison between glycopyrronium and hyoscine hydrobromide. J Palliat Med. 2006;9(2):279-285.
Case
A 58-year-old male with colon cancer metastatic to the liver and lungs presents with vomiting, dyspnea, and abdominal pain. His disease has progressed through third-line chemotherapy and his care is now focused entirely on symptom management. He has not had a bowel movement in five days and he began vomiting two days ago.
Overview
The majority of patients in the United States die in acute-care hospitals. The Study to Understand Prognosis and Preferences for Outcomes and Risks of Treatments (SUPPORT), which evaluated the courses of close to 10,000 hospitalized patients with serious and life-limiting illnesses, illustrated that patients’ end-of-life (EOL) experiences often are characterized by poor symptom management and invasive care that is not congruent with the patients’ overall goals of care.1 Studies of factors identified as priorities in EOL care have consistently shown that excellent pain and symptom management are highly valued by patients and families. As the hospitalist movement continues to grow, hospitalists will play a large role in caring for patients at EOL and will need to know how to provide adequate pain and symptom management so that high-quality care can be achieved.
Pain: A Basic Tenet
A basic tenet of palliative medicine is to evaluate and treat all types of suffering.2 Physical pain at EOL is frequently accompanied by other types of pain, such as psychological, social, religious, or existential pain. However, this review will focus on the pharmacologic management of physical pain.
Pain management must begin with a thorough evaluation of the severity, location, and characteristics of the discomfort to assess which therapies are most likely to be beneficial (see Table 1).3 The consistent use of one scale of pain severity (such as 0-10, or mild/moderate/severe) assists in the choice of initial dose of pain medication, in determining the response to the medication, and in assessing the need for change in dose.4
Opioids are the foundation of pain management in advanced diseases because they are available in a number of formulations and, when dosed appropriately, they are effective and safe. Starting doses and equianalgesic doses of common opioids are presented in Table 2. Guidelines recommend the use of short-acting opioids for dose titration to gain control of poorly controlled pain.3 If a patient is experiencing mild pain on a specific regimen, the medication dose can be increased up to 25%; by 25% to 50%, if pain is moderate; and 50% to 100%, if severe.5 When the pain is better-controlled, the total amount of pain medication used in 24 hours (24-hour dose) can be converted to a long-acting formulation for more consistent pain management. Because there is a constant component to most advanced pain syndromes, it is recommended that pain medication is given on a standing basis, with as-needed (prn) doses available for exacerbations of pain.3 Prn doses of short-acting medication (equivalent to approximately 10% of the 24-hour dose of medication) should be available at one- or two-hour intervals prn (longer if hepatic or renal impairment is present) for IV or PO medications, respectively.
Opioids often are categorized as low potency (i.e. codeine, hydrocodone) and high-potency (i.e. oxycodone, morphine, hydromorphone, fentanyl). When given in “equianalgesic doses,” the analgesic effect and common side effects (nausea/vomiting, constipation, sedation, confusion, pruritis) of different opioids can vary in different patients. Due to differences in levels of expressed subtypes of opioid receptors, a given patient might be more sensitive to the analgesic effect or side effects of a specific medication. Therefore, if dose escalation of one opioid is inadequate to control pain and further increases in dose are limited by intolerable side effects, rotation to another opioid is recommended.4 Tables documenting equianalgesic doses of different opioids are based on only moderate evidence from equivalency trials performed in healthy volunteers.6 Due to interpatient differences in responses, it is recommended that the equianalgesic dose of the new medication be decreased by 25% to 50% for initial dosing.5
Certain treatments are indicated for specific pain syndromes. Bony metastases respond to NSAIDs, bisphosphonates, and radiation therapy in addition to opioid medications. As focal back pain is the first symptom of spinal cord compression, clinicians should have a high index of suspicion for compression in any patient with malignancy and new back pain. Steroids and radiation therapy are considered emergent treatments for pain control and to prevent paralysis in this circumstance. Pain due to bowel obstruction is usually colicky in nature and responds well to octreotide as discussed in the section on nausea and vomiting. Steroids (such as dexamethasone 4 mg PO bid-tid) might be an effective adjuvant medication in bone pain, tumor pain, or inflammation.
*Half this dose should be used in renal or liver dysfunction and in the elderly.
Preferred in renal dysfunction.
SOURCES: Adapted from Assessment and treatment of physical pain associated with life-limiting illness. Hospice and Palliative Care Training for Physicians: UNIPAC. Vol 3. 3rd ed. Glenview, IL: American Academy of Hospice and Palliative Medicine; 2008, and Evidence-based standards for cancer pain management. J Clin Oncol. 2008;26(23):3879-3885.
Back to the Case
At home, the patient was taking 60 mg of extended-release morphine twice daily and six doses per day of 15-mg immediate-release morphine for breakthrough pain. This is the equivalent of 210 mg of oral morphine in 24 hours. His pain is severe on this regimen, but it is unclear how much of this medication he is absorbing due to his vomiting. Using the IV route of administration and a patient-controlled analgesia (PCA) system will enable rapid dose titration and pain control. The equivalent of the 24-hour dose of 210 mg oral morphine is 70 mg IV morphine, which is equivalent to a drip basal rate of approximately 3 mg IV morphine per hour. This basal rate with a bolus dose of 7 mg (10% of the 24-hour dose) IV morphine q1 hour prn is reasonable as a starting point.
Review of the Data: Nausea and Vomiting
Nausea and vomiting affect 40% to 70% of patients in a palliative setting.7 A thorough history and physical exam can enable one to determine the most likely causes, pathways, and receptors involved in the process of nausea and vomiting. It is important to review the timing, frequency, and triggers of vomiting. The oral, abdominal, neurologic, and rectal exams, in addition to a complete chemistry panel, offer helpful information. The most common etiologies and recommended medications are included in Table 3. It is worthwhile to note that serotonin-antagonists (i.e. ondansetron) are first-line therapies only for chemotherapy and radiation-therapy-induced emesis. If a 24-hour trial of one antiemetic therapy is ineffective, one should reassess the etiology and escalate the antiemetic dose, or add a second therapy with a different (pertinent) mechanism of action. Although most studies of antiemetic therapy are case series, there is good evidence for this mechanistic approach.8
*EPS: extrapyramidal symptoms
The various insults and pathways that can cause vomiting are quite complex. The medullary vomiting center (VC) receives vestibular, peripheral (via splanchnic and vagal nerves), and higher cortical inputs and is the final common pathway in the vomiting reflex. The chemoreceptor trigger zone (CTZ) near the fourth ventricle receives input from the vagal and splanchnic nerves, and generates output to the VC.
General dietary recommendations are to avoid sweet, fatty, and highly salted or spiced foods. Small portions of bland foods without strong odors are best tolerated.7 Constipation commonly contributes to nausea and vomiting and should be managed with disimpaction, enemas, and laxatives as tolerated. Imaging may be required to make the important distinction between partial and complete bowel obstruction, as the treatments differ. Surgical procedures, such as colostomy or placement of a venting gastrostomy tube, can relieve pain and vomiting associated with complete bowel obstruction.
Back to the Case
The patient is found to have a fecal impaction on rectal exam, but vomiting persists after disimpaction and enema use. Imaging documents a complete bowel obstruction at the site of a palpable mass in the right upper quadrant and multiple large hepatic metastases. Octreotide is initiated to decrease intestinal secretions and peristalsis. Steroids are given to decrease tumor burden and associated inflammation in the intestine and liver, as well as to relieve distension of the hepatic capsule. Haloperidol is used in low doses to control episodes of nausea.
Review of the Data: Dyspnea
Dyspnea is a common symptom faced by patients at EOL. An estimated 50% of patients who are evaluated in acute-care hospitals seek treatment for the management of this often-crippling symptom.10 Unfortunately, as disease burden progresses, the incidence of dyspnea increases towards EOL, and the presence and severity of dyspnea is strongly correlated with mortality.
It is imperative for providers to appreciate that dyspnea is a subjective symptom, similar to pain. The presence and severity of dyspnea, therefore, depends on patient report. Given its subjective nature, the degree of dyspnea experienced by a patient might not correlate with objective laboratory findings or test results. In practice, the severity of dyspnea is commonly assessed with a numeric rating scale (0-10), verbal analogue scale, or with verbal descriptors (mild, moderate, severe). It is important to determine the underlying etiology of the dyspnea and, if possible, to target interventions to relieve the underlying cause. However, at the end of life, the burdens of invasive studies to determine the exact cause of dyspnea might outweigh the benefits, and invasive testing might not correlate with patients’ and families’ goals of care. In that instance, the goal of treatment should be aggressive symptom management and providers should use clinical judgment to tailor therapies based on the patient’s underlying illness, physical examination, and perhaps on noninvasive radiological or laboratory findings. Below are nonpharmacological and pharmacological interventions that can be employed to help alleviate dyspnea in the actively dying patient.
Nonpharmacological Management
A handheld fan aimed near the patient’s face has been shown to reduce the sensation of dyspnea.11 This relatively safe and inexpensive intervention has no major side effects and can provide improvement in this distressing symptom.
Often, the first line of therapy in the hospital setting for a patient reporting dyspnea is the administration of oxygen therapy. However, recent evidence does not show superiority of oxygen over air inhalation via nasal prongs for dyspnea in patients with advanced cancer or heart failure.12,13
Pharmacological Management
Opioids are first-line therapy for alleviating dyspnea in patients at EOL. The administration of opioids has been shown in systematic reviews to provide effective management of dyspnea.14,15 Practice guidelines by leading expert groups advocate for the use of opioids in the management of dyspnea for patients with advanced malignant and noncancer diseases.10,16 Fear of causing unintended respiratory sedation with opioids limits the prescription of opioids for dyspnea. However, studies have not found a change in mortality with the use of opioids appropriately titrated to control dyspnea.17
Studies examining the role of benzodiazepines in dyspnea management are conflicting. Anecdotal clinical evidence in actively dying patients supports treating dyspnea with benzodiazepines in conjunction with opioid therapy. Benzodiazepines are most beneficial when there is an anxiety-related component to the dyspnea.
Many patients with advanced disease and evidence of airflow obstruction will benefit from nebulized bronchodilator therapy for dyspnea. Patients with dyspnea from fluid overload (i.e. end-stage congestive heart failure or renal disease) might benefit from systemic diuretics. An increasing number of trials are under way to evaluate the efficacy of nebulized furosemide in the symptomatic management of dyspnea.
Back to the Case
The patient’s clinical course decompensates, and he begins to report worsening dyspnea in addition to his underlying pain. He becomes increasingly anxious about what this new symptom means. In addition to having a discussion about disease progression and prognosis, you increase his PCA basal dose to morphine 4 mg/hour to help him with this new symptom. You also add low-dose lorazepam 0.5 mg IV q8 hours as an adjunct agent for his dyspnea. The patient reports improvement of his symptom burden.
Review of the Data: Secretions
Physiological changes occur as a patient enters the active phase of dying. Two such changes are the loss of the ability to swallow and a reduced cough reflex. These changes culminate in an inability to clear secretions, which pool in the oropharynx and the airways. As the patient breathes, air moves over the pooled secretions and produces a gurgling sound that is referred to as the “death rattle.” The onset of this clinical marker has been shown to have significant prognostic significance for predicting imminent death within a period of hours to days. Proposed treatments for the symptom are listed below.
Nonpharmacological Management
Nonpharmacological options include repositioning the patient in a manner that facilitates postural draining.18 Careful and gentle oral suctioning might help reduce secretions if they are salivary in origin. This will not help to clear deeper bronchial secretions. Suctioning of deeper secretions often causes more burden than benefit, as this can cause repeated trauma and possible bleeding.
Family and caregivers at the bedside can find the “death rattle” quite disturbing and often fear that their loved one is “drowning.” Education and counseling that this is not the case, and that the development of secretions is a natural part of the dying process, can help alleviate this concern. Explaining that pharmacological agents can be titrated to decrease secretions is also reassuring to caregivers.
Pharmacological Management
Pharmacological options for secretion management include utilizing anticholinergic medications to prevent the formation of further secretions. These medications are standard of care for managing the death rattle and have been found to be most efficacious if started earlier in the actively dying phase.19,20 Anticholinergic medications include glycopyrrolate (0.2 mg IV q8 hours), atropine sulfate ophthalmological drops (1% solution, 1-2 drops SL q6 hours), hyoscyamine (0.125 mg one to four times a day), and scopolamine (1.5 mg patch q72 hours). These medications all have possible side effects typical of anticholinergic agents, including delirium, constipation, blurred vision, and urinary retention.
Back to the Case
The patient becomes increasingly lethargic. You meet with his family and explain that he is actively dying. His family reiterates that the goals of medical care should focus on maximizing symptom management. His family is concerned about the “gurgly” sound they hear and want to know if that means he is suffering. You educate the family about expected changes that occur with the dying process and inform them that glycopyrrolate 0.2 mg IV q8 hour will be started to minimize further secretions.
Bottom Line
Pain, nausea, dyspnea, and secretions are common end-of-life symptoms that hospitalists should be competent in treating.
Dr. Litrivis is an associate director and assistant professor at the Mount Sinai School of Medicine in New York, and Dr. Neale is an assistant professor at the University of New Mexico School of Medicine in Albuquerque.
References
- The SUPPORT Principal Investigators. A controlled trial to improve the care for seriously ill hospitalized patients. The study to understand prognoses and preferences for outcomes and risks of treatments (SUPPORT). JAMA. 1995;274(20):1591-1598.
- World Health Organization Definition of Palliative Care. World Health Organization website. Available at: http://www.who.int/cancer/palliative/definition/en/. Accessed April 12, 2012.
- NCCN Guidelines Version 2. 2011 Adult Cancer Pain. National Comprehensive Cancer Network website. Available at: http://www.nccn.org/professionals/physician_gls/pdf/pain.pdf. Accessed April 12, 2012.
- Whitecar PS, Jonas AP, Clasen ME. Managing pain in the dying patient. Am Fam Physician. 2000;61(3):755-764.
- Bial A, Levine S. Assessment and treatment of physical pain associated with life-limiting illness. Hospice and Palliative Care Training for Physicians: UNIPAC. Vol 3. 3rd ed. Glenview, IL: American Academy of Hospice and Palliative Medicine; 2008.
- Sydney M, et al. Evidence-based standards for cancer pain management. J Clin Oncol. 2008;26(23):3879-3885.
- Mannix KA. Gastrointestinal symptoms. In: Doyle D, Hanks G, Cherny N, Calman K, eds. Oxford Textbook of Palliative Medicine. 3rd ed. New York, NY: Oxford University Press; 2005.
- Tyler LS. Nausea and vomiting in palliative care. In: Lipman AG, Jackson KC, Tyler LS, eds. Evidence-Based Symptom Control in Palliative Care. New York, NY: The Hawthorn Press; 2000.
- Policzer JS, Sobel J. Management of Selected Nonpain Symptoms of Life-Limiting Illness. Hospice and Palliative Care Training for Physicians: UNIPAC. Vol 4. 3rd ed. Glenview, IL: American Academy of Hospice and Palliative Medicine; 2008.
- Parshall MB, Schwartzstein RM, Adams L, et al. An official American Thoracic Society statement: update on the mechanisms, assessment, and management of dyspnea. Am J Respir Crit Care Med. 2012;185(4): 435-452.
- Galbraith S, Fagan P, Perkins P, Lynch A, Booth S. Does the use of a handheld fan improve chronic dyspnea? A randomized controlled, crossover trial. J Pain Symptom Manage. 2010;39(5): 831-838.
- Philip J, Gold M, Milner A, Di Iulio J, Miller B, Spruyt O. A randomized, double-blind, crossover trial of the effect of oxygen on dyspnea in patients with advanced cancer. J Pain Symptom Manage. 2006;32(6):541-550.
- Cranston JM, Crockett A, Currow D. Oxygen therapy for dyspnea in adults. Cochrane Database Syst Rev. 2008;(3):CD004769.
- Jennings AL, Davies AN, Higgins JP, Broadley K. Opioids for the palliation of breathlessness in terminal illness. Cochrane Database Syst Rev. 2001;(4):CD002066.
- Ben-Aharon I, Gafter-Gvili A, Paul M, Leibovici, L, Stemmer, SM. Interventions for alleviating cancer-related dyspnea. A systematic review. J Clin Oncol. 2008;26(14): 2396-2404.
- Qaseem A, Snow V, Shekelle P, et al. Evidence-based interventions to improve the palliative care of pain, dyspnea, and depression at the end of life: a clinical practice guideline from the American College of Physicians. Ann Intern Med. 2008;148(2):141-146
- Booth S, Moosavi SH, Higginson IJ. The etiology and management of intractable breathlessness in patients with advanced cancer: a systematic review of pharmacological therapy. Nat Clin Pract Oncol. 2008;5(2):90–100.
- Bickel K, Arnold R. EPERC Fast Facts Documents #109 Death Rattle and Oral Secretions, 2nd ed. Available at: http://www.eperc.mcw.edu/EPERC/FastFactsIndex/ff_109.htm. Accessed April 15, 2012.
- Wildiers H, Dhaenekint C, Demeulenaere P, et al. Atropine, hyoscine butylbromide, or scopalamine are equally effective for the treatment of death rattle in terminal care. J Pain Symptom Manage. 2009;38(1):124-133.
- Hugel H, Ellershaw J, Gambles M. Respiratory tract secretions in the dying patient: a comparison between glycopyrronium and hyoscine hydrobromide. J Palliat Med. 2006;9(2):279-285.
Pediatric Readmissions Vary Significantly Across Children’s Hospitals

Pediatric Readmissions Vary Significantly across Children’s Hospitals
Clinical question: What are the characteristics of readmissions to children’s hospitals?
Background: Thirty-day readmissions in adult Medicare beneficiaries are common and thought to represent potential for significant improvements in the quality of care. Penalties will be levied upon hospitals with excessively high readmission rates in adults. The stage is set for a translation of this practice to pediatric readmissions. However, the characteristics of readmissions to children’s hospitals are not well-defined.
Study design: Retrospective review.
Setting: National Association of Children’s Hospitals and Related Institutions (NACHRI) Case Mix data set.
Synopsis: Of 568,845 readmissions examined across 72 children’s hospitals, the 30-day readmission rate was 6.5%. Readmission rates varied by many factors: age, chronic conditions, insurance type, race/ethnicity, length of stay, number of annual hospital admissions, and hospital type. Rates varied significantly across hospitals, even after adjustment for age and chronic conditions. Anemia or neutropenia, ventricular shunt procedures, and sickle cell crisis had the highest unadjusted, 30-day, condition-specific readmission rates.
This study is notable for its large sample size but limited by the administrative data, which might, for example, underestimate readmissions that went to another hospital. Additionally, the majority of children in the U.S. are hospitalized outside of children’s hospitals, which are overrepresented in this study.
However, this study paints a clear picture of the differences between adult readmissions and pediatric readmissions—rates are lower than in elderly adults, and the top three conditions are distinctly different. Anemia or neutropenia likely are due to effects of chemotherapy; ventricular shunt readmissions often reflect surgery-related issues; and sickle cell disease is a lifelong, chronic condition. The significant variation between hospitals after case-mix adjustment offers an opportunity for further investigation and improvement.
Bottom line: Pediatric readmissions differ from adult readmissions and vary significantly across children’s hospitals.
Citation: Berry JG, Toomey SL, Zaslavsky AM, et al. Pediatric readmission prevalence and variability across hospitals. JAMA. 2013;309(4):372-380.
Reviewed by Pediatric Editor Mark Shen, MD, SFHM, medical director of hospital medicine at Dell Children's Medical Center, Austin, Texas.
Physician Reviews of Hospital Medicine-Related Research
In This Edition
Literature At A Glance
A guide to this month’s studies
- BNP-driven fluid management to improve ventilator weaning
- Examining 30-day readmission patterns to reduce repeat hospitalizations
- Impact of hospitalists’ workload on patient safety, care
- Permanent atrial fibrillation is best controlled by diltiazem
- Low-dose thrombolysis effective for pulmonary embolism
- High mortality rate seen in surgical patients requiring CPR
- ED visits common for acute-care patients post-discharge
- Restrictive transfusion strategies effective for upper GI bleeding
- Need for non-ICU acid suppression may be predictable
- Recommended changes for adult immunizations
BNP-Driven Fluid Management Improves Ventilator Weaning
Clinical question: Does fluid management guided by daily plasma natriuretic peptide-driven (BNP) levels in mechanically ventilated patients improve weaning outcomes compared with usual therapy dictated by clinical acumen?
Background: Ventilator weaning contributes at least 40% of the total duration of mechanical ventilation; strategies aimed at optimizing this process could provide substantial benefit. Previous studies have demonstrated that BNP levels prior to ventilator weaning independently predict weaning failure. No current objective practical guide to fluid management during ventilator weaning exists.
Study design: Randomized controlled trial.
Setting: Multiple international centers.
Synopsis: In a multicenter randomized controlled trial, 304 patients who met specific inclusion and exclusion criteria were randomized to either a BNP-driven or physician-guided strategy for fluid management during ventilator weaning. Patients with renal failure were excluded because of the influence of renal function on BNP levels.
All patients in both groups were ventilated with an automatic computer-driven weaning system to standardize the weaning process. In the BNP-driven group, diuretic use was higher, resulting in a more negative fluid balance and significantly shorter time to successful extubation (58.6 hours vs. 42.2 hours, P=0.03). The effect on weaning time was strongest in patients with left ventricular systolic dysfunction, whereas those with COPD seemed less likely to benefit. The two groups did not differ in baseline characteristics, length of stay, mortality, or development of adverse outcomes of renal failure, shock, or electrolyte disturbances.
Bottom line: Compared with physician-guided fluid management, a BNP-driven fluid management protocol decreased duration of ventilator weaning without significant differences in adverse events, mortality rate, or length of stay between the two groups.
Citation: Dessap AM, Roche-Campo F, Kouatchet A, et al. Natriuretic peptide-driven fluid management during ventilator weaning. Am J Respir Crit Care Med. 2012;186(12):1256-1263.
30-Day Readmission Patterns for MI, Heart Failure, Pneumonia
Clinical question: Do patterns exist among patients readmitted within 30 days of discharge for acute myocardial infarction (AMI), heart failure, or pneumonia that could provide insight for improving strategies aimed at reducing readmission rates?
Background: Examining readmission timing, diagnoses, and patient demographics might provide information to better guide post-discharge programs aimed at reducing overall readmissions.
Study design: Retrospective review of Centers for Medicare & Medicaid Services (CMS) data.
Setting: Acute-care hospitals.
Synopsis: Using CMS hospitalization data for principal diagnoses of AMI, heart failure, or pneumonia from 2007 through 2009, the authors examined the percentage of 30-day readmissions occurring on each day after discharge; the most common readmission diagnoses; the median time to readmission for common readmission diagnoses; and the relationship between patient demographic characteristics, readmission diagnoses, and timing. They found total readmission rates of 24.8% for heart failure, 19.9% for AMI, and 18.3% for pneumonia. Approximately two-thirds of 30-day readmissions occurred within the first 15 days after discharge for each cohort. Neither readmission diagnoses nor timing varied by patient age, sex, or race.
Although the majority of readmissions do occur soon after discharge, it is important to note that about one-third of all readmissions occur 16 to 30 days after discharge. There also was a diverse spectrum of readmission diagnoses that were not associated with patient demographic characteristics. These findings suggest that current post-discharge strategies aimed at specific diseases or time periods might only address a fraction of the patients at risk for readmission.
Bottom line: Among Medicare patients hospitalized for heart failure, AMI, or pneumonia, 30-day readmissions were frequent throughout the entire period, and readmission diagnoses or timing did not vary by patient age, sex, or race.
Citation: Dharmarajan K, Hsich AF, Lin Z, et al. Diagnosis and timing of 30-day readmissions after hospitalization for heart failure, acute myocardial infarction, or pneumonia. JAMA. 2013;309(4):355-363.
Workload Might Impact Patient Safety and Quality of Care
Clinical question: Do hospitalists’ workloads affect patient quality of care and safety?
Background: Preventable medical errors contribute to a large number of patient deaths each year. It is unclear if a hospitalist’s clinical workload affects rates of medical errors or patient harm.
Study design: Cross-sectional cohort study.
Setting: Hospitalists enrolled in online physician community QuantiaMD.com.
Synopsis: There has been limited research evaluating the correlation between physician workload and patient safety. An online survey compared the responses of 506 out of 890 enrolled physicians on the impact of average patient census and several outcome measures of quality of care. Some 40% reported that their patient census exceeded their personal safe workload at least once a month. They also reported that less time for patient evaluations led to fewer discussions with patients and family members, more unnecessary medical work-ups, and lower patient satisfaction.
A limitation of this study is that this electronic survey had the potential for selection bias. It also only measured perceptions of safety and quality, and only used standard daytime shifts (excluding night, cross-cover, weekend, and holiday shifts), which might have been associated with significantly different conclusions.
Bottom line: Increase in workload has a negative perceived impact on patient safety and quality of care for attending hospitalists.
Citation: Michtalik HJ, Yeh HC, Pronovost P, et. al. Impact of attending physician workload on patient care: a survey of hospitalists. JAMA Intern Med. 2013;173(5):375-377.
Permanent Atrial Fibrillation Best Controlled by Diltiazem
Clinical question: Is there a difference between beta-blockers and calcium channel blockers for ventricular rate control and arrhythmia-related symptoms in patients with permanent atrial fibrillation?
Background: Rate control with beta-blockers or calcium channel blockers is recommended for the initial therapy of atrial fibrillation. However, studies comparing those drug classes or drugs within them are lacking.
Study design: Prospective, randomized, investigator-blind crossover study.
Setting: Majority of patients from an atrial fibrillation outpatient clinic at Baerum Hospital in Norway.
Synopsis: The RATe Control in Atrial Fibrillation (RATAF) study included 60 participants with permanent atrial fibrillation. The goal of the study was to compare the efficacy of diltiazem at 360 mg/day, verapamil at 240 mg/day, metoprolol at 100 mg/day, and carvedilol at 25mg/day on ventricular heart rate and related symptoms in atrial fibrillation. Patients had a mean age of 71, atrial fibrillation for more than three months, and mean heart rate of 96 beats/minute. Exclusion criteria included the presence of congestive heart failure or ischemic heart disease with the need for other medications that could compromise the study.
From this study, diltiazem was shown to have the greatest effect in lowering heart rate, and those patients taking this medication had decreased symptoms related to atrial fibrillation. Hospitalists should not rely solely on this study for their treatment choice in all atrial fibrillation patients, but in certain populations, they should consider diltiazem as their first-line drug.
Bottom line: Diltiazem was shown to have the greatest reduction in heart rate and symptoms related to permanent atrial fibrillation.
Citation: Ulimoen SR, Enger S, Carlson J, et al. Comparison of four single-drug regimens on ventricular rate and arrhythmia-related symptoms in patients with permanent atrial fibrillation. Am J Cardiol. 2013:111(2):225-230.
Low-Dose Thrombolysis Effective in Moderate Pulmonary Embolism
Clinical question: Can low-dose tissue plasminogen activator (tPA) help reduce pulmonary artery pressure in those with moderate pulmonary embolism (PE)?
Background: Studies have shown full-dose thrombolysis can effectively decrease pulmonary artery pressure in patients with massive PE. However, there are limited data regarding low-dose or “safe dose” thrombolytic therapy and its effect on pulmonary artery pressure.
Study design: Prospective, controlled, randomized study.
Setting: Single center.
Synopsis: The Moderate Pulmonary Embolism Treated with Thrombolysis (MOPETT) study enrolled patients with moderate PE, defined as signs and symptoms of PE plus computed tomographic pulmonary angiographic involvement of > 70% involvement of thrombus in ≥2 lobar or left/right main pulmonary arteries or high probability ventilation/perfusion scan (mismatch in ≥2 lobes). Patients in the thrombolysis group (n=61) were given low-dose tPA (100 mg tPA) and anticoagulation vs. the control group (n=60), which received only anticoagulation.
The study ran for 22 months, and the primary end points were pulmonary hypertension and recurrent PE. After analysis, low-dose thrombolysis was shown to significantly decrease pulmonary artery pressure and occurrence of recurrent PE compared to the control group.
This study demonstrates that, while the decision to use thrombolytics should always be made cautiously, hospitalists can consider low-dose thrombolysis in patients with moderate PE.
Bottom line: Low-dose thrombolysis, in addition to anticoagulation, in patients with moderate PE decreases pulmonary hypertension and recurrent PE.
Citation: Sharifi M, Bay C, Skrocki L, Rahimi F, Mehdipour M. Moderate pulmonary embolism treated with thrombolysis (from the “MOPETT” trial). Am J Cardiol. 2013;111(2):273-277.
High Mortality in Surgical Patients Requiring CPR
Clinical question: What are the incidence, characteristics, and 30-day-outcomes of CPR in surgical patients?
Background: Most studies of CPR are based on the medical population, and little is known about the utilization, risk factors, and outcomes of CPR in surgical patients.
Study design: Retrospective cohort study.
Setting: Two hundred fifty U.S. hospitals in the American College of Surgeons’ National Surgical Quality Improvement Program.
Synopsis: A total of 1.3 million surgical cases were studied in the data set. The overall incidence was 1 event per 203 cases. Most patients (77.6%) experienced a complication and did so on or before the day of CPR in three-fourths of cases. The incidence of CPR was the highest for cardiac surgery patients. Patients who received CPR had a mortality rate of 71.6%. Mortality rates of CPR patients increased with more comorbidities.
Additionally, older age and an American Society of Anesthesiologists (ASA) class of 5 was associated with higher mortality.
Limitations of this study included coding flaws in data collection, lack of capture of resuscitation-related injuries, and failure to account for changes in DNR orders.
Hospitalists should be mindful of risk factors contributing to CPR in surgical patients when performing perioperative evaluations.
Bottom line: Surgical patients who experience CPR have a high mortality rate, but many of these patients have pre-arrest complications that can be preventable.
Citation: Kazaure HS, Roman SA, Rosenthal RA, Sosa, JA. Cardiac arrest among surgical patients. JAMA Surg. 2013;148(1):14-21.
Emergency Department Visits are Frequent Post-Discharge
Clinical question: What role do ED visits contribute to the overall use of acute-care services within 30 days of hospital discharge?
Background: Hospital readmissions within 30 days of discharge are a marker of the quality of care and reflect the effectiveness of the discharge process. ED visits are also a marker of hospital-based acute care following discharge, but little is known about the role of the ED during the post-discharge period.
Study design: Prospective study.
Setting: Acute-care hospitals in California, Florida, and Nebraska.
Synopsis: Using the Healthcare Cost and Utilization Project state inpatient and ED databases, all discharges between July 1, 2008, and Sept. 31, 2009, were evaluated for residents aged 18 years or older from three hospitals in three states. After exclusions, 5 million index hospitalizations among 4 million unique patients were studied.
Approximately 40% of the more than 1 million post-discharge acute-care encounters involved a visit to the ED.
Limitations of this study include that the data was derived from only three states, and only hospital-based acute-care visits were measured (i.e. visits to physician offices were not included). As hospitalists, we are responsible for discharges and care transitions. Being sensitive to the common medical conditions resulting in post-discharge ED encounters might improve care transitions.
Bottom line: Hospital readmission rates underestimate ED use following discharge.
Citation: Vashi AA, Fox JP, Carr BG, et al. Use of hospital-based acute care among patients recently discharged from the hospital. JAMA. 2013;309(4):364-371.
Restrictive Transfusion Strategy Beneficial in Upper GI Bleeding
Clinical question: What is the hemoglobin threshold for transfusion of red cells in patients with acute upper GI bleeding?
Background: Controlled trials have shown that restrictive transfusion strategies (Hgb<7) are as effective as liberal transfusion strategies (Hgb<9) in critically ill patients. These studies have excluded patients with GI bleeding. In cases for which GI is not severe, the safest transfusion strategy is controversial.
Study design: Single-center study at Hospital de la Santa Creu i Sant Pau, Barcelona, Spain.
Synopsis: A total of 921 adult patients with acute upper GI bleeding were enrolled and assigned: 461 to a restrictive transfusion strategy (hemoglobin<7) and 460 to a liberal strategy (hemoglobin<9). Patients with massive exsanguinating bleeding, acute coronary syndrome, peripheral vasculopathy, stroke, transient ischemic attack, lower GI bleed, recent trauma or surgery, or low risk of rebleeding were excluded. The primary outcome measure was the rate of death from any cause within the first 45 days.
Secondary outcomes included the rate of further bleeding and the rate of in-hospital complications.
Statistically significant benefit in following a restrictive versus liberal strategy was demonstrated in all major outcomes: mortality (5% vs, 9%, P=0.02), rate of further bleeding (10% vs 18%, P=0.01), and rate of complications (40% vs. 48%, P=0.02).
The study is limited by its inability to be generalized to all patients with acute GI bleeding, as patients with massive exsanguinating bleeds and those with low risk of rebleeding were excluded.
Bottom line: Restrictive transfusion (Hgb<7) significantly improved outcomes for patients with acute upper GI bleeding.
Citation: Villanueva C, Colomo A, Bosch A, et al. Transfusion strategies for acute upper gastrointestinal bleeding. N Engl J Med. 2013;368(1):11-21.
Need for Non-ICU Acid Suppression Might Be Predictable
Clinical question: What are the risk factors for nosocomial bleeding in non-critically-ill patients?
Background: Acid-suppressive medication has been shown to reduce the incidence of nosocomial GI bleed in the ICU, but current guidelines recommend against its use in non-critically-ill patients. However, a subgroup of these patients might possess a high enough risk for GI bleed that prophylaxis is warranted.
Study design: Cohort study.
Setting: Academic medical center in Boston.
Synopsis: A total of 75,723 admissions of adult patients hospitalized for three or more days were included. Exclusion criteria included primary discharge diagnosis of GI bleed; principal procedure code of cardiac catheterization; and bleeding episodes occurring while in the ICU or within 48 hours of transfer out of the ICU. The primary outcome was nosocomial GI bleed (>24 hours after admission) occurring outside the ICU.
Nosocomial GI bleeding occurred in 203 patients (0.27%). Independent risk factors for bleeding included age >60, male sex, liver disease, acute renal failure, sepsis, being on a medicine service, prophylactic anticoagulation, and coagulopathy. Based on the data, a scoring system was created that identified a high-risk group in whom the number needed to treat with acid-suppressive medication to prevent one bleed was 48.
The major limitations of this study are its observational nature and the need for validation of the proposed scoring system.
Bottom line: Risk for nosocomial GI bleeding appears predictable and supports the selective use of prophylactic acid suppression in non-critically-ill patients.
Citation: Herzig SJ, Rothberg MB, Feinbloom DB, et al. Risk factors for nosocomial gastrointestinal bleeding and use of acid-suppressive medication in non-critically ill patients. J Gen Intern Med. 2013; January 5. [Epub ahead of print].
Additions, Modifications, and Clarifications Regarding Adult Immunization
Clinical question: What are the changes to the recommended Adult Immunization Schedule for 2013?
Background: Despite the known public health benefits of immunization, adult vaccination rates remain low. The positive impact of strong provider recommendations regarding vaccines underscores the importance of provider awareness of vaccine schedules, precautions, and contraindications.
Study design: Annual Advisory Committee on Immunization Practices (ACIP) review.
Setting: Data from 2011 National Health Interview Survey.
Synopsis: Highlighted changes include: 1) a single dose of pneumococcal 13-valent conjugate (PCV13) vaccine is now recommended for all individuals over the age of 19 with qualifying conditions; 2) clarification regarding pneumococcal polysaccharide (PPSV23) vaccine illustrates that high-risk individuals will receive up to three doses (one or two doses prior to age 65, plus an additional dose after the age of 65); 3) one dose of tetanus, diphtheria, and acellular pertussis (Tdap) vaccine is now recommended for all adults, including individuals age >65; 4) pregnant woman are advised to receive Tdap between 27 and 36 weeks’ gestation, with each pregnancy to provide protection to their newborn in the first months of life; 5) quadrivalent formulations of the live attenuated influenza vaccine (LAIV) and most likely the inactivated influenza vaccine (IIV) will be available in the 2013-2014 influenza season to increase cross-reactive protection against influenza B; and 6) both injection and noninjection illicit drug users are recommended to receive hepatitis A vaccine.
Bottom line: Expanded recommendations for adult immunization provide more opportunities for the practicing hospitalist to improve vaccine capture.
Citation: Advisory Committee on Immunization Practices. Recommended adult immunization schedule: United States, 2013. Ann Int Med. 2013;158(3):191-199.
Hybrid Nocturnist Solution is Key to Lehigh Valley Hospitalist Program’s Success

Twenty-four-hour coverage is standard practice for all successful hospitalist groups. At Lehigh Valley Hospital in Allentown, Pa., the hospitalist group features 17 FTEs that split time in a traditional seven-on/seven-off schedule. Five doctors per week round on units seeing patients; one works triage/admitting in the morning and sees some follow-ups in the afternoon; and one works a middle shift for admissions, consults, and ICU transfers.
The foundation of this coverage comes at night. We employ an overnight doctor—a nocturnist—every day of the year. This doctor’s sole responsibility is to cover night admissions, rapid responses, floor calls, and transfers.
Change Is Necessary, Difficult
Lehigh Valley’s change to a nocturnist model came about when members of the group asked for it. We needed to put a model in place that could help the group, improve morale, and improve our care at night. Of all of our shifts, nobody wanted to work overnight. Each clinician was working about four weeks of nights per year, and we started to notice that our new hires from residency were the only ones truly capable of handling the sleep challenges—or, more truthfully, our veteran hospitalists were having difficulty with the nights.
For such a large group, having a nocturnist makes sense. However, there are a few issues to contend with in hiring a nocturnist. Most notably, nocturnists are hard to come by. It takes a special type of person to come in and work the opposite schedule from everyone else. Nocturnists are typically alone in the hospital and don’t always have the support of other hospitalists when times get tough. They usually are at the mercy of other stakeholders. Namely, they are at the mercy of the ED. If the ED is busy, then so is the nocturnist. That special type of person knows the balance and becomes a specialist in ED dynamics, as well as in ED night staffing.
Nocturnists are expensive; we looked at MGMA and SHM data and realized that we would have to pay a 20% to 50% premium if we wanted to employ a true seven-on nocturnist. And if we wanted all nights covered, we would have to hire two of these doctors.
Another point of contention is the buy-in from administration. CEOs and CMOs often don’t understand the need to pay for a nocturnist, and more often than not, they fail to see the need to have a nocturnist employed in the first place.
Finally, in the event of sick time, holidays, or vacation time, the hospitalist team is at the mercy of the nocturnist in terms of necessitating coverage.
Internal Solution=Perfect Remedy
In addition to the aforementioned concerns, I recently experienced a “what’s most important to me?” moment at work with the expectation of my first child. I planned on returning to work after my maternity leave, but I was reassessing just exactly how much I wanted to come back to work. It was in this setting that I began to brainstorm ways to help the group with our concerns regarding working nights, as well as my own feelings of being torn with such a grueling schedule while having a new baby at home.
Then the solution hit me: a new nocturnist model.
After long discussions with the group and group leadership, we found, not surprisingly, there were a good number of people who valued time more than money. I fell into the category of desiring more time away over a premium salary. We also found two others like me who fit this same category. None of us were considered “nocturnists” up to this point, and none of us would have gone for the idea of being seven-on/seven-off nocturnists, either. So we needed a new plan.
And with a little brainstorming and schedule-wrenching, the new nocturnist was born at Lehigh Valley. We are a group of 17. By taking the three willing participants out of the pool of 17 hospitalists and asking them to exclusively work nights, rotating in a one-week-on, two-weeks-off rotation, we were able to still leave 14 doctors to run the day shifts. The daytime hospitalists would no longer have to work nights, drastically improving their quality of work life.
This was a huge step forward for our group. It was a morale boost for the daytime doctors and actually allowed the group to save money. We were looking for doctors 18 and 19, and instead found internal solutions to our night problems. The schedule fit together like a patchwork quilt.
In exchange for two weeks off, the three nocturnists agreed to no additional vacation time. Our salaries stayed the same, too. So from a budgetary standpoint, nothing changed. From a quality-of-life standpoint, everyone was happy. My nocturnist colleagues and I were happy to exchange working nights every third week for the same salary in exchange for more days off.
The new schedule even allowed the group to eliminate the middle shift, creating an additional hospitalist available for daytime rounding. And having three nocturnists creates a pool of night doctors who are readily available to cover each other’s sick or personal time.
In all fairness, this new model was not an easy sell to administration. But as the group became more stable and morale increased, we, as members of the group, relied on this stability. We also noticed an increase in recruitment. Veterans and rookies wanted to start in a practice that had its nights covered. Ultimately, increasing our daytime capacity increased our inpatient encounters, and by increasing recruitment and retaining our current staff, our administration saw the benefits.
Employing a team of nocturnists maintains group stability, is cost-effective, helps with retention, boosts morale, and is attractive new recruits. Hospitalist programs that are struggling with staffing should consider a similar approach—and remember that they might be able to change everyday life without changing the ever-important bottom line.
Dr. Verdetti-Healy is a nocturnist at Lehigh Valley Hospital in Allentown, Pa.
Daniel Bitetto, MD, SFHM, chief of the section of hospital medicine at Lehigh Valley Hospital in Allentown, Pa., contributed to this report.
Lack of Transparency Plagues U.S. Health Care System

Everything has a price, and we all have become accustomed to knowing how much something is going to cost before we buy it. Generally, we start with thinking about how much we are willing to pay, then finding what we need within the range of what we expect to pay. Whether it is shopping on Amazon.com, negotiating the price with a landscaper, or going out to eat, we get to weigh the options in advance of acquiring the goods or services. And, generally ahead of the purchase of big-ticket items, we get an itemized list of what is available.
I recently had to buy a car. Some of the many decisions that went into the purchase were whether to include some of the offered amenities, including:
- “Surround sound”;
- Seat heaters;
- Blind-spot indicator system;
- Premium floor mat package; and
- Built-in GPS.
My husband and I thought about the price of each of these line items relative to what we were going to “get out of it”—e.g., the value. Seat heaters in South Carolina? No, thanks. Surround sound? We had to flip a coin on that one. Safety features? Absolutely. Premium floor mat package? Only if they were guaranteed to be Fruit Roll-Ups-resistant.
Over the course of several negotiations, we picked and chose options that were highly likely to add value (safety, comfort, convenience) and omitted the rest. Then we settled on a total price, paid the negotiated price, and drove away fairly content.
Now, this doesn’t mean that we actually knew the cost of adding each of those amenities into our new car; would anyone actually be able to tell us exactly how much each of those features cost to innovate, create, and install? Probably not, but they might be able to give us a pretty good estimate, as well as an estimate of how much had been added in to ship it to the dealer, to pay the overhead for the dealership, and to pay the dealership staff (from the front desk to the CEO). And we could feel pretty certain that most buyers would be presented with similar prices, regardless of their personal characteristics.
So all in all, there was a reasonable amount of transparency around the cost and the price of the car and all of its amenities, as there would be in most industries. Except in health care.
A Ton of Money, for What?
There was a fascinating article in the March 4 edition of Time titled “Bitter Pill” that discussed the cost and the price of health-care services.1 It certainly is a worthy topic, as the U.S. spends about 20% of our gross domestic product on health care, whereas most other developed countries spend half of that. In fact, according to the article, the U.S. spends more on health care annually ($2.8 trillion) than the top 10 countries combined—Japan, Germany, France, China, United Kingdom, Italy, Canada, Brazil, Spain, and Australia.
About $800 billion of our health care is paid out annually by the Centers for Medicare & Medicaid Services (CMS). CMS is an ongoing and substantial driver to the depth of the federal deficit. When Medicare was enacted in 1965, they expected the cost in 1990 to be about $12 billion per year, which was miscalculated by more than a factor of 10.
And the federal deficit, while insurmountably important, pales in comparison to the sobering statistic that 60% of personal bankruptcies are filed due to health-care bills.
Equally disappointing, the U.S. does not appear to get great value out of this exorbitant price tag, as our health-care outcomes certainly are not any better, and are sometimes worse, than other industrialized countries.
Elephants in the Room
The Time article talks extensively about the lack of transparency and drivers for cost in the industry. But there are two major, unreconciled questions the article fails to answer that are at the core of the issue:
- Is health care in the U.S. a right or a luxury?
- Can the U.S. health-care system be compassionate and restrictive at the same time?
You really don’t encounter the first question with any other industry. If I am hungry and do not have any money, I would not march into a restaurant and say, “I am hungry; therefore, you must feed me.” But we all feel like we can—and should—march into an emergency room and say, “I am sick; therefore, you must treat me,” no matter our financial situation. For all other industries, we rely on community resources, nonprofit agencies, and some state/federal funding to bridge gaps in basic necessities (food, housing, clothing, and transportation). And when those run short, people do without.
Car dealerships and Jiffy Lube do not have to follow any Emergency Medicine Treatment and Active Labor Act rules. If health care is a right, then we should not make individuals figure out how to get it, and we should not accept huge disparities in the provision of care based on personal characteristics.
My hospital, like most others in the U.S., is trying to figure out how to cut costs and do more with less. In a series of town-hall-style meetings, our leadership has been telling all of our hospital staff about planned cost-cutting and revenue-generating strategies. One of the tactics is to be more proactive and consistent with collecting copays in outpatient settings (before the delivery of any visit, test, or procedure) and to have parity with our local market on setting the price of those copays. But several employees were wrestling with the thought of collecting copays before the delivery of service. Some voiced a particular concern: “But what if they don’t have the money?” Again, not a conversation heard too often at car dealerships or Jiffy Lube.
The U.S. has a long way to go in reconciling these questions. Addressing them might be easier if there were more transparency in pricing. When you walk into Jiffy Lube, you are presented with all the things you might need for your car, based on make, model, and mileage; you get a listing of the cost of all the items, then you make decisions about what you do and do not need as you factor in what you are willing to spend. But when you go for your annual primary-care check-up, you are not presented a list of all the things you need (based on age, comorbidities, family history, etc.); you are not given a listing of the cost of those available services (check-up, eye exam, colonoscopy, pneumococcal vaccination); and rarely is there ever a discussion of what you are willing to spend. You just assume you need what is recommended, then get a bill later. There is almost no incentive for providers to discuss or present those prices to patients in advance. There is even less incentive to reduce the utilization of those offered services. And the price on the bill variably reflects the actual cost of the products/services provided.
In the hospital setting, the price of most products/services are based on the “chargemaster,” which is a fictional line listing of prices, which, according to the Time article, “gives them a big number to put in front of rich, uninsured patients” to make up for the losses in revenue from all other patients.
For the most part, health-care reform efforts have done little to address the two unanswered questions. And although reform efforts have triggered plenty of discussions about changing the rules on who pays for what and when, these efforts have done little to change the price or the cost of care, or make them more transparent.
The author of “Bitter Pill” makes an attempt to call out the “bad actors” in the industry, those who drive up the cost of health care—health-care leaders with generous salaries, pharmaceutical companies, device/product companies, trial lawyers, and profitable laboratory and radiology departments. But the article does not come close to capturing the other elephants in the room. Without confronting those issues, we will continue to fail to distinguish between the cost and the price, and any value within.
Reference
Dr. Scheurer is a hospitalist and chief quality officer at the Medical University of South Carolina in Charleston. She is physician editor of The Hospitalist. Email her at [email protected].
Hospitalists on the Move

Judy Shumway, DO, practice group leader and regional medical director of IPC: The Hospitalist Company’s San Antonio region, received IPC’s Hospitalist of the Year award for acute-care practice. Dr. Shumway helped pioneer the hospitalist program at Methodist Stone Oak Hospital in San Antonio. She has been a hospitalist with IPC since 2007.

Rafael Rondon, MD, practice group leader in IPC: The Hospitalist Company’s Tampa, Fla., region, received IPC’s Hospitalist of the Year award for post-acute care. Dr. Rondon has been with IPC since 2008. He is actively pursuing the IPC-UCSF Fellowship Program for Hospitalist Leaders.

Ty Montgomery, FN-C, a nurse practitioner and practice group representative in IPC: The Hospitalist Company’s Phoenix region, has been awarded IPC’s Hospitalist of the Year award for non-physician providers. Montgomery was recognized for helping to bring the hospitalist care model to northern Arizona’s rural communities.

Gary G. Gammon, MD, has been named the new medical director of hospitalist services at Moore Regional Hospital (MRH) in Pinehurst, N.C. Dr. Gammon previously worked for the hospitalist program at Gaston Memorial Hospital in Gastonia, N.C. In his new role, Dr. Gammon will oversee 36 hospitalists and 15 nonphysician providers in the hospitalist service.

Kerry Weiner, MD, is the new chief medical officer at North Hollywood, Calif.-based IPC: The Hospitalist Company. Prior to his new position, Dr. Weiner served as IPC’s chief clinical officer. Before joining IPC in 2011, he served as CMO for Lakeside Medical Organization, a multispecialty community health-care provider based in Northridge, Calif.
Business Moves

Sound Physicians, based in Tacoma, Wash., has announced plans to begin managing hospitalist services at Sentara Obici Hospital in Suffolk, Va. The 168-bed facility is one of 10 Sentara Medical Group acute-care hospitals throughout Virginia. Sound Physicians manages more than 650 hospitalists at more than 70 facilities across the U.S.
Hillsdale Community Health Center in Hillsdale, Mich., has announced plans to launch a new hospitalist program later this year. The 78-bed community hospital will begin staffing six hospitalists to serve its patients.
The South Bend, Ind.-based OB/GYN Associates of Northern Indiana is offering OB hospitalist services at Saint Joseph Regional Medical Center in Mishawaka. OBNI will provide round-the-clock services at the 286-bed acute-care facility.
Henry County Health Center in Mount Pleasant, Iowa, in partnership with nearby Family Medicine of Mt. Pleasant, has launched a new hospitalist program at the 74-bed community hospital. The program will begin with two hospitalists, and Family Medicine of Mt. Pleasant will provide supplementary coverage as needed.
Reference
Judy Shumway, DO, practice group leader and regional medical director of IPC: The Hospitalist Company’s San Antonio region, received IPC’s Hospitalist of the Year award for acute-care practice. Dr. Shumway helped pioneer the hospitalist program at Methodist Stone Oak Hospital in San Antonio. She has been a hospitalist with IPC since 2007.
Rafael Rondon, MD, practice group leader in IPC: The Hospitalist Company’s Tampa, Fla., region, received IPC’s Hospitalist of the Year award for post-acute care. Dr. Rondon has been with IPC since 2008. He is actively pursuing the IPC-UCSF Fellowship Program for Hospitalist Leaders.
Ty Montgomery, FN-C, a nurse practitioner and practice group representative in IPC: The Hospitalist Company’s Phoenix region, has been awarded IPC’s Hospitalist of the Year award for non-physician providers. Montgomery was recognized for helping to bring the hospitalist care model to northern Arizona’s rural communities.
Gary G. Gammon, MD, has been named the new medical director of hospitalist services at Moore Regional Hospital (MRH) in Pinehurst, N.C. Dr. Gammon previously worked for the hospitalist program at Gaston Memorial Hospital in Gastonia, N.C. In his new role, Dr. Gammon will oversee 36 hospitalists and 15 nonphysician providers in the hospitalist service.
Kerry Weiner, MD, is the new chief medical officer at North Hollywood, Calif.-based IPC: The Hospitalist Company. Prior to his new position, Dr. Weiner served as IPC’s chief clinical officer. Before joining IPC in 2011, he served as CMO for Lakeside Medical Organization, a multispecialty community health-care provider based in Northridge, Calif.
Business Moves
Sound Physicians, based in Tacoma, Wash., has announced plans to begin managing hospitalist services at Sentara Obici Hospital in Suffolk, Va. The 168-bed facility is one of 10 Sentara Medical Group acute-care hospitals throughout Virginia. Sound Physicians manages more than 650 hospitalists at more than 70 facilities across the U.S.
Hillsdale Community Health Center in Hillsdale, Mich., has announced plans to launch a new hospitalist program later this year. The 78-bed community hospital will begin staffing six hospitalists to serve its patients.
The South Bend, Ind.-based OB/GYN Associates of Northern Indiana is offering OB hospitalist services at Saint Joseph Regional Medical Center in Mishawaka. OBNI will provide round-the-clock services at the 286-bed acute-care facility.
Henry County Health Center in Mount Pleasant, Iowa, in partnership with nearby Family Medicine of Mt. Pleasant, has launched a new hospitalist program at the 74-bed community hospital. The program will begin with two hospitalists, and Family Medicine of Mt. Pleasant will provide supplementary coverage as needed.
Reference
Hospitalists Encouraged to Join Hospital Committees Early

Hospitalists Should Not Hesitate to Join Hospital Committees
What’s the story with hospital committee work? Is this part of my job?
–Timothy P. Young, Fort Worth, Texas
Dr. Hospitalist responds:
Yes. Allow me to explain. It’s 2013, and hospitalists are the physician workforce in the hospital. Yes, radiologists, anesthesiologists, and ED physicians are hospital-based, but their work is location-focused, not longitudinal and cross-discipline, as it is for general hospitalists. A hospital has a rather cumbersome administrative apparatus, and, as in any large organization, committees are its lifeblood. Your hospital leadership also will appreciate your contribution in a role outside of day-to-day clinical work.
The standing rule in our group is that every hospitalist must serve on at least one hospital committee. Here are three committees that strike me as most vital to our job:
Peer review: Arguably, this is the committee with the most impact in the hospital when it is run correctly. Although its stated objective is to review physician-related clinical concerns, don’t be surprised if offending physicians interpret clinical complaints as political grievances. This requires a thick skin and the ability to park your allegiances at the door. Physicians generally have done a pretty poor job policing themselves over the years, and while this committee does not need to be Draconian in nature, it should review complaints seriously and objectively. That also means recusing yourself from discussions involving your partners.
Credentialing: Another essential committee. I can’t tell you the number of times over the years we have hired a new physician with a specific start date in mind, only to miss that date over a delay with hospital credentialing. Talk about a morale killer—when everyone is overworked and the promised extra help doesn’t arrive ... ouch. Having a representative on this committee is no guarantee of punctual credentialing; however, it can help your group stay on top of expected deadlines and potential hiccups.
Information technology: EMR? Meaningful use? CPOE? Physician champion for IT issues? At the rate we’re going, it looks like all of us are going to work for the IT department someday. Lovely as these people are, they often have imperfect insight into the day-to-day workload of a hospitalist. Little things—such as the fact that a computer workstation also needs a telephone so you can answer pages—will never make it onto their radar screen without physician input.
Other committees of note: internal medicine, pharmacy and therapeutics (P&T), infection control, quality control, patient safety, ethics, and executive council. One caveat: The importance of these committees will vary greatly from hospital to hospital, so if you are new, take the time to ask around and get the lay of the land. My list and the rankings are by no means definitive.
Go ahead and join a committee, even if it does not happen to be your first choice. It does not mean that you will be on that committee for life, but it will grant you good exposure across multiple disciplines in the hospital. Overall, for your practice health, your group should be well represented on hospital committees.
New Study to Assess Impact of Dermatologist’s Consultation for Hospital Patients
A study is underway to assess the impact of a dermatologist’s consultation for patients admitted to the hospital with cellulitis.
Started last October, the randomized controlled trial is comparing patients overseen by internal-medicine hospitalists alone to those who are also evaluated by a dermatologist soon after admission to Massachusetts General Hospital in Boston. Daniela Kroshinsky, MD, MPH, the principal investigator, hypothesizes that hospital admission for cellulitis involving consultation with a dermatologist might decrease length of stay, readmission rates, incidence of pseudocellulitis, cost, and/or antibiotic usage.
“We did a similar study in the outpatient setting that demonstrated over 80 percent reduction in antibiotic use,” says Dr. Kroshinsky, the hospital’s director of pediatric dermatology and director of inpatient dermatology, education, and research.
Patients in the control group are instructed to follow hospitalists’ recommendations solely. This includes the timing and type of post-discharge appointments. As part of the standard of care, these patients can consult with a dermatologist if necessary or requested.
Patients randomized to the treatment group receive a consultation with a dermatologist, along with treatment recommendations. They also have a follow-up visit in a dermatology clinic after discharge. Both groups will be assessed for readmission or complications.
Communication Key to Peaceful Coexistence for Competing Hospital Medicine Groups

Experienced hospitalists and medical directors agree that the key to multiple hospitalist groups coexisting effectively under one roof—whether directly competing or not—is good communication. Effective communication can take time to build.
“Start by working together on something—anything, [such as] a hospital committee of some sort where there’s not likely to be much tension,” says hospitalist pioneer and practice consultant John Nelson, MD, MHM.
Dr. Nelson practices at Overlake Hospital in Bellevue, Wash., which has a hospitalist group employed by the hospital and another employed by Group Health Cooperative, a nonprofit health system in Washington state. It is important to put some trust in the trust bank, he says, “and that’s hard if you have no social connections at all. At my hospital, we enjoy each other’s company, we visit each other at lunch, and we even tried to have a journal club.” The two hospitalist groups work together on developing care protocols. Dr. Nelson says it also makes sense for the groups’ leaders to sit down together on a regular basis and have a venue for discussing important issues and solving problems that may arise.
Other suggestions for hospitalist groups working together under one roof include:
- Clearly define each group’s territory. The groups’ representatives can go out and try to persuade health plans or physician groups to shift their hospitalist allegiances, but there should be no “trolling” or “poaching” of patients going on inside the hospital’s walls. That will only confuse patients and disrupt the hospital’s larger service goals.
- Inform the ED and other key staff of your schedules. It’s important that everyone know exactly who is supposed to get which patients, and how these referrals get made. But recognize that mistakes happen and, hopefully, these will even out between the groups over time.
- Transparency, honesty, and even-handed treatment of all hospitalists can prevent resentment. Clearly defined guidelines and expectations are helpful. If the policy spells out transfers for an incorrectly referred patient, both sides should be accessible and cooperative with that process.
- Identify areas of common interest and agree to work together on these areas (i.e. competition-free zones). It might be possible, for example, for competing groups to take each others’ after-hours call on a rotating basis, with a firm commitment not to steal patients along the way.
- Spell out responsibilities in a way that everyone can agree is fair, such as alternating referrals or taking call on alternating days. For example, if subsidies are paid to more than one hospitalist group, is this done equitably, such as based on the number of hospitalist FTEs or shifts?
- Restrictive covenants and contractual noncompete clauses could become an issue in areas where multiple groups practice. Rather than using overly broad, blanket language, it could be clarified that such pacts apply only to the hospital where the physician currently works, and within a reasonable time frame. But everyone involved should be aware of what these covenants contain and, if they appear unreasonable, don’t sign them.
—Larry Beresford
Documentation, CMS-Approved Language Key to Getting Paid for Hospitalist Teaching Services

When hospitalists work in academic centers, medical and surgical services are furnished, in part, by a resident within the scope of the hospitalists’ training program. A resident is “an individual who participates in an approved graduate medical education (GME) program or a physician who is not in an approved GME program but who is authorized to practice only in a hospital setting.”1 Resident services are covered by Centers for Medicare & Medicaid Services (CMS) and paid by the Fiscal Intermediary through direct GME and Indirect Medical Education (IME) payments. These services are not billed or paid using the Medicare Physician Fee Schedule. The teaching physician is responsible for supervising the resident’s health-care delivery but is not paid for the resident’s work. The teaching physician is paid for their personal and medically necessary service in providing patient care. The teaching physician has the option to perform the entire service, or perform the self-determined critical or key portion(s) of the service.
Comprehensive Service
Teaching physicians independently see the patient and perform all required elements to support the visit level (e.g. 99233: subsequent hospital care, per day, which requires at least two of the following three key components: a detailed interval history, a detailed examination, or high-complexity medical decision-making).2 The teaching physician writes a note independent of a resident encounter with the patient or documentation. The teaching physician note “stands alone” and does not rely on the resident’s documentation. If the resident saw the patient and documented the encounter, the teaching physician might choose to “link to” the resident note in lieu of personally documenting the entire service. The linking statement must demonstrate teaching physician involvement in the patient encounter and participation in patient management. Use of CMS-approved statements is best to meet these requirements. Statement examples include:3
- “I performed a history and physical examination of the patient and discussed his management with the resident. I reviewed the resident’s note and agree with the documented findings and plan of care.”
- “I saw and evaluated the patient. I agree with the findings and the plan of care as documented in the resident’s note.”
- “I saw and examined the patient. I agree with the resident’s note, except the heart murmur is louder, so I will obtain an echo to evaluate.”
Each of these statements meets the minimum requirements for billing. However, teaching physicians should offer more information in support of other clinical, quality, and regulatory initiatives and mandates, better exemplified in the last example. The reported visit level will be supported by the combined documentation (teaching physician and resident).
The teaching physician submits a claim in their name and, if it is a Medicare claim, appends modifier GC to the selected visit level (e.g. 99223-GC). This alerts the Medicare contractor that services were provided under teaching physician rules. Requests for documentation should include a response with medical record entries from the teaching physician and resident.
Critical/Key Portion
“Supervised” service: The resident and teaching physician can round together; they can see the patient at the same time. The teaching physician observes the resident’s performance during the patient encounter, or personally performs self-determined elements of patient care. The resident documents their patient care. The attending must still note their presence in the medical record, performance of the critical or key portions of the service, and involvement in patient management. CMS-accepted statements include:3
- “I was present with the resident during the history and exam. I discussed the case with the resident and agree with the findings and plan as documented in the resident’s note.”
- “I saw the patient with the resident and agree with the resident’s findings and plan.”
Although these statements demonstrate acceptable billing language, they lack patient-specific details that support the teaching physician’s personal contribution to patient care and the quality of their expertise. The teaching physician selects the visit level that represents the combined documentation and, if it is a Medicare claim, appends modifier GC to the selected visit level (e.g. 99232-GC).
“Shared” service: The resident sees the patient unaccompanied and documents the corresponding care provided. The teaching physician sees the patient at a different time but performs only the critical or key portions of the service. The case is subsequently discussed with the resident. The teaching physician must document their presence and performance of the critical or key portions of the service, along with any patient management. Using CMS-quoted statements ensures regulatory compliance:3
- “I saw and evaluated the patient. I reviewed the resident’s note and agree, except that the picture is more consistent with pericarditis than myocardial ischemia. Will begin NSAIDs.”
- “I saw and evaluated the patient. Discussed with resident and agree with resident’s findings and plan as documented in the resident’s note.”
- “See resident’s note for details. I saw and evaluated the patient and agree with the resident’s finding and plans as written.”
- “I saw and evaluated the patient. Agree with resident’s note, but lower extremities are weaker, now 3/5; MRI of L/S spine today.”
Once again, the teaching physician selects the visit level that represents the combined documentation and, if it is a Medicare claim, appends modifier GC to the selected visit level (e.g. 99233-GC).
EHR Considerations
When seeing patients independent of one another, the timing of the teaching physician and resident encounters does not impact billing. However, the time that the resident encounter is documented in the medical record can significantly impact the payment when reviewed by external auditors. When the resident note is dated and timed later than the teaching physician’s entry, the teaching physician cannot consider the resident’s note for visit-level selection. The teaching physician should not “link to” a resident note that is viewed as “not having been written” prior to the teaching physician note. This would not fulfill the requirements represented in the CMS-approved language “I reviewed the resident’s note and agree.”
Electronic health record (EHR) systems sometimes hinder compliance. If the resident completes the note but does not “finalize” or “close” the encounter until after the teaching physician documents their own note, it can falsely appear that the resident note did not exist at the time the teaching physician created their entry. Because an auditor can only view the finalized entries, the timing of each entry might be erroneously represented. Proper training and closing of encounters can diminish these issues.
Additionally, scribing the attestation is not permitted. Residents cannot document the teaching physician attestation on behalf of the physician under any circumstance. CMS rules require the teaching physician to document their presence, participation, and management of the patient. In an EHR, the teaching physician must document this entry under his/her own log-in and password, which is not to be shared with anyone.
Students
CMS defines student as “an individual who participates in an accredited educational program [e.g. a medical school] that is not an approved GME program.”1 A student is not regarded as a “physician in training,” and the service is not eligible for reimbursement consideration under the teaching physician rules.
Per CMS guidelines, students can document services in the medical record, but the teaching physician may only refer to the student’s systems review and past/family/social history entries. The teaching physician must verify and redocument the history of present illness. A student’s physical exam findings or medical decision-making are not suitable for tethering, and the teaching physician must personally perform and redocument the physical exam and medical decision-making. The visit level reflects only the teaching physician’s personally performed and documented service.
Carol Pohlig is a billing and coding expert with the University of Pennsylvania Medical Center, Philadelphia. She is also on the faculty of SHM’s inpatient coding course.
References
- Centers for Medicare and Medicaid Services. Guidelines for Teaching Physicians, Interns, Residents. CMS website. Available at: http://www.cms.gov/MLNProducts/downloads/gdelinesteachgresfctsht.pdf. Accessed Jan. 8, 2013.
- Abraham M, Ahlman J, Anderson C, Boudreau A, Connelly J. Current Procedural Terminology 2012 Professional Edition. Chicago: American Medical Association Press; 2011.
- Centers for Medicare and Medicaid Services. Medicare Claims Processing Manual: Chapter 12, Section 100. CMS website. Available at: http://www.cms.hhs.gov/manuals/downloads/clm104c12.pdf. Accessed Jan. 8, 2013.
- Centers for Medicare and Medicaid Services. Medicare Benefit Policy Manual: Chapter 15, Section 30.2. CMS website. Available at: http://www.cms.hhs.gov/manuals/Downloads/bp102c15.pdf. Accessed Jan. 8, 2013.