User login
FDA approves irritable bowel syndrome treatment
(IBS-C).
Plecanatide had previously been approved to treat adults with chronic idiopathic constipation (CIC).
Plecanatide met both of its primary endpoints, with reductions in abdominal pain in both studies, compared with placebo (30.2% vs. 17.8% in study 1, P < .001; 21.5% vs. 14.2% in study 2, P = .009).
Plecanatide is the only prescription, once-daily medication that treats both CIC and IBS-C in adults. The drug should be available in the first quarter of 2018.
Birth cohort affected 2015-2016 flu vaccine effectiveness
The influenza vaccine introduced in 2009 showed reduced effectiveness during the 2015-2016 influenza season, but only in adults born between 1958 and 1979, according to an analysis published online in the Journal of Infectious Diseases.
Using the Influenza Vaccine Effectiveness Network, researchers analyzed data from 2,115 patients with medically attended acute respiratory illness who tested positive for A(H1N1)pdm09 influenza virus, and 14,696 patients who tested negative for the influenza virus, from 2010-2011 to 2015-2016 (excluding the 2014-2015 influenza season).
Overall, 48% of the influenza virus–negative patients and 28% of the virus-positive patients had received at least one dose of the seasonal inactivated influenza vaccine more than 2 weeks before they fell ill.
However, the vaccine, which was based on the A/California/07/2009 strain of the A(H1N1)pdm09 virus, was only 47% effective during the 2015-2016 season, compared with 61% effectiveness during the 2010-2011 season through to the 2013-2014 season.
When researchers looked at vaccine effectiveness by birth cohort, they found that one particular cohort – individuals born between 1958 and 1979 – showed a significantly reduced vaccine effectiveness (22%) during the 2015-2016 season. By comparison, vaccine effectiveness in this cohort was 61% during the 2010-2013 seasons, and 56% during the 2013-2014 season.
When this birth cohort was excluded from analysis of the 2015-2016 season, the overall vaccine effectiveness for that season was 61%.
While the vaccine was based on an early reference strain of A(H1N1)pdm09, the virus itself later acquired mutations in the hemagglutinin gene, leading to the emergence of new genetic clades, including 6B, which dominated in the 2013-2014 influenza season, and 6B.1, which dominated in 2015-2016.
“Limited serologic data suggest that some adults born during 1958-1979 (age range in 2015-2016, 36-57 years) have decreased antibody titers against A(H1N1)pdm09 group 6B and 6B.1 viruses,” wrote Brendan Flannery, PhD, from the Centers for Disease Control and Prevention, and his coauthors.
They suggested that individuals in this cohort may have been immunologically primed with A/USSR/90/1977-like viruses, which were the first group of A(H1N1) viruses that this cohort would have been exposed to. A(H1N1) strains didn’t circulate between 1958 and 1977. Vaccination with A(H1N1)pdm09 viruses may have induced antibodies against shared antigenic components found on early versions of A(H1N1)pdm09.
If these shared antigenic epitopes were then altered in the later 6B and 6B.1 viruses, that might account for decreased antibody titers in this age group.
“Replacement of the A/California/07/2009(H1N1)pdm09 vaccine reference strain with A/Michigan/45/2015 (group 6B.1) should lead to improved [vaccine effectiveness] against circulating A(H1N1)pdm09 viruses,” the investigators noted.
The study was supported by the Centers for Disease Control and Prevention, the National Institutes of Health, and the National Center for Advancing Translational Sciences. Eight authors declared funding, grants, and consultancies with the pharmaceutical industry, with five also declaring funding from the CDC.
SOURCE: Flannery B et al. J Infect Dis. 2018 Jan 18. doi: 10.1093/infdis/jix634.
This study proposes that influenza virus strains encountered early in life focus the immune response to later infection or vaccination on shared epitopes between the early and later strains. Supporting this hypothesis is evidence from other studies showing that 60% of the serological response to inactivated influenza vaccines is the result of boosting pre-existing antibodies, rather than the creation of new, vaccine-induced antibodies.
However there are also some flaws to this argument, and we should be careful to avoid confirmation bias. For example, the reduction in effectiveness of vaccines against A(H1N1) has been observed in North America, where this study is located, but to a lesser extent in studies conducted in other regions. Reductions in vaccine effectiveness have also been observed in other birth cohorts and during other influenza seasons.
That aside, accumulating evidence suggests that the vaccine strain be updated from A/California/7/2009 to A/Michigan/45/2015 (a clade 6B.1 strain) for the 2016-2017 influenza seasons.
Allen C. Cheng, PhD, is from the School of Public Health and Preventive Medicine at Monash University, Melbourne, and Kanta Subbarao, MBBS, is from the World Health Organization Collaborating Centre for Reference and Research on Influenza and the Peter Doherty Institute for Infection and Immunity, Australia. These comments are taken from an accompanying editorial (J Infect Dis. 2018, Jan 18. doi: 10.1093/infdis/jix635). The authors declared support from the Australian Department of Health and the Australian National Health and Medical Research Council. No conflicts of interest were declared.
The influenza vaccine introduced in 2009 showed reduced effectiveness during the 2015-2016 influenza season, but only in adults born between 1958 and 1979, according to an analysis published online in the Journal of Infectious Diseases.
Using the Influenza Vaccine Effectiveness Network, researchers analyzed data from 2,115 patients with medically attended acute respiratory illness who tested positive for A(H1N1)pdm09 influenza virus, and 14,696 patients who tested negative for the influenza virus, from 2010-2011 to 2015-2016 (excluding the 2014-2015 influenza season).
Overall, 48% of the influenza virus–negative patients and 28% of the virus-positive patients had received at least one dose of the seasonal inactivated influenza vaccine more than 2 weeks before they fell ill.
However, the vaccine, which was based on the A/California/07/2009 strain of the A(H1N1)pdm09 virus, was only 47% effective during the 2015-2016 season, compared with 61% effectiveness during the 2010-2011 season through to the 2013-2014 season.
When researchers looked at vaccine effectiveness by birth cohort, they found that one particular cohort – individuals born between 1958 and 1979 – showed a significantly reduced vaccine effectiveness (22%) during the 2015-2016 season. By comparison, vaccine effectiveness in this cohort was 61% during the 2010-2013 seasons, and 56% during the 2013-2014 season.
When this birth cohort was excluded from analysis of the 2015-2016 season, the overall vaccine effectiveness for that season was 61%.
While the vaccine was based on an early reference strain of A(H1N1)pdm09, the virus itself later acquired mutations in the hemagglutinin gene, leading to the emergence of new genetic clades, including 6B, which dominated in the 2013-2014 influenza season, and 6B.1, which dominated in 2015-2016.
“Limited serologic data suggest that some adults born during 1958-1979 (age range in 2015-2016, 36-57 years) have decreased antibody titers against A(H1N1)pdm09 group 6B and 6B.1 viruses,” wrote Brendan Flannery, PhD, from the Centers for Disease Control and Prevention, and his coauthors.
They suggested that individuals in this cohort may have been immunologically primed with A/USSR/90/1977-like viruses, which were the first group of A(H1N1) viruses that this cohort would have been exposed to. A(H1N1) strains didn’t circulate between 1958 and 1977. Vaccination with A(H1N1)pdm09 viruses may have induced antibodies against shared antigenic components found on early versions of A(H1N1)pdm09.
If these shared antigenic epitopes were then altered in the later 6B and 6B.1 viruses, that might account for decreased antibody titers in this age group.
“Replacement of the A/California/07/2009(H1N1)pdm09 vaccine reference strain with A/Michigan/45/2015 (group 6B.1) should lead to improved [vaccine effectiveness] against circulating A(H1N1)pdm09 viruses,” the investigators noted.
The study was supported by the Centers for Disease Control and Prevention, the National Institutes of Health, and the National Center for Advancing Translational Sciences. Eight authors declared funding, grants, and consultancies with the pharmaceutical industry, with five also declaring funding from the CDC.
SOURCE: Flannery B et al. J Infect Dis. 2018 Jan 18. doi: 10.1093/infdis/jix634.
FROM THE JOURNAL OF INFECTIOUS DISEASES
Key clinical point:
Major finding: The influenza vaccine effectiveness during the 2015-2016 season was just 22% in individuals born between 1958 and 1979.
Data source: A retrospective case-control study of 2,115 patients who tested positive for A(H1N1)pdm09 influenza virus, and 14,696 negative controls.
Disclosures: The study was supported by the Centers for Disease Control and Prevention, the National Institutes of Health, and the National Center for Advancing Translational Sciences. Eight authors declared funding, grants, and consultancies with the pharmaceutical industry, with five also declaring funding from the CDC.
Source: Flannery B et al. J Infect Dis. 2018 Jan 18. doi: 10.1093/infdis/jix634.
Delayed ileal pouch anal anastomosis creation linked to lower 30-day adverse events
LAS VEGAS – compared with creating the pouch at the time of initial surgery, results from an analysis of national data demonstrated.
“More than 600,000 Americans have UC, and 20%-30% of them require surgical management,” Bharati Kochar, MD, said at the Crohn’s & Colitis Congress, a partnership of the Crohn’s & Colitis Foundation and the American Gastroenterological Association. “The surgical procedure of choice for many UC patients is total proctocolectomy with ileal pouch anal anastomosis creation.”
According to Dr. Kochar, an advanced fellow in inflammatory bowel diseases at the University of North Carolina at Chapel Hill, existing American medical literature regarding ileal pouch anal anastomosis (IPAA) comes mostly from quaternary care centers and compares one-stage procedures with multistage procedures.
“The risks between two- to three-stage procedures are not described, and there are no prospective national reports of postoperative adverse events after IPAA creation,” she said.
Using data from the National Surgical Quality Improvement Program, Dr. Kochar and her associates conducted an observational cohort analysis of 2,390 adult patients with a postoperative diagnosis of UC who underwent IPAA procedures between 2011 and 2015. Their aims were to evaluate adverse events within 30 days after an IPAA creation and to compare adverse events between pouch creation at the time of colectomy and delayed pouch creation.
They also performed a subanalysis of total abdominal colectomy with ileostomy (TAC), the first stage in the delayed pouch procedures, versus pouch creation at the time of colectomy. Multivariable modified Poisson regression models were used to estimate risk ratios adjusted for age, sex, race, body mass index, smoking status, diabetes, preoperative albumin, and American Society of Anesthesiologists class.
Of the 2,390 patients, 1,571 had pouches created at the time of colectomy (group A), and 819 had delayed pouch creation (group B).
Compared with patients in group B, those in group A were older (a median age of 40 years vs. 37 years, respectively; P less than .01), were more likely to be on an immunosuppressant (51% vs. 15%; P less than .01), have a lower median preoperative albumin level (3.9 vs. 4.2; P less than .01), and a longer median length of stay (6 days vs. 5 days; P less than .01).
On unadjusted analyses, the researchers also observed that, at 30 days, patients in group A had significantly more major complications, such as mortality and cardiac arrest (12.4% vs. 8.7%; P less than .01); minor complications, such as superficial surgical site infections and pneumonia (11.8% vs. 6.1%; P less than .01); unplanned readmissions (statistically similar at 23.3% vs. 21.3%), and unplanned reoperations (7.7% vs. 3.8%; P less than .01).
After controlling for confounders, patients in group B were significantly less likely to have major complications (relative risk, 0.72), minor complications (RR, 0.48), unplanned readmissions (RR, 0.95), and unplanned reoperations (RR, 0.42).
In the subgroup analysis, Dr. Kochar and her associates observed that patients who underwent TAC were significantly older, compared with patients in group A (a median of 46 years vs. 40 years, respectively; P less than .01), and a higher proportion were on immunosuppressants (69% vs. 51%; P less than .01). “Despite these factors, the risk of adverse events after TAC was lower,” Dr. Kochar said.
She acknowledged certain limitations of the study, including the inability to accurately determine the risk of linked surgeries together and the inability to assess institution and operator factors. Also, data were not collected for the purposes of studying inflammatory bowel disease.
“This is the first prospective assessment of morbidity following IPAA creation in UC patients from a national database,” Dr. Kochar concluded. “Delayed pouch procedures are associated with a lower risk of unplanned reoperations and major and minor complications. Immunosuppression at the time of pouch creation may result in an increased risk of adverse events postoperatively. The findings can be valuable for preoperative risk assessment and postoperative management.”
Dr. Kochar reported having no financial disclosures.
*This story was updated on 3/26.
SOURCE: Kochar et al. Crohn’s & Colitis Congress 2018 Clinical Abstract 11.
REPORTING FROM THE CROHN’S & COLITIS CONGRESS
Key clinical point: Delayed ileal pouch anal anastomosis procedures are associated with a lower 30-day adverse-event rate.
Major finding: After controlling for confounders, patients who underwent delayed IPAA procedures were significantly less likely to have major complications (relative risk, 0.72), minor complications (RR, 0.48), unplanned readmissions (RR, 0.95), and unplanned reoperations (RR, 0.42) at 30 days, compared with those who underwent pouch creation at the time of initial surgery.
Study details: An observational cohort analysis of 2,390 adult patients with a postoperative diagnosis of UC.
Disclosures: Dr. Kochar reported having no financial disclosures.
Source: Kochar et al. Crohn’s & Colitis Congress 2018 Clinical Abstract 11. Gastroenterology. 2018;154(1)Suppl:S1-S114.
Sleep improved with urinary incontinence treatment
Treating urgency urinary incontinence in women may have the added benefit of improving their quality of sleep, according to a paper published online Jan. 9 in Obstetrics & Gynecology.
Researchers analyzed data from a multicenter, double-blind, randomized, controlled trial of daily antimuscarinic therapy (4-8 mg fesoterodine) or placebo in 645 women with urgency-predominant incontinence, which also evaluated sleep quality and daytime sleepiness.
The antimuscarinic treatment was also associated with a significant 0.48 point improvement in Pittsburgh Sleep Quality Index score (P = .02), compared with the placebo group, as well as significant improvements in sleep duration and sleep efficiency subscales. However, there were no significant differences between the two groups in Epworth Sleepiness Scale scores.
“Both fewer voids at night and decreased urge incontinence reduce the number of awakenings during the night, which may be reflected in higher sleep efficiency and longer sleep duration,” wrote Qurratul A. Warsi, MBBS, of the University of California, San Francisco, and her coauthors.
Antimuscarinic medications such as fesoterodine may have a sedating effect, the authors noted, which could also improve the quality of sleep. The study also did not control for sleep disorders such as obstructive sleep apnea and restless leg syndrome.
“This analysis provides new data that indicate initiating pharmacologic treatment for UUI in ambulatory women is associated with improvement in important domains of sleep,” they wrote. “Among community-dwelling women with UUI, flexible-dose antimuscarinic therapy not only resulted in improvement in incontinence measures, but was also associated with significant improvements in overall quality of sleep, sleep duration, and sleep efficiency.”
Pfizer funded the study and provided the study medication. Four authors declared research grants from the pharmaceutical sector, including three who had received grants or consultancies from Pfizer. One author declared royalties and stipends from the publishing industry. No other conflicts of interest were declared.
SOURCE: Warsi Q et al. Obstet Gynecol. 2018 Feb;131(2):204-11.
FROM OBSTETRICS & GYNECOLOGY
Key clinical point: Treating urinary incontinence may also result in improved sleep quality and duration.
Major finding: Women treated with antimuscarinic therapy had significantly improved Pittsburgh Sleep Quality Index scores, compared with those given placebo.
Data source: Analysis of data from a randomized, placebo-controlled trial in 645 women with urgency-predominant incontinence.
Disclosures: The study was funded by Pfizer, which also provided the study medication. Four authors declared research grants from the pharmaceutical sector, including three who had received grants or consultancies from Pfizer. One author declared royalties and stipends from the publishing industry. No other conflicts of interest were declared.
Source: Warsi Q et al. Obstet Gynecol. 2018 Feb;131(2):204-11.
CHMP recommends approval of emicizumab

The European Medicines Agency’s Committee for Medicinal Products for Human Use (CHMP) has recommended approval of emicizumab (Hemlibra®), a bispecific factor IXa- and factor X-directed antibody.
The recommendation is for emicizumab to be used as routine prophylaxis in patients of all ages who have hemophilia A with factor VIII inhibitors.
The marketing authorization application for emicizumab is being reviewed under accelerated assessment, a procedure granted to medicines the CHMP believes are of major interest for public health and therapeutic innovation.
The CHMP’s opinion on emicizumab will be reviewed by the European Commission (EC).
If the EC agrees with the CHMP, the commission will grant a centralized marketing authorization that will be valid in the European Union. Norway, Iceland, and Liechtenstein will make corresponding decisions on the basis of the EC’s decision.
The EC typically makes a decision within 67 days of the CHMP’s recommendation.
The CHMP’s recommendation for emicizumab is based on results from 2 phase 3 trials—HAVEN 1 and HAVEN 2.
Results from HAVEN 1 were published in NEJM and presented at the 26th ISTH Congress in July 2017. Updated results from HAVEN 2 were presented at the 2017 ASH Annual Meeting.
HAVEN 1
The study enrolled 109 patients (age 12 and older) with hemophilia A and FVIII inhibitors who were previously treated with bypassing agents (BPAs) on-demand or as prophylaxis.
The patients were randomized to receive emicizumab prophylaxis or no prophylaxis. On-demand treatment of breakthrough bleeds with BPAs was allowed.
There was a significant reduction in treated bleeds of 87% with emicizumab prophylaxis compared to no prophylaxis (95% CI: 72.3; 94.3, P<0.0001). And there was an 80% reduction in all bleeds with emicizumab (95% CI: 62.5; 89.8, P<0.0001).
Adverse events (AEs) occurring in at least 5% of patients treated with emicizumab were local injection site reactions, headache, fatigue, upper respiratory tract infection, and arthralgia.
Two patients experienced thromboembolic events (TEs), and 3 had thrombotic microangiopathy (TMA) while receiving emicizumab prophylaxis and more than 100 u/kg/day of activated prothrombin complex concentrate, on average, for 24 hours or more before the event. Two of these patients had also received recombinant factor VIIa.
Neither TE required anticoagulation therapy, and 1 patient restarted emicizumab. The cases of TMA observed were transient, and 1 patient restarted emicizumab.
HAVEN 2
In this single-arm trial, researchers evaluated emicizumab prophylaxis in 60 patients, ages 1 to 17, who had hemophilia A with FVIII inhibitors.
The efficacy analysis included 57 patients who were younger than 12. The 3 older patients were only included in the safety analysis.
Of the 57 patients, 64.9% had 0 bleeds, 94.7% had 0 treated bleeds, and 98.2% had 0 treated spontaneous bleeds and 0 treated joint bleeds. None of the patients had treated target joint bleeds.
Forty patients had a total of 201 AEs. The most common of these were viral upper respiratory tract infections (16.7%) and injection site reactions (16.7%).
There were no TEs or TMA events, and none of the patients tested positive for anti-drug antibodies. None of the 7 serious AEs in this trial were considered treatment-related. ![]()
VIDEO: COMPASS shows stroke-clot aspiration noninferior to retrieval
LOS ANGELES – Clot removal in acute ischemic stroke patients using an aspiration catheter was noninferior to clot removal using the standard method, a stent retriever, in a multicenter, randomized trial with 270 patients.
“There is now level I evidence that stent retrievers and primary aspiration have equivalent outcomes in emergent large vessel occlusions,” J Mocco, MD, said at the International Stroke Conference, sponsored by the American Heart Association.
The results “will give physicians more choice,” Dr. Mocco said in a video interview. Until now, “many physicians felt that they had to use stent retrievers” because these devices had an much bigger evidence base of efficacy and safety. The new findings provide evidence that supports aspiration as an alternative strategy, said Dr. Mocco, professor of neurosurgery and director of the Cerebrovascular Center at Mount Sinai Medical Center in New York.
The results Dr. Mocco reported from the COMPASS trial (Comparison of Direct Aspiration vs. Stent Retriever as a First Approach) were the second time that clot aspiration was shown to produce outcomes similar to stent retrieval. Similar findings came from a French multicenter trial, ASTER, reported in 2017 (JAMA. 2017 Aug 1;318[5]:443-52).
The study ran at 15 U.S. centers during 2015-2017 and randomized patients with emergent large vessel occlusion strokes to receive initial treatment with either an aspiration catheter or a stent retriever. The specific type of catheter or stent used was left up to each operator. In 83% of the aspiration cases and 81% of the stent retriever cases, the initial device used produced a moderately high or better level of restored blood flow within the occluded artery, with thrombolysis in cerebral infarction (TICI) 2b flow or greater.
The study’s primary efficacy endpoint was the percentage of patients with a modified Rankin Scale score of 0-2 at 90 days after treatment, which occurred in 52% of patients treated with aspiration first and in 49% of those treated by retrieval first, which met the study’s prespecified criterion for noninferiority of the aspiration strategy, Dr. Mocco reported.
The results also showed suggestions of faster responses in the patients treated by aspiration first, although these did not reach statistical significance. The highest rate of restored blood flow within the occluded artery, TICI 3 flow, occurred in 34% of patients treated by aspiration first and in 23% of those treated with retrieval first. The average time to produce TICI 2b flow or greater was 22 minutes in the aspiration-first patients, compared with 33 minutes among retrieval-first patients.
“I prefer to start with aspiration first because it’s fast and efficient,” Dr. Mocco said. “I find encouragement in the nonsignificant faster rate of reperfusion” seen in the results.
The study’s safety endpoints, the rate of all-cause mortality after 90 days, all intracranial hemorrhages, and symptomatic intracranial hemorrhages, were all similar in the two study arms.
The COMPASS study was funded by Penumbra, but the company had no role in the trial’s design or analysis. Dr. Mocco has been a consultant to Cerebrotech Medical, EndoStream, Rebound Medical, Synchron, and Viseon and has investments in some of these companies. Dr. Sacco had no disclosures.
The video associated with this article is no longer available on this site. Please view all of our videos on the MDedge YouTube channel
SOURCE: Mocco J et al. ISC 2018, Abstract LB4.
REPORTING FROM ISC 2018
Key clinical point:
Major finding: The 90-day modified Rankin Scale score was 0-2 in 52% of aspiration patients and 49% of clot retrieval patients.
Study details: COMPASS, a multicenter, U.S. randomized trial with 270 patients.
Disclosures: The COMPASS study was funded by Penumbra, but the company had no role in the trial’s design or analysis. Dr. Mocco has been a consultant to Cerebrotech Medical, EndoStream, Rebound Medical, Synchron, and Viseon and has investments in some of these companies. Dr. Sacco had no disclosures.
Source: Mocco J et al. ISC 2018, Abstract LB4.
Experimental PD-1/PARP inhibitor combo shows promise in solid tumors
SAN FRANCISCO – Combined therapy using an experimental programmed cell death protein 1 (PD-1) inhibitor and experimental poly ADP-ribose polymerase (PARP) 1/2 inhibitor was generally well tolerated and showed efficacy in a phase 1 study of patients with advanced solid tumors.
Tislelizumab, the anti–PD-1 agent in development for solid and hematologic malignancies, is a humanized IgG4 monoclonal antibody engineered to have minimal Fc-gamma receptor binding. Pamiparib, the PARP 1/2 inhibitor, is hypothesized to promote neoantigen release that may boost the efficacy of tislelizumab. At the Jan. 4 data cutoff, 2 of 49 patients treated with one of five planned dose levels experienced a complete response, 8 had a confirmed partial response, and 4 had an unconfirmed partial response, Linda Mileshkin, MD, reported at the ASCO-SITC Clinical Immuno-Oncology Symposium.
Thus, the objective response rate was 20%, she said, noting that the clinical benefit rate, which encompasses all those with a response as well as those with durable stable disease after at least 24 weeks, was 39%. The median duration of response was 168.5 days
As of the data cutoff, 11 patients, including all those with a complete or partial response, remained on treatment, and 10 patients remained on treatment beyond 200 days, said Dr. Mileshkin of Peter MacCallum Cancer Centre, Melbourne.
Study participants were 42 women and 7 men, with a mean age of 63 years and measurable disease treated with at least 1 prior line of therapy (median of 4), but with no prior exposure to a PARP inhibitor or PD-1 therapy. Primary tumor sites included ovarian/fallopian tube/peritoneal (34 patients); pancreas, prostate, and breast cancer (3 patients each); and bile duct, bladder, cervix, lung, peripheral nerve sheath, and uterus (1 patient each). For the current dose-finding phase of the study (phase 1a), cohorts of 6-13 patients were treated with either tislelizumab at an intravenous dose of 2 mg/kg every 3 weeks plus either an oral dose of 20, 40, or 60 mg of pamiparib (dose levels 1, 2, and 3, respectively), or with tislelizumab at an intravenous dose of 200 mg every 3 weeks plus pamiparib at an oral dose of 40 or 60 mg twice daily (dose levels 4 and 5, respectively), Dr. Mileshkin said.
Phase 1b will be a disease-specific expansion to evaluate preliminary antitumor activity.
The rationale for combining the two agents was “to prove that we could get some up-regulation of tumor-associated antigens by using a PARP inhibitor that may then allow us to improve the antitumor activity of the checkpoint inhibitor,” she said.
Further, the malignancies in the patients include those likely to harbor DNA damage repair deficiencies, she added.
All patients experienced at least one treatment-emergent adverse event; 21 experienced a serious event, and 23 had immune-related adverse events.
“Despite the number of events, most patients were able to continue therapy,” Dr. Mileshkin said, noting that more discontinuation was associated with the PD-1 therapy than with the PARP inhibitor.
Non–immune-related adverse events related to the PARP inhibitor included mostly grade 1 and 2 nausea, fatigue, and diarrhea. Anemia also occurred and was grade 3 in 12% of patients.
“In terms of the PD-1 therapy, we mostly saw grade 1 or 2 nonimmune adverse events and very few grade 3 and 4 events,” she said.
One or more grade 3 immune-related adverse events occurred in 12 patients, and based on reports from participating centers, there “seemed to be a signal here that we were seeing more hepatic toxicity than we might have expected,” she said, explaining that these included increases in transaminases and hepatitis.
“We ended up with 13 patients who had a hepatic adverse event thought to be related to treatment. The median time to onset was 55 days ... and there were 9 patients in whom these events were grade 3 or 4,” she said.
Ten had grade 2 or higher transaminitis, which was most likely autoimmune in nature.
“All of these patients were treated with corticosteroids, and they all recovered promptly from the event. Subsequently, the protocol was amended to try increase real-time hepatic safety monitoring,” she said, noting that the rate of hepatic events has fallen since these changes were made.
“We need to closely monitor that moving forward to try to understand it better,” she said of the hepatic events.
Dose level 4 (tislelizumab at 200 mg every 3 weeks plus pamiparib at 40 mg twice daily) was determined to be the maximum tolerated dose and is the recommended phase 2 dose, she noted.
“We were pleased to see 10 patients respond, with these responses appearing to be durable with this currently short follow-up period, and we look forward to seeing the results of part B,” she concluded, noting that enrollment of patients into disease-specific cohorts for that next phase is ongoing.
This study is sponsored by BeiGene. Dr. Mileshkin reported receiving payment for travel, accommodations, and/or expenses from BeiGene and Roche.
SOURCE: Friedlander M et al. ASCO-SITC Clinical Immuno-Oncology Symposium 2018, Abstract #48.
REPORTING FROM THE CLINICAL IMMUNO-ONCOLOGY SYMPOSIUM
Key clinical point:
Major finding: Objective response and clinical benefit rates were 20% and 29%, respectively.
Study details: A phase 1 study of 49 patients.
Disclosures: This study is sponsored by BeiGene. Dr. Mileshkin reported receiving payment for travel, accommodations, and/or expenses from BeiGene and Roche.
Source: Friedlander M et al. ASCO-SITC Clinical Immuno-Oncology Symposium 2018, Abstract #48.
Barancik Prize winner to discuss MS biology advances
Two decades ago, multiple sclerosis researchers like the University of Cambridge’s, Robin Franklin, PhD, understood the crucial role of regeneration of the myelin coating on nerve fibers, and they knew the process went awry in MS patients. But, he recalled, “we knew very little about how remyelination came about and the processes that orchestrated it.”
Now, thanks in part to the work of Dr. Franklin’s team, research into remyelination is making tremendous advances. “We’ve begun to understand the mechanisms that are operating, and that is fundamental to devising new therapies,” he said in an interview. “You don’t develop effective new therapies unless you understand the underlying biology. Now, we’re on the brink of that biology leading to regenerative medicine in MS.”

Dr. Franklin is the winner of the international prize, which recognizes exceptional MS research and is administered by the National MS Society.
In recent years, Dr. Franklin and his colleagues have published multiple studies that reveal new details about the workings of myelin regeneration, especially the biology by which oligodendrocyte progenitor cells become new oligodendrocytes.
“There are simple steps in that process,” Dr. Franklin said. “What we’ve been able to do is decorate that simple model with a whole host of mechanisms that allow remyelination to take place.”
In 2011, Franklin and his colleagues published a study in rodents identifying the RXRg gene as a key promoter of remyelination, making it a potential target for therapy (Nat Neurosci. 2011;14:45-53).
“There’s still a lot more to be learned,” Dr. Franklin said, “but we’ve learned a sufficient amount that we can engage in a meaningful way with the pharmaceutical industry and MS clinicians to make regenerative medicines an effective component of the MS therapeutic armory.”
Dr. Franklin has no relevant disclosures.
Two decades ago, multiple sclerosis researchers like the University of Cambridge’s, Robin Franklin, PhD, understood the crucial role of regeneration of the myelin coating on nerve fibers, and they knew the process went awry in MS patients. But, he recalled, “we knew very little about how remyelination came about and the processes that orchestrated it.”
Now, thanks in part to the work of Dr. Franklin’s team, research into remyelination is making tremendous advances. “We’ve begun to understand the mechanisms that are operating, and that is fundamental to devising new therapies,” he said in an interview. “You don’t develop effective new therapies unless you understand the underlying biology. Now, we’re on the brink of that biology leading to regenerative medicine in MS.”
Dr. Franklin is the winner of the international prize, which recognizes exceptional MS research and is administered by the National MS Society.
In recent years, Dr. Franklin and his colleagues have published multiple studies that reveal new details about the workings of myelin regeneration, especially the biology by which oligodendrocyte progenitor cells become new oligodendrocytes.
“There are simple steps in that process,” Dr. Franklin said. “What we’ve been able to do is decorate that simple model with a whole host of mechanisms that allow remyelination to take place.”
In 2011, Franklin and his colleagues published a study in rodents identifying the RXRg gene as a key promoter of remyelination, making it a potential target for therapy (Nat Neurosci. 2011;14:45-53).
“There’s still a lot more to be learned,” Dr. Franklin said, “but we’ve learned a sufficient amount that we can engage in a meaningful way with the pharmaceutical industry and MS clinicians to make regenerative medicines an effective component of the MS therapeutic armory.”
Dr. Franklin has no relevant disclosures.
FROM ACTRIMS FORUM 2018
Combination immunotherapy is active in dMMR/MSI-H metastatic colorectal cancer
SAN FRANCISCO – Combination immunotherapy is efficacious for treating metastatic colorectal cancer that is deficient in mismatch repair (dMMR), giving rise to high microsatellite instability (MSI-H), according to the first report of results for the full cohort of the CheckMate-142 trial.
“Approximately 4% of patients with metastatic colorectal cancer have a deficiency in the DNA mismatch repair system. These patients benefit less from conventional chemotherapy than other patients,” lead investigator Thierry André, MD, chief of Medical Oncology at the Saint-Antoine Hospital, Paris, said at the 2018 GI Cancers Symposium.

Initial results for the latter cohort established a durable clinical benefit of nivolumab monotherapy, according to Dr. André. “It’s clear that there is a rationale to combine nivolumab and ipilimumab because they act synergistically to promote T-cell antitumor activity. Therefore, combination could further improve results,” he said.
With median follow-up of 13.4 months, 55% of patients had a response to the combination of nivolumab and ipilimumab, according to results reported at the symposium and simultaneously published (J Clin Oncol. 2018 Jan 20:JCO2017769901). Median progression-free and overall survival were not reached.
In addition, comparison with the nivolumab monotherapy cohort, albeit in nonrandomized fashion, suggested that addition of ipilimumab netted better outcomes.
“Nivolumab plus ipilimumab represents a promising new treatment option for patients with previously treated dMMR/MSI-H metastatic colorectal cancer,” Dr. André summarized. The results “are really very unusual in metastatic colorectal cancer, and we have a test, MSI, to select this population. It’s really a new hope for patients with metastatic colorectal cancer.”
Findings in context
“This is the largest study to date of anti-PD-1 and anti-CTLA-4 inhibitor combination in MSI-H colon cancer,” noted invited discussant Zsofia K. Stadler, MD, of Memorial Sloan Kettering Cancer Center in New York. Taken together, the results are promising.
“Is this sufficient evidence that combination therapy is superior to monotherapy with anti–PD-1? No. This trial was not intended for comparison or to show superiority,” she maintained. “This will require a large randomized comparison as has been done, for example, in melanoma. Even then, cost and value become important factors in the decision of whom to select for combination therapy.”
“Further studies are clearly needed to identify those particular subgroups of patients who may benefit from combination therapies, so can we predict which MSI-H patients may progress on monotherapy, and whether we can salvage patients on monotherapy who are not responding and are having progression of disease,” she concluded. “Those are important questions that need to be addressed.”
Study details
In CheckMate-142, the 55% overall response rate with the combination of nivolumab and ipilimumab consisted of complete response in 3.4% of patients and partial response in 51.3%, Dr. André reported at the symposium, sponsored by the American Gastroenterological Association, the American Society for Clinical Oncology, the American Society for Radiation Oncology, and the Society of Surgical Oncology. (The overall rate with nivolumab monotherapy at the same median follow-up was 31%, all partial responses.) The disease control rate was 80% with combination therapy (69% with monotherapy).
The combination achieved a similar response rate regardless of tumor PD-L1 expression and BRAF and KRAS mutational status. It was 71% in patients with a history of Lynch syndrome and 48% in those without such history.
The 12-month rates of progression-free survival and overall survival were 71% and 85%, respectively. “The PFS curve shows a plateau,” Dr. André pointed out. “This is a curve we dream about having in the first line. It’s very unusual to have that with a medical therapy in advanced disease.” (The corresponding rates with nivolumab monotherapy were 50% and 73%.)
Patients had significant, clinically meaningful improvements from baseline in quality of life with combination immunotherapy out to 91 weeks. “In my experience, this is really the first time I have had a very large number of patients going back to work in this very advanced disease,” he commented.
“No new safety signals or treatment-related deaths were reported,” Dr. André noted. The rate of treatment-related adverse events of grade 3 or 4 was 32% with the combination therapy (20% with monotherapy). The rate of events leading to discontinuation was 13% (7% with monotherapy).
Long-term outcomes with monotherapy
In a related presentation, Michael J. Overman, MD, an associate professor at the University of Texas MD Anderson Cancer Center, Houston, reported long-term outcomes with nivolumab monotherapy on CheckMate-142 according to prior lines of therapy.
Patients given monotherapy were classified as more heavily pretreated (at least three prior therapies, including a fluoropyrimidine, oxaliplatin, and irinotecan) and less heavily pretreated (at most two prior therapies, usually excluding irinotecan).

“Deepening of response was shown with further follow-up,” he noted; in particular, the rate of complete response increased from 3% to 9%. “This is primarily related to partial responses that have converted to complete responses with additional time.” Median duration of response was not reached.
The overall response rate was 26% in the more heavily pretreated group and 52% in the less heavily pretreated group, although confidence intervals overlapped. The disease control rate was 55% and 81%, respectively.
Both progression-free and overall survival curves for the entire monotherapy cohort showed a plateau. The 12-month rates were 44% (also 44% at 18 months) and 72% (67% at 18 months), respectively.
The rate of grade 3 or 4 treatment-related adverse events was 20%. “No new signals were seen with this longer follow-up,” Dr. Overman noted.
“Nivolumab continued to provide durable clinical benefit with long-term follow-up in previously treated patients with dMMR/MSI-H metastatic colorectal cancer. “Durable clinical benefit with deepening of response was observed regardless of prior chemotherapy with fluoropyrimidine, oxaliplatin, and irinotecan,” he summarized. “These results support ongoing evaluation of nivolumab-based therapy in the first-line setting in patients with deficient–mismatch repair colorectal cancer.”
Findings in context
“This secondary analysis is of interest, but this is an unplanned retrospective subgroup analysis of this data,” commented Dr. Stadler, the discussant. “I think the take-home message here is that both the heavily pretreated and not-so-heavily pretreated groups have clinical benefit from this therapy. Certainly, longer-term follow-up continues to support the use of nivolumab monotherapy in previously treated dMMR colorectal cancer.”
The findings for the whole nivolumab monotherapy cohort generally mirror those seen with pembrolizumab (Keytruda), another anti–PD-1 antibody, in this patient population, except for a shorter time to response with the former, she noted. “This suggests that both nivolumab and pembrolizumab are reasonable monotherapies in metastatic MSI-H colorectal cancer.”
“Evaluation of anti–PD-1 therapies in the first-line setting is certainly warranted,” Dr. Stadler concluded. “In fact, the KEYNOTE-177 trial is a phase 3 randomized study of pembrolizumab versus investigator-choice chemotherapy for mismatch repair–deficient colorectal cancer that is already investigating this question and that is nearing completion of accrual.”
Dr. Andre disclosed that he receives honoraria from Baxter, Bayer, Boehringer Ingelheim, Bristol-Myers Squibb, Celgene, Lilly, MSD Oncology, Novartis, Roche/Genentech, Sanofi, Servier, and Xbiotech; that he has a consulting or advisory role with Amgen, Bristol-Myers Squibb, HalioDX, MSD Oncology, Mundipharma, Roche/Genentech, and Servier; and that he receives travel expenses from Amgen, Bristol-Myers Squibb, and Roche/Genentech. Dr. Overman disclosed that he has a consulting or advisory role with Bristol-Myers Squibb, Merrimack, and Roche/Genentech, and receives research funding Amgen, Bristol-Myers Squibb, Celgene, MedImmune, Merck, and Roche. The trial was sponsored by Bristol-Myers Squibb.
SOURCES: André T et al. GI Cancers Symposium Abstract 553, Overman MJ et al. GI Cancer Symposium Abstract 554.
SAN FRANCISCO – Combination immunotherapy is efficacious for treating metastatic colorectal cancer that is deficient in mismatch repair (dMMR), giving rise to high microsatellite instability (MSI-H), according to the first report of results for the full cohort of the CheckMate-142 trial.
“Approximately 4% of patients with metastatic colorectal cancer have a deficiency in the DNA mismatch repair system. These patients benefit less from conventional chemotherapy than other patients,” lead investigator Thierry André, MD, chief of Medical Oncology at the Saint-Antoine Hospital, Paris, said at the 2018 GI Cancers Symposium.
Initial results for the latter cohort established a durable clinical benefit of nivolumab monotherapy, according to Dr. André. “It’s clear that there is a rationale to combine nivolumab and ipilimumab because they act synergistically to promote T-cell antitumor activity. Therefore, combination could further improve results,” he said.
With median follow-up of 13.4 months, 55% of patients had a response to the combination of nivolumab and ipilimumab, according to results reported at the symposium and simultaneously published (J Clin Oncol. 2018 Jan 20:JCO2017769901). Median progression-free and overall survival were not reached.
In addition, comparison with the nivolumab monotherapy cohort, albeit in nonrandomized fashion, suggested that addition of ipilimumab netted better outcomes.
“Nivolumab plus ipilimumab represents a promising new treatment option for patients with previously treated dMMR/MSI-H metastatic colorectal cancer,” Dr. André summarized. The results “are really very unusual in metastatic colorectal cancer, and we have a test, MSI, to select this population. It’s really a new hope for patients with metastatic colorectal cancer.”
Findings in context
“This is the largest study to date of anti-PD-1 and anti-CTLA-4 inhibitor combination in MSI-H colon cancer,” noted invited discussant Zsofia K. Stadler, MD, of Memorial Sloan Kettering Cancer Center in New York. Taken together, the results are promising.
“Is this sufficient evidence that combination therapy is superior to monotherapy with anti–PD-1? No. This trial was not intended for comparison or to show superiority,” she maintained. “This will require a large randomized comparison as has been done, for example, in melanoma. Even then, cost and value become important factors in the decision of whom to select for combination therapy.”
“Further studies are clearly needed to identify those particular subgroups of patients who may benefit from combination therapies, so can we predict which MSI-H patients may progress on monotherapy, and whether we can salvage patients on monotherapy who are not responding and are having progression of disease,” she concluded. “Those are important questions that need to be addressed.”
Study details
In CheckMate-142, the 55% overall response rate with the combination of nivolumab and ipilimumab consisted of complete response in 3.4% of patients and partial response in 51.3%, Dr. André reported at the symposium, sponsored by the American Gastroenterological Association, the American Society for Clinical Oncology, the American Society for Radiation Oncology, and the Society of Surgical Oncology. (The overall rate with nivolumab monotherapy at the same median follow-up was 31%, all partial responses.) The disease control rate was 80% with combination therapy (69% with monotherapy).
The combination achieved a similar response rate regardless of tumor PD-L1 expression and BRAF and KRAS mutational status. It was 71% in patients with a history of Lynch syndrome and 48% in those without such history.
The 12-month rates of progression-free survival and overall survival were 71% and 85%, respectively. “The PFS curve shows a plateau,” Dr. André pointed out. “This is a curve we dream about having in the first line. It’s very unusual to have that with a medical therapy in advanced disease.” (The corresponding rates with nivolumab monotherapy were 50% and 73%.)
Patients had significant, clinically meaningful improvements from baseline in quality of life with combination immunotherapy out to 91 weeks. “In my experience, this is really the first time I have had a very large number of patients going back to work in this very advanced disease,” he commented.
“No new safety signals or treatment-related deaths were reported,” Dr. André noted. The rate of treatment-related adverse events of grade 3 or 4 was 32% with the combination therapy (20% with monotherapy). The rate of events leading to discontinuation was 13% (7% with monotherapy).
Long-term outcomes with monotherapy
In a related presentation, Michael J. Overman, MD, an associate professor at the University of Texas MD Anderson Cancer Center, Houston, reported long-term outcomes with nivolumab monotherapy on CheckMate-142 according to prior lines of therapy.
Patients given monotherapy were classified as more heavily pretreated (at least three prior therapies, including a fluoropyrimidine, oxaliplatin, and irinotecan) and less heavily pretreated (at most two prior therapies, usually excluding irinotecan).
“Deepening of response was shown with further follow-up,” he noted; in particular, the rate of complete response increased from 3% to 9%. “This is primarily related to partial responses that have converted to complete responses with additional time.” Median duration of response was not reached.
The overall response rate was 26% in the more heavily pretreated group and 52% in the less heavily pretreated group, although confidence intervals overlapped. The disease control rate was 55% and 81%, respectively.
Both progression-free and overall survival curves for the entire monotherapy cohort showed a plateau. The 12-month rates were 44% (also 44% at 18 months) and 72% (67% at 18 months), respectively.
The rate of grade 3 or 4 treatment-related adverse events was 20%. “No new signals were seen with this longer follow-up,” Dr. Overman noted.
“Nivolumab continued to provide durable clinical benefit with long-term follow-up in previously treated patients with dMMR/MSI-H metastatic colorectal cancer. “Durable clinical benefit with deepening of response was observed regardless of prior chemotherapy with fluoropyrimidine, oxaliplatin, and irinotecan,” he summarized. “These results support ongoing evaluation of nivolumab-based therapy in the first-line setting in patients with deficient–mismatch repair colorectal cancer.”
Findings in context
“This secondary analysis is of interest, but this is an unplanned retrospective subgroup analysis of this data,” commented Dr. Stadler, the discussant. “I think the take-home message here is that both the heavily pretreated and not-so-heavily pretreated groups have clinical benefit from this therapy. Certainly, longer-term follow-up continues to support the use of nivolumab monotherapy in previously treated dMMR colorectal cancer.”
The findings for the whole nivolumab monotherapy cohort generally mirror those seen with pembrolizumab (Keytruda), another anti–PD-1 antibody, in this patient population, except for a shorter time to response with the former, she noted. “This suggests that both nivolumab and pembrolizumab are reasonable monotherapies in metastatic MSI-H colorectal cancer.”
“Evaluation of anti–PD-1 therapies in the first-line setting is certainly warranted,” Dr. Stadler concluded. “In fact, the KEYNOTE-177 trial is a phase 3 randomized study of pembrolizumab versus investigator-choice chemotherapy for mismatch repair–deficient colorectal cancer that is already investigating this question and that is nearing completion of accrual.”
Dr. Andre disclosed that he receives honoraria from Baxter, Bayer, Boehringer Ingelheim, Bristol-Myers Squibb, Celgene, Lilly, MSD Oncology, Novartis, Roche/Genentech, Sanofi, Servier, and Xbiotech; that he has a consulting or advisory role with Amgen, Bristol-Myers Squibb, HalioDX, MSD Oncology, Mundipharma, Roche/Genentech, and Servier; and that he receives travel expenses from Amgen, Bristol-Myers Squibb, and Roche/Genentech. Dr. Overman disclosed that he has a consulting or advisory role with Bristol-Myers Squibb, Merrimack, and Roche/Genentech, and receives research funding Amgen, Bristol-Myers Squibb, Celgene, MedImmune, Merck, and Roche. The trial was sponsored by Bristol-Myers Squibb.
SOURCES: André T et al. GI Cancers Symposium Abstract 553, Overman MJ et al. GI Cancer Symposium Abstract 554.
REPORTING FROM THE 2018 GI CANCERS SYMPOSIUM
Key clinical point:
Major finding: The combination of nivolumab and ipilimumab yielded an overall response rate of 55% and a disease control rate of 80%. Nivolumab monotherapy yielded similar benefit regardless of prior lines of treatment.
Data source: A nonrandomized phase 2 trial among patients with dMMR/MSI-H metastatic colorectal cancer: 119 received both nivolumab and ipilimumab and 74 received nivolumab alone (CheckMate-142).
Disclosures: Dr. Andre disclosed that he receives honoraria from Baxter, Bayer, Boehringer Ingelheim, Bristol-Myers Squibb, Celgene, Lilly, MSD Oncology, Novartis, Roche/Genentech, Sanofi, Servier, and Xbiotech; that he has a consulting or advisory role with Amgen, Bristol-Myers Squibb, HalioDX, MSD Oncology, Mundipharma, Roche/Genentech, and Servier; and that he receives travel expenses from Amgen, Bristol-Myers Squibb, and Roche/Genentech. Dr. Overman disclosed that he has a consulting or advisory role with Bristol-Myers Squibb, Merrimack, and Roche/Genentech, and receives research funding from Amgen, Bristol-Myers Squibb, Celgene, MedImmune, Merck, and Roche. The trial was sponsored by Bristol-Myers Squibb.
Source: André T et al. GI Cancers Symposium Abstract 553, Overman MJ et al. GI Cancer Symposium Abstract 554.
Medicaid expansion meant earlier presentation, better surgical outcomes
The for five common surgical conditions, according to a Jan. 24 report in JAMA Surgery.
“Given current debate on the ACA [Affordable Care Act] and reforms to the Medicaid program, evidence on the effects of these policies is critical ... As policy makers weigh changes to or a potential repeal of the ACA, these findings provide important new data on the early clinical effects of the law’s coverage expansion,” said investigators led by Andrew Loehrer, MD, of the department of surgical oncology at MD Anderson Cancer Center, Houston.

For a baseline, the team used hospital administrative data from the Vizient Clinical Data Base and Resource Manager to assess outcomes for appendicitis, cholecystitis, diverticulitis, peripheral artery disease, and aortic aneurysm in 42 states during 2010-2013, before the ACA took effect in 2014. They then compared outcomes during 2014-2015 in the 27 states that expanded Medicaid programs under the ACA with 15 states that did not. The study included 225,572 hospital admissions in the Medicaid expansion states and 67,957 in the nonexpansion states at more than 200 academic medical centers and affiliated hospitals.
Medicaid expansion in the 27 states was associated with a 7.5-percentage point decreased probability of patients being uninsured (95% confidence interval, –12.2 to –2.9; P = .002) and an 8.6-percentage point increased probability of having Medicaid (95% CI, 6.1-11.1; P less than .001).
Medicaid expansion was also associated with a 1.8-percentage point increase in the probability of early, uncomplicated presentation (95% CI, 0.7-2.9; P = .001) and a 2.6-percentage point increase in the probability of receiving optimal management after admission, most likely due to the earlier presentation (95% CI, 0.8-4.4; P = .006).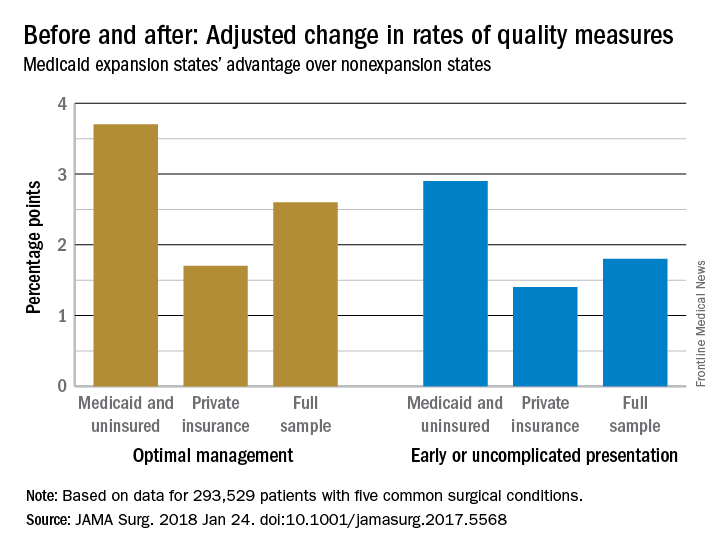
The improvements were concentrated among Medicaid and uninsured patients, who were most likely to benefit from coverage expansion, rather than those with private insurance.
The investigators acknowledged the limitations of their data for tracking changes access and quality of care for surgical patients. “We recognize that the data on improved quality of care are not as clear. Our use of composite outcomes has specific limitations,” they wrote.
“As expected for the conditions studied, our analysis found no significant change in the overall number of individuals treated but rather a change in the timeliness in which individuals received care.” Meanwhile, “our sample revealed an increase in the percentage of surgical patients who were uninsured in nonexpansion states after 2014,” which was associated with “worsening of outcomes ... whereas expansion states had stabilization or improvement,” they said. In Medicaid expansion states, the number of uninsured dropped from 14.% to 6.8%, but in the nonexpansion states, the number of uninsured actually increased slightly from 21.2% to 21.9%.
There was no funding source reported for the study. The authors had no conflicts of interest.
SOURCE: Loehrer AP et. al. JAMA Surg. 2018 Jan 24. doi: 10.1001/jamasurg.2017.5568
The for five common surgical conditions, according to a Jan. 24 report in JAMA Surgery.
“Given current debate on the ACA [Affordable Care Act] and reforms to the Medicaid program, evidence on the effects of these policies is critical ... As policy makers weigh changes to or a potential repeal of the ACA, these findings provide important new data on the early clinical effects of the law’s coverage expansion,” said investigators led by Andrew Loehrer, MD, of the department of surgical oncology at MD Anderson Cancer Center, Houston.
For a baseline, the team used hospital administrative data from the Vizient Clinical Data Base and Resource Manager to assess outcomes for appendicitis, cholecystitis, diverticulitis, peripheral artery disease, and aortic aneurysm in 42 states during 2010-2013, before the ACA took effect in 2014. They then compared outcomes during 2014-2015 in the 27 states that expanded Medicaid programs under the ACA with 15 states that did not. The study included 225,572 hospital admissions in the Medicaid expansion states and 67,957 in the nonexpansion states at more than 200 academic medical centers and affiliated hospitals.
Medicaid expansion in the 27 states was associated with a 7.5-percentage point decreased probability of patients being uninsured (95% confidence interval, –12.2 to –2.9; P = .002) and an 8.6-percentage point increased probability of having Medicaid (95% CI, 6.1-11.1; P less than .001).
Medicaid expansion was also associated with a 1.8-percentage point increase in the probability of early, uncomplicated presentation (95% CI, 0.7-2.9; P = .001) and a 2.6-percentage point increase in the probability of receiving optimal management after admission, most likely due to the earlier presentation (95% CI, 0.8-4.4; P = .006).
The improvements were concentrated among Medicaid and uninsured patients, who were most likely to benefit from coverage expansion, rather than those with private insurance.
The investigators acknowledged the limitations of their data for tracking changes access and quality of care for surgical patients. “We recognize that the data on improved quality of care are not as clear. Our use of composite outcomes has specific limitations,” they wrote.
“As expected for the conditions studied, our analysis found no significant change in the overall number of individuals treated but rather a change in the timeliness in which individuals received care.” Meanwhile, “our sample revealed an increase in the percentage of surgical patients who were uninsured in nonexpansion states after 2014,” which was associated with “worsening of outcomes ... whereas expansion states had stabilization or improvement,” they said. In Medicaid expansion states, the number of uninsured dropped from 14.% to 6.8%, but in the nonexpansion states, the number of uninsured actually increased slightly from 21.2% to 21.9%.
There was no funding source reported for the study. The authors had no conflicts of interest.
SOURCE: Loehrer AP et. al. JAMA Surg. 2018 Jan 24. doi: 10.1001/jamasurg.2017.5568
FROM JAMA SURGERY
Key clinical point: The Patient Protection and Affordable Care Act’s Medicaid expansion led to increased coverage of patients, earlier presentation, and improved care for five common surgical conditions.
Major finding: Medicaid expansion was associated with a 2.6 percentage-point increase in the probability of receiving optimal management after admission, most likely due to the earlier presentation.
Study details: Review of more than 200,000 patients, pre- and post-ACA
Disclosures: The authors had no disclosures.
Source: Loehrer AP et. al. JAMA Surg. 2018 Jan 24. doi: 10.1001/jamasurg.2017.5568