User login
Update on high-grade vulvar interepithelial neoplasia
Vulvar squamous cell carcinomas (VSCC) comprise approximately 90% of all vulvar malignancies. Unlike cervical SCC, which are predominantly human papilloma virus (HPV) positive, only a minority of VSCC are HPV positive – on the order of 15%-25% of cases. Most cases occur in the setting of lichen sclerosus and are HPV negative.
Lichen sclerosus is a chronic inflammatory dermatitis typically involving the anogenital area, which in some cases can become seriously distorted (e.g. atrophy of the labia minora, clitoral phimosis, and introital stenosis). Although most cases are diagnosed in postmenopausal women, LS can affect women of any age. The true prevalence of lichen sclerosus is unknown. Recent studies have shown a prevalence of 1 in 60; among older women, it can even be as high as 1 in 30. While lichen sclerosus is a pruriginous condition, it is often asymptomatic. It is not considered a premalignant condition. The diagnosis is clinical; however, suspicious lesions (erosions/ulcerations, hyperkeratosis, pigmented areas, ecchymosis, warty or papular lesions), particularly when recalcitrant to adequate first-line therapy, should be biopsied.

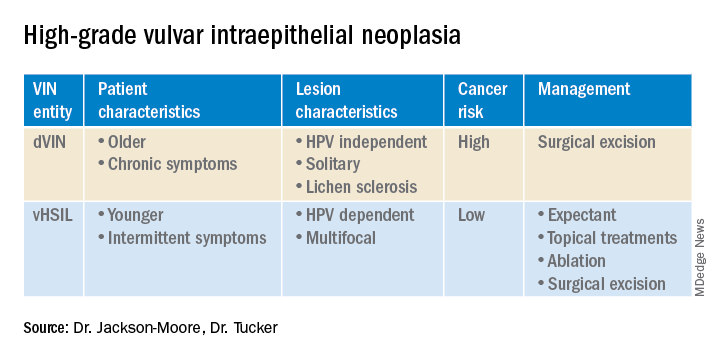
VSCC arises from precursor lesions or high-grade vulvar intraepithelial neoplasia (VIN). The 2015 International Society for the Study of Vulvovaginal Disease nomenclature classifies high-grade VIN into high-grade squamous intraepithelial lesion (HSIL) and differentiated VIN (dVIN). Most patients with high-grade VIN are diagnosed with HSIL or usual type VIN. A preponderance of these lesions (75%-85%) are HPV positive, predominantly HPV 16. Vulvar HSIL (vHSIL) lesions affect younger women. The lesions tend to be multifocal and extensive. On the other hand, dVIN typically affects older women and commonly develops as a solitary lesion. While dVIN accounts for only a small subset of patients with high-grade VIN, these lesions are HPV negative and associated with lichen sclerosus.
Both disease entities, vHSIL and dVIN, are increasing in incidence. There is a higher risk and shortened period of progression to cancer in patients with dVIN compared to HSIL. The cancer risk of vHSIL is relatively low. The 10-year cumulative VSCC risk reported in the literature is 10.3%; 9.7% for vHSIL and 50% for dVIN. Patients with vHSIL could benefit from less aggressive treatment modalities.

Patients present with a constellation of signs such as itching, pain, burning, bleeding, and discharge. Chronic symptoms portend HPV-independent lesions associated with lichen sclerosus while episodic signs are suggestive of HPV-positive lesions.
The recurrence risk of high-grade VIN is 46%-70%. Risk factors for recurrence include age greater than 50, immunosuppression, metasynchronous HSIL, and multifocal lesions. Recurrences occur in up to 50% of women who have undergone surgery. For those who undergo surgical treatment for high-grade VIN, recurrence is more common in the setting of positive margins, underlying lichen sclerosis, persistent HPV infection, and immunosuppression.
Management of high-grade VIN is determined by the lesion characteristics, patient characteristics, and medical expertise. Given the risk of progression of high-grade VIN to cancer and risk of underlying cancer, surgical therapy is typically recommended. The treatment of choice is surgical excision in cases of dVIN. Surgical treatments include CO2 laser ablation, wide local excision, and vulvectomy. Women who undergo surgical treatment for vHSIL have about a 50% chance of the condition recurring 1 year later, irrespective of whether treatment is by surgical excision or laser vaporization.
Since surgery can be associated with disfigurement and sexual dysfunction, alternatives to surgery should be considered in cases of vHSIL. The potential for effect on sexual function should be part of preoperative counseling and treatment. Women treated for VIN often experience increased inhibition of sexual excitement and increased inhibition of orgasm. One study found that in women undergoing vulvar excision for VIN, the impairment was found to be psychological in nature. Overall, the studies of sexual effect from treatment of VIN have found that women do not return to their pretreatment sexual function. However, the optimal management of vHSIL has not been determined. Nonsurgical options include topical therapies (imiquimod, 5-fluorouracil, cidofovir, and interferon) and nonpharmacologic treatments, such as photodynamic therapy.
Imiquimod, a topical immune modulator, is the most studied pharmacologic treatment of vHSIL. The drug induces secretion of cytokines, creating an immune response that clears the HPV infection. Imiquimod is safe and well tolerated. The clinical response rate varies between 35% and 81%. A recent study demonstrated the efficacy of imiquimod and the treatment was found to be noninferior to surgery. Adverse events differed, with local pain following surgical treatment and local pruritus and erythema associated with imiquimod use. Some patients did not respond to imiquimod; it was thought by the authors of the study that specific immunological factors affect the clinical response.
In conclusion, high-grade VIN is a heterogeneous disease made up of two distinct disease entities with rising incidence. In contrast to dVIN, the cancer risk is low for patients with vHSIL. Treatment should be driven by the clinical characteristics of the vulvar lesions, patients’ preferences, sexual activity, and compliance. Future directions include risk stratification of patients with vHSIL who are most likely to benefit from topical treatments, thus reducing overtreatment. Molecular biomarkers that could identify dVIN at an early stage are needed.
Dr. Jackson-Moore is associate professor in gynecologic oncology at the University of North Carolina at Chapel Hill. Dr. Tucker is assistant professor of gynecologic oncology at the university.
References
Cendejas BR et al. Am J Obstet Gynecol. 2015 Mar;212(3):291-7.
Lebreton M et al. J Gynecol Obstet Hum Reprod. 2020 Nov;49(9):101801.
Thuijs NB et al. Int J Cancer. 2021 Jan 1;148(1):90-8. doi: 10.1002/ijc.33198. .
Trutnovsky G et al. Lancet. 2022 May 7;399(10337):1790-8. Erratum in: Lancet. 2022 Oct 8;400(10359):1194.
Vulvar squamous cell carcinomas (VSCC) comprise approximately 90% of all vulvar malignancies. Unlike cervical SCC, which are predominantly human papilloma virus (HPV) positive, only a minority of VSCC are HPV positive – on the order of 15%-25% of cases. Most cases occur in the setting of lichen sclerosus and are HPV negative.
Lichen sclerosus is a chronic inflammatory dermatitis typically involving the anogenital area, which in some cases can become seriously distorted (e.g. atrophy of the labia minora, clitoral phimosis, and introital stenosis). Although most cases are diagnosed in postmenopausal women, LS can affect women of any age. The true prevalence of lichen sclerosus is unknown. Recent studies have shown a prevalence of 1 in 60; among older women, it can even be as high as 1 in 30. While lichen sclerosus is a pruriginous condition, it is often asymptomatic. It is not considered a premalignant condition. The diagnosis is clinical; however, suspicious lesions (erosions/ulcerations, hyperkeratosis, pigmented areas, ecchymosis, warty or papular lesions), particularly when recalcitrant to adequate first-line therapy, should be biopsied.
VSCC arises from precursor lesions or high-grade vulvar intraepithelial neoplasia (VIN). The 2015 International Society for the Study of Vulvovaginal Disease nomenclature classifies high-grade VIN into high-grade squamous intraepithelial lesion (HSIL) and differentiated VIN (dVIN). Most patients with high-grade VIN are diagnosed with HSIL or usual type VIN. A preponderance of these lesions (75%-85%) are HPV positive, predominantly HPV 16. Vulvar HSIL (vHSIL) lesions affect younger women. The lesions tend to be multifocal and extensive. On the other hand, dVIN typically affects older women and commonly develops as a solitary lesion. While dVIN accounts for only a small subset of patients with high-grade VIN, these lesions are HPV negative and associated with lichen sclerosus.
Both disease entities, vHSIL and dVIN, are increasing in incidence. There is a higher risk and shortened period of progression to cancer in patients with dVIN compared to HSIL. The cancer risk of vHSIL is relatively low. The 10-year cumulative VSCC risk reported in the literature is 10.3%; 9.7% for vHSIL and 50% for dVIN. Patients with vHSIL could benefit from less aggressive treatment modalities.
Patients present with a constellation of signs such as itching, pain, burning, bleeding, and discharge. Chronic symptoms portend HPV-independent lesions associated with lichen sclerosus while episodic signs are suggestive of HPV-positive lesions.
The recurrence risk of high-grade VIN is 46%-70%. Risk factors for recurrence include age greater than 50, immunosuppression, metasynchronous HSIL, and multifocal lesions. Recurrences occur in up to 50% of women who have undergone surgery. For those who undergo surgical treatment for high-grade VIN, recurrence is more common in the setting of positive margins, underlying lichen sclerosis, persistent HPV infection, and immunosuppression.
Management of high-grade VIN is determined by the lesion characteristics, patient characteristics, and medical expertise. Given the risk of progression of high-grade VIN to cancer and risk of underlying cancer, surgical therapy is typically recommended. The treatment of choice is surgical excision in cases of dVIN. Surgical treatments include CO2 laser ablation, wide local excision, and vulvectomy. Women who undergo surgical treatment for vHSIL have about a 50% chance of the condition recurring 1 year later, irrespective of whether treatment is by surgical excision or laser vaporization.
Since surgery can be associated with disfigurement and sexual dysfunction, alternatives to surgery should be considered in cases of vHSIL. The potential for effect on sexual function should be part of preoperative counseling and treatment. Women treated for VIN often experience increased inhibition of sexual excitement and increased inhibition of orgasm. One study found that in women undergoing vulvar excision for VIN, the impairment was found to be psychological in nature. Overall, the studies of sexual effect from treatment of VIN have found that women do not return to their pretreatment sexual function. However, the optimal management of vHSIL has not been determined. Nonsurgical options include topical therapies (imiquimod, 5-fluorouracil, cidofovir, and interferon) and nonpharmacologic treatments, such as photodynamic therapy.
Imiquimod, a topical immune modulator, is the most studied pharmacologic treatment of vHSIL. The drug induces secretion of cytokines, creating an immune response that clears the HPV infection. Imiquimod is safe and well tolerated. The clinical response rate varies between 35% and 81%. A recent study demonstrated the efficacy of imiquimod and the treatment was found to be noninferior to surgery. Adverse events differed, with local pain following surgical treatment and local pruritus and erythema associated with imiquimod use. Some patients did not respond to imiquimod; it was thought by the authors of the study that specific immunological factors affect the clinical response.
In conclusion, high-grade VIN is a heterogeneous disease made up of two distinct disease entities with rising incidence. In contrast to dVIN, the cancer risk is low for patients with vHSIL. Treatment should be driven by the clinical characteristics of the vulvar lesions, patients’ preferences, sexual activity, and compliance. Future directions include risk stratification of patients with vHSIL who are most likely to benefit from topical treatments, thus reducing overtreatment. Molecular biomarkers that could identify dVIN at an early stage are needed.
Dr. Jackson-Moore is associate professor in gynecologic oncology at the University of North Carolina at Chapel Hill. Dr. Tucker is assistant professor of gynecologic oncology at the university.
References
Cendejas BR et al. Am J Obstet Gynecol. 2015 Mar;212(3):291-7.
Lebreton M et al. J Gynecol Obstet Hum Reprod. 2020 Nov;49(9):101801.
Thuijs NB et al. Int J Cancer. 2021 Jan 1;148(1):90-8. doi: 10.1002/ijc.33198. .
Trutnovsky G et al. Lancet. 2022 May 7;399(10337):1790-8. Erratum in: Lancet. 2022 Oct 8;400(10359):1194.
FDA approves first-ever agent to delay type 1 diabetes onset
“Today’s approval of a first-in-class therapy adds an important new treatment option for certain at-risk patients,” said John Sharretts, MD, director of the Division of Diabetes, Lipid Disorders, and Obesity in the FDA’s Center for Drug Evaluation and Research. “The drug’s potential to delay clinical diagnosis of type 1 diabetes may provide patients with months to years without the burdens of disease.”
The agent, which interferes with T-cell-mediated autoimmune destruction of pancreatic beta cells, is the first disease-modifying therapy for impeding progression of type 1 diabetes. It is administered by intravenous infusion once daily for 14 consecutive days.
The specific indication is “to delay the onset of stage 3 type 1 diabetes in adults and pediatric patients 8 years and older who currently have stage 2 type 1 diabetes.” In type 1 diabetes staging, adopted in 2015, stage 1 is defined as the presence of beta cell autoimmunity with two or more islet autoantibodies with normoglycemia, stage 2 is beta-cell autoimmunity with dysglycemia yet asymptomatic, and stage 3 is the onset of symptomatic type 1 diabetes.
Stage 2 type 1 diabetes is associated with a nearly 100% lifetime risk of progression to clinical (stage 3) type 1 diabetes and a 75% risk of developing the condition within 5 years.
The FDA had previously rejected teplizumab for this indication in July 2021, despite a prior endorsement from an advisory panel in May 2021.
Now, with the FDA approval, Provention Bio cofounder and CEO Ashleigh Palmer said in a statement, “This is a historic occasion for the T1D community and a paradigm shifting breakthrough ... It cannot be emphasized enough how precious a delay in the onset of stage 3 T1D can be from a patient and family perspective; more time to live without and, when necessary, prepare for the burdens, complications, and risks associated with stage 3 disease.”
T1D onset delayed by 2 years
In 2019, a pivotal phase 2, randomized, placebo-controlled trial involving 76 at-risk children and adults aged 8 years and older showed that a single 14-day treatment of daily intravenous infusions of teplizumab in 44 patients resulted in a significant median 2-year delay to onset of clinical type 1 diabetes compared with 32 who received placebo.
Those “game changer” data were presented at the American Diabetes Association (ADA) annual meeting in June 2019 and simultaneously published in the New England Journal of Medicine.
Three-year data were presented at the June 2020 ADA meeting and published in March 2021 in Science Translational Medicine, by Emily K. Sims, MD, department of pediatrics, Indiana University, Indianapolis, and colleagues.
At a median follow-up of 923 days, 50% of those randomly assigned to teplizumab remained diabetes free, compared with 22% of those who received placebo infusions (hazard ratio, 0.457; P = .01). The teplizumab group had a greater average C-peptide area under the curve compared with placebo, reflecting improved beta-cell function (1.96 vs. 1.68 pmol/mL; P = .006).
C-peptide levels declined over time in the placebo group but stabilized in those receiving teplizumab (P = .0015).
“The mid-range time from randomization to stage 3 type 1 diabetes diagnosis was 50 months for the patients who received Tzield and 25 months for those who received a placebo. This represents a statistically significant delay in the development of stage 3 type 1 diabetes,” according to the FDA statement.
The most common side effects of Tzield include lymphopenia (73% teplizumab vs. 6% placebo), rash (36% vs. 0%), leukopenia (221% vs. 0%), and headache (11% vs. 6%). Label warnings and precautions include monitoring for cytokine release syndrome, risk for serious infections, and avoidance of live, inactivated, and mRNA vaccines.
This approval is likely to accelerate discussion about universal autoantibody screening. Currently, most individuals identified as having preclinical type 1 diabetes are first-degree relatives of people with type 1 diabetes identified through the federally funded TrialNet program. In December 2020, the type 1 diabetes research and advocacy organization JDRF began offering a $55 home blood test to screen for the antibodies, and other screening programs have been launched in the United States and Europe.
Previous studies have examined cost-effectiveness of universal screening in children and the optimal ages that such screening should take place.
In October, Provention Bio announced a co-promotion agreement with Sanofi for the U.S. launch of Tzield for delay in onset of clinical T1D in at-risk individuals. Provention Bio offers financial assistance options (e.g., copay assistance) to eligible patients for out-of-pocket costs.
A version of this article first appeared on Medscape.com.
New and Improved Devices Add More Therapeutic Options for Treatment of Migraine

Since the mid-2010s, the US Food and Drug Administration (FDA) has approved or cleared no fewer than 10 migraine treatments in the form of orals, injectables, nasal sprays, and devices. The medical achievements of the last decade in the field of migraine have been nothing less than stunning for physicians and their patients, whether they relied on off-label medications or those sanctioned by the FDA to treat patients living with migraine.
That said, the newer orals and injectables cannot help everyone living with migraine. The small molecule calcitonin gene-related peptide (CGRP) receptor antagonists (gepants) and the monoclonal antibodies that target the CGRP ligand or receptor, while well received by patients and physicians alike, have drawbacks for some patients, including lack of efficacy, slow response rate, and adverse events that prevent some patients from taking them. The gepants, which are oral medications—as opposed to the CGRP monoclonal antibody injectables—can occasionally cause enough nausea, drowsiness, and constipation for patients to choose to discontinue their use.
Certain patients have other reasons to shun orals and injectables. Some cannot swallow pills while others fear or do not tolerate injections. Insurance companies limit the quantity of acute care medications, so some patients cannot treat every migraine attack. Then there are those who have failed so many therapies in the past that they will not try the latest one. Consequently, some lie in bed, vomiting until the pain is gone, and some take too many over-the-counter or migraine-specific products, which make migraine symptoms worse if they develop medication overuse headache. And lastly, there are patients who have never walked through a physician’s door to secure a migraine diagnosis and get appropriate treatment.
Non interventional medical devices cleared by the FDA now allow physicians to offer relief to patients with migraine. They work either through various types of electrical neuromodulation to nerves outside the brain or they apply magnetic stimulation to the back of the brain itself to reach pain-associated pathways. A 2019 report on pain management from the US Department of Health and Human Services noted that some randomized control trials (RCTs) and other studies “have demonstrated that noninvasive vagal nerve stimulation can be effective in ameliorating pain in various types of cluster headaches and migraines.”
At least 3 devices, 1 designed to stimulate both the occipital and trigeminal nerves (eCOT-NS, Relivion, Neurolief Ltd), 1 that stimulates the vagus nerve noninvasively (nVNS, gammaCORE, electroCore), and 1 that stimulates peripheral nerves in the upper arm (remote electrical neuromodulation [REN], Nerivio, Theranica Bio-Electronics Ltd), are FDA cleared to treat episodic and chronic migraine. nVNS is also cleared to treat migraine, episodic cluster headache acutely, and chronic cluster acutely in connection with medication.
Real-world studies on all migraine treatments, especially the devices, are flooding PubMed. As for a physician’s observation, we will get to that shortly.
The Devices
Nerivio
Theranica Bio-Electronics Ltd makes a REN called Nerivio, which was FDA cleared in January 2021 to treat episodic migraine acutely in adults and adolescents. Studies have shown its effectiveness for chronic migraine patients who are treated acutely, and it has also helped patients with menstrual migraine. The patient wears the device on the upper arm. Sensory fibers, once stimulated in the arm, send an impulse to the brainstem to affect the serotonin- and norepinephrine-modulated descending inhibitory pathway to disrupt incoming pain messaging. Theranica has applied to the FDA for clearance to treat patients with chronic migraine, as well as for prevention.
Relivion
Neurolief Ltd created the external combined occipital and trigeminal nerve stimulation device (eCOT-NS), which stimulates both the occipital and trigeminal nerves. It has multiple output electrodes, which are placed on the forehead to stimulate the trigeminal supraorbital and supratrochlear nerve branches bilaterally, and over the occipital nerves in the back of the head. It is worn like a tiara as it must be in good contact with the forehead and the back of the head simultaneously. It is FDA cleared to treat acute migraine.
gammaCORE
gammaCORE is a nVNS device that is FDA cleared for acute and preventive treatment of migraine in adolescents and adults, and acute and preventive treatment of episodic cluster headache in adults. It is also cleared to treat chronic cluster headache acutely along with medication. The patient applies gel to the device’s 2 electrical contacts and then locates the vagus nerve on the side of the neck and applies the electrodes to the area that will be treated. Patients can adjust the stimulation’s intensity so that they can barely feel the stimulation; it has not been reported to be painful. nVNS is also an FDA cleared treatment for paroxysmal hemicrania and hemicrania continua.
SAVI Dual
The s-TMS (SAVI Dual, formerly called the Spring TMS and the sTMS mini), made by eNeura, is a single-pulse, transcranial magnetic stimulation applied to the back of the head to stimulate the occipital lobes in the brain. It was FDA cleared for acute and preventive care of migraine in adolescents over 12 years and for adults in February 2019. The patient holds a handheld magnetic device against their occiput, and when the tool is discharged, a brief magnetic pulse interrupts the pattern of neuronal firing (probably cortical spreading depression) that can trigger migraine and the visual aura associated with migraine in one-third of patients.
Cefaly
The e-TNS (Cefaly) works by external trigeminal nerve stimulation of the supraorbital and trochlear nerves bilaterally in the forehead. It gradually and automatically increases in intensity and can be controlled by the patient. It is FDA cleared for acute and preventive treatment of migraine, and, unlike the other devices, it is sold over the counter without a prescription. According to the company website, there are 3 devices: 1 is for acute treatment, 1 is for preventive treatment, and 1 device has 2 settings for both acute and preventive treatment.
The Studies
While most of the published studies on devices are company-sponsored, these device makers have underwritten numerous, sometimes very well-designed, studies on their products. A review by VanderPluym et al described those studies and their various risks of bias.
There are at least 10 studies on REN published so far. These include 2 randomized, sham-controlled trials looking at pain freedom and pain relief at 2 hours after stimulation begins. Another study detailed treatment reports from many patients in which 66.5% experienced pain relief at 2 hours post treatment initiation in half of their treatments. A subgroup of 16% of those patients were prescribed REN by their primary care physicians. Of that group, 77.8% experienced pain relief in half their treatments. That figure was very close to another study that found that 23 of 31 (74.2%) of the study patients treated virtually by non headache providers found relief in 50% of their headaches. REN comes with an education and behavioral medicine app that is used during treatment. A study done by the company shows that when a patient uses the relaxation app along with the standard stimulation, they do considerably better than with stimulation alone.
The eCOT-NS has also been tested in an RCT. At 2 hours, the responder rate was twice as high as in the sham group (66.7% vs 32%). Overall headache relief at 2 hours was higher in the responder group (76% vs 31.6%). In a study collecting real-world data on the efficacy of eCOT-NS in the preventive treatment of migraine (abstract data were presented at the American Headache Society meeting in June 2022), there was a 65.3% reduction in monthly migraine days (MMD) from baseline through 6 months. Treatment reduced MMD by 10.0 (from 15.3 to 5.3—a 76.8% reduction), and reduced acute medication use days (12.5 at baseline to 2.9) at 6 months.
Users of nVNS discussed their experiences with the device, which is the size of a large bar of soap, in a patient registry. They reported 192 attacks, with a mean pain score starting at 2.7 and dropping to 1.3 after 30 minutes. The pain levels of 70% of the attacks dropped to either mild or nonexistent. In a multicenter study on nNVS, 48 patients and 44 sham patients with episodic and chronic cluster headache showed no significant difference in the primary endpoint of pain freedom at 15 minutes between the nVNS and sham. There was also no difference in the chronic cluster headache group. But the episodic cluster subgroup showed a difference; nVNS was superior to sham, 48% to 6% (P
The e-TNS device is cleared for treating adults with migraine, acutely and preventively. It received initial clearance in 2017; in 2020, Cefaly Technology received clearance from the FDA to sell its products over the counter. The device, which resembles a large diamond that affixes to the forehead, has received differing reviews between various patient reports (found online at major retailer sites) and study results. In a blinded, intent-to-treat study involving 538 patients, 25.5% of the verum group reported they were pain-free at 2 hours; 18.3% in the sham group reported the same. Additionally, 56.4% of the subjects in the verum group reported they were free of the most bothersome migraine symptoms, as opposed to 42.3% of the sham group.
Adverse Events
The adverse events observed with these devices were, overall, relatively mild, and disappeared once the device was shut off. A few nVNS users said they experienced discomfort at the application site. With REN, 59 of 12,368 patients reported device-related issues; the vast majority were considered mild and consisted mostly of a sensation of warmth under the device. Of the 259 e-TNS users, 8.5% reported minor and reversible occurrences, such as treatment-related discomfort, paresthesia, and burning.
Patients in the Clinic
A few observations from the clinic regarding these devices:
Some devices are easier to use than others. I know this, because at a recent demonstration session in a course for physicians on headache treatment, I agreed to be the person on whom the device was demonstrated. The physician applying the device had difficulty aligning the device’s sensors with the appropriate nerves. Making sure your patients use these devices correctly is essential, and you or your staff should demonstrate their use to the patient. No doubt, this could be time-consuming in some cases, and patients who are reading the device’s instructions while in pain will likely get frustrated if they cannot get the device to work.
Some patients who have failed every medication class can occasionally find partial relief with these devices. One longtime patient of mine came to me severely disabled from chronic migraine and medication overuse headache but was somewhat better with 2 preventive medications. Triptans worked acutely, but she developed nearly every side effect imaginable. I was able to reverse her medication overuse headache, but the gepants, although they worked somewhat, took too long to take effect. We agreed the next step would be to use REN for each migraine attack, combined with acute care medication if necessary. (She uses REN alone for a milder headache and adds a gepant with naproxen if necessary.) She has found using the relaxation module on the REN app increases her chances of eliminating the migraine. She is not pain free all the time, but she appreciates the pain-free intervals.
One chronic cluster patient has relied on subcutaneous sumatriptan and breathing 100% oxygen at 12 liters per minute through a mask over his nose and mouth for acute relief from his headaches. His headache pain can climb from a 3 to a 10 in a matter of minutes. It starts behind and a bit above the right eye where he feels a tremendous pressure building up. He says that at times it feels like a screwdriver has been thrust into his eye and is being turned. Along with the pain, the eye becomes red, the pupil constricts, and the eyelid droops. He also has dripping from the right nostril, which stuffs up when the pain abates. The pain lasts for 1 to 2 hours, then returns 3 to 5 times a day for 5 days a week, on average. The pain never goes away for more than 3 weeks in a year’s time, hence the reason for his chronic cluster headache diagnosis. He is now using nVNS as soon as he feels the pain coming on. If the device does not provide sufficient relief, he uses oxygen or takes the sumatriptan injection.
Some patients who get cluster headaches think of suicide if the pain cannot be stopped; but in my experience, most can become pain free, or at least realize some partial relief from a variety of treatments (sometimes given at the same time).
Doctors often do not think of devices as options, and some doctors think devices do not work even though they have no experience with using them. Devices can give good relief on their own, and when a severe headache needs stronger treatment, medications added to a device usually work better than either treatment alone.
HIV: Greater parental involvement needed with young men who have sex with men
“Take it from me, parents just don’t understand.”
Fresh Prince and D.J. Jazzy Jeff penned this lyric roughly 35 years ago, and coincidentally the HIV/AIDS epidemic has also been with us just as long. But the connection between the two may be highly relevant – that is, if you consider how infrequently parents appear (or have the proper tools) to engage with their gay or bisexual sons to prevent and curb HIV infections.
Currently, YMSM between the ages of 13 and 24 are among the most affected by the ongoing HIV epidemic, with CDC estimates suggesting that, in 2020, this group alone represented about 35% of new diagnoses. At the same time, about half of these HIV infections go undiagnosed. Recent data also suggest that care linkage in this group is similar to adults, but only a third of YMSM start antiretroviral therapy and are retained in care, leading to viral suppression rates as low as 12%.
With a goal to change these discouraging numbers, researchers from George Washington University, Washington, and other institutions conducted a randomized controlled pilot study targeting parents of YMSM to improve both the frequency and quality of communication around sexual health and HIV risk, prevention, and testing.
The findings, which were published online in the journal AIDS and Behavior, highlight the observation that parents could be an essential resource for combating the HIV epidemic, but they’re a resource that’s often underutilized. In fact, after participating in an online offering – PATHS (Parents and Adolescents Talking about Healthy Sexuality) – parents reported significantly greater engagement with their sons, especially around discussions focusing on HIV information and condom use.
“From what we know from the research, parents are uncomfortable talking about sex; they’re not great at talking about it. But when they do and do it effectively, those kids seem to have better health outcomes,” lead author David Huebner, PhD, MPH, associate professor of prevention and community health at George Washington University, said in an interview.
“The goal was to get parents to deliver more messages and engage in more behaviors with their sons that we think are likely to help their sons stay healthy,” he said.
For the pilot study, Huebner and his team recruited 61 parents (95% of whom were mothers) with predominantly high school-aged cisgender sons (median, 16.7-17 years) who had come out as gay or bisexual at least a month prior, whose HIV status was negative or unknown, and who were living at home.
The interventions were strictly parent focused, Dr. Huebner said, noting that the only interaction with the kids involved independent surveys at the start and end of the study that explored parental behavior and engagement.
For the study, parental participants were stratified by son’s age (13-17 or 18-22 years) and then randomly assigned to participate in a web-accessible PATHS intervention (intervention group) or view a 35-minute, documentary-style film that encouraged acceptance of lesbian, gay, or bisexual children (control group),
Parents assigned to the intervention group were asked to engage in their own time with six modules that explored the importance of communication, HIV information, using and acquiring condoms, HIV testing, and as follow-up, a “to-do” list encouraging selection of how they would follow up with their sons about the content. They were also offered the option to participate in supplemental modules on pre-exposure prophylaxis (PrEP), anal intercourse, and what to do if a child tested positive for HIV.
“The intervention ... showed strong evidence of being effective at changing the parent behaviors that we hoped to change,” Dr. Huebner explained.
“We got independent reports from parents and kids that showed the same thing: parents were more likely to communicate with their sons about HIV in the 3 months after the intervention and were more likely to help their sons get access to condoms,” he said.
Both of these findings were significant, with parents in the experimental group being almost 10 times more likely to share HIV information with their sons (odds ratio, 9.50; 95% confidence interval, 1.02-39.99; P < .05) and five times more likely to teach proper condom use (OR, 5.04; 95% CI 1.56-12.46; P < .05), compared with parents receiving the placebo.
“It’s very promising that the initial signals from their intervention do show that parents facilitating the acquisition of information for young men who have sex with men really works,” said Dalmacio Dennis Flores, PhD, ACRN, an assistant professor of nursing in family and community health at the University of Pennsylvania, Philadelphia. He was not directly involved in the study.
“On the outcomes that matter for us, such as HIV prevention or getting tested, they were able to document that parents receiving guidance on how to have these conversations does result in youth outcomes – something that has been lacking in the literature specifically for this population up until today,” Dr. Flores told this news organization.
Overall, parents engaging in the PATHS intervention showed improvements in skills, attitudes, and behavioral intention toward engagement with their sons, including assisting with HIV testing. However, what about parental involvement in these types of dialogues with children who have not yet come out to their parents?
Dr. Flores said that, although Dr. Huebner’s work is pivotal for families where the child’s sexual orientation is known to parents, there is value in inclusive sex communication for all youth, regardless of how they identify (that is, out of the closet, closeted, straight, or those who are questioning their identity), especially since younger generations of LGBTQ youth are coming out at earlier ages, compared with previous generations.
It’s not just parents. Clinicians also have critical roles to play in helping bridge the sex-talk communication gaps between parents and adolescents and young adult children.
“In my work, I’ve found that more clinicians are willing to broach this within the discussion with dyads, with parents and adolescents in the room,” said Dr. Flores.
And he added: “If clinicians signal that there’s no such thing as too early to have these conversations or that issues such as consent, safety, and sexting are all okay to talk about because these are the current realities of young people, then parents can feel that they’re empowered to broach or sustain these conversations.”
Importantly, Dr. Huebner and associates are currently recruiting larger numbers of families for a new, yearlong trial that will not only examine parental behavior changes but also whether these changes translate into improvements in their child’s sexual health and/or competency. Interested families can learn more about the study and sign up to receive updates at www.parentwithlove.org.
Dr. Huebner and Dr. Flores reported no relevant financial relationships.
A version of this article first appeared on Medscape.com.
FROM AIDS AND BEHAVIOR
Bepirovirsen: Is a ‘functional cure’ for HBV on the horizon?
Treatment with bepirovirsen led to sustained clearance of hepatitis B surface antigen (HBsAg) and hepatitis B virus (HBV) DNA for 24 weeks after the end of treatment for adults with chronic HBV in the phase 2b B-Clear study.
The study results were presented at the annual meeting of the American Association for the Study of Liver Diseases and were simultaneously published in The New England Journal of Medicine.
Currently, nucleoside/nucleotide analogue (NA) therapy is the recommended first-line therapy for patients with chronic HBV because it can inhibit viral replication.
However, fewer than 5% of patients have HBsAg loss after 12 months of NA therapy, which underscores the need for therapies that can achieve a “functional” cure, largely defined as sustained, undetectable levels of HBV DNA and HBsAg in the blood, with or without generation of protective antibodies against HBsAg, the researchers noted.
Bepirovirsen is a potential first-in-class antisense oligonucleotide that targets all HBV messenger RNA and acts to decrease levels of viral proteins.
The phase 2b B-Clear study enrolled 457 patients with chronic HBV; 227 were receiving NA therapy, and 230 were not.
Participants were randomly assigned to receive weekly subcutaneous injections of bepirovirsen 300 mg for 24 weeks; bepirovirsen 300 mg for 12 weeks, then 150 mg for 12 weeks; bepirovirsen 300 mg for 12 weeks, then placebo for 12 weeks; or placebo for 12 weeks, then bepirovirsen 300 mg for 12 weeks (groups 1, 2, 3, and 4, respectively).
The composite primary outcome was HBsAg level below the limit of detection and HBV DNA level below the limit of quantification maintained for 24 weeks after the end of bepirovirsen treatment, without newly initiated antiviral medication.
Bepirovirsen 300 mg weekly for 24 weeks (group 1) led to HBsAg and HBV DNA loss in 9% of patients receiving NA therapy and 10% of patients not receiving NA treatment, which was sustained for 24 weeks after the last dose.
For groups 2, 3, and 4, HBsAg and HBV DNA loss occurred in 9%, 3%, and 0%, respectively, of patients receiving NA therapy and 6%, 1%, and 0%, respectively, of patients not receiving NA treatment.
Patients with low baseline HBsAg levels (< 1,000 IU/mL) responded best to treatment with bepirovirsen. Among patients who received bepirovirsen 300 mg weekly for 24 weeks, the primary outcome was achieved by 16% of patients taking NA therapy and by 25% of patients not taking NA therapy.
Although a “relatively low percentage” of patients overall achieved the primary outcome, the study “indicates the possibility of enhanced efficacy with the selection of patients according to baseline characteristics (low HBsAg level at baseline), with combination therapies, or both,” the researchers wrote.
Adverse events with bepirovirsen included injection-site reactions, pyrexia, fatigue, and increased alanine aminotransferase (ALT) levels. Increases in ALT levels, which were more common in those not receiving NA therapy than in those receiving NA therapy (41% vs. 17%), led to two serious adverse events.
On the basis of phase 2b data, GlaxoSmithKline (GSK) plans to advance bepirovirsen into phase 3 development, according to a news release.
Further pursuit of bepirovirsen therapy is “certainly warranted, with the use of a dose of 300 mg per week for at least 24 weeks; indeed, the duration of therapy might be dictated best by HBsAg levels at baseline,” Jay H. Hoofnagle, MD, director of the liver disease research branch at the National Institute of Diabetes and Digestive and Kidney Diseases, wrote in an editorial in the New England Journal of Medicine.
Several critical questions remain, including whether HBsAg negativity will persist beyond 24 weeks, wrote Dr. Hoofnagle, who was not involved in the study.
It’s a question GSK is addressing in the B-Sure trial, which will follow participants for an additional 33 months, the study noted.
Other questions include when NA therapy can be safely stopped, what other factors predict response, and whether RNA therapy–induced loss of HBsAg materially improves long-term outcomes, Dr. Hoofnagle wrote.
“Bepirovirsen is just one RNA-based HBV therapy now being pursued. Several other antisense RNAs as well as the more malleable small interfering RNA molecules (‘-sirans’) are currently in early-phase clinical trials. A new era in the control of hepatitis B may be at hand with these most modern of therapies for this most ancient disease,” Dr. Hoofnagle noted.
The B-Clear study was supported by GSK. Several authors have disclosed relationships with the company. A complete list of author disclosures is available with the original article. Dr. Hoofnagle has disclosed no relevant financial relationships.
A version of this article first appeared on Medscape.com.
FROM THE LIVER MEETING
FDA grants accelerated approval for new treatment of female cancers
The Food and Drug Administration has granted accelerated approval to mirvetuximab soravtansine (Elahere) for use in pretreated patients with folate receptor (FR) alpha–positive, platinum-resistant epithelial ovarian, fallopian tube, and primary peritoneal cancer. These patients can have received one to three prior lines of treatment.
“ according to labeling.
Mirvetuximab soravtansine is an antibody-drug conjugate (ADC) with an antibody directed against FR alpha that is linked to a microtubule inhibitor conjugate.
This product is a first-in-class ADC directed against FR alpha, a cell-surface protein highly expressed in ovarian cancer, and is the first FDA-approved ADC for platinum-resistant disease, said the manufacturer, ImmunoGen.
Patients are selected for treatment with this drug using a diagnostic test that the FDA approved along with the agent: the VENTANA FOLR1 (FOLR-2.1) RxDx Assay.
FR alpha–positive platinum-resistant ovarian cancer is characterized by limited treatment options and poor outcomes, commented Ursula Matulonis, MD, chief of the division of gynecologic oncology at the Dana-Farber Cancer Institute, Boston, and co–principal investigator of the SORAYA trial that led to the approval. In a company press release, she said results from this trial show that mirvetuximab soravtansine has “impressive antitumor activity, durability of response, and overall tolerability ... [which] demonstrate the benefit of this new therapeutic option.”
The SORAYA trial (also known as Study 0417 [NCT04296890]) was a single-arm trial of 106 patients with FR alpha–positive, platinum-resistant epithelial ovarian, fallopian tube, or primary peritoneal cancer.
These patients were identified as FR alpha positive by using the assay. They were permitted to receive up to three prior lines of systemic therapy, and all patients were required to have received bevacizumab.
All patients received mirvetuximab soravtansine-gynx 6 mg/kg (based on adjusted ideal body weight) as an intravenous infusion every 3 weeks until disease progression or unacceptable toxicity.
The approval was based on an investigator-assessed overall response rate of 31.7%, which included five complete responses, and a median duration of response of 6.9 months.
Safety was evaluated in a pooled analysis from three studies among a total of 464 patients with FR alpha–positive, platinum-resistant epithelial ovarian, fallopian tube, or primary peritoneal cancer who received at least one dose of the drug.
The most common adverse events, occurring in 20% or more of study participants, were vision impairment, fatigue, increased AST level, nausea, increased alanine aminotransferase level, keratopathy, abdominal pain, decreased lymphocytes, peripheral neuropathy, diarrhea, decreased albumin, constipation, increased alkaline phosphatase level, dry eye, decreased magnesium level, decreased leukocyte count, decreased neutrophil count, and decreased hemoglobin level.
Potential participants were excluded if they had corneal disorders, ocular conditions requiring ongoing treatment, peripheral neuropathy above grade 1, or noninfectious interstitial lung disease.
The product labeling contains a boxed warning of ocular toxicity. Full prescribing information is available.
A version of this article first appeared on Medscape.com.
Quality of Life and Population Health in Behavioral Health Care: A Retrospective, Cross-Sectional Study
From Milwaukee County Behavioral Health Services, Milwaukee, WI.
Abstract
Objectives: The goal of this study was to determine whether a single-item quality of life (QOL) measure could serve as a useful population health–level metric within the Quadruple Aim framework in a publicly funded behavioral health system.
Design: This was a retrospective, cross-sectional study that examined the correlation between the single-item QOL measure and several other key measures of the social determinants of health and a composite measure of acute service utilization for all patients receiving mental health and substance use services in a community behavioral health system.
Methods: Data were collected for 4488 patients who had at least 1 assessment between October 1, 2020, and September 30, 2021. Data on social determinants of health were obtained through patient self-report; acute service use data were obtained from electronic health records.
Results: Statistical analyses revealed results in the expected direction for all relationships tested. Patients with higher QOL were more likely to report “Good” or better self-rated physical health, be employed, have a private residence, and report recent positive social interactions, and were less likely to have received acute services in the previous 90 days.
Conclusion: A single-item QOL measure shows promise as a general, minimally burdensome whole-system metric that can function as a target for population health management efforts in a large behavioral health system. Future research should explore whether this QOL measure is sensitive to change over time and examine its temporal relationship with other key outcome metrics.
Keywords: Quadruple Aim, single-item measures, social determinants of health, acute service utilization metrics.
The Triple Aim for health care—improving the individual experience of care, increasing the health of populations, and reducing the costs of care—was first proposed in 2008.1 More recently, some have advocated for an expanded focus to include a fourth aim: the quality of staff work life.2 Since this seminal paper was published, many health care systems have endeavored to adopt and implement the Quadruple Aim3,4; however, the concepts representing each of the aims are not universally defined,3 nor are the measures needed to populate the Quadruple Aim always available within the health system in question.5
Although several assessment models and frameworks that provide guidance to stakeholders have been developed,6,7 it is ultimately up to organizations themselves to determine which measures they should deploy to best represent the different quadrants of the Quadruple Aim.6 Evidence suggests, however, that quality measurement, and the administrative time required to conduct it, can be both financially and emotionally burdensome to providers and health systems.8-10 Thus, it is incumbent on organizations to select a set of measures that are not only meaningful but as parsimonious as possible.6,11,12
Quality of life (QOL) is a potential candidate to assess the aim of population health. Brief health-related QOL questions have long been used in epidemiological surveys, such as the Behavioral Risk Factor Surveillance System survey.13 Such questions are also a key component of community health frameworks, such as the County Health Rankings developed by the University of Wisconsin Population Health Institute.14 Furthermore, Humana recently revealed that increasing the number of physical and mental health “Healthy Days” (which are among the Centers for Disease Control and Prevention’s Health-Related Quality of Life questions15) among the members enrolled in their insurance plan would become a major goal for the organization.16,17 Many of these measures, while brief, focus on QOL as a function of health, often as a self-rated construct (from “Poor” to “Excellent”) or in the form of days of poor physical or mental health in the past 30 days,15 rather than evaluating QOL itself; however, several authors have pointed out that health status and QOL are related but distinct concepts.18,19
Brief single-item assessments focused specifically on QOL have been developed and implemented within nonclinical20 and clinical populations, including individuals with cancer,21 adults with disabilities,22 individuals with cystic fibrosis,23 and children with epilepsy.24 Despite the long history of QOL assessment in behavioral health treatment,25 single-item measures have not been widely implemented in this population.
Milwaukee County Behavioral Health Services (BHS), a publicly funded, county-based behavioral health care system in Milwaukee, Wisconsin, provides inpatient and ambulatory treatment, psychiatric emergency care, withdrawal management, care management, crisis services, and other support services to individuals in Milwaukee County. In 2018 the community services arm of BHS began implementing a single QOL question from the World Health Organization’s WHOQOL-BREF26: On a 5-point rating scale of “Very Poor” to “Very Good,” “How would you rate your overall quality of life right now?” Previous research by Atroszko and colleagues,20 which used a similar approach with the same item from the WHOQOL-BREF, reported correlations in the expected direction of the single-item QOL measure with perceived stress, depression, anxiety, loneliness, and daily hours of sleep. This study’s sample, however, comprised opportunistically recruited college students, not a clinical population. Further, the researchers did not examine the relationship of QOL with acute service utilization or other measures of the social determinants of health, such as housing, employment, or social connectedness.
The following study was designed to extend these results by focusing on a clinical population—individuals with mental health or substance use issues—being served in a large, publicly funded behavioral health system in Milwaukee, Wisconsin. The objective of this study was to determine whether a single-item QOL measure could be used as a brief, parsimonious measure of overall population health by examining its relationship with other key outcome measures for patients receiving services from BHS. This study was reviewed and approved by BHS’s Institutional Review Board.
Methods
All patients engaged in nonacute community services are offered a standardized assessment that includes, among other measures, items related to QOL, housing status, employment status, self-rated physical health, and social connectedness. This assessment is administered at intake, discharge, and every 6 months while patients are enrolled in services. Patients who received at least 1 assessment between October 1, 2020, and September 30, 2021, were included in the analyses. Patients receiving crisis, inpatient, or withdrawal management services alone (ie, did not receive any other community-based services) were not offered the standard assessment and thus were not included in the analyses. If patients had more than 1 assessment during this time period, QOL data from the last assessment were used. Data on housing (private residence status, defined as adults living alone or with others without supervision in a house or apartment), employment status, self-rated physical health, and social connectedness (measured by asking people whether they have had positive interactions with family or friends in the past 30 days) were extracted from the same timepoint as well.
Also included in the analyses were rates of acute service utilization, in which any patient with at least 1 visit to BHS’s psychiatric emergency department, withdrawal management facility, or psychiatric inpatient facility in the 90 days prior to the date of the assessment received a code of “Yes,” and any patient who did not receive any of these services received a code of “No.” Chi-square analyses were conducted to determine the relationship between QOL rankings (“Very Poor,” “Poor,” “Neither Good nor Poor,” “Good,” and “Very Good”) and housing, employment, self-rated physical health, social connectedness, and 90-day acute service use. All acute service utilization data were obtained from BHS’s electronic health records system. All data used in the study were stored on a secure, password-protected server. All analyses were conducted with SPSS software (SPSS 28; IBM).
Results
Data were available for 4488 patients who received an assessment between October 1, 2020, and September 30, 2021 (total numbers per item vary because some items had missing data; see supplementary eTables 1-3 for sample size per item). Demographics of the patient sample are listed in Table 1; the demographics of the patients who were missing data for specific outcomes are presented in eTables 1-3.


Statistical analyses revealed results in the expected direction for all relationships tested (Table 2). As patients’ self-reported QOL improved, so did the likelihood of higher rates of self-reported “Good” or better physical health, which was 576% higher among individuals who reported “Very Good” QOL relative to those who reported “Very Poor” QOL. Similarly, when compared with individuals with “Very Poor” QOL, individuals who reported “Very Good” QOL were 21.91% more likely to report having a private residence, 126.7% more likely to report being employed, and 29.17% more likely to report having had positive social interactions with family and friends in the past 30 days. There was an inverse relationship between QOL and the likelihood that a patient had received at least 1 admission for an acute service in the previous 90 days, such that patients who reported “Very Good” QOL were 86.34% less likely to have had an admission compared to patients with “Very Poor” QOL (2.8% vs 20.5%, respectively). The relationships among the criterion variables used in this study are presented in Table 3.

Discussion
The results of this preliminary analysis suggest that self-rated QOL is related to key health, social determinants of health, and acute service utilization metrics. These data are important for several reasons. First, because QOL is a diagnostically agnostic measure, it is a cross-cutting measure to use with clinically diverse populations receiving an array of different services. Second, at 1 item, the QOL measure is extremely brief and therefore minimally onerous to implement for both patients and administratively overburdened providers. Third, its correlation with other key metrics suggests that it can function as a broad population health measure for health care organizations because individuals with higher QOL will also likely have better outcomes in other key areas. This suggests that it has the potential to broadly represent the overall status of a population of patients, thus functioning as a type of “whole system” measure, which the Institute for Healthcare Improvement describes as “a small set of measures that reflect a health system’s overall performance on core dimensions of quality guided by the Triple Aim.”7 These whole system measures can help focus an organization’s strategic initiatives and efforts on the issues that matter most to the patients and community it serves.
The relationship of QOL to acute service utilization deserves special mention. As an administrative measure, utilization is not susceptible to the same response bias as the other self-reported variables. Furthermore, acute services are costly to health systems, and hospital readmissions are associated with payment reductions in the Centers for Medicare and Medicaid Services (CMS) Hospital Readmissions Reduction Program for hospitals that fail to meet certain performance targets.27 Thus, because of its alignment with federal mandates, improved QOL (and potentially concomitant decreases in acute service use) may have significant financial implications for health systems as well.
This study was limited by several factors. First, it was focused on a population receiving publicly funded behavioral health services with strict eligibility requirements, one of which stipulated that individuals must be at 200% or less of the Federal Poverty Level; therefore, the results might not be applicable to health systems with a more clinically or socioeconomically diverse patient population. Second, because these data are cross-sectional, it was not possible to determine whether QOL improved over time or whether changes in QOL covaried longitudinally with the other metrics under observation. For example, if patients’ QOL improved from the first to last assessment, did their employment or residential status improve as well, or were these patients more likely to be employed at their first assessment? Furthermore, if there was covariance, did changes in employment, housing status, and so on precede changes in QOL or vice versa? Multiple longitudinal observations would help to address these questions and will be the focus of future analyses.
Conclusion
This preliminary study suggests that a single-item QOL measure may be a valuable population health–level metric for health systems. It requires little administrative effort on the part of either the clinician or patient. It is also agnostic with regard to clinical issue or treatment approach and can therefore admit of a range of diagnoses or patient-specific, idiosyncratic recovery goals. It is correlated with other key health, social determinants of health, and acute service utilization indicators and can therefore serve as a “whole system” measure because of its ability to broadly represent improvements in an entire population. Furthermore, QOL is patient-centered in that data are obtained through patient self-report, which is a high priority for CMS and other health care organizations.28 In summary, a single-item QOL measure holds promise for health care organizations looking to implement the Quadruple Aim and assess the health of the populations they serve in a manner that is simple, efficient, and patient-centered.
Acknowledgments: The author thanks Jennifer Wittwer for her thoughtful comments on the initial draft of this manuscript and Gary Kraft for his help extracting the data used in the analyses.
Corresponding author: Walter Matthew Drymalski, PhD; [email protected]
Disclosures: None reported.
1. Berwick DM, Nolan TW, Whittington J. The triple aim: care, health, and cost. Health Aff (Millwood). 2008;27(3):759-769. doi:10.1377/hlthaff.27.3.759
2. Bodenheimer T, Sinsky C. From triple to quadruple aim: care of the patient requires care of the provider. Ann Fam Med. 2014;12(6):573-576. doi:10.1370/afm.1713
3. Hendrikx RJP, Drewes HW, Spreeuwenberg M, et al. Which triple aim related measures are being used to evaluate population management initiatives? An international comparative analysis. Health Policy. 2016;120(5):471-485. doi:10.1016/j.healthpol.2016.03.008
4. Whittington JW, Nolan K, Lewis N, Torres T. Pursuing the triple aim: the first 7 years. Milbank Q. 2015;93(2):263-300. doi:10.1111/1468-0009.12122
5. Ryan BL, Brown JB, Glazier RH, Hutchison B. Examining primary healthcare performance through a triple aim lens. Healthc Policy. 2016;11(3):19-31.
6. Stiefel M, Nolan K. A guide to measuring the Triple Aim: population health, experience of care, and per capita cost. Institute for Healthcare Improvement; 2012. Accessed November 1, 2022. https://nhchc.org/wp-content/uploads/2019/08/ihiguidetomeasuringtripleaimwhitepaper2012.pdf
7. Martin L, Nelson E, Rakover J, Chase A. Whole system measures 2.0: a compass for health system leaders. Institute for Healthcare Improvement; 2016. Accessed November 1, 2022. http://www.ihi.org:80/resources/Pages/IHIWhitePapers/Whole-System-Measures-Compass-for-Health-System-Leaders.aspx
8. Casalino LP, Gans D, Weber R, et al. US physician practices spend more than $15.4 billion annually to report quality measures. Health Aff (Millwood). 2016;35(3):401-406. doi:10.1377/hlthaff.2015.1258
9. Rao SK, Kimball AB, Lehrhoff SR, et al. The impact of administrative burden on academic physicians: results of a hospital-wide physician survey. Acad Med. 2017;92(2):237-243. doi:10.1097/ACM.0000000000001461
10. Woolhandler S, Himmelstein DU. Administrative work consumes one-sixth of U.S. physicians’ working hours and lowers their career satisfaction. Int J Health Serv. 2014;44(4):635-642. doi:10.2190/HS.44.4.a
11. Meyer GS, Nelson EC, Pryor DB, et al. More quality measures versus measuring what matters: a call for balance and parsimony. BMJ Qual Saf. 2012;21(11):964-968. doi:10.1136/bmjqs-2012-001081
12. Vital Signs: Core Metrics for Health and Health Care Progress. Washington, DC: National Academies Press; 2015. doi:10.17226/19402
13. Centers for Disease Control and Prevention. BRFSS questionnaires. Accessed November 1, 2022. https://www.cdc.gov/brfss/questionnaires/index.htm
14. County Health Rankings and Roadmaps. Measures & data sources. University of Wisconsin Population Health Institute. Accessed November 1, 2022. https://www.countyhealthrankings.org/explore-health-rankings/measures-data-sources
15. Centers for Disease Control and Prevention. Healthy days core module (CDC HRQOL-4). Accessed November 1, 2022. https://www.cdc.gov/hrqol/hrqol14_measure.htm
16. Cordier T, Song Y, Cambon J, et al. A bold goal: more healthy days through improved community health. Popul Health Manag. 2018;21(3):202-208. doi:10.1089/pop.2017.0142
17. Slabaugh SL, Shah M, Zack M, et al. Leveraging health-related quality of life in population health management: the case for healthy days. Popul Health Manag. 2017;20(1):13-22. doi:10.1089/pop.2015.0162
18. Karimi M, Brazier J. Health, health-related quality of life, and quality of life: what is the difference? Pharmacoeconomics. 2016;34(7):645-649. doi:10.1007/s40273-016-0389-9
19. Smith KW, Avis NE, Assmann SF. Distinguishing between quality of life and health status in quality of life research: a meta-analysis. Qual Life Res. 1999;8(5):447-459. doi:10.1023/a:1008928518577
20. Atroszko PA, Baginska P, Mokosinska M, et al. Validity and reliability of single-item self-report measures of general quality of life, general health and sleep quality. In: CER Comparative European Research 2015. Sciemcee Publishing; 2015:207-211.
21. Singh JA, Satele D, Pattabasavaiah S, et al. Normative data and clinically significant effect sizes for single-item numerical linear analogue self-assessment (LASA) scales. Health Qual Life Outcomes. 2014;12:187. doi:10.1186/s12955-014-0187-z
22. Siebens HC, Tsukerman D, Adkins RH, et al. Correlates of a single-item quality-of-life measure in people aging with disabilities. Am J Phys Med Rehabil. 2015;94(12):1065-1074. doi:10.1097/PHM.0000000000000298
23. Yohannes AM, Dodd M, Morris J, Webb K. Reliability and validity of a single item measure of quality of life scale for adult patients with cystic fibrosis. Health Qual Life Outcomes. 2011;9:105. doi:10.1186/1477-7525-9-105
24. Conway L, Widjaja E, Smith ML. Single-item measure for assessing quality of life in children with drug-resistant epilepsy. Epilepsia Open. 2017;3(1):46-54. doi:10.1002/epi4.12088
25. Barry MM, Zissi A. Quality of life as an outcome measure in evaluating mental health services: a review of the empirical evidence. Soc Psychiatry Psychiatr Epidemiol. 1997;32(1):38-47. doi:10.1007/BF00800666
26. Skevington SM, Lotfy M, O’Connell KA. The World Health Organization’s WHOQOL-BREF quality of life assessment: psychometric properties and results of the international field trial. Qual Life Res. 2004;13(2):299-310. doi:10.1023/B:QURE.0000018486.91360.00
27. Centers for Medicare & Medicaid Services. Hospital readmissions reduction program (HRRP). Accessed November 1, 2022. https://www.cms.gov/Medicare/Medicare-Fee-for-Service-Payment/AcuteInpatientPPS/Readmissions-Reduction-Program
28. Centers for Medicare & Medicaid Services. Patient-reported outcome measures. CMS Measures Management System. Published May 2022. Accessed November 1, 2022. https://www.cms.gov/files/document/blueprint-patient-reported-outcome-measures.pdf
From Milwaukee County Behavioral Health Services, Milwaukee, WI.
Abstract
Objectives: The goal of this study was to determine whether a single-item quality of life (QOL) measure could serve as a useful population health–level metric within the Quadruple Aim framework in a publicly funded behavioral health system.
Design: This was a retrospective, cross-sectional study that examined the correlation between the single-item QOL measure and several other key measures of the social determinants of health and a composite measure of acute service utilization for all patients receiving mental health and substance use services in a community behavioral health system.
Methods: Data were collected for 4488 patients who had at least 1 assessment between October 1, 2020, and September 30, 2021. Data on social determinants of health were obtained through patient self-report; acute service use data were obtained from electronic health records.
Results: Statistical analyses revealed results in the expected direction for all relationships tested. Patients with higher QOL were more likely to report “Good” or better self-rated physical health, be employed, have a private residence, and report recent positive social interactions, and were less likely to have received acute services in the previous 90 days.
Conclusion: A single-item QOL measure shows promise as a general, minimally burdensome whole-system metric that can function as a target for population health management efforts in a large behavioral health system. Future research should explore whether this QOL measure is sensitive to change over time and examine its temporal relationship with other key outcome metrics.
Keywords: Quadruple Aim, single-item measures, social determinants of health, acute service utilization metrics.
The Triple Aim for health care—improving the individual experience of care, increasing the health of populations, and reducing the costs of care—was first proposed in 2008.1 More recently, some have advocated for an expanded focus to include a fourth aim: the quality of staff work life.2 Since this seminal paper was published, many health care systems have endeavored to adopt and implement the Quadruple Aim3,4; however, the concepts representing each of the aims are not universally defined,3 nor are the measures needed to populate the Quadruple Aim always available within the health system in question.5
Although several assessment models and frameworks that provide guidance to stakeholders have been developed,6,7 it is ultimately up to organizations themselves to determine which measures they should deploy to best represent the different quadrants of the Quadruple Aim.6 Evidence suggests, however, that quality measurement, and the administrative time required to conduct it, can be both financially and emotionally burdensome to providers and health systems.8-10 Thus, it is incumbent on organizations to select a set of measures that are not only meaningful but as parsimonious as possible.6,11,12
Quality of life (QOL) is a potential candidate to assess the aim of population health. Brief health-related QOL questions have long been used in epidemiological surveys, such as the Behavioral Risk Factor Surveillance System survey.13 Such questions are also a key component of community health frameworks, such as the County Health Rankings developed by the University of Wisconsin Population Health Institute.14 Furthermore, Humana recently revealed that increasing the number of physical and mental health “Healthy Days” (which are among the Centers for Disease Control and Prevention’s Health-Related Quality of Life questions15) among the members enrolled in their insurance plan would become a major goal for the organization.16,17 Many of these measures, while brief, focus on QOL as a function of health, often as a self-rated construct (from “Poor” to “Excellent”) or in the form of days of poor physical or mental health in the past 30 days,15 rather than evaluating QOL itself; however, several authors have pointed out that health status and QOL are related but distinct concepts.18,19
Brief single-item assessments focused specifically on QOL have been developed and implemented within nonclinical20 and clinical populations, including individuals with cancer,21 adults with disabilities,22 individuals with cystic fibrosis,23 and children with epilepsy.24 Despite the long history of QOL assessment in behavioral health treatment,25 single-item measures have not been widely implemented in this population.
Milwaukee County Behavioral Health Services (BHS), a publicly funded, county-based behavioral health care system in Milwaukee, Wisconsin, provides inpatient and ambulatory treatment, psychiatric emergency care, withdrawal management, care management, crisis services, and other support services to individuals in Milwaukee County. In 2018 the community services arm of BHS began implementing a single QOL question from the World Health Organization’s WHOQOL-BREF26: On a 5-point rating scale of “Very Poor” to “Very Good,” “How would you rate your overall quality of life right now?” Previous research by Atroszko and colleagues,20 which used a similar approach with the same item from the WHOQOL-BREF, reported correlations in the expected direction of the single-item QOL measure with perceived stress, depression, anxiety, loneliness, and daily hours of sleep. This study’s sample, however, comprised opportunistically recruited college students, not a clinical population. Further, the researchers did not examine the relationship of QOL with acute service utilization or other measures of the social determinants of health, such as housing, employment, or social connectedness.
The following study was designed to extend these results by focusing on a clinical population—individuals with mental health or substance use issues—being served in a large, publicly funded behavioral health system in Milwaukee, Wisconsin. The objective of this study was to determine whether a single-item QOL measure could be used as a brief, parsimonious measure of overall population health by examining its relationship with other key outcome measures for patients receiving services from BHS. This study was reviewed and approved by BHS’s Institutional Review Board.
Methods
All patients engaged in nonacute community services are offered a standardized assessment that includes, among other measures, items related to QOL, housing status, employment status, self-rated physical health, and social connectedness. This assessment is administered at intake, discharge, and every 6 months while patients are enrolled in services. Patients who received at least 1 assessment between October 1, 2020, and September 30, 2021, were included in the analyses. Patients receiving crisis, inpatient, or withdrawal management services alone (ie, did not receive any other community-based services) were not offered the standard assessment and thus were not included in the analyses. If patients had more than 1 assessment during this time period, QOL data from the last assessment were used. Data on housing (private residence status, defined as adults living alone or with others without supervision in a house or apartment), employment status, self-rated physical health, and social connectedness (measured by asking people whether they have had positive interactions with family or friends in the past 30 days) were extracted from the same timepoint as well.
Also included in the analyses were rates of acute service utilization, in which any patient with at least 1 visit to BHS’s psychiatric emergency department, withdrawal management facility, or psychiatric inpatient facility in the 90 days prior to the date of the assessment received a code of “Yes,” and any patient who did not receive any of these services received a code of “No.” Chi-square analyses were conducted to determine the relationship between QOL rankings (“Very Poor,” “Poor,” “Neither Good nor Poor,” “Good,” and “Very Good”) and housing, employment, self-rated physical health, social connectedness, and 90-day acute service use. All acute service utilization data were obtained from BHS’s electronic health records system. All data used in the study were stored on a secure, password-protected server. All analyses were conducted with SPSS software (SPSS 28; IBM).
Results
Data were available for 4488 patients who received an assessment between October 1, 2020, and September 30, 2021 (total numbers per item vary because some items had missing data; see supplementary eTables 1-3 for sample size per item). Demographics of the patient sample are listed in Table 1; the demographics of the patients who were missing data for specific outcomes are presented in eTables 1-3.
Statistical analyses revealed results in the expected direction for all relationships tested (Table 2). As patients’ self-reported QOL improved, so did the likelihood of higher rates of self-reported “Good” or better physical health, which was 576% higher among individuals who reported “Very Good” QOL relative to those who reported “Very Poor” QOL. Similarly, when compared with individuals with “Very Poor” QOL, individuals who reported “Very Good” QOL were 21.91% more likely to report having a private residence, 126.7% more likely to report being employed, and 29.17% more likely to report having had positive social interactions with family and friends in the past 30 days. There was an inverse relationship between QOL and the likelihood that a patient had received at least 1 admission for an acute service in the previous 90 days, such that patients who reported “Very Good” QOL were 86.34% less likely to have had an admission compared to patients with “Very Poor” QOL (2.8% vs 20.5%, respectively). The relationships among the criterion variables used in this study are presented in Table 3.
Discussion
The results of this preliminary analysis suggest that self-rated QOL is related to key health, social determinants of health, and acute service utilization metrics. These data are important for several reasons. First, because QOL is a diagnostically agnostic measure, it is a cross-cutting measure to use with clinically diverse populations receiving an array of different services. Second, at 1 item, the QOL measure is extremely brief and therefore minimally onerous to implement for both patients and administratively overburdened providers. Third, its correlation with other key metrics suggests that it can function as a broad population health measure for health care organizations because individuals with higher QOL will also likely have better outcomes in other key areas. This suggests that it has the potential to broadly represent the overall status of a population of patients, thus functioning as a type of “whole system” measure, which the Institute for Healthcare Improvement describes as “a small set of measures that reflect a health system’s overall performance on core dimensions of quality guided by the Triple Aim.”7 These whole system measures can help focus an organization’s strategic initiatives and efforts on the issues that matter most to the patients and community it serves.
The relationship of QOL to acute service utilization deserves special mention. As an administrative measure, utilization is not susceptible to the same response bias as the other self-reported variables. Furthermore, acute services are costly to health systems, and hospital readmissions are associated with payment reductions in the Centers for Medicare and Medicaid Services (CMS) Hospital Readmissions Reduction Program for hospitals that fail to meet certain performance targets.27 Thus, because of its alignment with federal mandates, improved QOL (and potentially concomitant decreases in acute service use) may have significant financial implications for health systems as well.
This study was limited by several factors. First, it was focused on a population receiving publicly funded behavioral health services with strict eligibility requirements, one of which stipulated that individuals must be at 200% or less of the Federal Poverty Level; therefore, the results might not be applicable to health systems with a more clinically or socioeconomically diverse patient population. Second, because these data are cross-sectional, it was not possible to determine whether QOL improved over time or whether changes in QOL covaried longitudinally with the other metrics under observation. For example, if patients’ QOL improved from the first to last assessment, did their employment or residential status improve as well, or were these patients more likely to be employed at their first assessment? Furthermore, if there was covariance, did changes in employment, housing status, and so on precede changes in QOL or vice versa? Multiple longitudinal observations would help to address these questions and will be the focus of future analyses.
Conclusion
This preliminary study suggests that a single-item QOL measure may be a valuable population health–level metric for health systems. It requires little administrative effort on the part of either the clinician or patient. It is also agnostic with regard to clinical issue or treatment approach and can therefore admit of a range of diagnoses or patient-specific, idiosyncratic recovery goals. It is correlated with other key health, social determinants of health, and acute service utilization indicators and can therefore serve as a “whole system” measure because of its ability to broadly represent improvements in an entire population. Furthermore, QOL is patient-centered in that data are obtained through patient self-report, which is a high priority for CMS and other health care organizations.28 In summary, a single-item QOL measure holds promise for health care organizations looking to implement the Quadruple Aim and assess the health of the populations they serve in a manner that is simple, efficient, and patient-centered.
Acknowledgments: The author thanks Jennifer Wittwer for her thoughtful comments on the initial draft of this manuscript and Gary Kraft for his help extracting the data used in the analyses.
Corresponding author: Walter Matthew Drymalski, PhD; [email protected]
Disclosures: None reported.
1. Berwick DM, Nolan TW, Whittington J. The triple aim: care, health, and cost. Health Aff (Millwood). 2008;27(3):759-769. doi:10.1377/hlthaff.27.3.759
2. Bodenheimer T, Sinsky C. From triple to quadruple aim: care of the patient requires care of the provider. Ann Fam Med. 2014;12(6):573-576. doi:10.1370/afm.1713
3. Hendrikx RJP, Drewes HW, Spreeuwenberg M, et al. Which triple aim related measures are being used to evaluate population management initiatives? An international comparative analysis. Health Policy. 2016;120(5):471-485. doi:10.1016/j.healthpol.2016.03.008
4. Whittington JW, Nolan K, Lewis N, Torres T. Pursuing the triple aim: the first 7 years. Milbank Q. 2015;93(2):263-300. doi:10.1111/1468-0009.12122
5. Ryan BL, Brown JB, Glazier RH, Hutchison B. Examining primary healthcare performance through a triple aim lens. Healthc Policy. 2016;11(3):19-31.
6. Stiefel M, Nolan K. A guide to measuring the Triple Aim: population health, experience of care, and per capita cost. Institute for Healthcare Improvement; 2012. Accessed November 1, 2022. https://nhchc.org/wp-content/uploads/2019/08/ihiguidetomeasuringtripleaimwhitepaper2012.pdf
7. Martin L, Nelson E, Rakover J, Chase A. Whole system measures 2.0: a compass for health system leaders. Institute for Healthcare Improvement; 2016. Accessed November 1, 2022. http://www.ihi.org:80/resources/Pages/IHIWhitePapers/Whole-System-Measures-Compass-for-Health-System-Leaders.aspx
8. Casalino LP, Gans D, Weber R, et al. US physician practices spend more than $15.4 billion annually to report quality measures. Health Aff (Millwood). 2016;35(3):401-406. doi:10.1377/hlthaff.2015.1258
9. Rao SK, Kimball AB, Lehrhoff SR, et al. The impact of administrative burden on academic physicians: results of a hospital-wide physician survey. Acad Med. 2017;92(2):237-243. doi:10.1097/ACM.0000000000001461
10. Woolhandler S, Himmelstein DU. Administrative work consumes one-sixth of U.S. physicians’ working hours and lowers their career satisfaction. Int J Health Serv. 2014;44(4):635-642. doi:10.2190/HS.44.4.a
11. Meyer GS, Nelson EC, Pryor DB, et al. More quality measures versus measuring what matters: a call for balance and parsimony. BMJ Qual Saf. 2012;21(11):964-968. doi:10.1136/bmjqs-2012-001081
12. Vital Signs: Core Metrics for Health and Health Care Progress. Washington, DC: National Academies Press; 2015. doi:10.17226/19402
13. Centers for Disease Control and Prevention. BRFSS questionnaires. Accessed November 1, 2022. https://www.cdc.gov/brfss/questionnaires/index.htm
14. County Health Rankings and Roadmaps. Measures & data sources. University of Wisconsin Population Health Institute. Accessed November 1, 2022. https://www.countyhealthrankings.org/explore-health-rankings/measures-data-sources
15. Centers for Disease Control and Prevention. Healthy days core module (CDC HRQOL-4). Accessed November 1, 2022. https://www.cdc.gov/hrqol/hrqol14_measure.htm
16. Cordier T, Song Y, Cambon J, et al. A bold goal: more healthy days through improved community health. Popul Health Manag. 2018;21(3):202-208. doi:10.1089/pop.2017.0142
17. Slabaugh SL, Shah M, Zack M, et al. Leveraging health-related quality of life in population health management: the case for healthy days. Popul Health Manag. 2017;20(1):13-22. doi:10.1089/pop.2015.0162
18. Karimi M, Brazier J. Health, health-related quality of life, and quality of life: what is the difference? Pharmacoeconomics. 2016;34(7):645-649. doi:10.1007/s40273-016-0389-9
19. Smith KW, Avis NE, Assmann SF. Distinguishing between quality of life and health status in quality of life research: a meta-analysis. Qual Life Res. 1999;8(5):447-459. doi:10.1023/a:1008928518577
20. Atroszko PA, Baginska P, Mokosinska M, et al. Validity and reliability of single-item self-report measures of general quality of life, general health and sleep quality. In: CER Comparative European Research 2015. Sciemcee Publishing; 2015:207-211.
21. Singh JA, Satele D, Pattabasavaiah S, et al. Normative data and clinically significant effect sizes for single-item numerical linear analogue self-assessment (LASA) scales. Health Qual Life Outcomes. 2014;12:187. doi:10.1186/s12955-014-0187-z
22. Siebens HC, Tsukerman D, Adkins RH, et al. Correlates of a single-item quality-of-life measure in people aging with disabilities. Am J Phys Med Rehabil. 2015;94(12):1065-1074. doi:10.1097/PHM.0000000000000298
23. Yohannes AM, Dodd M, Morris J, Webb K. Reliability and validity of a single item measure of quality of life scale for adult patients with cystic fibrosis. Health Qual Life Outcomes. 2011;9:105. doi:10.1186/1477-7525-9-105
24. Conway L, Widjaja E, Smith ML. Single-item measure for assessing quality of life in children with drug-resistant epilepsy. Epilepsia Open. 2017;3(1):46-54. doi:10.1002/epi4.12088
25. Barry MM, Zissi A. Quality of life as an outcome measure in evaluating mental health services: a review of the empirical evidence. Soc Psychiatry Psychiatr Epidemiol. 1997;32(1):38-47. doi:10.1007/BF00800666
26. Skevington SM, Lotfy M, O’Connell KA. The World Health Organization’s WHOQOL-BREF quality of life assessment: psychometric properties and results of the international field trial. Qual Life Res. 2004;13(2):299-310. doi:10.1023/B:QURE.0000018486.91360.00
27. Centers for Medicare & Medicaid Services. Hospital readmissions reduction program (HRRP). Accessed November 1, 2022. https://www.cms.gov/Medicare/Medicare-Fee-for-Service-Payment/AcuteInpatientPPS/Readmissions-Reduction-Program
28. Centers for Medicare & Medicaid Services. Patient-reported outcome measures. CMS Measures Management System. Published May 2022. Accessed November 1, 2022. https://www.cms.gov/files/document/blueprint-patient-reported-outcome-measures.pdf
Neurosurgery Operating Room Efficiency During the COVID-19 Era
From the Department of Neurological Surgery, Vanderbilt University Medical Center, Nashville, TN (Stefan W. Koester, Puja Jagasia, and Drs. Liles, Dambrino IV, Feldman, and Chambless), and the Department of Anesthesiology, Vanderbilt University Medical Center, Nashville, TN (Drs. Mathews and Tiwari).
ABSTRACT
Background: The COVID-19 pandemic has had broad effects on surgical care, including operating room (OR) staffing, personal protective equipment (PPE) utilization, and newly implemented anti-infective measures. Our aim was to assess neurosurgery OR efficiency before the COVID-19 pandemic, during peak COVID-19, and during current times.
Methods: Institutional perioperative databases at a single, high-volume neurosurgical center were queried for operations performed from December 2019 until October 2021. March 12, 2020, the day that the state of Tennessee declared a state of emergency, was chosen as the onset of the COVID-19 pandemic. The 90-day periods before and after this day were used to define the pre-COVID-19, peak-COVID-19, and post-peak restrictions time periods for comparative analysis. Outcomes included delay in first-start and OR turnover time between neurosurgical cases. Preset threshold times were used in analyses to adjust for normal leniency in OR scheduling (15 minutes for first start and 90 minutes for turnover). Univariate analysis used Wilcoxon rank-sum test for continuous outcomes, while chi-square test and Fisher’s exact test were used for categorical comparisons. Significance was defined as P < .05.
Results: First-start time was analyzed in 426 pre-COVID-19, 357 peak-restrictions, and 2304 post-peak-restrictions cases. The unadjusted mean delay length was found to be significantly different between the time periods, but the magnitude of increase in minutes was immaterial (mean [SD] minutes, 6 [18] vs 10 [21] vs 8 [20], respectively; P = .004). The adjusted average delay length and proportion of cases delayed beyond the 15-minute threshold were not significantly different. The proportion of cases that started early, as well as significantly early past a 15-minute threshold, have not been impacted. There was no significant change in turnover time during peak restrictions relative to the pre-COVID-19 period (88 [100] minutes vs 85 [95] minutes), and turnover time has since remained unchanged (83 [87] minutes).
Conclusion: Our center was able to maintain OR efficiency before, during, and after peak restrictions even while instituting advanced infection-control strategies. While there were significant changes, delays were relatively small in magnitude.
Keywords: operating room timing, hospital efficiency, socioeconomics, pandemic.
The COVID-19 pandemic has led to major changes in patient care both from a surgical perspective and in regard to inpatient hospital course. Safety protocols nationwide have been implemented to protect both patients and providers. Some elements of surgical care have drastically changed, including operating room (OR) staffing, personal protective equipment (PPE) utilization, and increased sterilization measures. Furloughs, layoffs, and reassignments due to the focus on nonelective and COVID-19–related cases challenged OR staffing and efficiency. Operating room staff with COVID-19 exposures or COVID-19 infections also caused last-minute changes in staffing. All of these scenarios can cause issues due to actual understaffing or due to staff members being pushed into highly specialized areas, such as neurosurgery, in which they have very little experience. A further obstacle to OR efficiency included policy changes involving PPE utilization, sterilization measures, and supply chain shortages of necessary resources such as PPE.
Neurosurgery in particular has been susceptible to COVID-19–related system-wide changes given operator proximity to the patient’s respiratory passages, frequency of emergent cases, and varying anesthetic needs, as well as the high level of specialization needed to perform neurosurgical care. Previous studies have shown a change in the makeup of neurosurgical patients seeking care, as well as in the acuity of neurological consult of these patients.1 A study in orthopedic surgery by Andreata et al demonstrated worsened OR efficiency, with significantly increased first-start and turnover times.2 In the COVID-19 era, OR quality and safety are crucially important to both patients and providers. Providing this safe and effective care in an efficient manner is important for optimal neurosurgical management in the long term.3 Moreover, the financial burden of implementing new protocols and standards can be compounded by additional financial losses due to reduced OR efficiency.
Methods
To analyze the effect of COVID-19 on neurosurgical OR efficiency, institutional perioperative databases at a single high-volume center were queried for operations performed from December 2019 until October 2021. March 12, 2020, was chosen as the onset of COVID-19 for analytic purposes, as this was the date when the state of Tennessee declared a state of emergency. The 90-day periods before and after this date were used for comparative analysis for pre-COVID-19, peak COVID-19, and post-peak-restrictions time periods. The peak COVID-19 period was defined as the 90-day period following the initial onset of COVID-19 and the surge of cases. For comparison purposes, post-peak COVID-19 was defined as the months following the first peak until October 2021 (approximately 17 months). COVID-19 burden was determined using a COVID-19 single-institution census of confirmed cases by polymerase chain reaction (PCR) for which the average number of cases of COVID-19 during a given month was determined. This number is a scaled trend, and a true number of COVID-19 cases in our hospital was not reported.
Neurosurgical and neuroendovascular cases were included in the analysis. Outcomes included delay in first-start and OR turnover time between neurosurgical cases, defined as the time from the patient leaving the room until the next patient entered the room. Preset threshold times were used in analyses to adjust for normal leniency in OR scheduling (15 minutes for first start and 90 minutes for turnover, which is a standard for our single-institution perioperative center). Statistical analyses, including data aggregation, were performed using R, version 4.0.1 (R Foundation for Statistical Computing). Patients’ demographic and clinical characteristics were analyzed using an independent 2-sample t-test for interval variables and a chi-square test for categorical variables. Significance was defined as P < .05.
Results
First-Start Time
First-start time was analyzed in 426 pre-COVID-19, 357 peak-COVID-19, and 2304 post-peak-COVID-19 cases. The unadjusted mean delay length was significantly different between the time periods, but the magnitude of increase in minutes was immaterial (mean [SD] minutes, 6 [18] vs 10 [21] vs 8 [20], respectively; P = .004) (Table 1). 
The adjusted average delay length and proportion of cases delayed beyond the 15-minute threshold were not significantly different, but they have been slightly higher since the onset of COVID-19. The proportion of cases that have started early, as well as significantly early past a 15-minute threshold, have also trended down since the onset of the COVID-19 pandemic, but this difference was again not significant. The temporal relationship of first-start delay, both unadjusted and adjusted, from December 2019 to October 2021 is shown in Figure 1. The trend of increasing delay is loosely associated with the COVID-19 burden experienced by our hospital. The start of COVID-19 as well as both COVID-19 peaks have been associated with increased delays in our hospital. Unadjusted and (B) adjusted first-start delay in operating room efficiency relative to COVID-19 census.")
Turnover Time
Turnover time was assessed in 437 pre-COVID-19, 278 peak-restrictions, and 2411 post-peak-restrictions cases. Turnover time during peak restrictions was not significantly different from pre-COVID-19 (88 [100] vs 85 [95]) and has since remained relatively unchanged (83 [87], P = .78). A similar trend held for comparisons of proportion of cases with turnover time past 90 minutes and average times past the 90-minute threshold (Table 2). The temporal relationship between COVID-19 burden and turnover time, both unadjusted and adjusted, from December 2019 to October 2021 is shown in Figure 2. Both figures demonstrate a slight initial increase in turnover time delay at the start of COVID-19, which stabilized with little variation thereafter.

 Unadjusted and (B) adjusted turnover time in operating room efficiency relative to COVID-19 census.")
Discussion
We analyzed the OR efficiency metrics of first-start and turnover time during the 90-day period before COVID-19 (pre-COVID-19), the 90 days following Tennessee declaring a state of emergency (peak COVID-19), and the time following this period (post-COVID-19) for all neurosurgical and neuroendovascular cases at Vanderbilt University Medical Center (VUMC). We found a significant difference in unadjusted mean delay length in first-start time between the time periods, but the magnitude of increase in minutes was immaterial (mean [SD] minutes for pre-COVID-19, peak-COVID-19, and post-COVID-19: 6 [18] vs 10 [21] vs 8 [20], respectively; P = .004). No significant increase in turnover time between cases was found between these 3 time periods. Based on metrics from first-start delay and turnover time, our center was able to maintain OR efficiency before, during, and after peak COVID-19.
After the Centers for Disease Control and Prevention released guidelines recommending deferring elective procedures to conserve beds and PPE, VUMC made the decision to suspend all elective surgical procedures from March 18 to April 24, 2020. Prior research conducted during the COVID-19 pandemic has demonstrated more than 400 types of surgical procedures with negatively impacted outcomes when compared to surgical outcomes from the same time frame in 2018 and 2019.4 For more than 20 of these types of procedures, there was a significant association between procedure delay and adverse patient outcomes.4 Testing protocols for patients prior to surgery varied throughout the pandemic based on vaccination status and type of procedure. Before vaccines became widely available, all patients were required to obtain a PCR SARS-CoV-2 test within 48 to 72 hours of the scheduled procedure. If the patient’s procedure was urgent and testing was not feasible, the patient was treated as a SARS-CoV-2–positive patient, which required all health care workers involved in the case to wear gowns, gloves, surgical masks, and eye protection. Testing patients preoperatively likely helped to maintain OR efficiency since not all patients received test results prior to the scheduled procedure, leading to cancellations of cases and therefore more staff available for fewer cases.
After vaccines became widely available to the public, testing requirements for patients preoperatively were relaxed, and only patients who were not fully vaccinated or severely immunocompromised were required to test prior to procedures. However, approximately 40% of the population in Tennessee was fully vaccinated in 2021, which reflects the patient population of VUMC.5 This means that many patients who received care at VUMC were still tested prior to procedures.
Adopting adequate safety protocols was found to be key for OR efficiency during the COVID-19 pandemic since performing surgery increased the risk of infection for each health care worker in the OR.6 VUMC protocols identified procedures that required enhanced safety measures to prevent infection of health care workers and avoid staffing shortages, which would decrease OR efficiency. Protocols mandated that only anesthesia team members were allowed to be in the OR during intubation and extubation of patients, which could be one factor leading to increased delays and decreased efficiency for some institutions. Methods for neurosurgeons to decrease risk of infection in the OR include postponing all nonurgent cases, reappraising the necessity for general anesthesia and endotracheal intubation, considering alternative surgical approaches that avoid the respiratory tract, and limiting the use of aerosol-generating instruments.7,8 VUMC’s success in implementing these protocols likely explains why our center was able to maintain OR efficiency throughout the COVID-19 pandemic.
A study conducted by Andreata et al showed a significantly increased mean first-case delay and a nonsignificant increased turnover time in orthopedic surgeries in Northern Italy when comparing surgeries performed during the COVID-19 pandemic to those performed prior to COVID-19.2 Other studies have indicated a similar trend in decreased OR efficiency during COVID-19 in other areas around the world.9,10 These findings are not consistent with our own findings for neurosurgical and neuroendovascular surgeries at VUMC, and any change at our institution was relatively immaterial. Factors that threatened to change OR efficiency—but did not result in meaningful changes in our institutional experience—include delays due to pending COVID-19 test results, safety procedures such as PPE donning, and planning difficulties to ensure the existence of teams with non-overlapping providers in the case of a surgeon being infected.2,11-13
Globally, many surgery centers halted all elective surgeries during the initial COVID-19 spike to prevent a PPE shortage and mitigate risk of infection of patients and health care workers.8,12,14 However, there is no centralized definition of which neurosurgical procedures are elective, so that decision was made on a surgeon or center level, which could lead to variability in efficiency trends.14 One study on neurosurgical procedures during COVID-19 found a 30% decline in all cases and a 23% decline in emergent procedures, showing that the decrease in volume was not only due to cancellation of elective procedures.15 This decrease in elective and emergent surgeries created a backlog of surgeries as well as a loss in health care revenue, and caused many patients to go without adequate health care.10 Looking forward, it is imperative that surgical centers study trends in OR efficiency from COVID-19 and learn how to better maintain OR efficiency during future pandemic conditions to prevent a backlog of cases, loss of health care revenue, and decreased health care access.
Limitations
Our data are from a single center and therefore may not be representative of experiences of other hospitals due to different populations and different impacts from COVID-19. However, given our center’s high volume and diverse patient population, we believe our analysis highlights important trends in neurosurgery practice. Notably, data for patient and OR timing are digitally generated and are entered manually by nurses in the electronic medical record, making it prone to errors and variability. This is in our experience, and if any error is present, we believe it is minimal.
Conclusion
The COVID-19 pandemic has had far-reaching effects on health care worldwide, including neurosurgical care. OR efficiency across the United States generally worsened given the stresses of supply chain issues, staffing shortages, and cancellations. At our institution, we were able to maintain OR efficiency during the known COVID-19 peaks until October 2021. Continually functional neurosurgical ORs are important in preventing delays in care and maintaining a steady revenue in order for hospitals and other health care entities to remain solvent. Further study of OR efficiency is needed for health care systems to prepare for future pandemics and other resource-straining events in order to provide optimal patient care.
Corresponding author: Campbell Liles, MD, Vanderbilt University Medical Center, Department of Neurological Surgery, 1161 21st Ave. South, T4224 Medical Center North, Nashville, TN 37232-2380; [email protected]
Disclosures: None reported.
1. Koester SW, Catapano JS, Ma KL, et al. COVID-19 and neurosurgery consultation call volume at a single large tertiary center with a propensity- adjusted analysis. World Neurosurg. 2021;146:e768-e772. doi:10.1016/j.wneu.2020.11.017
2. Andreata M, Faraldi M, Bucci E, Lombardi G, Zagra L. Operating room efficiency and timing during coronavirus disease 2019 outbreak in a referral orthopaedic hospital in Northern Italy. Int Orthop. 2020;44(12):2499-2504. doi:10.1007/s00264-020-04772-x
3. Dexter F, Abouleish AE, Epstein RH, et al. Use of operating room information system data to predict the impact of reducing turnover times on staffing costs. Anesth Analg. 2003;97(4):1119-1126. doi:10.1213/01.ANE.0000082520.68800.79
4. Zheng NS, Warner JL, Osterman TJ, et al. A retrospective approach to evaluating potential adverse outcomes associated with delay of procedures for cardiovascular and cancer-related diagnoses in the context of COVID-19. J Biomed Inform. 2021;113:103657. doi:10.1016/j.jbi.2020.103657
5. Alcendor DJ. Targeting COVID-19 vaccine hesitancy in rural communities in Tennessee: implications for extending the COVID- 19 pandemic in the South. Vaccines (Basel). 2021;9(11):1279. doi:10.3390/vaccines9111279
6. Perrone G, Giuffrida M, Bellini V, et al. Operating room setup: how to improve health care professionals safety during pandemic COVID- 19: a quality improvement study. J Laparoendosc Adv Surg Tech A. 2021;31(1):85-89. doi:10.1089/lap.2020.0592
7. Iorio-Morin C, Hodaie M, Sarica C, et al. Letter: the risk of COVID-19 infection during neurosurgical procedures: a review of severe acute respiratory distress syndrome coronavirus 2 (SARS-CoV-2) modes of transmission and proposed neurosurgery-specific measures for mitigation. Neurosurgery. 2020;87(2):E178-E185. doi:10.1093/ neuros/nyaa157
8. Gupta P, Muthukumar N, Rajshekhar V, et al. Neurosurgery and neurology practices during the novel COVID-19 pandemic: a consensus statement from India. Neurol India. 2020;68(2):246-254. doi:10.4103/0028-3886.283130
9. Mercer ST, Agarwal R, Dayananda KSS, et al. A comparative study looking at trauma and orthopaedic operating efficiency in the COVID-19 era. Perioper Care Oper Room Manag. 2020;21:100142. doi:10.1016/j.pcorm.2020.100142
10. Rozario N, Rozario D. Can machine learning optimize the efficiency of the operating room in the era of COVID-19? Can J Surg. 2020;63(6):E527-E529. doi:10.1503/cjs.016520
11. Toh KHQ, Barazanchi A, Rajaretnam NS, et al. COVID-19 response by New Zealand general surgical departments in tertiary metropolitan hospitals. ANZ J Surg. 2021;91(7-8):1352-1357. doi:10.1111/ ans.17044
12. Moorthy RK, Rajshekhar V. Impact of COVID-19 pandemic on neurosurgical practice in India: a survey on personal protective equipment usage, testing, and perceptions on disease transmission. Neurol India. 2020;68(5):1133-1138. doi:10.4103/0028- 3886.299173
13. Meneghini RM. Techniques and strategies to optimize efficiencies in the office and operating room: getting through the patient backlog and preserving hospital resources. J Arthroplasty. 2021;36(7S):S49-S51. doi:10.1016/j.arth.2021.03.010
14. Jean WC, Ironside NT, Sack KD, et al. The impact of COVID- 19 on neurosurgeons and the strategy for triaging non-emergent operations: a global neurosurgery study. Acta Neurochir (Wien). 2020;162(6):1229-1240. doi:10.1007/s00701-020- 04342-5
15. Raneri F, Rustemi O, Zambon G, et al. Neurosurgery in times of a pandemic: a survey of neurosurgical services during the COVID-19 outbreak in the Veneto region in Italy. Neurosurg Focus. 2020;49(6):E9. doi:10.3171/2020.9.FOCUS20691
From the Department of Neurological Surgery, Vanderbilt University Medical Center, Nashville, TN (Stefan W. Koester, Puja Jagasia, and Drs. Liles, Dambrino IV, Feldman, and Chambless), and the Department of Anesthesiology, Vanderbilt University Medical Center, Nashville, TN (Drs. Mathews and Tiwari).
ABSTRACT
Background: The COVID-19 pandemic has had broad effects on surgical care, including operating room (OR) staffing, personal protective equipment (PPE) utilization, and newly implemented anti-infective measures. Our aim was to assess neurosurgery OR efficiency before the COVID-19 pandemic, during peak COVID-19, and during current times.
Methods: Institutional perioperative databases at a single, high-volume neurosurgical center were queried for operations performed from December 2019 until October 2021. March 12, 2020, the day that the state of Tennessee declared a state of emergency, was chosen as the onset of the COVID-19 pandemic. The 90-day periods before and after this day were used to define the pre-COVID-19, peak-COVID-19, and post-peak restrictions time periods for comparative analysis. Outcomes included delay in first-start and OR turnover time between neurosurgical cases. Preset threshold times were used in analyses to adjust for normal leniency in OR scheduling (15 minutes for first start and 90 minutes for turnover). Univariate analysis used Wilcoxon rank-sum test for continuous outcomes, while chi-square test and Fisher’s exact test were used for categorical comparisons. Significance was defined as P < .05.
Results: First-start time was analyzed in 426 pre-COVID-19, 357 peak-restrictions, and 2304 post-peak-restrictions cases. The unadjusted mean delay length was found to be significantly different between the time periods, but the magnitude of increase in minutes was immaterial (mean [SD] minutes, 6 [18] vs 10 [21] vs 8 [20], respectively; P = .004). The adjusted average delay length and proportion of cases delayed beyond the 15-minute threshold were not significantly different. The proportion of cases that started early, as well as significantly early past a 15-minute threshold, have not been impacted. There was no significant change in turnover time during peak restrictions relative to the pre-COVID-19 period (88 [100] minutes vs 85 [95] minutes), and turnover time has since remained unchanged (83 [87] minutes).
Conclusion: Our center was able to maintain OR efficiency before, during, and after peak restrictions even while instituting advanced infection-control strategies. While there were significant changes, delays were relatively small in magnitude.
Keywords: operating room timing, hospital efficiency, socioeconomics, pandemic.
The COVID-19 pandemic has led to major changes in patient care both from a surgical perspective and in regard to inpatient hospital course. Safety protocols nationwide have been implemented to protect both patients and providers. Some elements of surgical care have drastically changed, including operating room (OR) staffing, personal protective equipment (PPE) utilization, and increased sterilization measures. Furloughs, layoffs, and reassignments due to the focus on nonelective and COVID-19–related cases challenged OR staffing and efficiency. Operating room staff with COVID-19 exposures or COVID-19 infections also caused last-minute changes in staffing. All of these scenarios can cause issues due to actual understaffing or due to staff members being pushed into highly specialized areas, such as neurosurgery, in which they have very little experience. A further obstacle to OR efficiency included policy changes involving PPE utilization, sterilization measures, and supply chain shortages of necessary resources such as PPE.
Neurosurgery in particular has been susceptible to COVID-19–related system-wide changes given operator proximity to the patient’s respiratory passages, frequency of emergent cases, and varying anesthetic needs, as well as the high level of specialization needed to perform neurosurgical care. Previous studies have shown a change in the makeup of neurosurgical patients seeking care, as well as in the acuity of neurological consult of these patients.1 A study in orthopedic surgery by Andreata et al demonstrated worsened OR efficiency, with significantly increased first-start and turnover times.2 In the COVID-19 era, OR quality and safety are crucially important to both patients and providers. Providing this safe and effective care in an efficient manner is important for optimal neurosurgical management in the long term.3 Moreover, the financial burden of implementing new protocols and standards can be compounded by additional financial losses due to reduced OR efficiency.
Methods
To analyze the effect of COVID-19 on neurosurgical OR efficiency, institutional perioperative databases at a single high-volume center were queried for operations performed from December 2019 until October 2021. March 12, 2020, was chosen as the onset of COVID-19 for analytic purposes, as this was the date when the state of Tennessee declared a state of emergency. The 90-day periods before and after this date were used for comparative analysis for pre-COVID-19, peak COVID-19, and post-peak-restrictions time periods. The peak COVID-19 period was defined as the 90-day period following the initial onset of COVID-19 and the surge of cases. For comparison purposes, post-peak COVID-19 was defined as the months following the first peak until October 2021 (approximately 17 months). COVID-19 burden was determined using a COVID-19 single-institution census of confirmed cases by polymerase chain reaction (PCR) for which the average number of cases of COVID-19 during a given month was determined. This number is a scaled trend, and a true number of COVID-19 cases in our hospital was not reported.
Neurosurgical and neuroendovascular cases were included in the analysis. Outcomes included delay in first-start and OR turnover time between neurosurgical cases, defined as the time from the patient leaving the room until the next patient entered the room. Preset threshold times were used in analyses to adjust for normal leniency in OR scheduling (15 minutes for first start and 90 minutes for turnover, which is a standard for our single-institution perioperative center). Statistical analyses, including data aggregation, were performed using R, version 4.0.1 (R Foundation for Statistical Computing). Patients’ demographic and clinical characteristics were analyzed using an independent 2-sample t-test for interval variables and a chi-square test for categorical variables. Significance was defined as P < .05.
Results
First-Start Time
First-start time was analyzed in 426 pre-COVID-19, 357 peak-COVID-19, and 2304 post-peak-COVID-19 cases. The unadjusted mean delay length was significantly different between the time periods, but the magnitude of increase in minutes was immaterial (mean [SD] minutes, 6 [18] vs 10 [21] vs 8 [20], respectively; P = .004) (Table 1).
The adjusted average delay length and proportion of cases delayed beyond the 15-minute threshold were not significantly different, but they have been slightly higher since the onset of COVID-19. The proportion of cases that have started early, as well as significantly early past a 15-minute threshold, have also trended down since the onset of the COVID-19 pandemic, but this difference was again not significant. The temporal relationship of first-start delay, both unadjusted and adjusted, from December 2019 to October 2021 is shown in Figure 1. The trend of increasing delay is loosely associated with the COVID-19 burden experienced by our hospital. The start of COVID-19 as well as both COVID-19 peaks have been associated with increased delays in our hospital.
Turnover Time
Turnover time was assessed in 437 pre-COVID-19, 278 peak-restrictions, and 2411 post-peak-restrictions cases. Turnover time during peak restrictions was not significantly different from pre-COVID-19 (88 [100] vs 85 [95]) and has since remained relatively unchanged (83 [87], P = .78). A similar trend held for comparisons of proportion of cases with turnover time past 90 minutes and average times past the 90-minute threshold (Table 2). The temporal relationship between COVID-19 burden and turnover time, both unadjusted and adjusted, from December 2019 to October 2021 is shown in Figure 2. Both figures demonstrate a slight initial increase in turnover time delay at the start of COVID-19, which stabilized with little variation thereafter.
Discussion
We analyzed the OR efficiency metrics of first-start and turnover time during the 90-day period before COVID-19 (pre-COVID-19), the 90 days following Tennessee declaring a state of emergency (peak COVID-19), and the time following this period (post-COVID-19) for all neurosurgical and neuroendovascular cases at Vanderbilt University Medical Center (VUMC). We found a significant difference in unadjusted mean delay length in first-start time between the time periods, but the magnitude of increase in minutes was immaterial (mean [SD] minutes for pre-COVID-19, peak-COVID-19, and post-COVID-19: 6 [18] vs 10 [21] vs 8 [20], respectively; P = .004). No significant increase in turnover time between cases was found between these 3 time periods. Based on metrics from first-start delay and turnover time, our center was able to maintain OR efficiency before, during, and after peak COVID-19.
After the Centers for Disease Control and Prevention released guidelines recommending deferring elective procedures to conserve beds and PPE, VUMC made the decision to suspend all elective surgical procedures from March 18 to April 24, 2020. Prior research conducted during the COVID-19 pandemic has demonstrated more than 400 types of surgical procedures with negatively impacted outcomes when compared to surgical outcomes from the same time frame in 2018 and 2019.4 For more than 20 of these types of procedures, there was a significant association between procedure delay and adverse patient outcomes.4 Testing protocols for patients prior to surgery varied throughout the pandemic based on vaccination status and type of procedure. Before vaccines became widely available, all patients were required to obtain a PCR SARS-CoV-2 test within 48 to 72 hours of the scheduled procedure. If the patient’s procedure was urgent and testing was not feasible, the patient was treated as a SARS-CoV-2–positive patient, which required all health care workers involved in the case to wear gowns, gloves, surgical masks, and eye protection. Testing patients preoperatively likely helped to maintain OR efficiency since not all patients received test results prior to the scheduled procedure, leading to cancellations of cases and therefore more staff available for fewer cases.
After vaccines became widely available to the public, testing requirements for patients preoperatively were relaxed, and only patients who were not fully vaccinated or severely immunocompromised were required to test prior to procedures. However, approximately 40% of the population in Tennessee was fully vaccinated in 2021, which reflects the patient population of VUMC.5 This means that many patients who received care at VUMC were still tested prior to procedures.
Adopting adequate safety protocols was found to be key for OR efficiency during the COVID-19 pandemic since performing surgery increased the risk of infection for each health care worker in the OR.6 VUMC protocols identified procedures that required enhanced safety measures to prevent infection of health care workers and avoid staffing shortages, which would decrease OR efficiency. Protocols mandated that only anesthesia team members were allowed to be in the OR during intubation and extubation of patients, which could be one factor leading to increased delays and decreased efficiency for some institutions. Methods for neurosurgeons to decrease risk of infection in the OR include postponing all nonurgent cases, reappraising the necessity for general anesthesia and endotracheal intubation, considering alternative surgical approaches that avoid the respiratory tract, and limiting the use of aerosol-generating instruments.7,8 VUMC’s success in implementing these protocols likely explains why our center was able to maintain OR efficiency throughout the COVID-19 pandemic.
A study conducted by Andreata et al showed a significantly increased mean first-case delay and a nonsignificant increased turnover time in orthopedic surgeries in Northern Italy when comparing surgeries performed during the COVID-19 pandemic to those performed prior to COVID-19.2 Other studies have indicated a similar trend in decreased OR efficiency during COVID-19 in other areas around the world.9,10 These findings are not consistent with our own findings for neurosurgical and neuroendovascular surgeries at VUMC, and any change at our institution was relatively immaterial. Factors that threatened to change OR efficiency—but did not result in meaningful changes in our institutional experience—include delays due to pending COVID-19 test results, safety procedures such as PPE donning, and planning difficulties to ensure the existence of teams with non-overlapping providers in the case of a surgeon being infected.2,11-13
Globally, many surgery centers halted all elective surgeries during the initial COVID-19 spike to prevent a PPE shortage and mitigate risk of infection of patients and health care workers.8,12,14 However, there is no centralized definition of which neurosurgical procedures are elective, so that decision was made on a surgeon or center level, which could lead to variability in efficiency trends.14 One study on neurosurgical procedures during COVID-19 found a 30% decline in all cases and a 23% decline in emergent procedures, showing that the decrease in volume was not only due to cancellation of elective procedures.15 This decrease in elective and emergent surgeries created a backlog of surgeries as well as a loss in health care revenue, and caused many patients to go without adequate health care.10 Looking forward, it is imperative that surgical centers study trends in OR efficiency from COVID-19 and learn how to better maintain OR efficiency during future pandemic conditions to prevent a backlog of cases, loss of health care revenue, and decreased health care access.
Limitations
Our data are from a single center and therefore may not be representative of experiences of other hospitals due to different populations and different impacts from COVID-19. However, given our center’s high volume and diverse patient population, we believe our analysis highlights important trends in neurosurgery practice. Notably, data for patient and OR timing are digitally generated and are entered manually by nurses in the electronic medical record, making it prone to errors and variability. This is in our experience, and if any error is present, we believe it is minimal.
Conclusion
The COVID-19 pandemic has had far-reaching effects on health care worldwide, including neurosurgical care. OR efficiency across the United States generally worsened given the stresses of supply chain issues, staffing shortages, and cancellations. At our institution, we were able to maintain OR efficiency during the known COVID-19 peaks until October 2021. Continually functional neurosurgical ORs are important in preventing delays in care and maintaining a steady revenue in order for hospitals and other health care entities to remain solvent. Further study of OR efficiency is needed for health care systems to prepare for future pandemics and other resource-straining events in order to provide optimal patient care.
Corresponding author: Campbell Liles, MD, Vanderbilt University Medical Center, Department of Neurological Surgery, 1161 21st Ave. South, T4224 Medical Center North, Nashville, TN 37232-2380; [email protected]
Disclosures: None reported.
1. Koester SW, Catapano JS, Ma KL, et al. COVID-19 and neurosurgery consultation call volume at a single large tertiary center with a propensity- adjusted analysis. World Neurosurg. 2021;146:e768-e772. doi:10.1016/j.wneu.2020.11.017
2. Andreata M, Faraldi M, Bucci E, Lombardi G, Zagra L. Operating room efficiency and timing during coronavirus disease 2019 outbreak in a referral orthopaedic hospital in Northern Italy. Int Orthop. 2020;44(12):2499-2504. doi:10.1007/s00264-020-04772-x
3. Dexter F, Abouleish AE, Epstein RH, et al. Use of operating room information system data to predict the impact of reducing turnover times on staffing costs. Anesth Analg. 2003;97(4):1119-1126. doi:10.1213/01.ANE.0000082520.68800.79
4. Zheng NS, Warner JL, Osterman TJ, et al. A retrospective approach to evaluating potential adverse outcomes associated with delay of procedures for cardiovascular and cancer-related diagnoses in the context of COVID-19. J Biomed Inform. 2021;113:103657. doi:10.1016/j.jbi.2020.103657
5. Alcendor DJ. Targeting COVID-19 vaccine hesitancy in rural communities in Tennessee: implications for extending the COVID- 19 pandemic in the South. Vaccines (Basel). 2021;9(11):1279. doi:10.3390/vaccines9111279
6. Perrone G, Giuffrida M, Bellini V, et al. Operating room setup: how to improve health care professionals safety during pandemic COVID- 19: a quality improvement study. J Laparoendosc Adv Surg Tech A. 2021;31(1):85-89. doi:10.1089/lap.2020.0592
7. Iorio-Morin C, Hodaie M, Sarica C, et al. Letter: the risk of COVID-19 infection during neurosurgical procedures: a review of severe acute respiratory distress syndrome coronavirus 2 (SARS-CoV-2) modes of transmission and proposed neurosurgery-specific measures for mitigation. Neurosurgery. 2020;87(2):E178-E185. doi:10.1093/ neuros/nyaa157
8. Gupta P, Muthukumar N, Rajshekhar V, et al. Neurosurgery and neurology practices during the novel COVID-19 pandemic: a consensus statement from India. Neurol India. 2020;68(2):246-254. doi:10.4103/0028-3886.283130
9. Mercer ST, Agarwal R, Dayananda KSS, et al. A comparative study looking at trauma and orthopaedic operating efficiency in the COVID-19 era. Perioper Care Oper Room Manag. 2020;21:100142. doi:10.1016/j.pcorm.2020.100142
10. Rozario N, Rozario D. Can machine learning optimize the efficiency of the operating room in the era of COVID-19? Can J Surg. 2020;63(6):E527-E529. doi:10.1503/cjs.016520
11. Toh KHQ, Barazanchi A, Rajaretnam NS, et al. COVID-19 response by New Zealand general surgical departments in tertiary metropolitan hospitals. ANZ J Surg. 2021;91(7-8):1352-1357. doi:10.1111/ ans.17044
12. Moorthy RK, Rajshekhar V. Impact of COVID-19 pandemic on neurosurgical practice in India: a survey on personal protective equipment usage, testing, and perceptions on disease transmission. Neurol India. 2020;68(5):1133-1138. doi:10.4103/0028- 3886.299173
13. Meneghini RM. Techniques and strategies to optimize efficiencies in the office and operating room: getting through the patient backlog and preserving hospital resources. J Arthroplasty. 2021;36(7S):S49-S51. doi:10.1016/j.arth.2021.03.010
14. Jean WC, Ironside NT, Sack KD, et al. The impact of COVID- 19 on neurosurgeons and the strategy for triaging non-emergent operations: a global neurosurgery study. Acta Neurochir (Wien). 2020;162(6):1229-1240. doi:10.1007/s00701-020- 04342-5
15. Raneri F, Rustemi O, Zambon G, et al. Neurosurgery in times of a pandemic: a survey of neurosurgical services during the COVID-19 outbreak in the Veneto region in Italy. Neurosurg Focus. 2020;49(6):E9. doi:10.3171/2020.9.FOCUS20691

Best Practice Implementation and Clinical Inertia
From the Department of Medicine, Brigham and Women’s Hospital, and Harvard Medical School, Boston, MA.
Clinical inertia is defined as the failure of clinicians to initiate or escalate guideline-directed medical therapy to achieve treatment goals for well-defined clinical conditions.1,2 Evidence-based guidelines recommend optimal disease management with readily available medical therapies throughout the phases of clinical care. Unfortunately, the care provided to individual patients undergoes multiple modifications throughout the disease course, resulting in divergent pathways, significant deviations from treatment guidelines, and failure of “safeguard” checkpoints to reinstate, initiate, optimize, or stop treatments. Clinical inertia generally describes rigidity or resistance to change around implementing evidence-based guidelines. Furthermore, this term describes treatment behavior on the part of an individual clinician, not organizational inertia, which generally encompasses both internal (immediate clinical practice settings) and external factors (national and international guidelines and recommendations), eventually leading to resistance to optimizing disease treatment and therapeutic regimens. Individual clinicians’ clinical inertia in the form of resistance to guideline implementation and evidence-based principles can be one factor that drives organizational inertia. In turn, such individual behavior can be dictated by personal beliefs, knowledge, interpretation, skills, management principles, and biases. The terms therapeutic inertia or clinical inertia should not be confused with nonadherence from the patient’s standpoint when the clinician follows the best practice guidelines.3
Clinical inertia has been described in several clinical domains, including diabetes,4,5 hypertension,6,7 heart failure,8 depression,9 pulmonary medicine,10 and complex disease management.11 Clinicians can set suboptimal treatment goals due to specific beliefs and attitudes around optimal therapeutic goals. For example, when treating a patient with a chronic disease that is presently stable, a clinician could elect to initiate suboptimal treatment, as escalation of treatment might not be the priority in stable disease; they also may have concerns about overtreatment. Other factors that can contribute to clinical inertia (ie, undertreatment in the presence of indications for treatment) include those related to the patient, the clinical setting, and the organization, along with the importance of individualizing therapies in specific patients. Organizational inertia is the initial global resistance by the system to implementation, which can slow the dissemination and adaptation of best practices but eventually declines over time. Individual clinical inertia, on the other hand, will likely persist after the system-level rollout of guideline-based approaches.
The trajectory of dissemination, implementation, and adaptation of innovations and best practices is illustrated in the Figure. When the guidelines and medical societies endorse the adaptation of innovations or practice change after the benefits of such innovations/change have been established by the regulatory bodies, uptake can be hindered by both organizational and clinical inertia. Overcoming inertia to system-level changes requires addressing individual clinicians, along with practice and organizational factors, in order to ensure systematic adaptations. From the clinicians’ view, training and cognitive interventions to improve the adaptation and coping skills can improve understanding of treatment options through standardized educational and behavioral modification tools, direct and indirect feedback around performance, and decision support through a continuous improvement approach on both individual and system levels.

Addressing inertia in clinical practice requires a deep understanding of the individual and organizational elements that foster resistance to adapting best practice models. Research that explores tools and approaches to overcome inertia in managing complex diseases is a key step in advancing clinical innovation and disseminating best practices.
Corresponding author: Ebrahim Barkoudah, MD, MPH; [email protected]
Disclosures: None reported.
1. Phillips LS, Branch WT, Cook CB, et al. Clinical inertia. Ann Intern Med. 2001;135(9):825-834. doi:10.7326/0003-4819-135-9-200111060-00012
2. Allen JD, Curtiss FR, Fairman KA. Nonadherence, clinical inertia, or therapeutic inertia? J Manag Care Pharm. 2009;15(8):690-695. doi:10.18553/jmcp.2009.15.8.690
3. Zafar A, Davies M, Azhar A, Khunti K. Clinical inertia in management of T2DM. Prim Care Diabetes. 2010;4(4):203-207. doi:10.1016/j.pcd.2010.07.003
4. Khunti K, Davies MJ. Clinical inertia—time to reappraise the terminology? Prim Care Diabetes. 2017;11(2):105-106. doi:10.1016/j.pcd.2017.01.007
5. O’Connor PJ. Overcome clinical inertia to control systolic blood pressure. Arch Intern Med. 2003;163(22):2677-2678. doi:10.1001/archinte.163.22.2677
6. Faria C, Wenzel M, Lee KW, et al. A narrative review of clinical inertia: focus on hypertension. J Am Soc Hypertens. 2009;3(4):267-276. doi:10.1016/j.jash.2009.03.001
7. Jarjour M, Henri C, de Denus S, et al. Care gaps in adherence to heart failure guidelines: clinical inertia or physiological limitations? JACC Heart Fail. 2020;8(9):725-738. doi:10.1016/j.jchf.2020.04.019
8. Henke RM, Zaslavsky AM, McGuire TG, et al. Clinical inertia in depression treatment. Med Care. 2009;47(9):959-67. doi:10.1097/MLR.0b013e31819a5da0
9. Cooke CE, Sidel M, Belletti DA, Fuhlbrigge AL. Clinical inertia in the management of chronic obstructive pulmonary disease. COPD. 2012;9(1):73-80. doi:10.3109/15412555.2011.631957
10. Whitford DL, Al-Anjawi HA, Al-Baharna MM. Impact of clinical inertia on cardiovascular risk factors in patients with diabetes. Prim Care Diabetes. 2014;8(2):133-138. doi:10.1016/j.pcd.2013.10.007
From the Department of Medicine, Brigham and Women’s Hospital, and Harvard Medical School, Boston, MA.
Clinical inertia is defined as the failure of clinicians to initiate or escalate guideline-directed medical therapy to achieve treatment goals for well-defined clinical conditions.1,2 Evidence-based guidelines recommend optimal disease management with readily available medical therapies throughout the phases of clinical care. Unfortunately, the care provided to individual patients undergoes multiple modifications throughout the disease course, resulting in divergent pathways, significant deviations from treatment guidelines, and failure of “safeguard” checkpoints to reinstate, initiate, optimize, or stop treatments. Clinical inertia generally describes rigidity or resistance to change around implementing evidence-based guidelines. Furthermore, this term describes treatment behavior on the part of an individual clinician, not organizational inertia, which generally encompasses both internal (immediate clinical practice settings) and external factors (national and international guidelines and recommendations), eventually leading to resistance to optimizing disease treatment and therapeutic regimens. Individual clinicians’ clinical inertia in the form of resistance to guideline implementation and evidence-based principles can be one factor that drives organizational inertia. In turn, such individual behavior can be dictated by personal beliefs, knowledge, interpretation, skills, management principles, and biases. The terms therapeutic inertia or clinical inertia should not be confused with nonadherence from the patient’s standpoint when the clinician follows the best practice guidelines.3
Clinical inertia has been described in several clinical domains, including diabetes,4,5 hypertension,6,7 heart failure,8 depression,9 pulmonary medicine,10 and complex disease management.11 Clinicians can set suboptimal treatment goals due to specific beliefs and attitudes around optimal therapeutic goals. For example, when treating a patient with a chronic disease that is presently stable, a clinician could elect to initiate suboptimal treatment, as escalation of treatment might not be the priority in stable disease; they also may have concerns about overtreatment. Other factors that can contribute to clinical inertia (ie, undertreatment in the presence of indications for treatment) include those related to the patient, the clinical setting, and the organization, along with the importance of individualizing therapies in specific patients. Organizational inertia is the initial global resistance by the system to implementation, which can slow the dissemination and adaptation of best practices but eventually declines over time. Individual clinical inertia, on the other hand, will likely persist after the system-level rollout of guideline-based approaches.
The trajectory of dissemination, implementation, and adaptation of innovations and best practices is illustrated in the Figure. When the guidelines and medical societies endorse the adaptation of innovations or practice change after the benefits of such innovations/change have been established by the regulatory bodies, uptake can be hindered by both organizational and clinical inertia. Overcoming inertia to system-level changes requires addressing individual clinicians, along with practice and organizational factors, in order to ensure systematic adaptations. From the clinicians’ view, training and cognitive interventions to improve the adaptation and coping skills can improve understanding of treatment options through standardized educational and behavioral modification tools, direct and indirect feedback around performance, and decision support through a continuous improvement approach on both individual and system levels.
Addressing inertia in clinical practice requires a deep understanding of the individual and organizational elements that foster resistance to adapting best practice models. Research that explores tools and approaches to overcome inertia in managing complex diseases is a key step in advancing clinical innovation and disseminating best practices.
Corresponding author: Ebrahim Barkoudah, MD, MPH; [email protected]
Disclosures: None reported.
1. Phillips LS, Branch WT, Cook CB, et al. Clinical inertia. Ann Intern Med. 2001;135(9):825-834. doi:10.7326/0003-4819-135-9-200111060-00012
2. Allen JD, Curtiss FR, Fairman KA. Nonadherence, clinical inertia, or therapeutic inertia? J Manag Care Pharm. 2009;15(8):690-695. doi:10.18553/jmcp.2009.15.8.690
3. Zafar A, Davies M, Azhar A, Khunti K. Clinical inertia in management of T2DM. Prim Care Diabetes. 2010;4(4):203-207. doi:10.1016/j.pcd.2010.07.003
4. Khunti K, Davies MJ. Clinical inertia—time to reappraise the terminology? Prim Care Diabetes. 2017;11(2):105-106. doi:10.1016/j.pcd.2017.01.007
5. O’Connor PJ. Overcome clinical inertia to control systolic blood pressure. Arch Intern Med. 2003;163(22):2677-2678. doi:10.1001/archinte.163.22.2677
6. Faria C, Wenzel M, Lee KW, et al. A narrative review of clinical inertia: focus on hypertension. J Am Soc Hypertens. 2009;3(4):267-276. doi:10.1016/j.jash.2009.03.001
7. Jarjour M, Henri C, de Denus S, et al. Care gaps in adherence to heart failure guidelines: clinical inertia or physiological limitations? JACC Heart Fail. 2020;8(9):725-738. doi:10.1016/j.jchf.2020.04.019
8. Henke RM, Zaslavsky AM, McGuire TG, et al. Clinical inertia in depression treatment. Med Care. 2009;47(9):959-67. doi:10.1097/MLR.0b013e31819a5da0
9. Cooke CE, Sidel M, Belletti DA, Fuhlbrigge AL. Clinical inertia in the management of chronic obstructive pulmonary disease. COPD. 2012;9(1):73-80. doi:10.3109/15412555.2011.631957
10. Whitford DL, Al-Anjawi HA, Al-Baharna MM. Impact of clinical inertia on cardiovascular risk factors in patients with diabetes. Prim Care Diabetes. 2014;8(2):133-138. doi:10.1016/j.pcd.2013.10.007
The Role of Revascularization and Viability Testing in Patients With Multivessel Coronary Artery Disease and Severely Reduced Ejection Fraction
Study 1 Overview (STICHES Investigators)
Objective: To assess the survival benefit of coronary-artery bypass grafting (CABG) added to guideline-directed medical therapy, compared to optimal medical therapy (OMT) alone, in patients with coronary artery disease, heart failure, and severe left ventricular dysfunction. Design: Multicenter, randomized, prospective study with extended follow-up (median duration of 9.8 years).
Setting and participants: A total of 1212 patients with left ventricular ejection fraction (LVEF) of 35% or less and coronary artery disease were randomized to medical therapy plus CABG or OMT alone at 127 clinical sites in 26 countries.
Main outcome measures: The primary endpoint was death from any cause. Main secondary endpoints were death from cardiovascular causes and a composite outcome of death from any cause or hospitalization for cardiovascular causes.
Main results: There were 359 primary outcome all-cause deaths (58.9%) in the CABG group and 398 (66.1%) in the medical therapy group (hazard ratio [HR], 0.84; 95% CI, 0.73-0.97; P = .02). Death from cardiovascular causes was reported in 247 patients (40.5%) in the CABG group and 297 patients (49.3%) in the medical therapy group (HR, 0.79; 95% CI, 0.66-0.93; P < .01). The composite outcome of death from any cause or hospitalization for cardiovascular causes occurred in 467 patients (76.6%) in the CABG group and 467 patients (87.0%) in the medical therapy group (HR, 0.72; 95% CI, 0.64-0.82; P < .01).
Conclusion: Over a median follow-up of 9.8 years in patients with ischemic cardiomyopathy with severely reduced ejection fraction, the rates of death from any cause, death from cardiovascular causes, and the composite of death from any cause or hospitalization for cardiovascular causes were significantly lower in patients undergoing CABG than in patients receiving medical therapy alone.
Study 2 Overview (REVIVED BCIS Trial Group)
Objective: To assess whether percutaneous coronary intervention (PCI) can improve survival and left ventricular function in patients with severe left ventricular systolic dysfunction as compared to OMT alone.
Design: Multicenter, randomized, prospective study.
Setting and participants: A total of 700 patients with LVEF <35% with severe coronary artery disease amendable to PCI and demonstrable myocardial viability were randomly assigned to either PCI plus optimal medical therapy (PCI group) or OMT alone (OMT group).
Main outcome measures: The primary outcome was death from any cause or hospitalization for heart failure. The main secondary outcomes were LVEF at 6 and 12 months and quality of life (QOL) scores.
Main results: Over a median follow-up of 41 months, the primary outcome was reported in 129 patients (37.2%) in the PCI group and in 134 patients (38.0%) in the OMT group (HR, 0.99; 95% CI, 0.78-1.27; P = .96). The LVEF was similar in the 2 groups at 6 months (mean difference, –1.6 percentage points; 95% CI, –3.7 to 0.5) and at 12 months (mean difference, 0.9 percentage points; 95% CI, –1.7 to 3.4). QOL scores at 6 and 12 months favored the PCI group, but the difference had diminished at 24 months.
Conclusion: In patients with severe ischemic cardiomyopathy, revascularization by PCI in addition to OMT did not result in a lower incidence of death from any cause or hospitalization from heart failure.
Commentary
Coronary artery disease is the most common cause of heart failure with reduced ejection fraction and an important cause of mortality.1 Patients with ischemic cardiomyopathy with reduced ejection fraction are often considered for revascularization in addition to OMT and device therapies. Although there have been multiple retrospective studies and registries suggesting that cardiac outcomes and LVEF improve with revascularization, the number of large-scale prospective studies that assessed this clinical question and randomized patients to revascularization plus OMT compared to OMT alone has been limited.
In the Surgical Treatment for Ischemic Heart Failure (STICH) study,2,3 eligible patients had coronary artery disease amendable to CABG and a LVEF of 35% or less. Patients (N = 1212) were randomly assigned to CABG plus OMT or OMT alone between July 2002 and May 2007. The original study, with a median follow-up of 5 years, did not show survival benefit, but the investigators reported that the primary outcome of death from any cause was significantly lower in the CABG group compared to OMT alone when follow-up of the same study population was extended to 9.8 years (58.9% vs 66.1%, P = .02). The findings from this study led to a class I guideline recommendation of CABG over medical therapy in patients with multivessel disease and low ejection fraction.4
Since the STICH trial was designed, there have been significant improvements in devices and techniques used for PCI, and the procedure is now widely performed in patients with multivessel disease.5 The advantages of PCI over CABG include shorter recovery times and lower risk of immediate complications. In this context, the recently reported Revascularization for Ischemic Ventricular Dysfunction (REVIVED) study assessed clinical outcomes in patients with severe coronary artery disease and reduced ejection fraction by randomizing patients to either PCI with OMT or OMT alone.6 At a median follow-up of 3.5 years, the investigators found no difference in the primary outcome of death from any cause or hospitalization for heart failure (37.2% vs 38.0%; 95% CI, 0.78-1.28; P = .96). Moreover, the degree of LVEF improvement, assessed by follow-up echocardiogram read by the core lab, showed no difference in the degree of LVEF improvement between groups at 6 and 12 months. Finally, although results of the QOL assessment using the Kansas City Cardiomyopathy Questionnaire (KCCQ), a validated, patient-reported, heart-failure-specific QOL scale, favored the PCI group at 6 and 12 months of follow-up, the difference had diminished at 24 months.
The main strength of the REVIVED study was that it targeted a patient population with severe coronary artery disease, including left main disease and severely reduced ejection fraction, that historically have been excluded from large-scale randomized controlled studies evaluating PCI with OMT compared to OMT alone.7 However, there are several points to consider when interpreting the results of this study. First, further details of the PCI procedures are necessary. The REVIVED study recommended revascularization of all territories with viable myocardium; the anatomical revascularization index utilizing the British Cardiovascular Intervention Society (BCIS) Jeopardy Score was 71%. It is important to note that this jeopardy score was operator-reported and the core-lab adjudicated anatomical revascularization rate may be lower. Although viability testing primarily utilizing cardiac magnetic resonance imaging was performed in most patients, correlation between the revascularization territory and the viable segments has yet to be reported. Moreover, procedural details such as use of intravascular ultrasound and physiological testing, known to improve clinical outcome, need to be reported.8,9
Second, there is a high prevalence of ischemic cardiomyopathy, and it is important to note that the patients included in this study were highly selected from daily clinical practice, as evidenced by the prolonged enrollment period (8 years). Individuals were largely stable patients with less complex coronary anatomy as evidenced by the median interval from angiography to randomization of 80 days. Taking into consideration the degree of left ventricular dysfunction for patients included in the trial, only 14% of the patients had left main disease and half of the patients only had 2-vessel disease. The severity of the left main disease also needs to be clarified as it is likely that patients the operator determined to be critical were not enrolled in the study. Furthermore, the standard of care based on the STICH trial is to refer patients with severe multivessel coronary artery disease to CABG, making it more likely that patients with more severe and complex disease were not included in this trial. It is also important to note that this study enrolled patients with stable ischemic heart disease, and the data do not apply to patients presenting with acute coronary syndrome.
Third, although the primary outcome was similar between the groups, the secondary outcome of unplanned revascularization was lower in the PCI group. In addition, the rate of acute myocardial infarction (MI) was similar between the 2 groups, but the rate of spontaneous MI was lower in the PCI group compared to the OMT group (5.2% vs 9.3%) as 40% of MI cases in the PCI group were periprocedural MIs. The correlation between periprocedural MI and long-term outcomes has been modest compared to spontaneous MI. Moreover, with the longer follow-up, the number of spontaneous MI cases is expected to rise while the number of periprocedural MI cases is not. Extending the follow-up period is also important, as the STICH extension trial showed a statistically significant difference at 10-year follow up despite negative results at the time of the original publication.
Fourth, the REVIVED trial randomized a significantly lower number of patients compared to the STICH trial, and the authors reported fewer primary-outcome events than the estimated number needed to achieve the power to assess the primary hypothesis. In addition, significant improvements in medical treatment for heart failure with reduced ejection fraction since the STICH trial make comparison of PCI vs CABG in this patient population unfeasible.
Finally, although severe angina was not an exclusion criterion, two-thirds of the patients enrolled had no angina, and only 2% of the patients had baseline severe angina. This is important to consider when interpreting the results of the patient-reported health status as previous studies have shown that patients with worse angina at baseline derive the largest improvement in their QOL,10,11 and symptom improvement is the main indication for PCI in patients with stable ischemic heart disease.
Applications for Clinical Practice and System Implementation
In patients with severe left ventricular systolic dysfunction and multivessel stable ischemic heart disease who are well compensated and have little or no angina at baseline, OMT alone as an initial strategy may be considered against the addition of PCI after careful risk and benefit discussion. Further details about revascularization and extended follow-up data from the REVIVED trial are necessary.
Practice Points
- Patients with ischemic cardiomyopathy with reduced ejection fraction have been an understudied population in previous studies.
- Further studies are necessary to understand the benefits of revascularization and the role of viability testing in this population.
– Taishi Hirai MD, and Ziad Sayed Ahmad, MD
University of Missouri, Columbia, MO
1. Nowbar AN, Gitto M, Howard JP, et al. Mortality from ischemic heart disease. Circ Cardiovasc Qual Outcomes. 2019;12(6):e005375. doi:10.1161/CIRCOUTCOMES
2. Velazquez EJ, Lee KL, Deja MA, et al; for the STICH Investigators. Coronary-artery bypass surgery in patients with left ventricular dysfunction. N Engl J Med. 2011;364(17):1607-1616. doi:10.1056/NEJMoa1100356
3. Velazquez EJ, Lee KL, Jones RH, et al. Coronary-artery bypass surgery in patients with ischemic cardiomyopathy. N Engl J Med. 2016;374(16):1511-1520. doi:10.1056/NEJMoa1602001
4. Lawton JS, Tamis-Holland JE, Bangalore S, et al. 2021 ACC/AHA/SCAI guideline for coronary artery revascularization: a report of the American College of Cardiology/American Heart Association Joint Committee on Clinical Practice Guidelines. J Am Coll Cardiol. 2022;79(2):e21-e129. doi:10.1016/j.jacc.2021.09.006
5. Kirtane AJ, Doshi D, Leon MB, et al. Treatment of higher-risk patients with an indication for revascularization: evolution within the field of contemporary percutaneous coronary intervention. Circulation. 2016;134(5):422-431. doi:10.1161/CIRCULATIONAHA
6. Perera D, Clayton T, O’Kane PD, et al. Percutaneous revascularization for ischemic left ventricular dysfunction. N Engl J Med. 2022;387(15):1351-1360. doi:10.1056/NEJMoa2206606
7. Maron DJ, Hochman JS, Reynolds HR, et al. Initial invasive or conservative strategy for stable coronary disease. Circulation. 2020;142(18):1725-1735. doi:10.1161/CIRCULATIONAHA
8. De Bruyne B, Pijls NH, Kalesan B, et al. Fractional flow reserve-guided PCI versus medical therapy in stable coronary disease. N Engl J Med. 2012;367(11):991-1001. doi:10.1056/NEJMoa1205361
9. Zhang J, Gao X, Kan J, et al. Intravascular ultrasound versus angiography-guided drug-eluting stent implantation: The ULTIMATE trial. J Am Coll Cardiol. 2018;72(24):3126-3137. doi:10.1016/j.jacc.2018.09.013
10. Spertus JA, Jones PG, Maron DJ, et al. Health-status outcomes with invasive or conservative care in coronary disease. N Engl J Med. 2020;382(15):1408-1419. doi:10.1056/NEJMoa1916370
11. Hirai T, Grantham JA, Sapontis J, et al. Quality of life changes after chronic total occlusion angioplasty in patients with baseline refractory angina. Circ Cardiovasc Interv. 2019;12:e007558. doi:10.1161/CIRCINTERVENTIONS.118.007558
Study 1 Overview (STICHES Investigators)
Objective: To assess the survival benefit of coronary-artery bypass grafting (CABG) added to guideline-directed medical therapy, compared to optimal medical therapy (OMT) alone, in patients with coronary artery disease, heart failure, and severe left ventricular dysfunction. Design: Multicenter, randomized, prospective study with extended follow-up (median duration of 9.8 years).
Setting and participants: A total of 1212 patients with left ventricular ejection fraction (LVEF) of 35% or less and coronary artery disease were randomized to medical therapy plus CABG or OMT alone at 127 clinical sites in 26 countries.
Main outcome measures: The primary endpoint was death from any cause. Main secondary endpoints were death from cardiovascular causes and a composite outcome of death from any cause or hospitalization for cardiovascular causes.
Main results: There were 359 primary outcome all-cause deaths (58.9%) in the CABG group and 398 (66.1%) in the medical therapy group (hazard ratio [HR], 0.84; 95% CI, 0.73-0.97; P = .02). Death from cardiovascular causes was reported in 247 patients (40.5%) in the CABG group and 297 patients (49.3%) in the medical therapy group (HR, 0.79; 95% CI, 0.66-0.93; P < .01). The composite outcome of death from any cause or hospitalization for cardiovascular causes occurred in 467 patients (76.6%) in the CABG group and 467 patients (87.0%) in the medical therapy group (HR, 0.72; 95% CI, 0.64-0.82; P < .01).
Conclusion: Over a median follow-up of 9.8 years in patients with ischemic cardiomyopathy with severely reduced ejection fraction, the rates of death from any cause, death from cardiovascular causes, and the composite of death from any cause or hospitalization for cardiovascular causes were significantly lower in patients undergoing CABG than in patients receiving medical therapy alone.
Study 2 Overview (REVIVED BCIS Trial Group)
Objective: To assess whether percutaneous coronary intervention (PCI) can improve survival and left ventricular function in patients with severe left ventricular systolic dysfunction as compared to OMT alone.
Design: Multicenter, randomized, prospective study.
Setting and participants: A total of 700 patients with LVEF <35% with severe coronary artery disease amendable to PCI and demonstrable myocardial viability were randomly assigned to either PCI plus optimal medical therapy (PCI group) or OMT alone (OMT group).
Main outcome measures: The primary outcome was death from any cause or hospitalization for heart failure. The main secondary outcomes were LVEF at 6 and 12 months and quality of life (QOL) scores.
Main results: Over a median follow-up of 41 months, the primary outcome was reported in 129 patients (37.2%) in the PCI group and in 134 patients (38.0%) in the OMT group (HR, 0.99; 95% CI, 0.78-1.27; P = .96). The LVEF was similar in the 2 groups at 6 months (mean difference, –1.6 percentage points; 95% CI, –3.7 to 0.5) and at 12 months (mean difference, 0.9 percentage points; 95% CI, –1.7 to 3.4). QOL scores at 6 and 12 months favored the PCI group, but the difference had diminished at 24 months.
Conclusion: In patients with severe ischemic cardiomyopathy, revascularization by PCI in addition to OMT did not result in a lower incidence of death from any cause or hospitalization from heart failure.
Commentary
Coronary artery disease is the most common cause of heart failure with reduced ejection fraction and an important cause of mortality.1 Patients with ischemic cardiomyopathy with reduced ejection fraction are often considered for revascularization in addition to OMT and device therapies. Although there have been multiple retrospective studies and registries suggesting that cardiac outcomes and LVEF improve with revascularization, the number of large-scale prospective studies that assessed this clinical question and randomized patients to revascularization plus OMT compared to OMT alone has been limited.
In the Surgical Treatment for Ischemic Heart Failure (STICH) study,2,3 eligible patients had coronary artery disease amendable to CABG and a LVEF of 35% or less. Patients (N = 1212) were randomly assigned to CABG plus OMT or OMT alone between July 2002 and May 2007. The original study, with a median follow-up of 5 years, did not show survival benefit, but the investigators reported that the primary outcome of death from any cause was significantly lower in the CABG group compared to OMT alone when follow-up of the same study population was extended to 9.8 years (58.9% vs 66.1%, P = .02). The findings from this study led to a class I guideline recommendation of CABG over medical therapy in patients with multivessel disease and low ejection fraction.4
Since the STICH trial was designed, there have been significant improvements in devices and techniques used for PCI, and the procedure is now widely performed in patients with multivessel disease.5 The advantages of PCI over CABG include shorter recovery times and lower risk of immediate complications. In this context, the recently reported Revascularization for Ischemic Ventricular Dysfunction (REVIVED) study assessed clinical outcomes in patients with severe coronary artery disease and reduced ejection fraction by randomizing patients to either PCI with OMT or OMT alone.6 At a median follow-up of 3.5 years, the investigators found no difference in the primary outcome of death from any cause or hospitalization for heart failure (37.2% vs 38.0%; 95% CI, 0.78-1.28; P = .96). Moreover, the degree of LVEF improvement, assessed by follow-up echocardiogram read by the core lab, showed no difference in the degree of LVEF improvement between groups at 6 and 12 months. Finally, although results of the QOL assessment using the Kansas City Cardiomyopathy Questionnaire (KCCQ), a validated, patient-reported, heart-failure-specific QOL scale, favored the PCI group at 6 and 12 months of follow-up, the difference had diminished at 24 months.
The main strength of the REVIVED study was that it targeted a patient population with severe coronary artery disease, including left main disease and severely reduced ejection fraction, that historically have been excluded from large-scale randomized controlled studies evaluating PCI with OMT compared to OMT alone.7 However, there are several points to consider when interpreting the results of this study. First, further details of the PCI procedures are necessary. The REVIVED study recommended revascularization of all territories with viable myocardium; the anatomical revascularization index utilizing the British Cardiovascular Intervention Society (BCIS) Jeopardy Score was 71%. It is important to note that this jeopardy score was operator-reported and the core-lab adjudicated anatomical revascularization rate may be lower. Although viability testing primarily utilizing cardiac magnetic resonance imaging was performed in most patients, correlation between the revascularization territory and the viable segments has yet to be reported. Moreover, procedural details such as use of intravascular ultrasound and physiological testing, known to improve clinical outcome, need to be reported.8,9
Second, there is a high prevalence of ischemic cardiomyopathy, and it is important to note that the patients included in this study were highly selected from daily clinical practice, as evidenced by the prolonged enrollment period (8 years). Individuals were largely stable patients with less complex coronary anatomy as evidenced by the median interval from angiography to randomization of 80 days. Taking into consideration the degree of left ventricular dysfunction for patients included in the trial, only 14% of the patients had left main disease and half of the patients only had 2-vessel disease. The severity of the left main disease also needs to be clarified as it is likely that patients the operator determined to be critical were not enrolled in the study. Furthermore, the standard of care based on the STICH trial is to refer patients with severe multivessel coronary artery disease to CABG, making it more likely that patients with more severe and complex disease were not included in this trial. It is also important to note that this study enrolled patients with stable ischemic heart disease, and the data do not apply to patients presenting with acute coronary syndrome.
Third, although the primary outcome was similar between the groups, the secondary outcome of unplanned revascularization was lower in the PCI group. In addition, the rate of acute myocardial infarction (MI) was similar between the 2 groups, but the rate of spontaneous MI was lower in the PCI group compared to the OMT group (5.2% vs 9.3%) as 40% of MI cases in the PCI group were periprocedural MIs. The correlation between periprocedural MI and long-term outcomes has been modest compared to spontaneous MI. Moreover, with the longer follow-up, the number of spontaneous MI cases is expected to rise while the number of periprocedural MI cases is not. Extending the follow-up period is also important, as the STICH extension trial showed a statistically significant difference at 10-year follow up despite negative results at the time of the original publication.
Fourth, the REVIVED trial randomized a significantly lower number of patients compared to the STICH trial, and the authors reported fewer primary-outcome events than the estimated number needed to achieve the power to assess the primary hypothesis. In addition, significant improvements in medical treatment for heart failure with reduced ejection fraction since the STICH trial make comparison of PCI vs CABG in this patient population unfeasible.
Finally, although severe angina was not an exclusion criterion, two-thirds of the patients enrolled had no angina, and only 2% of the patients had baseline severe angina. This is important to consider when interpreting the results of the patient-reported health status as previous studies have shown that patients with worse angina at baseline derive the largest improvement in their QOL,10,11 and symptom improvement is the main indication for PCI in patients with stable ischemic heart disease.
Applications for Clinical Practice and System Implementation
In patients with severe left ventricular systolic dysfunction and multivessel stable ischemic heart disease who are well compensated and have little or no angina at baseline, OMT alone as an initial strategy may be considered against the addition of PCI after careful risk and benefit discussion. Further details about revascularization and extended follow-up data from the REVIVED trial are necessary.
Practice Points
- Patients with ischemic cardiomyopathy with reduced ejection fraction have been an understudied population in previous studies.
- Further studies are necessary to understand the benefits of revascularization and the role of viability testing in this population.
– Taishi Hirai MD, and Ziad Sayed Ahmad, MD
University of Missouri, Columbia, MO
1. Nowbar AN, Gitto M, Howard JP, et al. Mortality from ischemic heart disease. Circ Cardiovasc Qual Outcomes. 2019;12(6):e005375. doi:10.1161/CIRCOUTCOMES
2. Velazquez EJ, Lee KL, Deja MA, et al; for the STICH Investigators. Coronary-artery bypass surgery in patients with left ventricular dysfunction. N Engl J Med. 2011;364(17):1607-1616. doi:10.1056/NEJMoa1100356
3. Velazquez EJ, Lee KL, Jones RH, et al. Coronary-artery bypass surgery in patients with ischemic cardiomyopathy. N Engl J Med. 2016;374(16):1511-1520. doi:10.1056/NEJMoa1602001
4. Lawton JS, Tamis-Holland JE, Bangalore S, et al. 2021 ACC/AHA/SCAI guideline for coronary artery revascularization: a report of the American College of Cardiology/American Heart Association Joint Committee on Clinical Practice Guidelines. J Am Coll Cardiol. 2022;79(2):e21-e129. doi:10.1016/j.jacc.2021.09.006
5. Kirtane AJ, Doshi D, Leon MB, et al. Treatment of higher-risk patients with an indication for revascularization: evolution within the field of contemporary percutaneous coronary intervention. Circulation. 2016;134(5):422-431. doi:10.1161/CIRCULATIONAHA
6. Perera D, Clayton T, O’Kane PD, et al. Percutaneous revascularization for ischemic left ventricular dysfunction. N Engl J Med. 2022;387(15):1351-1360. doi:10.1056/NEJMoa2206606
7. Maron DJ, Hochman JS, Reynolds HR, et al. Initial invasive or conservative strategy for stable coronary disease. Circulation. 2020;142(18):1725-1735. doi:10.1161/CIRCULATIONAHA
8. De Bruyne B, Pijls NH, Kalesan B, et al. Fractional flow reserve-guided PCI versus medical therapy in stable coronary disease. N Engl J Med. 2012;367(11):991-1001. doi:10.1056/NEJMoa1205361
9. Zhang J, Gao X, Kan J, et al. Intravascular ultrasound versus angiography-guided drug-eluting stent implantation: The ULTIMATE trial. J Am Coll Cardiol. 2018;72(24):3126-3137. doi:10.1016/j.jacc.2018.09.013
10. Spertus JA, Jones PG, Maron DJ, et al. Health-status outcomes with invasive or conservative care in coronary disease. N Engl J Med. 2020;382(15):1408-1419. doi:10.1056/NEJMoa1916370
11. Hirai T, Grantham JA, Sapontis J, et al. Quality of life changes after chronic total occlusion angioplasty in patients with baseline refractory angina. Circ Cardiovasc Interv. 2019;12:e007558. doi:10.1161/CIRCINTERVENTIONS.118.007558